SunTrust Banks — Goldman Sachs Financial Services Conference 2014
20 slides from SunTrust Banks's conference presentation, Dec 9, 2014
Slide 1: Goldman Sachs Financial Services Conference
Goldman Sachs Financial Services Conference William H. Rogers, Jr., Chairman and Chief Executive Officer, SunTrust Banks, Inc. December 9, 2014
Slide 2: Forward-looking statements and non-GAAP notice
2 The following should be read in conjunction with the financial statements, notes and other information contained in the Company’s 2013 Annual Report on Form 10-K, Quarterly Reports on Form 10-Q, and Current Reports on Form 8-K. This presentation includes non-GAAP financial measures to describe Sun
Slide 3: Investment Thesis
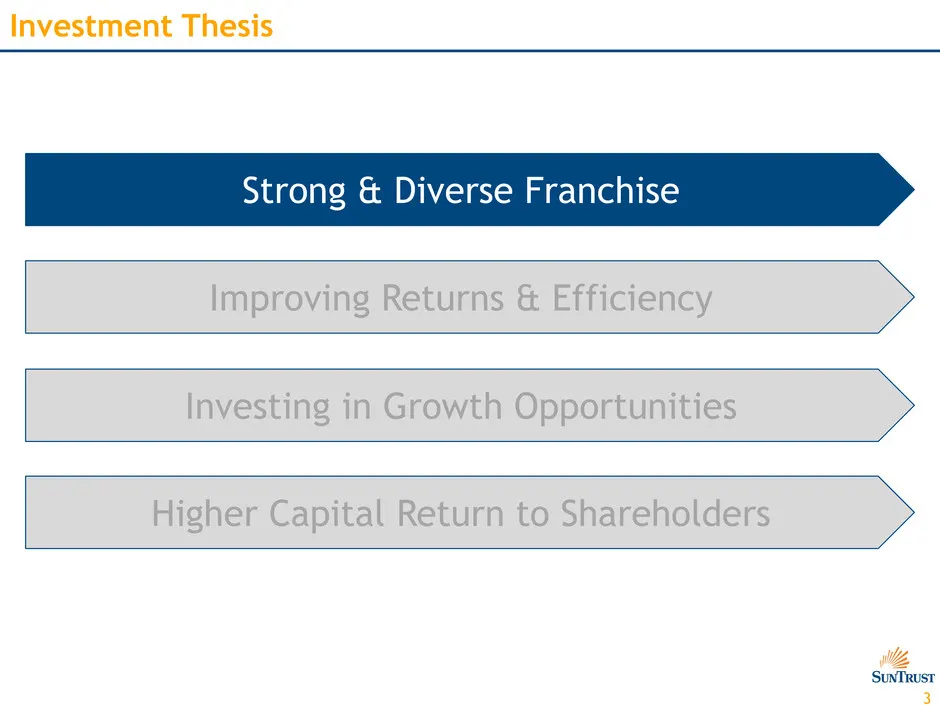
3 Investment Thesis Improving Returns & Efficiency Investing in Growth Opportunities Strong & Diverse Franchise Higher Capital Return to Shareholders
Slide 4: Franchise Overview: Who is SunTrust?
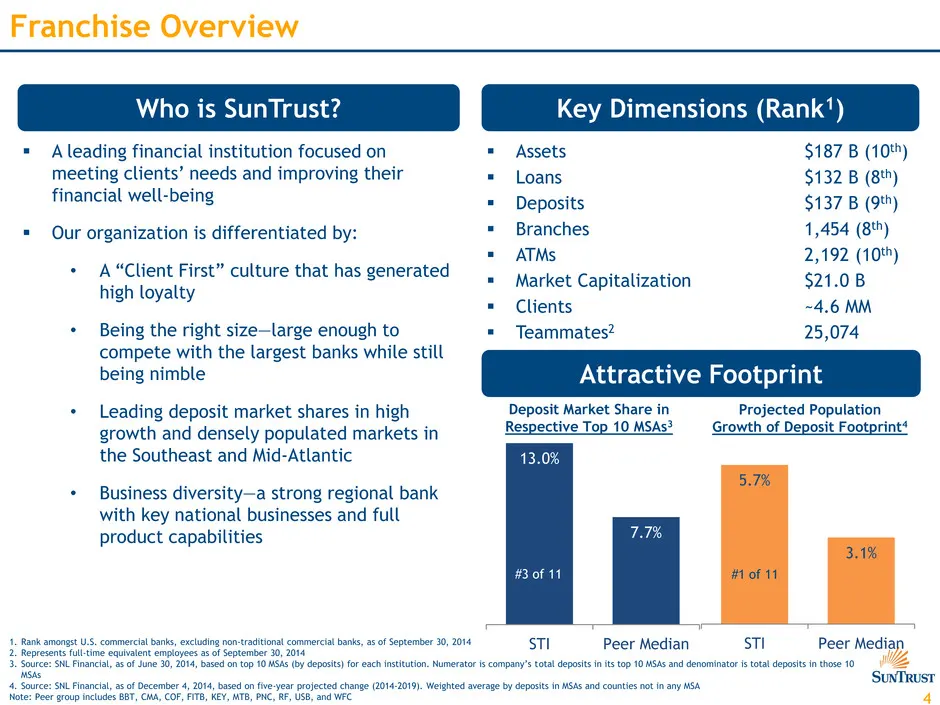
4 5.7% 3.1% STI Peer Median 13.0% 7.7% STI Peer Median Franchise Overview Who is SunTrust? Key Dimensions (Rank1) A leading financial institution focused on meeting clients’ needs and improving their financial well-being Our organization is differentiated by: • A “Client First” culture that has
Slide 5: Diverse Business Mix
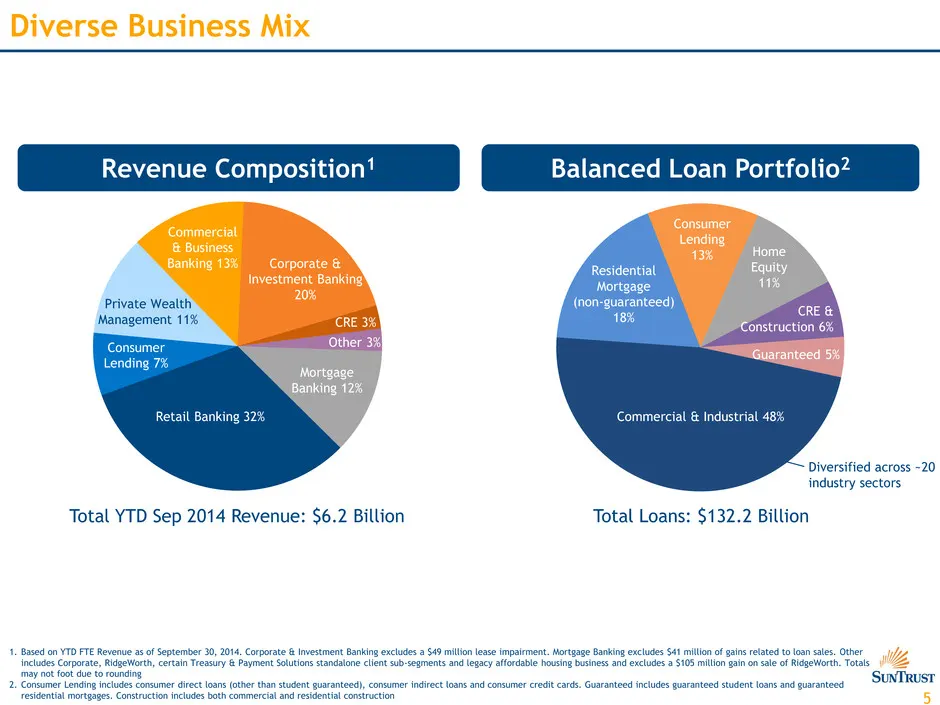
5 Diverse Business Mix 1. Based on YTD FTE Revenue as of September 30, 2014. Corporate & Investment Banking excludes a $49 million lease impairment. Mortgage Banking excludes $41 million of gains related to loan sales. Other includes Corporate, RidgeWorth, certain Treasury & Payment Solutions standa
Slide 6: Business Segment Overview
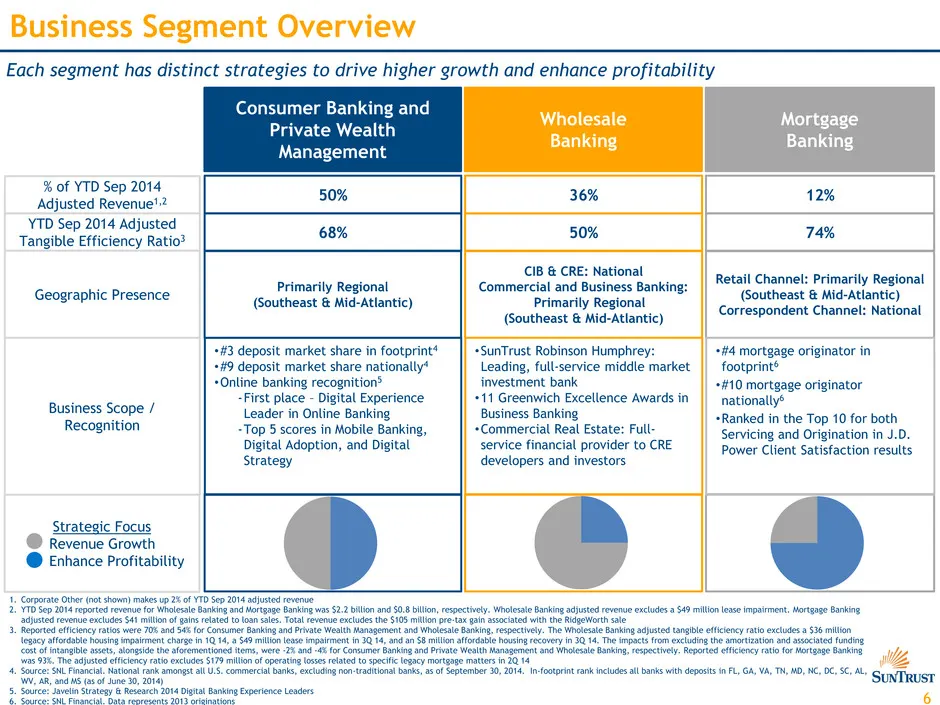
6 Business Segment Overview Wholesale Banking Consumer Banking and Private Wealth Management Mortgage Banking 50% % of YTD Sep 2014 Adjusted Revenue1,2 Strategic Focus Revenue Growth Enhance Profitability Business Scope / Recognition 1. Corporate Other (not shown) makes up 2% of YTD Sep 2014 adjuste
Slide 7: Investment Thesis
7 Investment Thesis Improving Returns & Efficiency Investing in Growth Opportunities Strong & Diverse Franchise Higher Capital Return to Shareholders
Slide 8: Solid Progress on Key Fronts
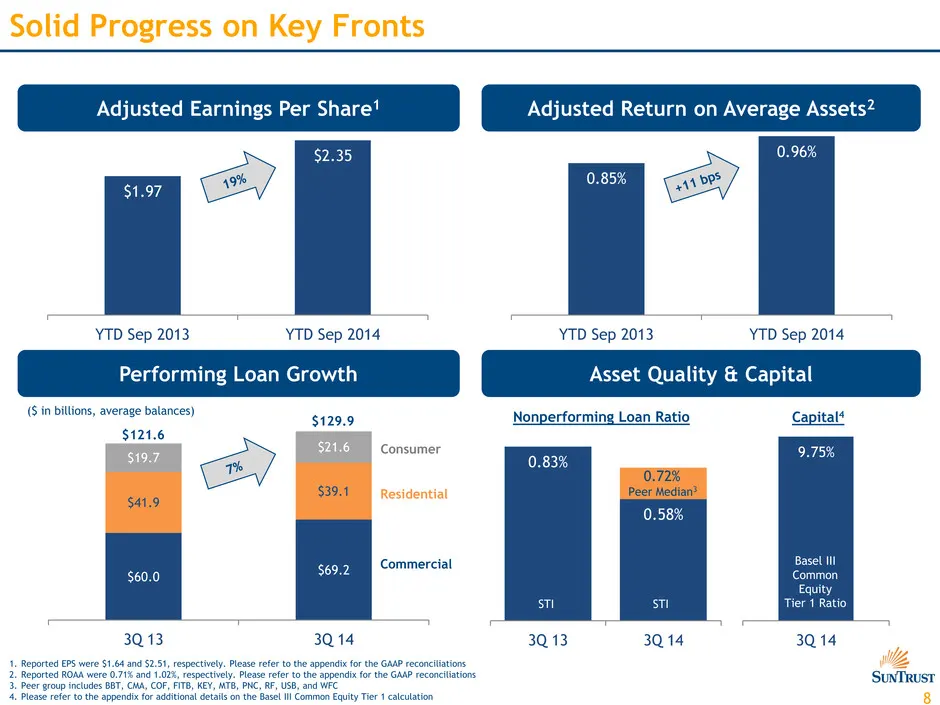
8 0.83% 0.58% 3Q 13 3Q 143Q 14 $60.0 $69.2 $41.9 $39.1 $19.7 $21.6 3Q 13 3Q 14 Solid Progress on Key Fronts Adjusted Earnings Per Share1 Asset Quality & Capital Adjusted Return on Average Assets2 Performing Loan Growth $121.6 $129.9 ($ in billions, average balances) 1. Reported EPS were $1.64 and $2
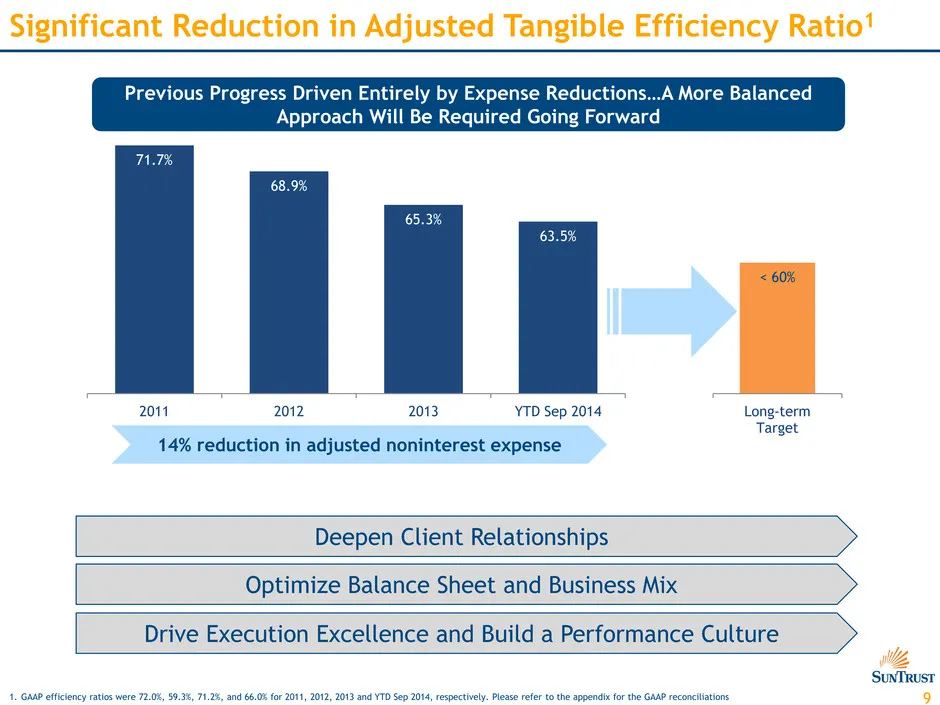
Slide 9: Significant Reduction in Adjusted Tangible Efficiency Ratio
9 14% reduction in adjusted noninterest expense Significant Reduction in Adjusted Tangible Efficiency Ratio1 1. GAAP efficiency ratios were 72.0%, 59.3%, 71.2%, and 66.0% for 2011, 2012, 2013 and YTD Sep 2014, respectively. Please refer to the appendix for the GAAP reconciliations Deepen Client Rela
Slide 10: Investment Thesis
10 Investment Thesis Improving Returns & Efficiency Investing in Growth Opportunities Strong & Diverse Franchise Higher Capital Return to Shareholders
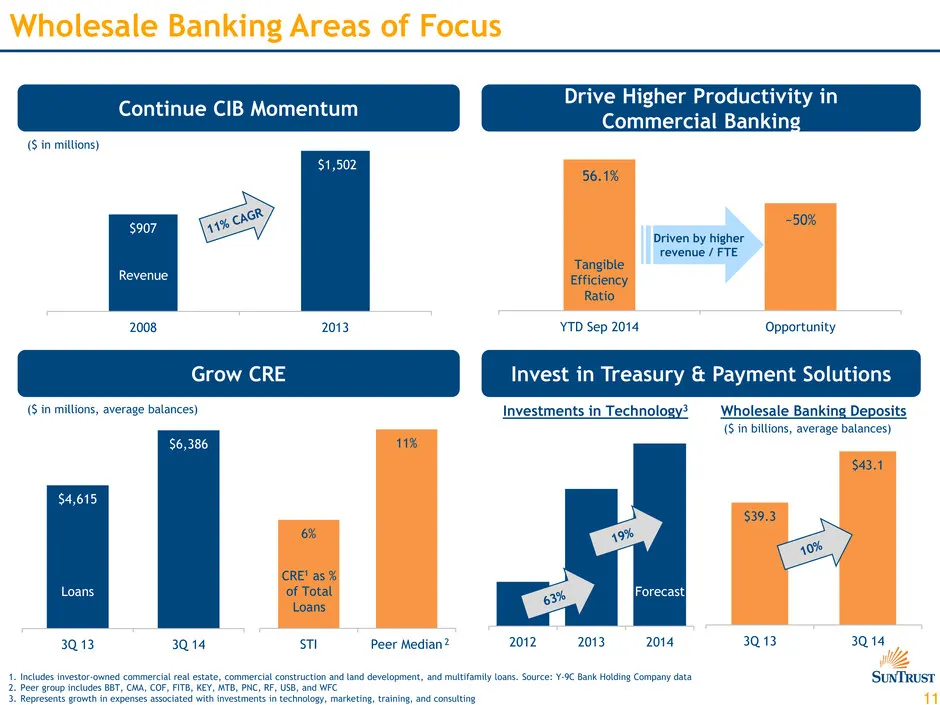
Slide 11: Wholesale Banking Areas of Focus
11 $907 2008 2013 YTD Sep 2014 Opportunity 6% 11% STI Peer Median $39.3 $43.1 3Q 13 3Q 14 $4,615 $6,386 3Q 13 3Q 14 Wholesale Banking Areas of Focus 1. Includes investor-owned commercial real estate, commercial construction and land development, and multifamily loans. Source: Y-9C Bank Holding Compa
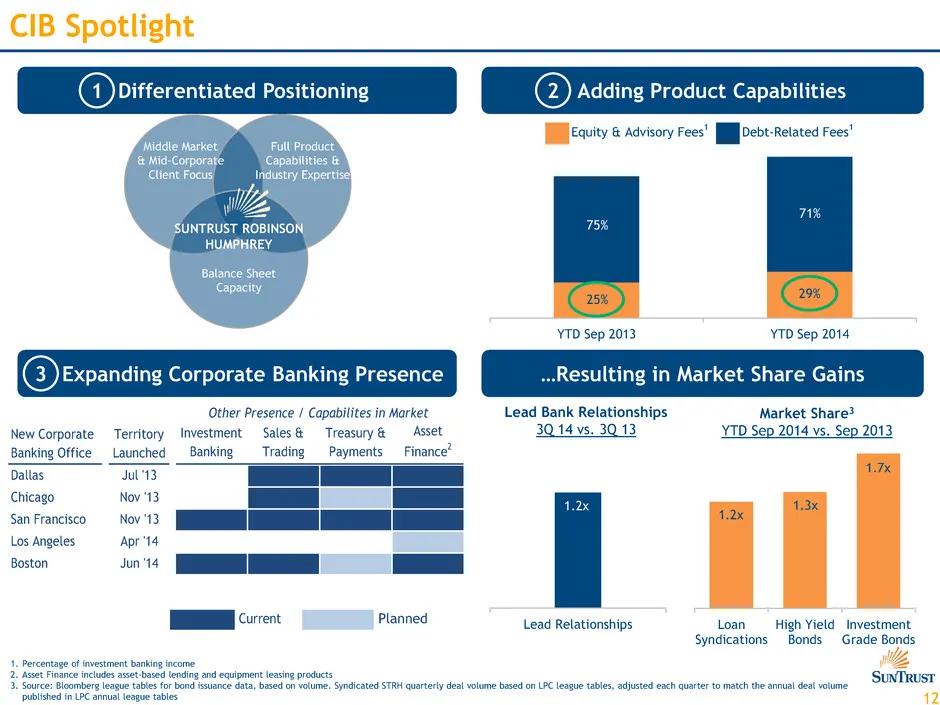
Slide 12: CIB Spotlight
12 Loan Syndications High Yield Bonds Investment Grade Bonds Differentiated Positioning Middle Market & Mid-Corporate Client Focus Full Product Capabilities & Industry Expertise Balance Sheet Capacity …Resulting in Market Share Gains CIB Spotlight 1. Percentage of investment banking income 2. Asset
Slide 13: Consumer Banking and Private Wealth Management Areas of Focus
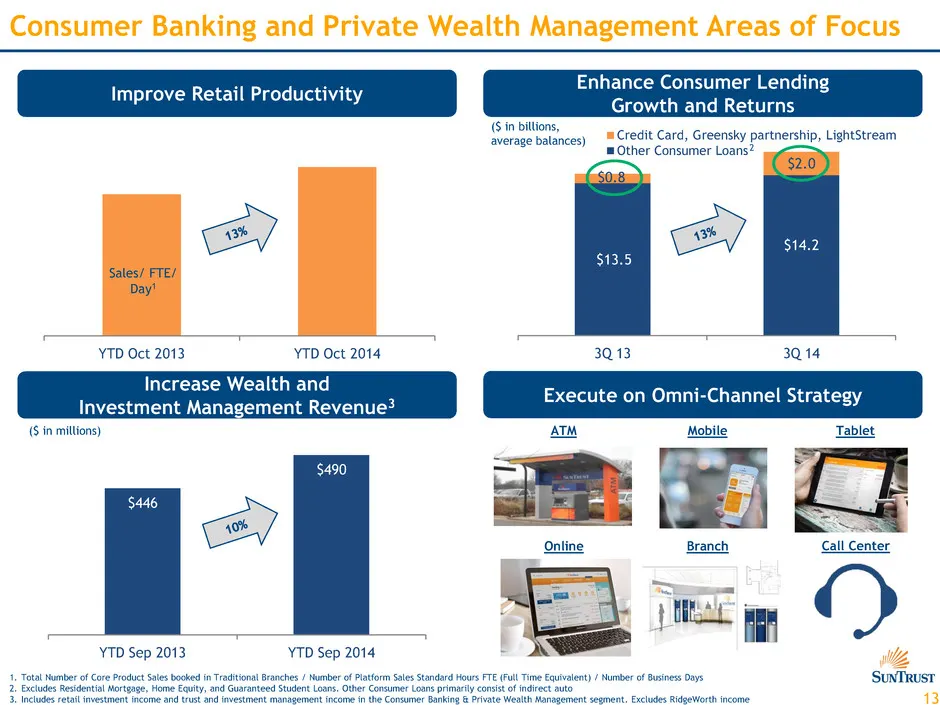
13 $13.5 $14.2 $0.8 $2.0 3Q 13 3Q 14 Credit Card, Greensky partnership, LightStream Other Consumer Loans YTD Oct 2013 YTD Oct 2014 Consumer Banking and Private Wealth Management Areas of Focus Execute on Omni-Channel Strategy Improve Retail Productivity Enhance Consumer Lending Growth and Returns AT
Slide 14: Omni-Channel & Digital Spotlight
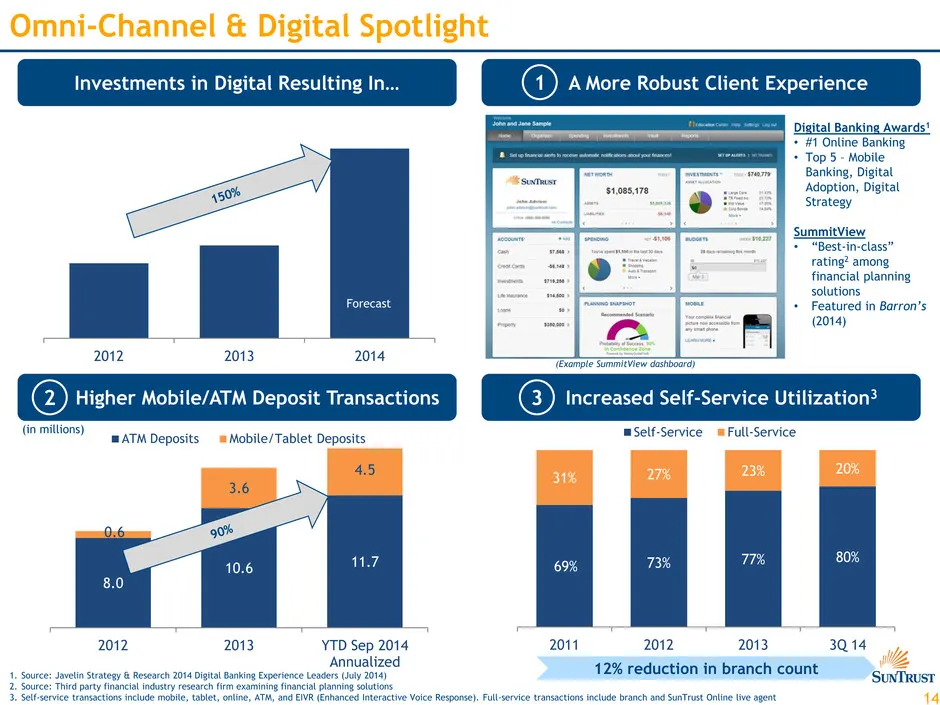
14 8.0 10.6 11.7 0.6 3.6 4.5 2012 2013 YTD Sep 2014 Annualized ATM Deposits Mobile/Tablet Deposits 2012 2013 2014 69% 73% 77% 80% 31% 27% 23% 20% 2011 2012 2013 3Q 14 Self-Service Full-Service Omni-Channel & Digital Spotlight Investments in Digital Resulting In… A More Robust Client Experience Highe
Slide 15: Mortgage Banking Areas of Focus
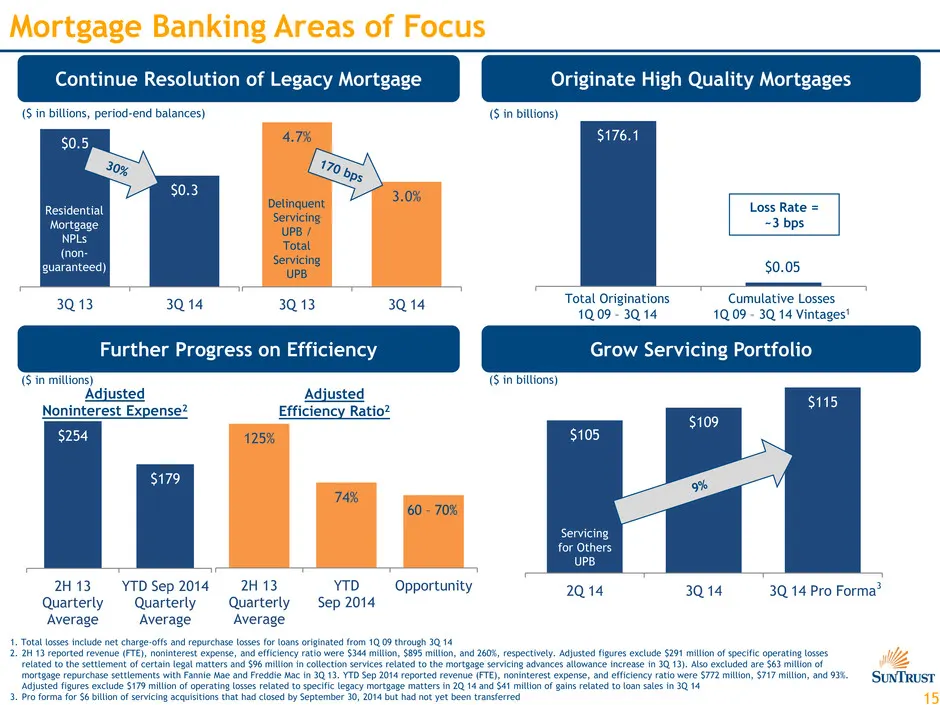
15 125% 74% 2H 13 Quarterly Average YTD Sep 2014 Opportunity $105 $109 $115 2Q 14 3Q 14 3Q 14 Pro Forma $176.1 4.7% 3.0% 3Q 13 3Q 14 $0.5 $0.3 3Q 13 3Q 14 Mortgage Banking Areas of Focus ($ in billions) Residential Mortgage NPLs (non- guaranteed) Loss Rate = ~3 bps 1. Total losses include net charge
Slide 16: Investment Thesis
16 Investment Thesis Improving Returns & Efficiency Investing in Growth Opportunities Strong & Diverse Franchise Higher Capital Return to Shareholders

Slide 17: Appendix
Appendix
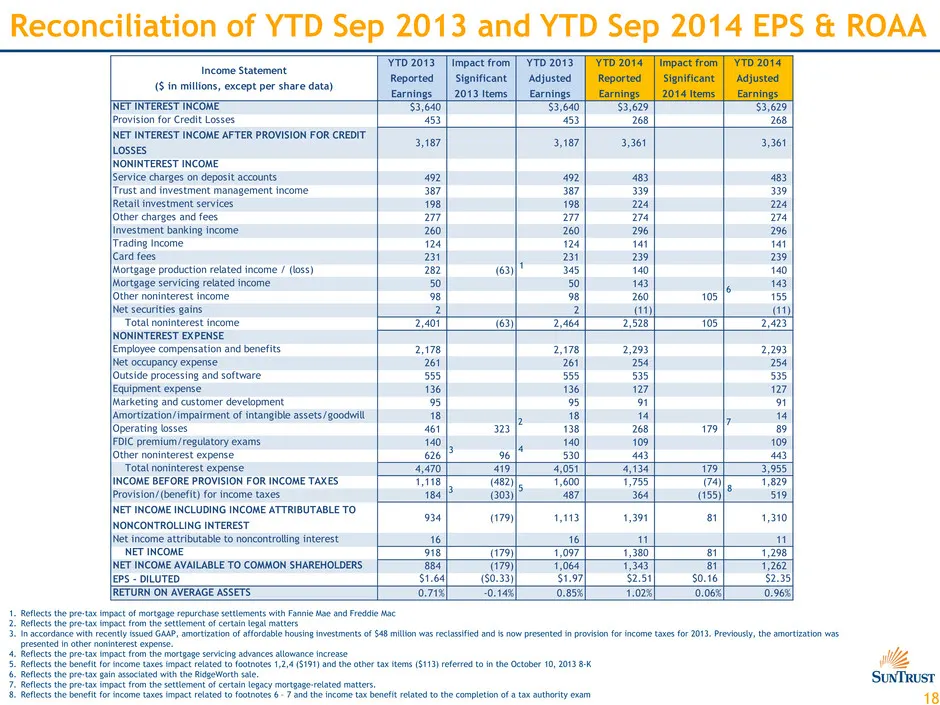
Slide 18: Income Statement
18 Income Statement ($ in millions, except per share data) YTD 2013 Reported Earnings Impact from Significant 2013 Items YTD 2013 Adjusted Earnings YTD 2014 Reported Earnings Impact from Significant 2014 Items YTD 2014 Adjusted Earnings NET INTEREST INCOME $3,640 $3,640 $3,629 $3,629 Provision for C
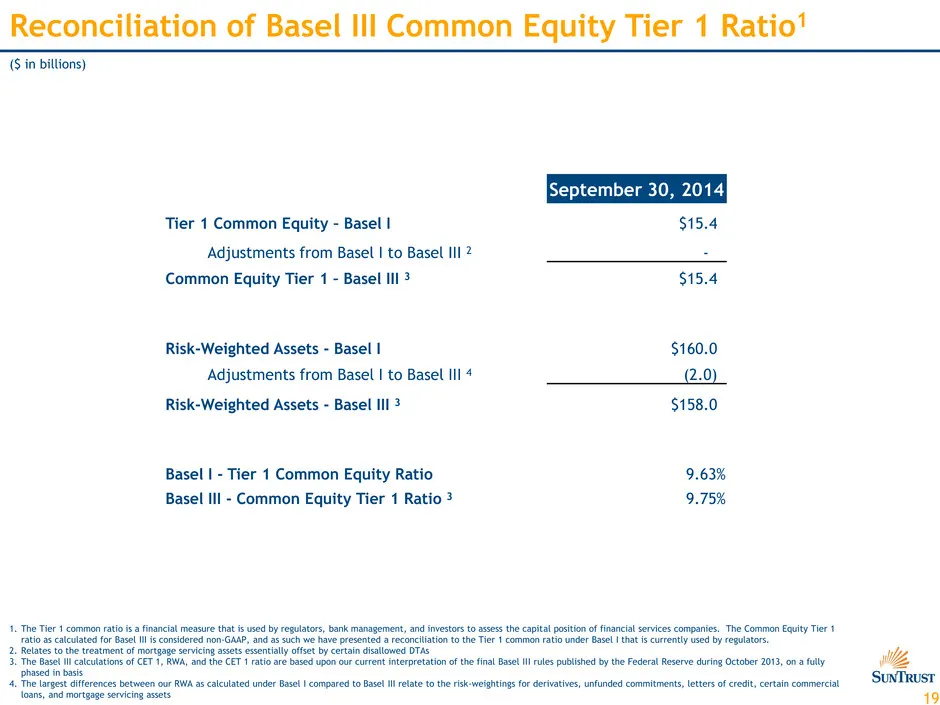
Slide 19: Reconciliation of Basel III Common Equity Tier 1 Ratio
19 Reconciliation of Basel III Common Equity Tier 1 Ratio1 ($ in billions) September 30, 2014 Tier 1 Common Equity – Basel I $15.4 Adjustments from Basel I to Basel III 2 - Common Equity Tier 1 – Basel III 3 $15.4 Risk-Weighted Assets - Basel I $160.0 Adjustments from Basel I to Basel III 4 (2.0) Ri
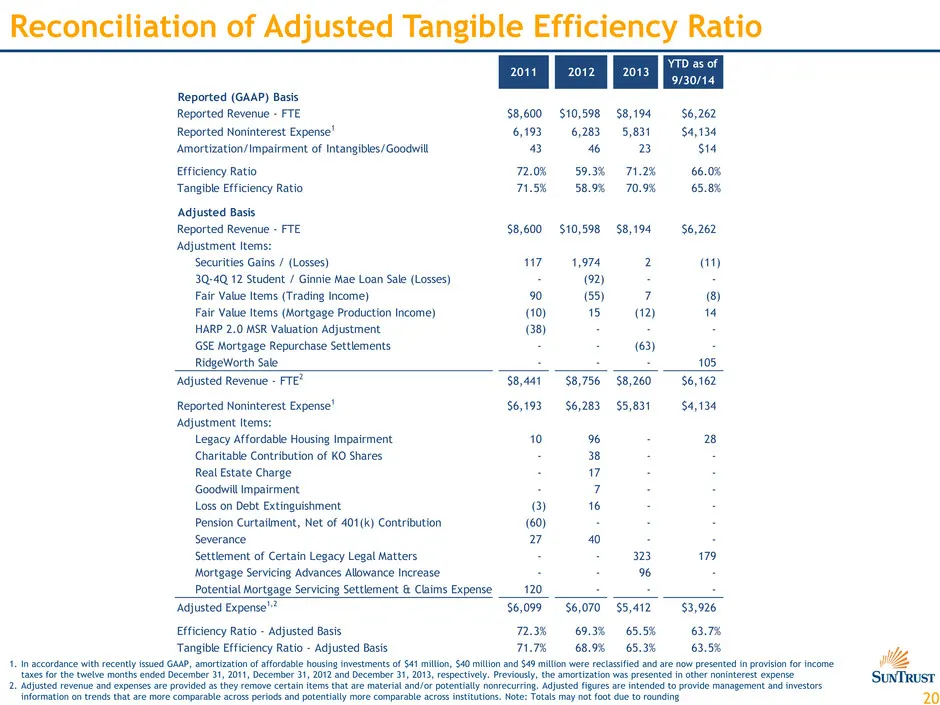
Slide 20: Reconciliation of Adjusted Tangible Efficiency Ratio
20 Reconciliation of Adjusted Tangible Efficiency Ratio 1. In accordance with recently issued GAAP, amortization of affordable housing investments of $41 million, $40 million and $49 million were reclassified and are now presented in provision for income taxes for the twelve months ended December 31
Source: SEC EDGAR · 8-K filed Dec 9, 2014
More decks from SunTrust Banks Inc
 Q3 2019 Earnings Presentation21 slides · Oct 17, 2019
 Q2 2019 Earnings Presentation22 slides · Jul 18, 2019
 Q1 2019 Earnings Presentation22 slides · Apr 18, 2019
 Merger or Acquisition (February 2019)38 slides · Feb 7, 2019
 Q4 2018 Earnings Presentation23 slides · Jan 18, 2019
 2018 Goldman Sachs US Financial Services Conference30 slides · Dec 4, 2018