Tellurian — Credit Suisse 23rd Annual Energy Summit 2018
31 slides from Tellurian's conference presentation, Feb 14, 2018
Slide 1: Corporate presentation
Corporate presentation Meg Gentle, CEO Credit Suisse 23rd Annual Energy Summit Vail, Colorado February 14, 2018 Exhibit 99.1
Slide 2: Cautionary statements
Cautionary statements Forward-looking statements fon in thi i * within the meaning of Section 274, iies Act of 1933, \ded, fie Act OF1934, 05 ome sssume, “plan, ‘estimate,” “expect, “should,” “wil,” “would,” and nde‘ slotements, The words ‘anticipate’ “forecast, tend,” "may, the projects, ‘According
Slide 3: Strategy: Building a low-cost, global natural gas company
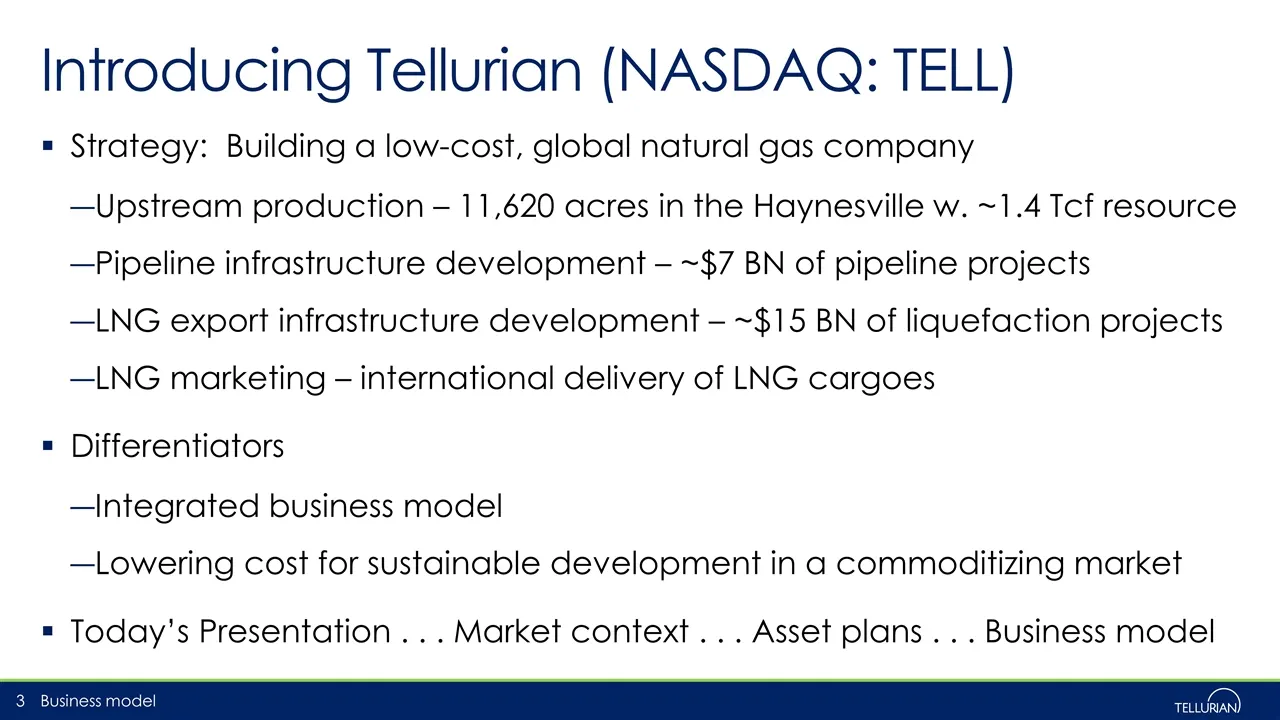
Strategy: Building a low-cost, global natural gas company Upstream production – 11,620 acres in the Haynesville w. ~1.4 Tcf resource Pipeline infrastructure development – ~$7 BN of pipeline projects LNG export infrastructure development – ~$15 BN of liquefaction projects LNG marketing – internationa
Slide 4: Global LNG market is commoditizing
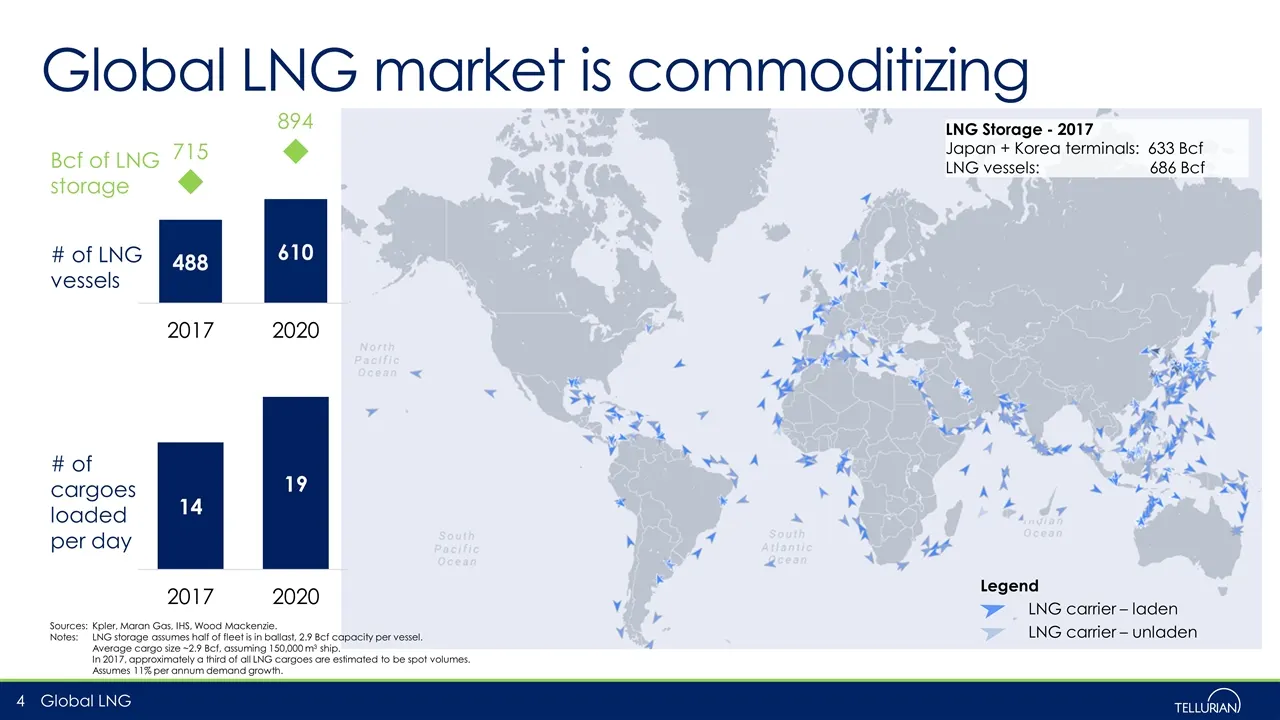
Sources:Kpler, Maran Gas, IHS, Wood Mackenzie. Notes: LNG storage assumes half of fleet is in ballast, 2.9 Bcf capacity per vessel. Average cargo size ~2.9 Bcf, assuming 150,000 m3 ship. In 2017, approximately a third of all LNG cargoes are estimated to be spot volumes. Assumes 11% per annum demand
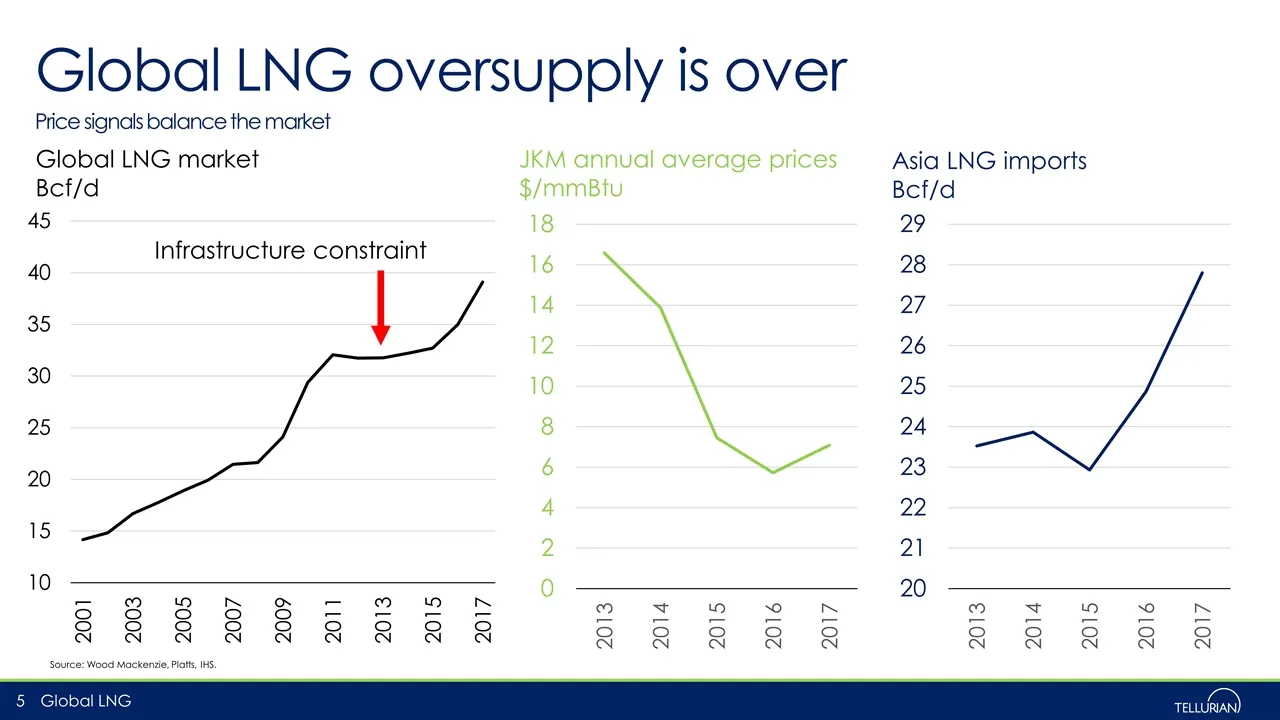
Slide 5: Global LNG oversupply is over
Global LNG oversupply is over Global LNG Asia LNG imports Bcf/d JKM annual average prices $/mmBtu Source: Wood Mackenzie, Platts, IHS. Price signals balance the market Global LNG market Bcf/d Infrastructure constraint
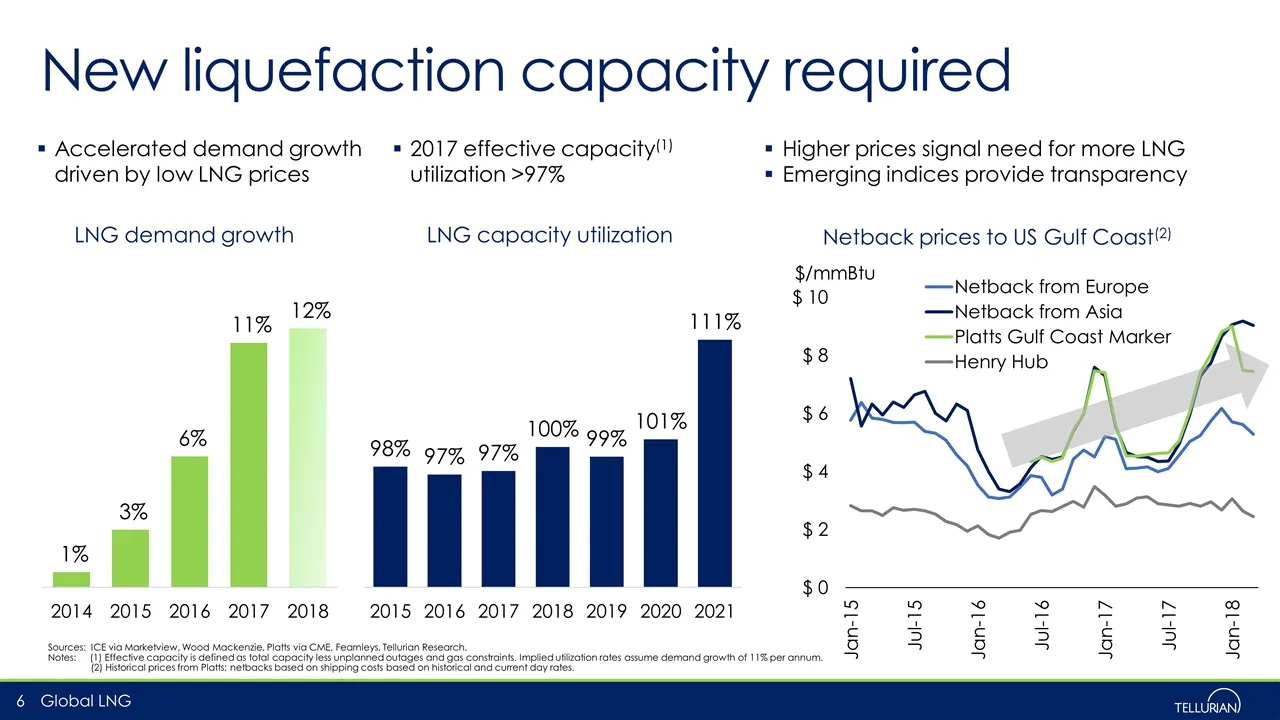
Slide 6: New liquefaction capacity required
Netback prices to US Gulf Coast(2) New liquefaction capacity required Sources: ICE via Marketview, Wood Mackenzie, Platts via CME, Fearnleys, Tellurian Research. Notes: (1) Effective capacity is defined as total capacity less unplanned outages and gas constraints. Implied utilization rates assume de
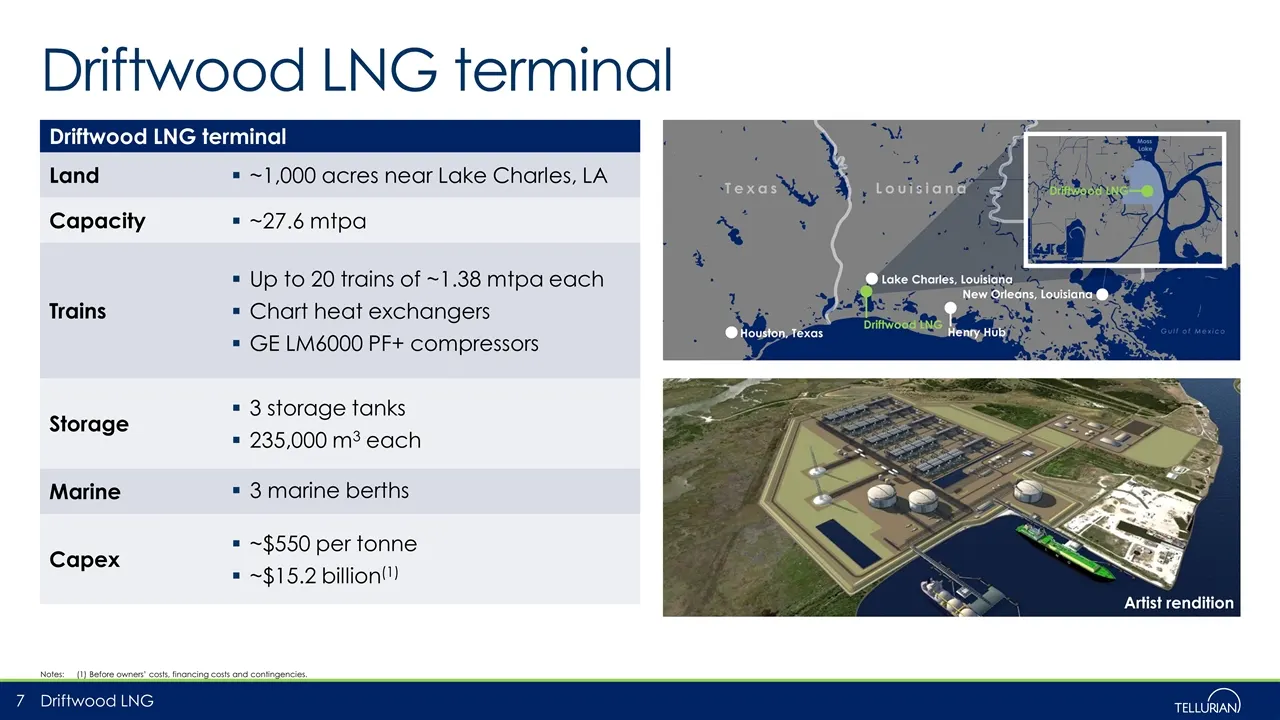
Slide 7: Driftwood LNG terminal
Driftwood LNG terminal Notes:(1) Before owners’ costs, financing costs and contingencies. Driftwood LNG terminal Land ~1,000 acres near Lake Charles, LA Capacity ~27.6 mtpa Trains Up to 20 trains of ~1.38 mtpa each Chart heat exchangers GE LM6000 PF+ compressors Storage 3 storage tanks 235,000 m3 ea
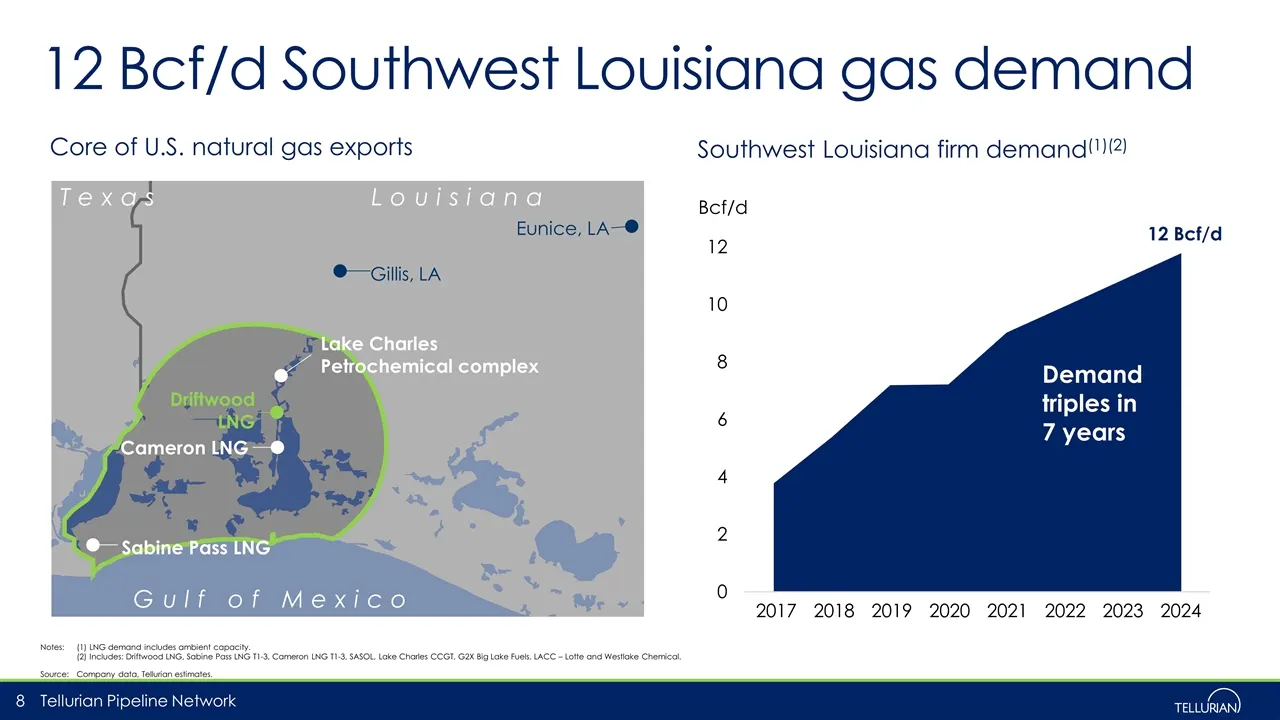
Slide 8: Core of U.S. natural gas exports
Notes:(1) LNG demand includes ambient capacity. (2) Includes: Driftwood LNG, Sabine Pass LNG T1-3, Cameron LNG T1-3, SASOL, Lake Charles CCGT, G2X Big Lake Fuels, LACC – Lotte and Westlake Chemical. Source:Company data, Tellurian estimates. Louisiana Texas Gulf of Mexico Lake Charles Petrochemical c
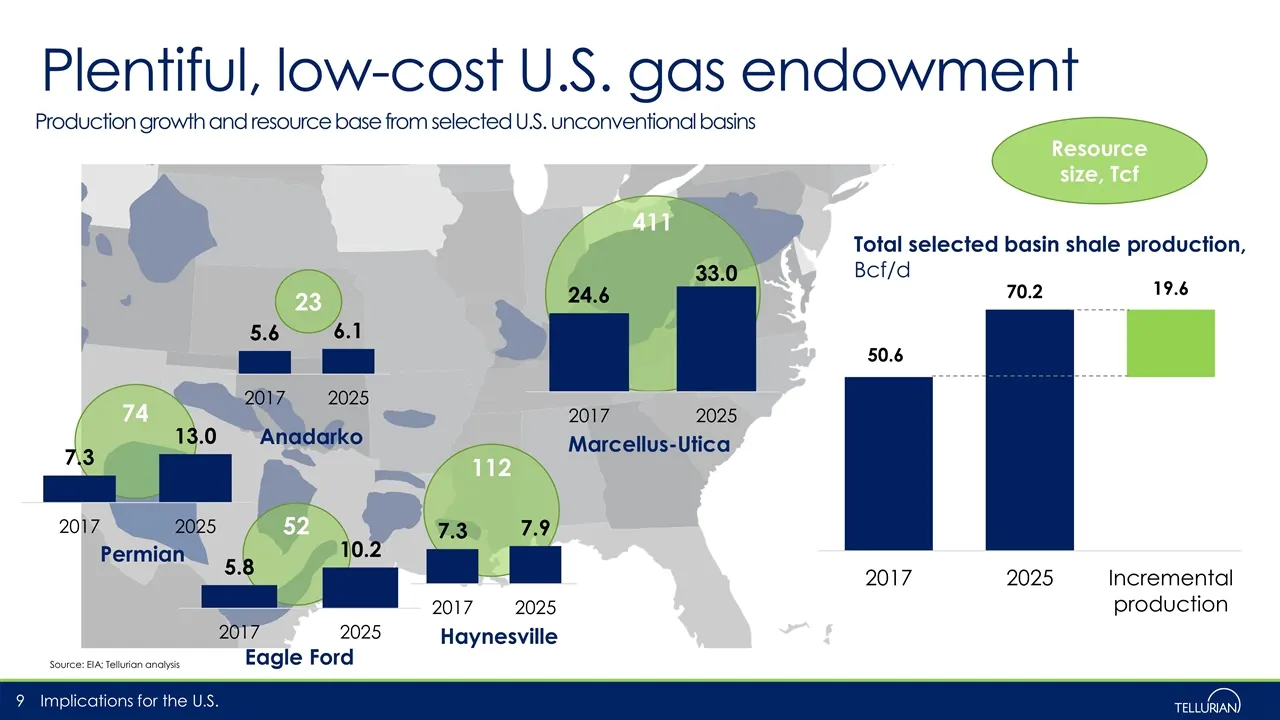
Slide 9: Plentiful, low-cost U.S. gas endowment
Plentiful, low-cost U.S. gas endowment Implications for the U.S. Production growth and resource base from selected U.S. unconventional basins Source: EIA; Tellurian analysis 411 112 74 23 52 Resource size, Tcf Marcellus-Utica Haynesville Eagle Ford Permian Anadarko Total selected basin shale product
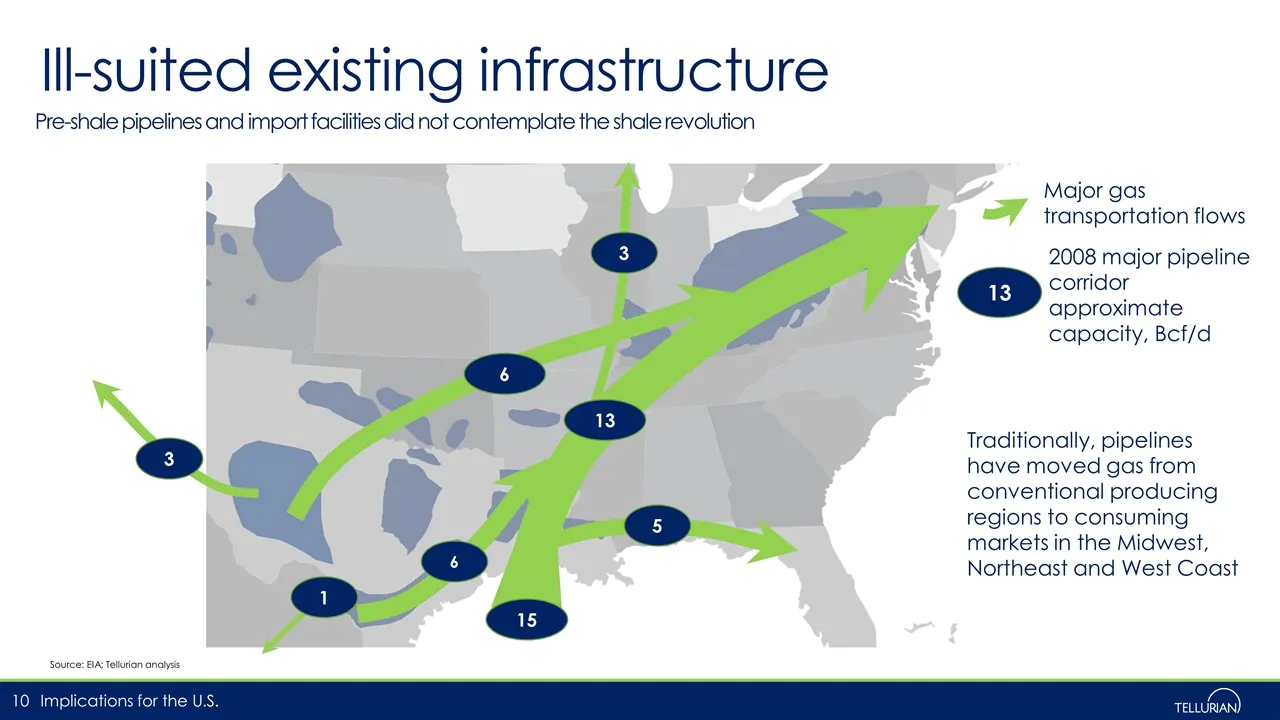
Slide 10: Ill-suited existing infrastructure
Ill-suited existing infrastructure Implications for the U.S. Pre-shale pipelines and import facilities did not contemplate the shale revolution Source: EIA; Tellurian analysis Traditionally, pipelines have moved gas from conventional producing regions to consuming markets in the Midwest, Northeast a
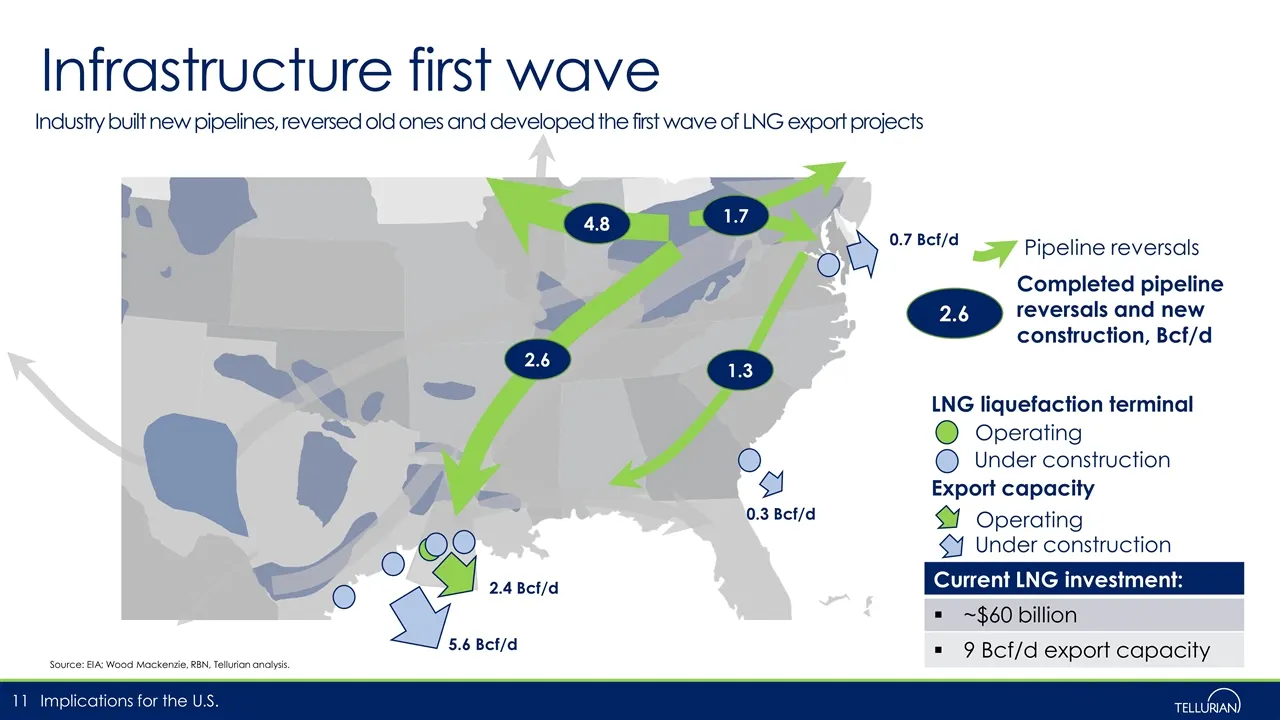
Slide 11: Infrastructure first wave
Infrastructure first wave Implications for the U.S. Industry built new pipelines, reversed old ones and developed the first wave of LNG export projects Source: EIA; Wood Mackenzie, RBN, Tellurian analysis. 0.3 Bcf/d 5.6 Bcf/d 2.4 Bcf/d 0.7 Bcf/d 1.7 Current LNG investment: ~$60 billion 9 Bcf/d expor
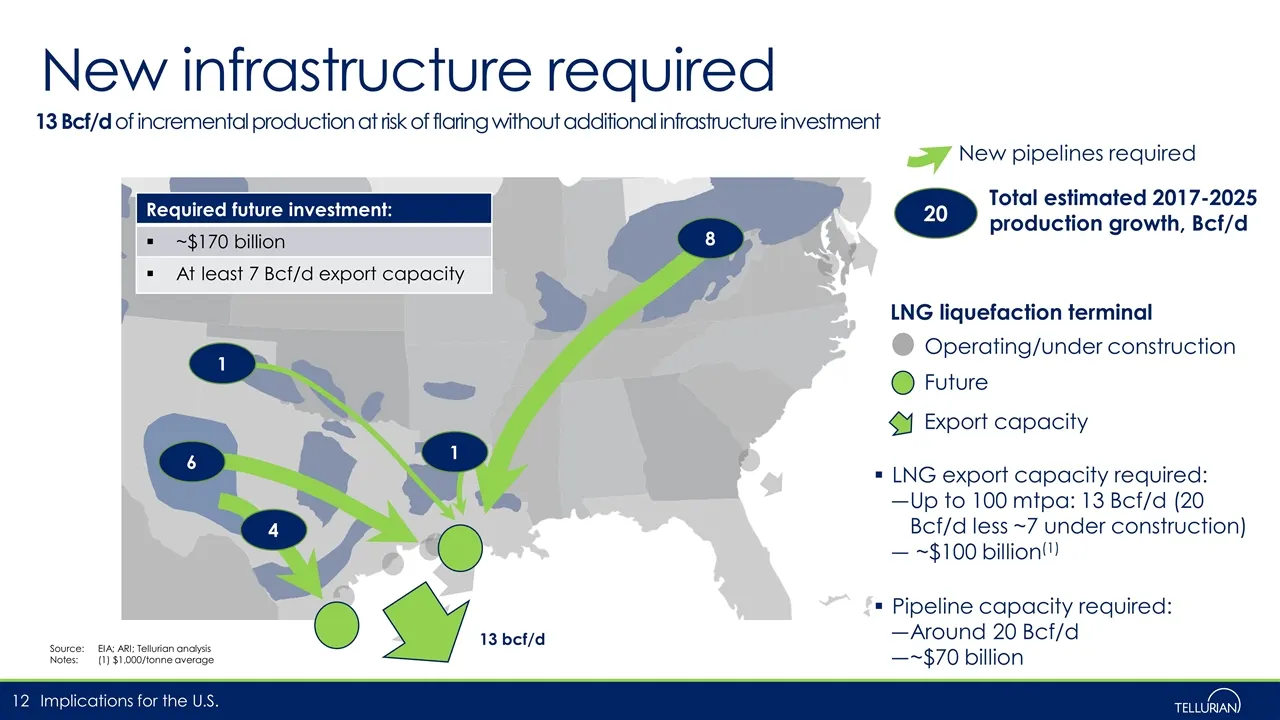
Slide 12: New infrastructure required
New infrastructure required Implications for the U.S. 13 Bcf/d of incremental production at risk of flaring without additional infrastructure investment Source: EIA; ARI; Tellurian analysis Notes: (1) $1,000/tonne average LNG export capacity required: Up to 100 mtpa: 13 Bcf/d (20 Bcf/d less ~7 under
Slide 13: Permian production outpacing pipelines
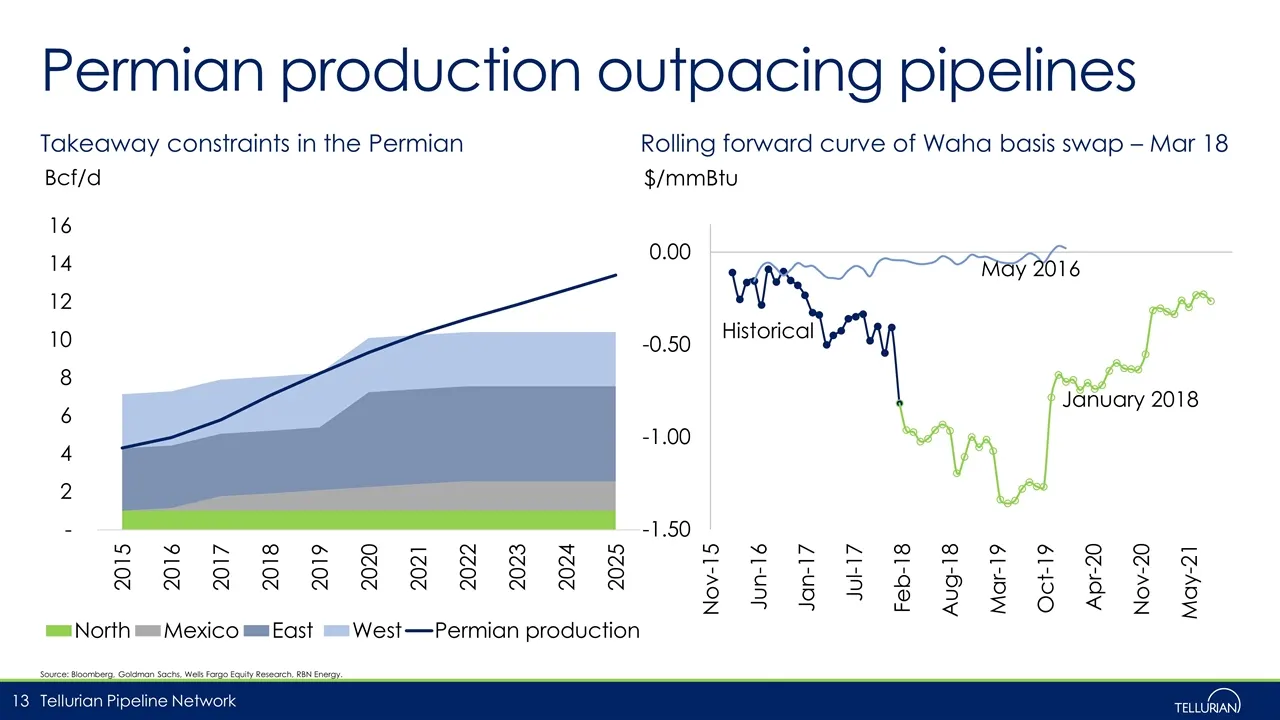
Permian production outpacing pipelines Tellurian Pipeline Network Takeaway constraints in the Permian Rolling forward curve of Waha basis swap – Mar 18 Source: Bloomberg, Goldman Sachs, Wells Fargo Equity Research, RBN Energy. Historical January 2018 May 2016
Slide 14: Tellurian Pipeline Network
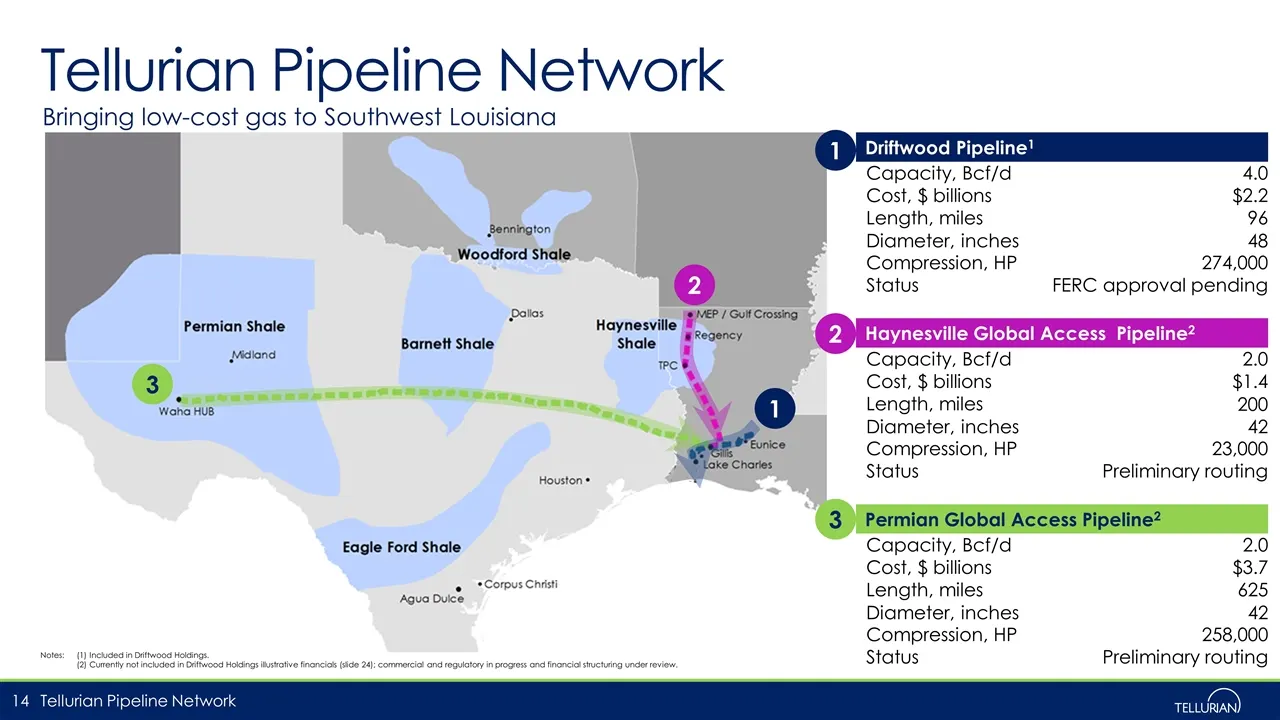
Tellurian Pipeline Network Notes: (1) Included in Driftwood Holdings. (2) Currently not included in Driftwood Holdings illustrative financials (slide 24); commercial and regulatory in progress and financial structuring under review. Tellurian Pipeline Network Driftwood Pipeline1 Capacity, Bcf/d 4.0
Slide 15: Tellurian will offer equity interest in Driftwood Holdings
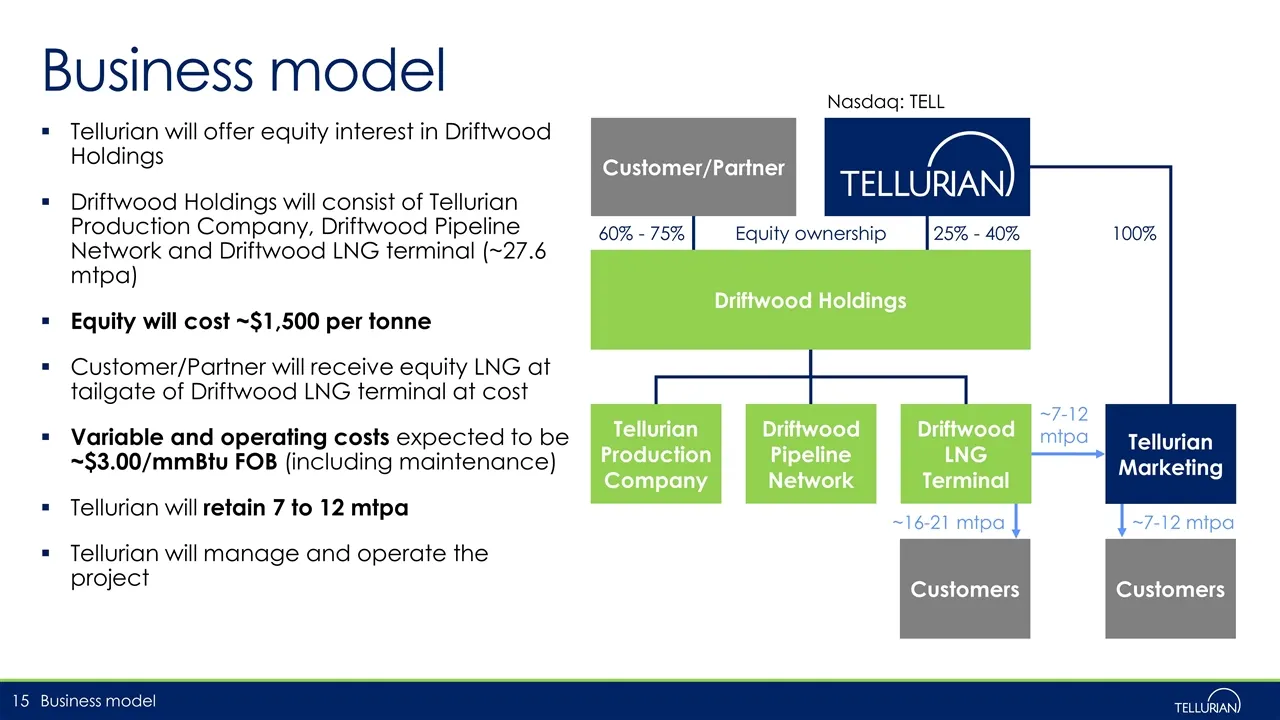
Tellurian will offer equity interest in Driftwood Holdings Driftwood Holdings will consist of Tellurian Production Company, Driftwood Pipeline Network and Driftwood LNG terminal (~27.6 mtpa) Equity will cost ~$1,500 per tonne Customer/Partner will receive equity LNG at tailgate of Driftwood LNG term
Slide 16: Total cost of ~$3/mmBtu locks in low cost of supply
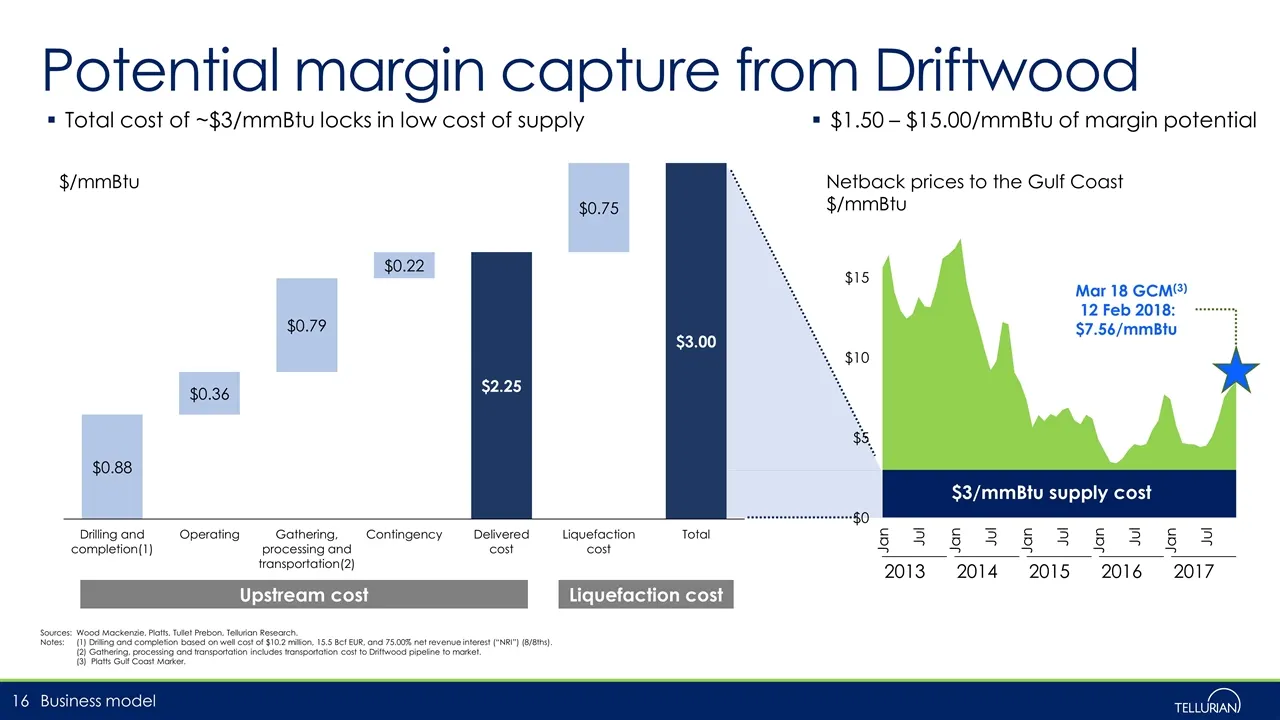
Total cost of ~$3/mmBtu locks in low cost of supply Potential margin capture from Driftwood Sources: Wood Mackenzie, Platts, Tullet Prebon, Tellurian Research. Notes: (1) Drilling and completion based on well cost of $10.2 million, 15.5 Bcf EUR, and 75.00% net revenue interest (“NRI”) (8/8ths). (2)
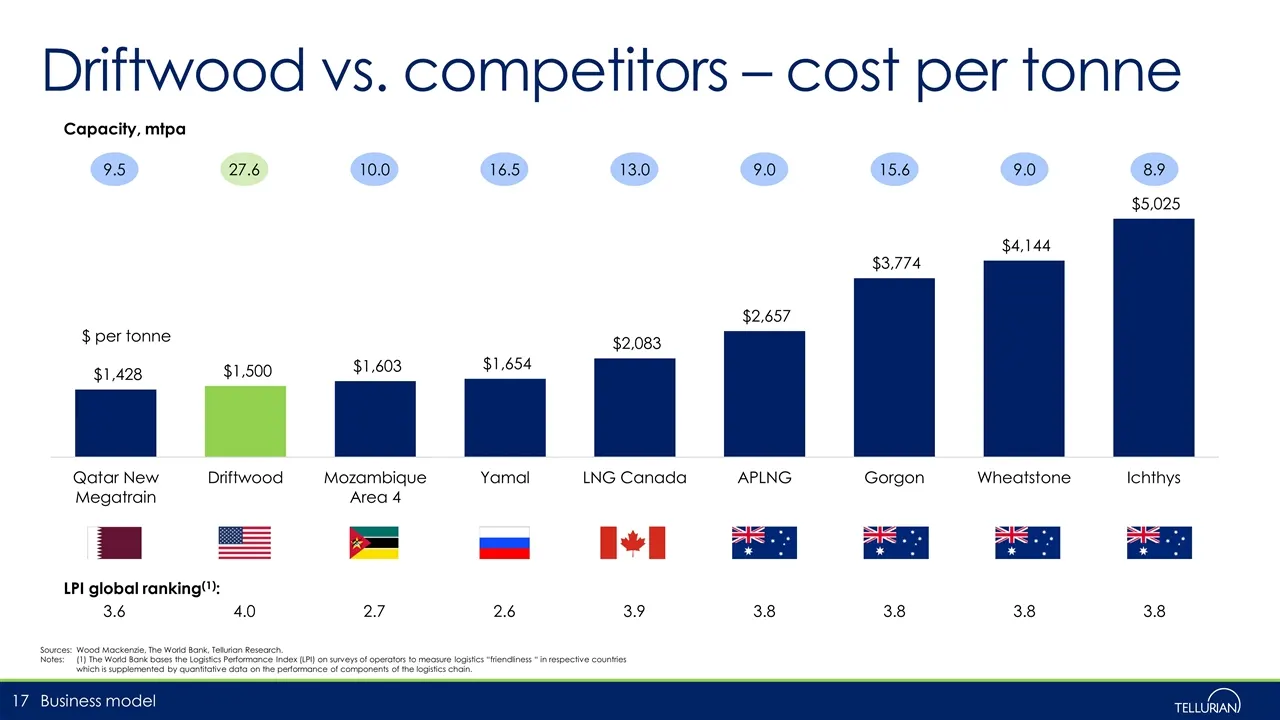
Slide 17: Driftwood vs. competitors – cost per tonne
Driftwood vs. competitors – cost per tonne Sources:Wood Mackenzie, The World Bank, Tellurian Research. Notes:(1) The World Bank bases the Logistics Performance Index (LPI) on surveys of operators to measure logistics “friendliness “ in respective countries which is supplemented by quantitative data
Slide 18: Catalysts
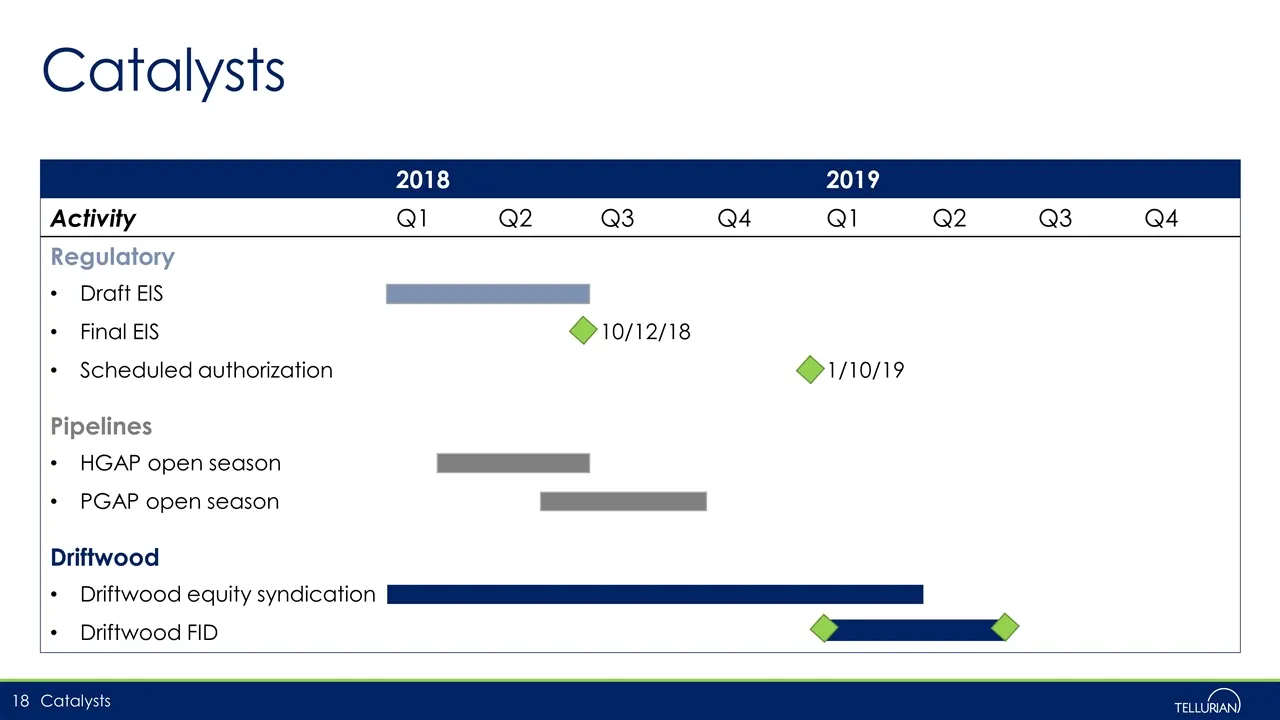
Catalysts Catalysts 2018 2019 Activity Q1 Q2 Q3 Q4 Q1 Q2 Q3 Q4 Regulatory Draft EIS Final EIS 10/12/18 Scheduled authorization 1/10/19 Pipelines HGAP open season PGAP open season Driftwood Driftwood equity syndication Driftwood FID
Slide 19: Conclusions
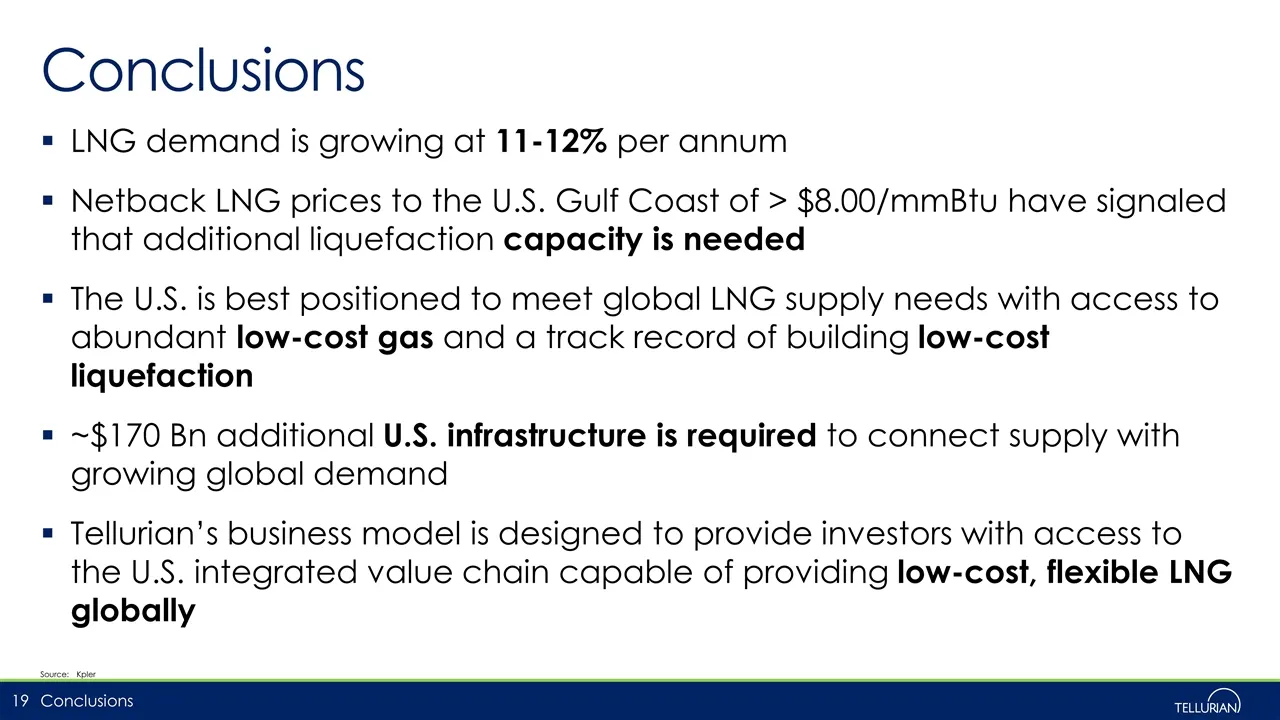
LNG demand is growing at 11-12% per annum Netback LNG prices to the U.S. Gulf Coast of > $8.00/mmBtu have signaled that additional liquefaction capacity is needed The U.S. is best positioned to meet global LNG supply needs with access to abundant low-cost gas and a track record of building low-cost

Slide 20: Contact us
Contact us Amit Marwaha Director, Investor Relations & Finance +1 832 485 2004 [email protected] Joi Lecznar SVP, Public Affairs & Communication +1 832 962 4044 [email protected] @TellurianLNG Contacts
Slide 21: 2017 Additional detail
2017 Additional detail
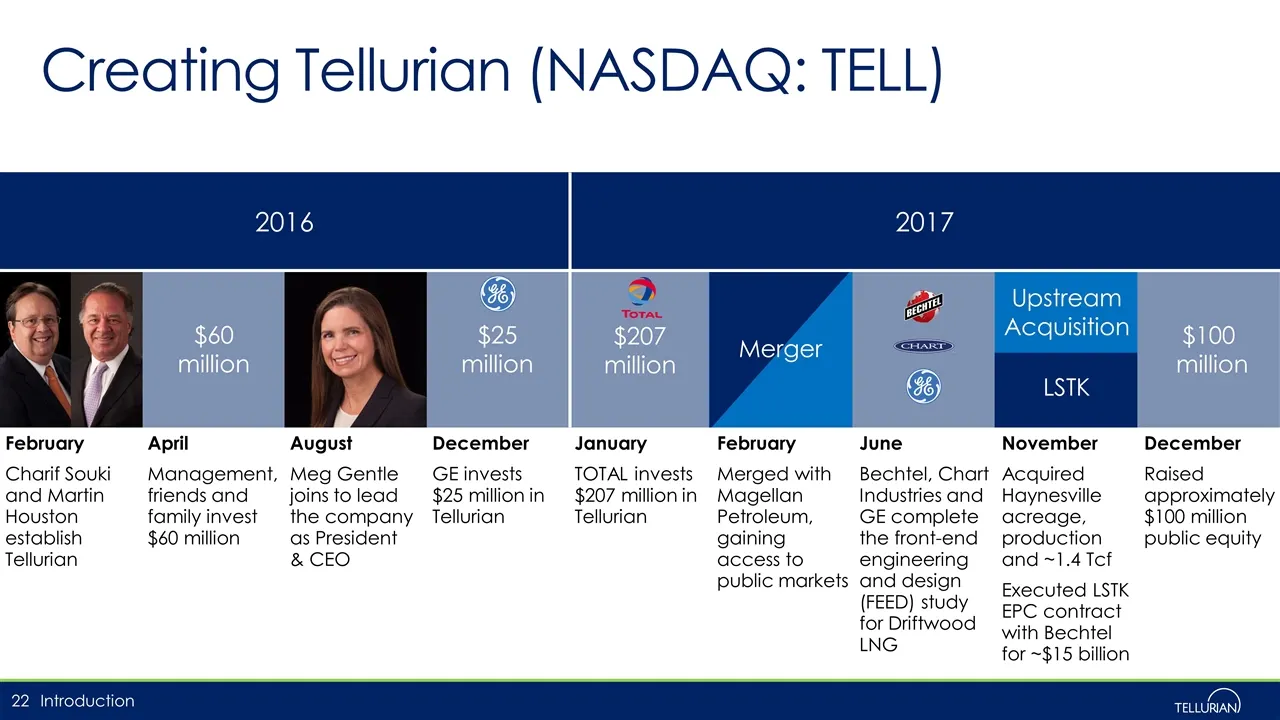
Slide 22: Creating Tellurian
$25 million $60 million $207 million Merger $100 million Upstream Acquisition LSTK February April August December January February June November December Charif Souki and Martin Houston establish Tellurian Management, friends and family invest $60 million Meg Gentle joins to lead the company as Pres
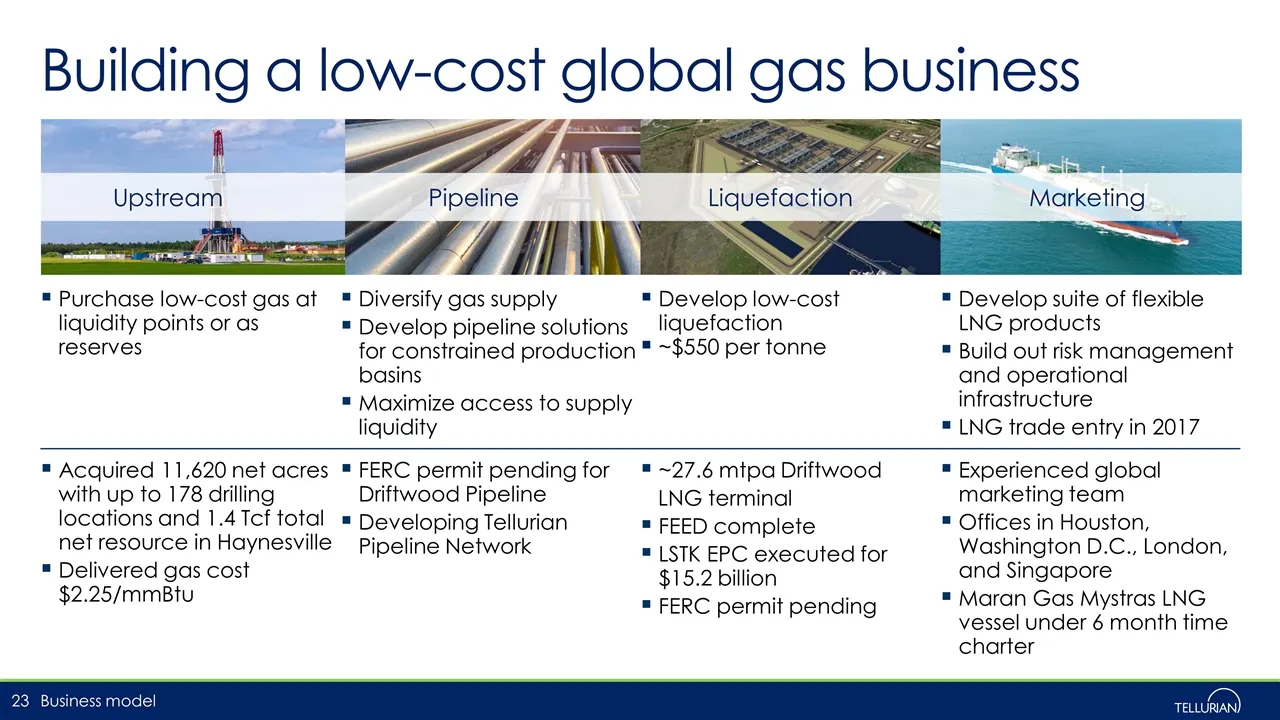
Slide 23: Building a low-cost global gas business
Building a low-cost global gas business Pipeline Liquefaction Marketing Upstream Purchase low-cost gas at liquidity points or as reserves Diversify gas supply Develop pipeline solutions for constrained production basins Maximize access to supply liquidity Develop low-cost liquefaction ~$550 per tonn
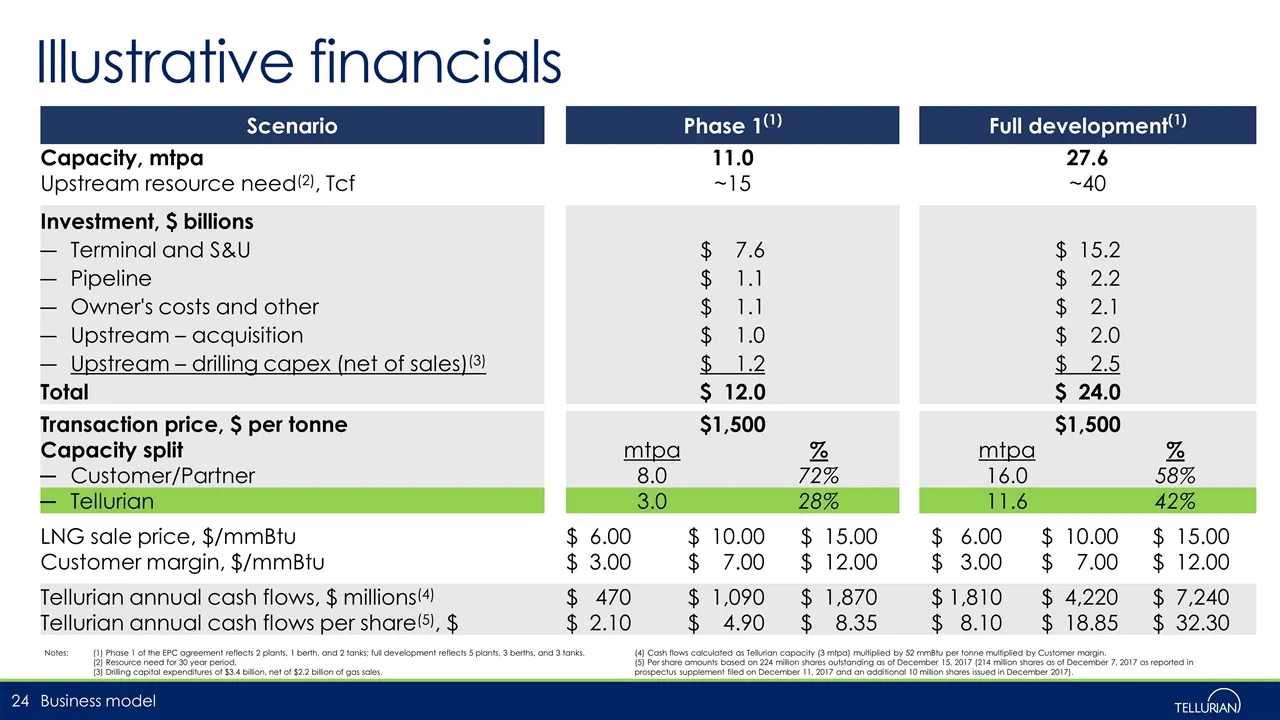
Slide 24: Illustrative financials
Illustrative financials Business model Notes: (1) Phase 1 of the EPC agreement reflects 2 plants, 1 berth, and 2 tanks; full development reflects 5 plants, 3 berths, and 3 tanks. (2) Resource need for 30 year period. (3) Drilling capital expenditures of $3.4 billion, net of $2.2 billion of gas sales
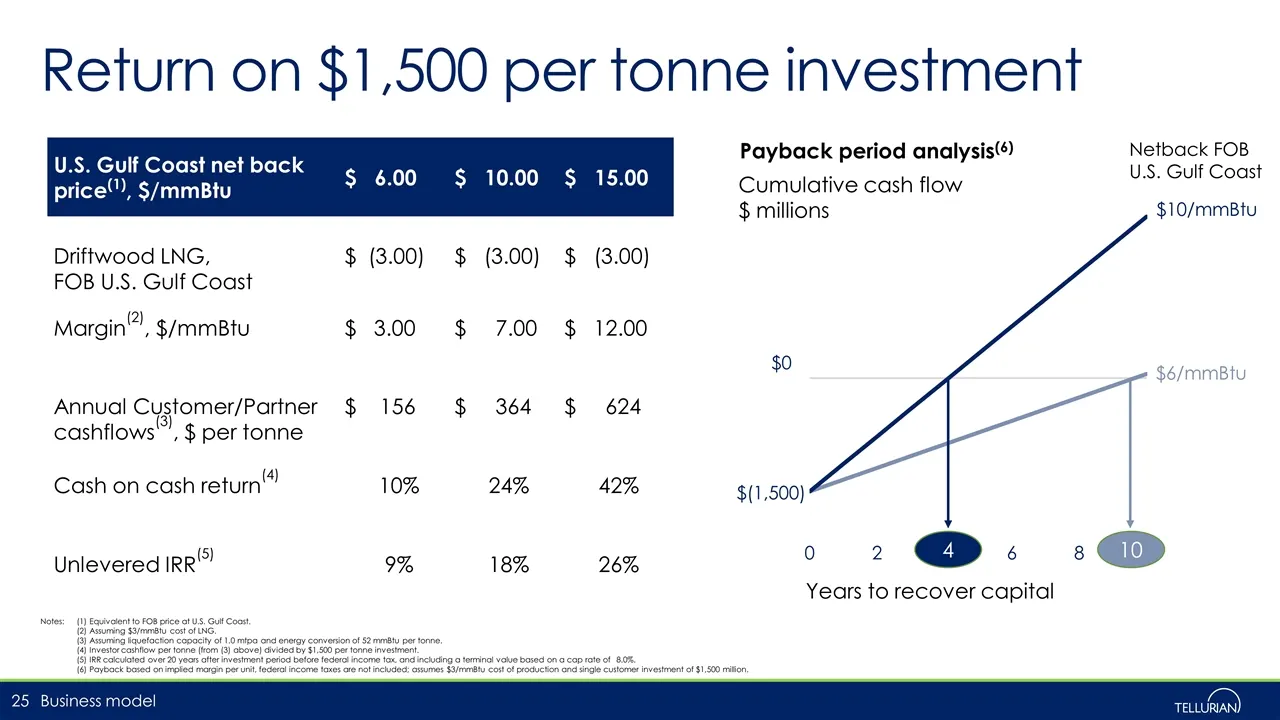
Slide 25: Return on $1,500 per tonne investment
Return on $1,500 per tonne investment Business model Payback period analysis(6) Years to recover capital $0 $(1,500) Cumulative cash flow $ millions $10/mmBtu $6/mmBtu Netback FOB U.S. Gulf Coast 4 10 Notes: (1) Equivalent to FOB price at U.S. Gulf Coast. (2) Assuming $3/mmBtu cost of LNG. (3) Assum
Slide 26: Integrated model prevalent internationally
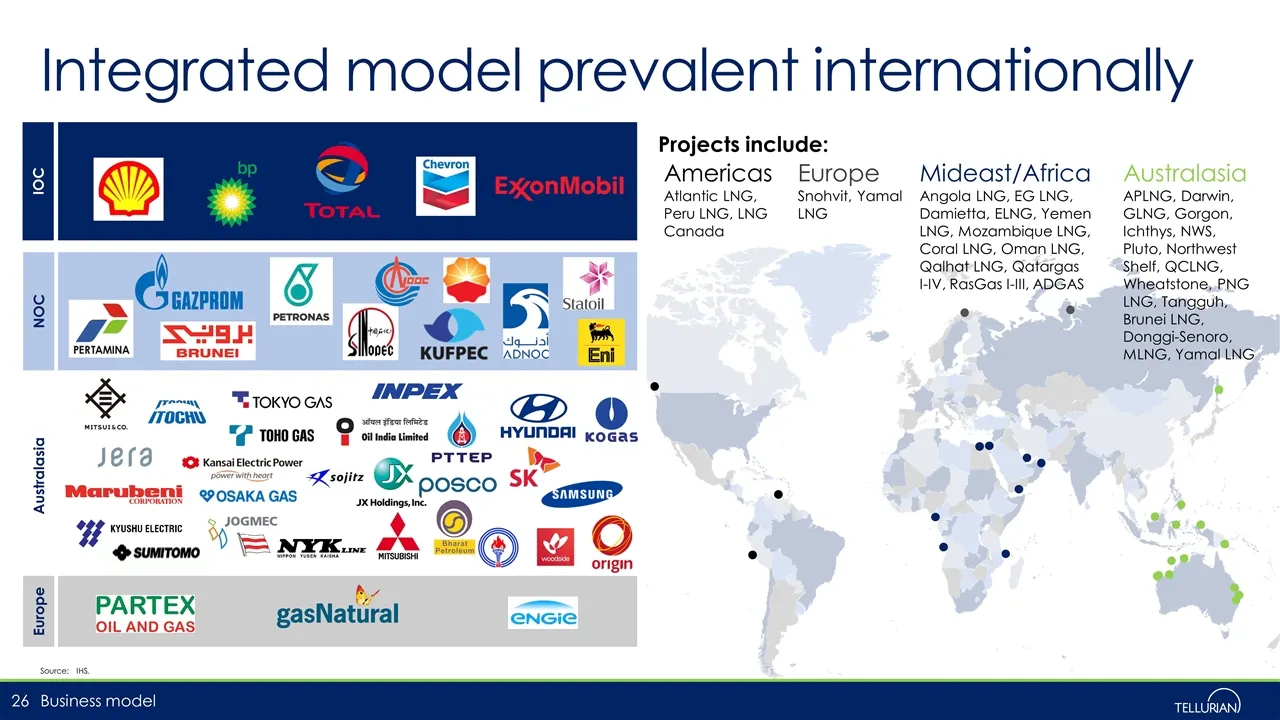
Integrated model prevalent internationally Source:IHS. Projects include: Australasia APLNG, Darwin, GLNG, Gorgon, Ichthys, NWS, Pluto, Northwest Shelf, QCLNG, Wheatstone, PNG LNG, Tangguh, Brunei LNG, Donggi-Senoro, MLNG, Yamal LNG Mideast/Africa Angola LNG, EG LNG, Damietta, ELNG, Yemen LNG, Mozamb
Slide 27: Driftwood schedule
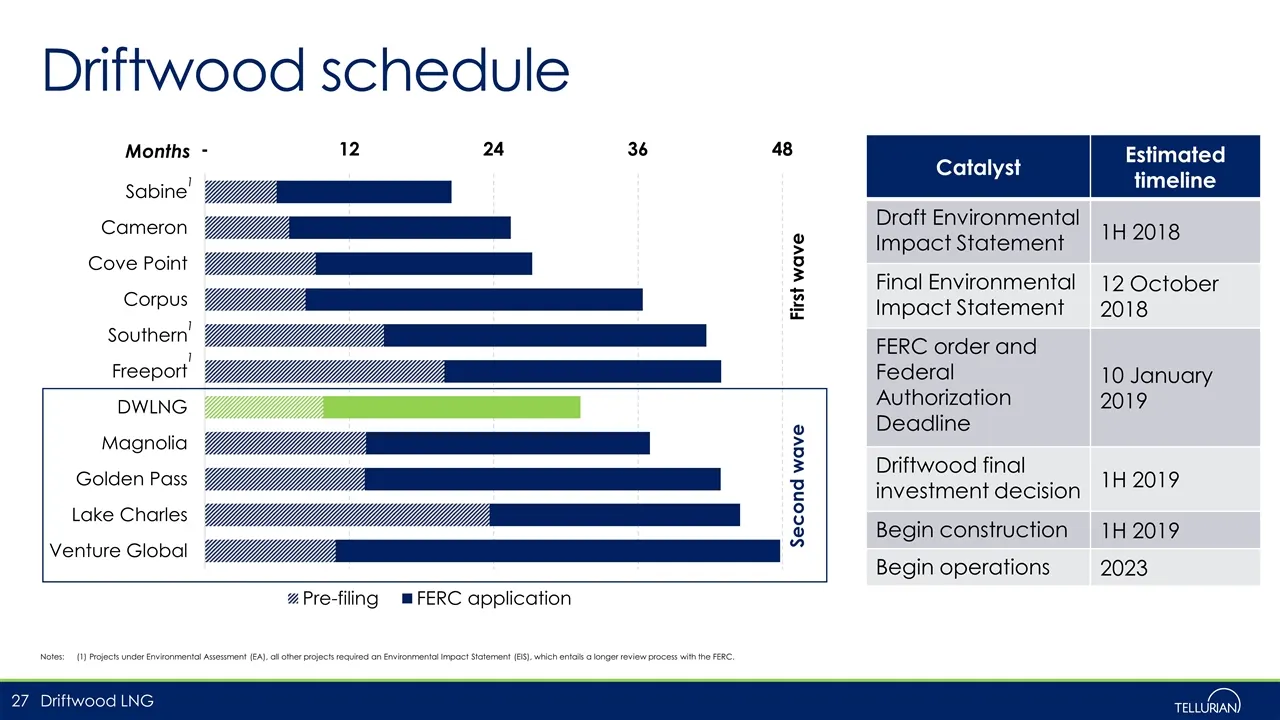
Driftwood schedule Driftwood LNG Notes:(1) Projects under Environmental Assessment (EA), all other projects required an Environmental Impact Statement (EIS), which entails a longer review process with the FERC. Second wave First wave Catalyst Estimated timeline Draft Environmental Impact Statement 1
Slide 28: Key terms of EPC agreements with Bechtel
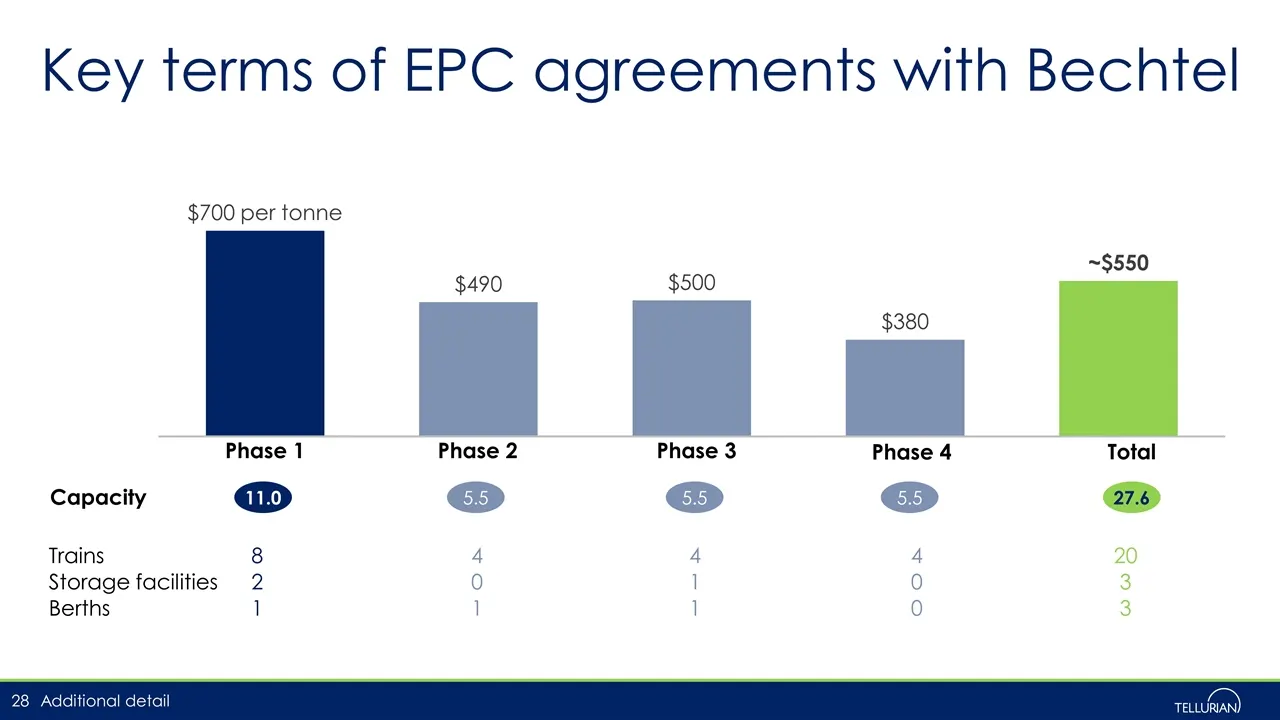
Key terms of EPC agreements with Bechtel Additional detail Phase 1 Phase 2 Phase 3 Phase 4 Total 11.0 5.5 5.5 5.5 27.6 Trains 8 4 4 4 20 Storage facilities 2 0 1 0 3 Berths 1 1 1 0 3 Capacity
Slide 29: Tellurian Pipeline Network
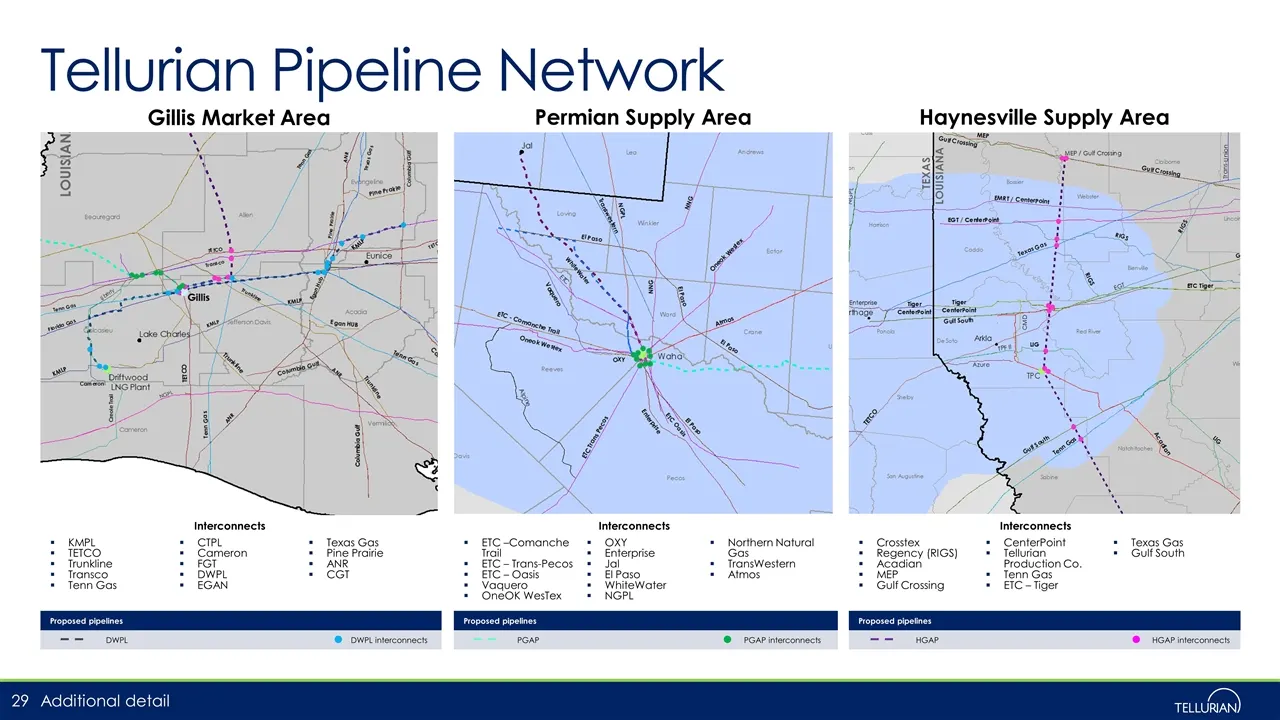
Tellurian Pipeline Network Gillis Market Area KMPL TETCO Trunkline Transco Tenn Gas CTPL Cameron FGT DWPL EGAN Texas Gas Pine Prairie ANR CGT Interconnects Permian Supply Area ETC –Comanche Trail ETC – Trans-Pecos ETC – Oasis Vaquero OneOK WesTex OXY Enterprise Jal El Paso WhiteWater NGPL Northern N
Slide 30: Tellurian Production Company
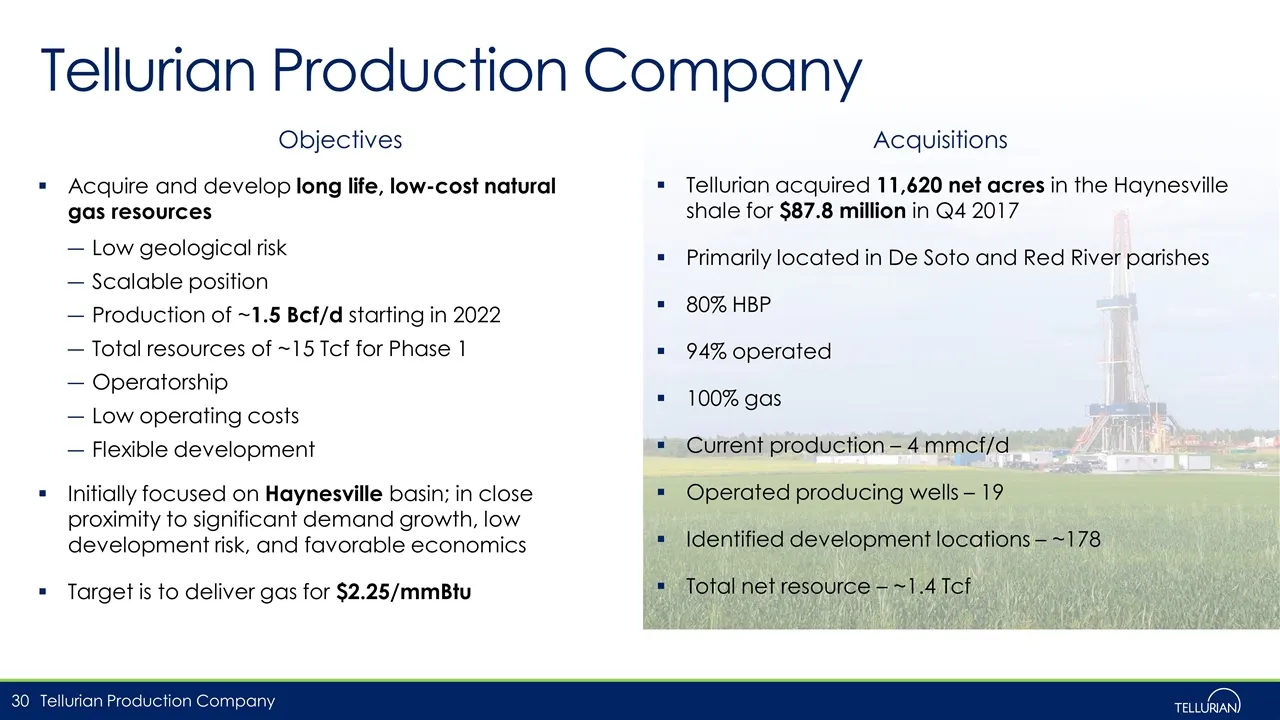
Tellurian Production Company Acquire and develop long life, low-cost natural gas resources Low geological risk Scalable position Production of ~1.5 Bcf/d starting in 2022 Total resources of ~15 Tcf for Phase 1 Operatorship Low operating costs Flexible development Initially focused on Haynesville bas
Slide 31: Haynesville type curve comparison
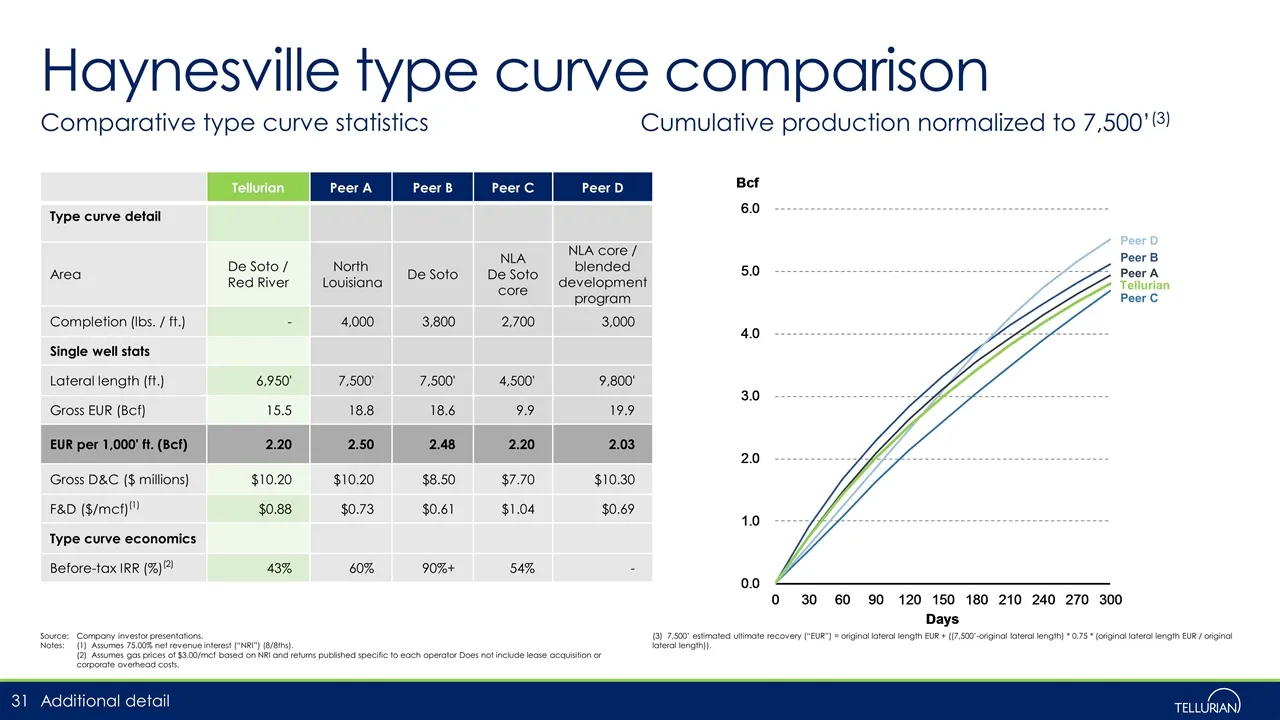
Haynesville type curve comparison Comparative type curve statistics Cumulative production normalized to 7,500’(3) Source:Company investor presentations. Notes:(1) Assumes 75.00% net revenue interest (“NRI”) (8/8ths). (2) Assumes gas prices of $3.00/mcf based on NRI and returns published specific to
Source: SEC EDGAR · 8-K filed Feb 14, 2018
More decks from Tellurian Inc
 Merger or Acquisition (July 2024)27 slides · Jul 22, 2024
 Investor Presentation (March 2024)16 slides · Mar 4, 2024
 Investor Presentation (August 2023)20 slides · Aug 7, 2023
 Investor Presentation (May 2023)20 slides · May 3, 2023
 Investor Presentation (February 2023)21 slides · Feb 22, 2023
 Investor Presentation (November 2022)19 slides · Nov 2, 2022