Tellurian — Investor Presentation (February 2023)
21 slides from Tellurian's investor presentation, Feb 22, 2023

Slide 1: Tellurian Inc. Corporate presentation February 2023
Tellurian Inc. Corporate presentation February 2023
Slide 2: Cautionary statements
Cautionary statements The information in this presentation includes “forward - looking statements” within the meaning of Section 27A of the Securities Act of 1933, as amended, and Section 21E of the Securities Exchange Act of 1934, as amended. All statements other than statements of historical fact
Slide 3: The world is critically short natural gas
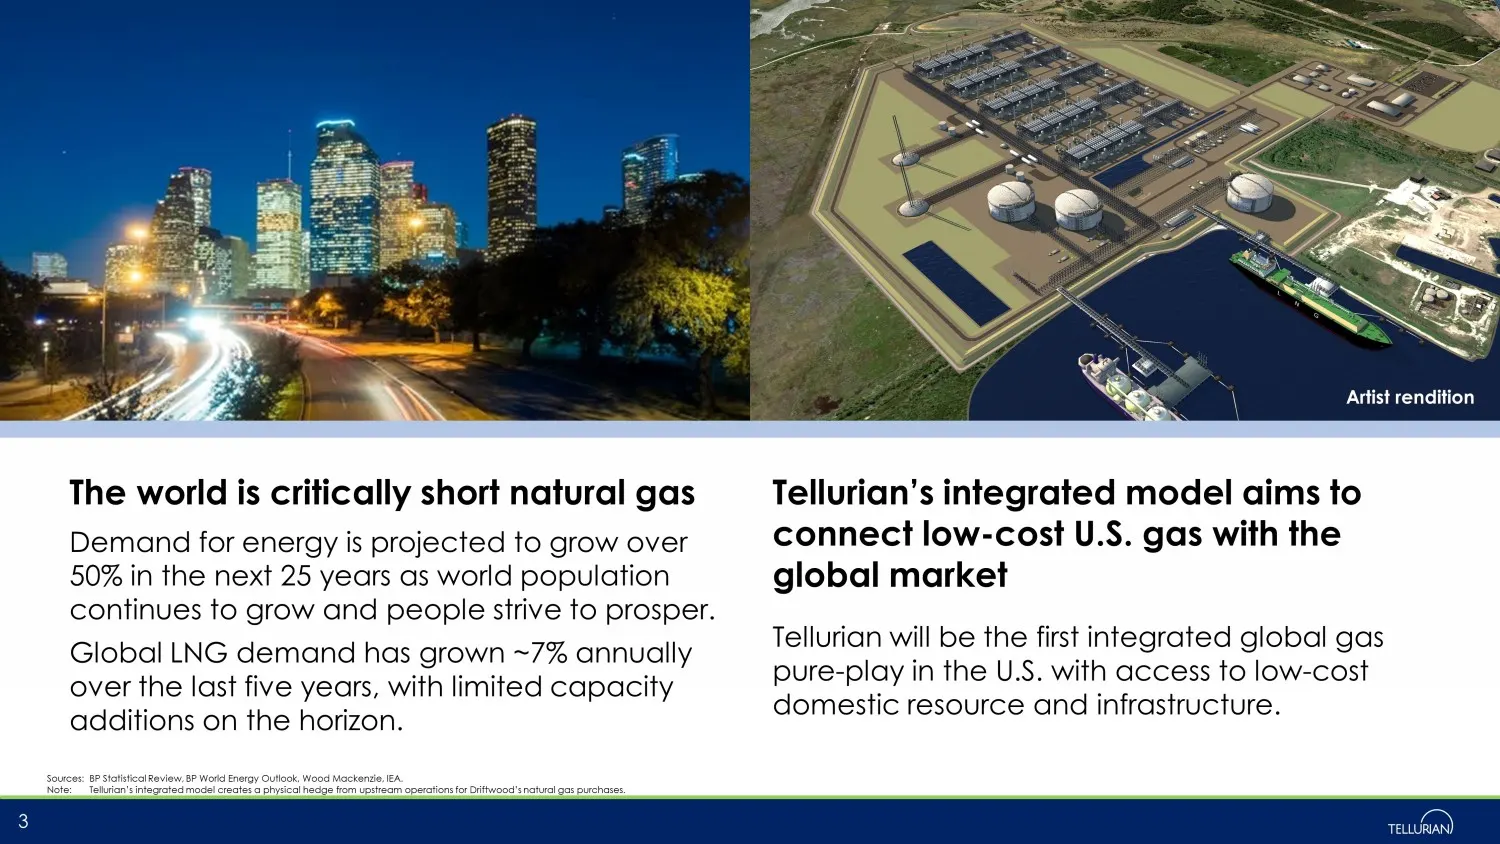
The world is critically short natural gas Demand for energy is projected to grow over 50% in the next 25 years as world population continues to grow and people strive to prosper. Global LNG demand has grown ~7% annually over the last five years, with limited capacity additions on the horizon. Tellur
Slide 4: Tellurian executive summary
Tellurian executive summary 4 Driftwood Phase I is well underway with Bechtel having commenced construction in April 2022 ▪ Progressed limited notice to proceed projects with Bechtel in 2022, continuing into 2023 ▪ In 2022, cleared all Phase I critical areas, drove ~30% of Phase I piles and pouring
Slide 5: Tellurian: fully integrated, pure-play LNG
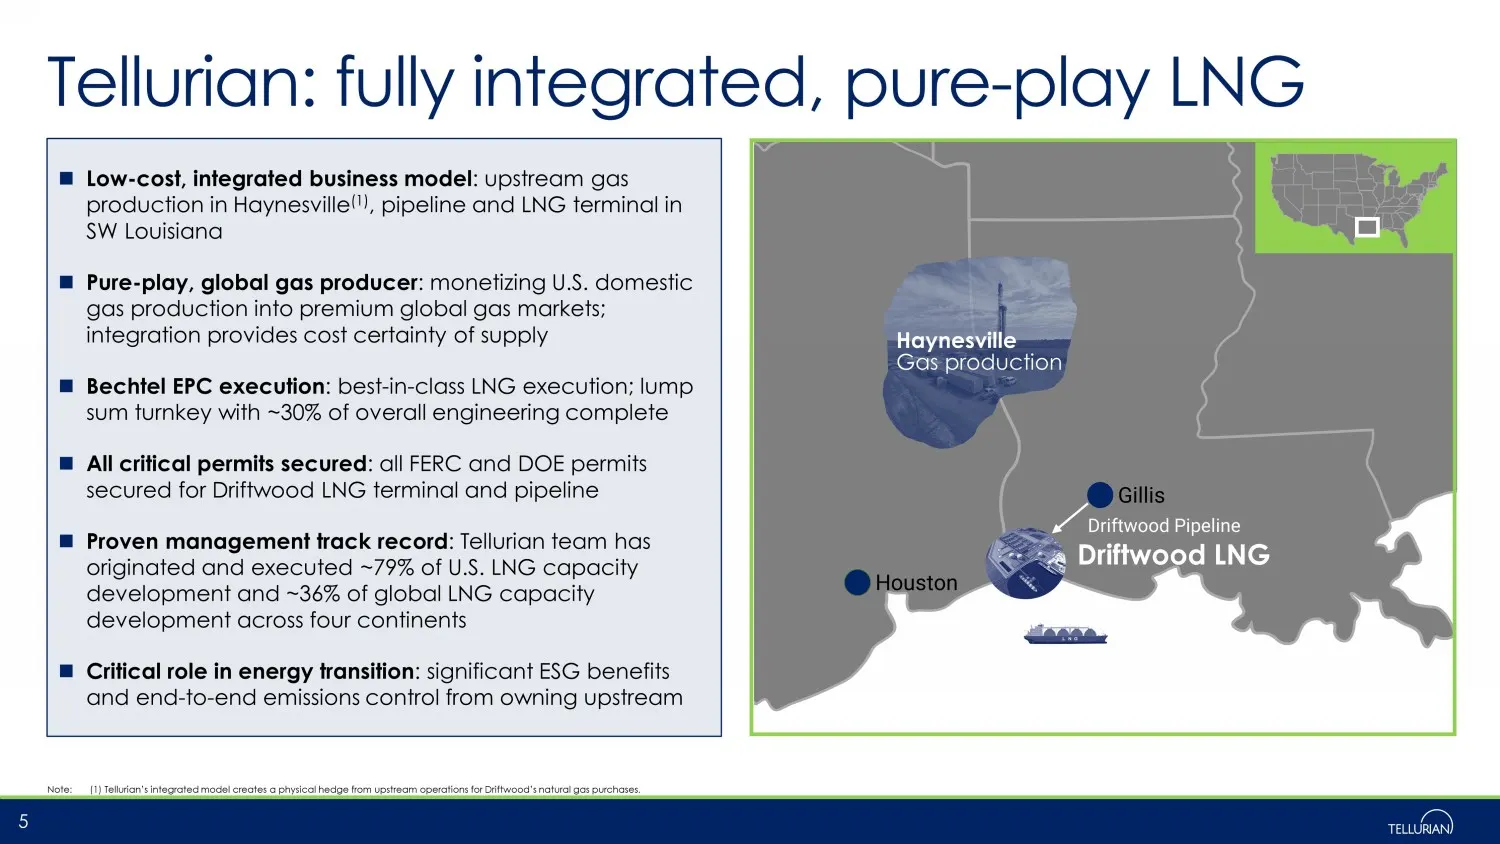
Houston Gillis Haynesville Gas production Driftwood LNG Driftwood Pipeline Tellurian: fully integrated, pure - play LNG 5 Low - cost, integrated business model : upstream gas production in Haynesville (1) , pipeline and LNG terminal in SW Louisiana Pure - play, global gas producer : monetizing U.S.
Slide 6: Upstream: significant production growth in 4Q
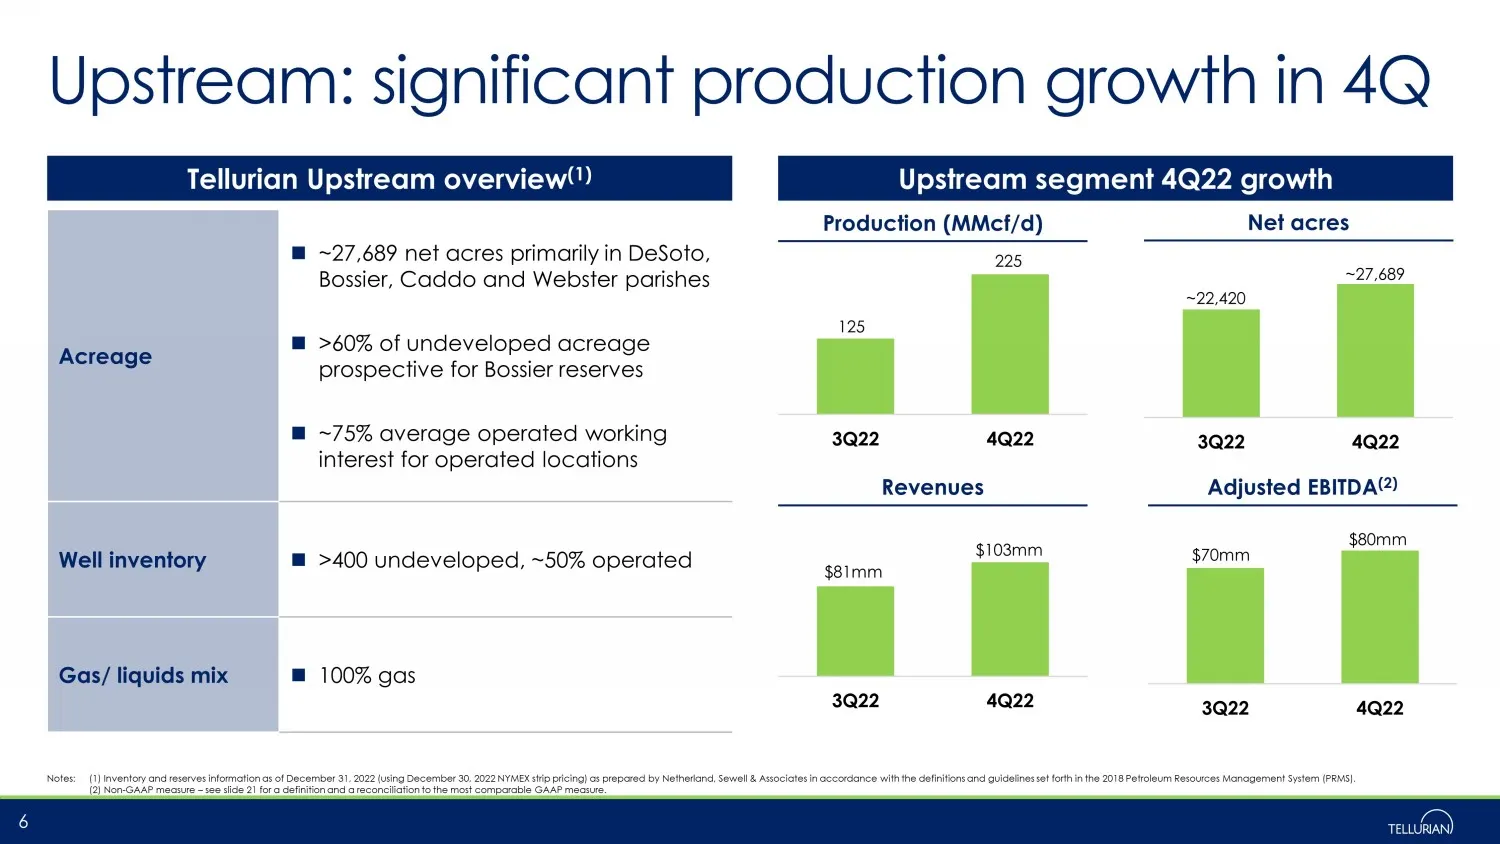
Upstream: significant production growth in 4Q Notes: (1) Inventory and reserves information as of December 31, 2022 (using December 30, 2022 NYMEX strip pricing) as prepared by N eth erland, Sewell & Associates in accordance with the definitions and guidelines set forth in the 2018 Petroleum Resourc
Slide 7: Driftwood LNG: construction in progress
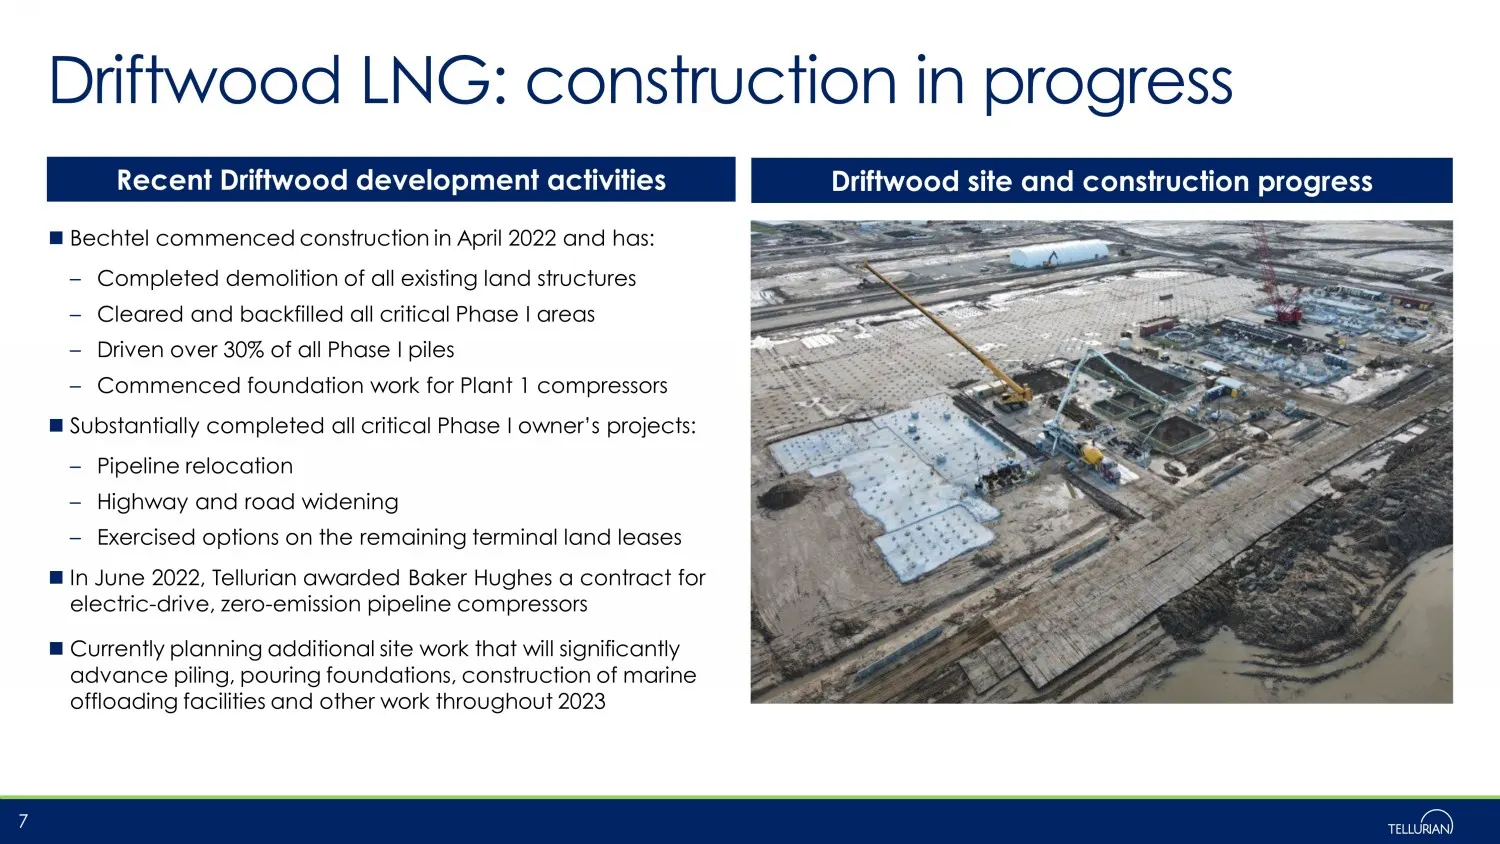
Driftwood LNG: construction in progress Bechtel commenced construction in April 2022 and has : – Completed demolition of all existing land structures – Cleared and backfilled all critical Phase I areas – Driven over 30% of all Phase I piles – Commenced foundation work for Plant 1 compressors Substan
Slide 8: International pricing / Henry Hub inversion is unsustainable
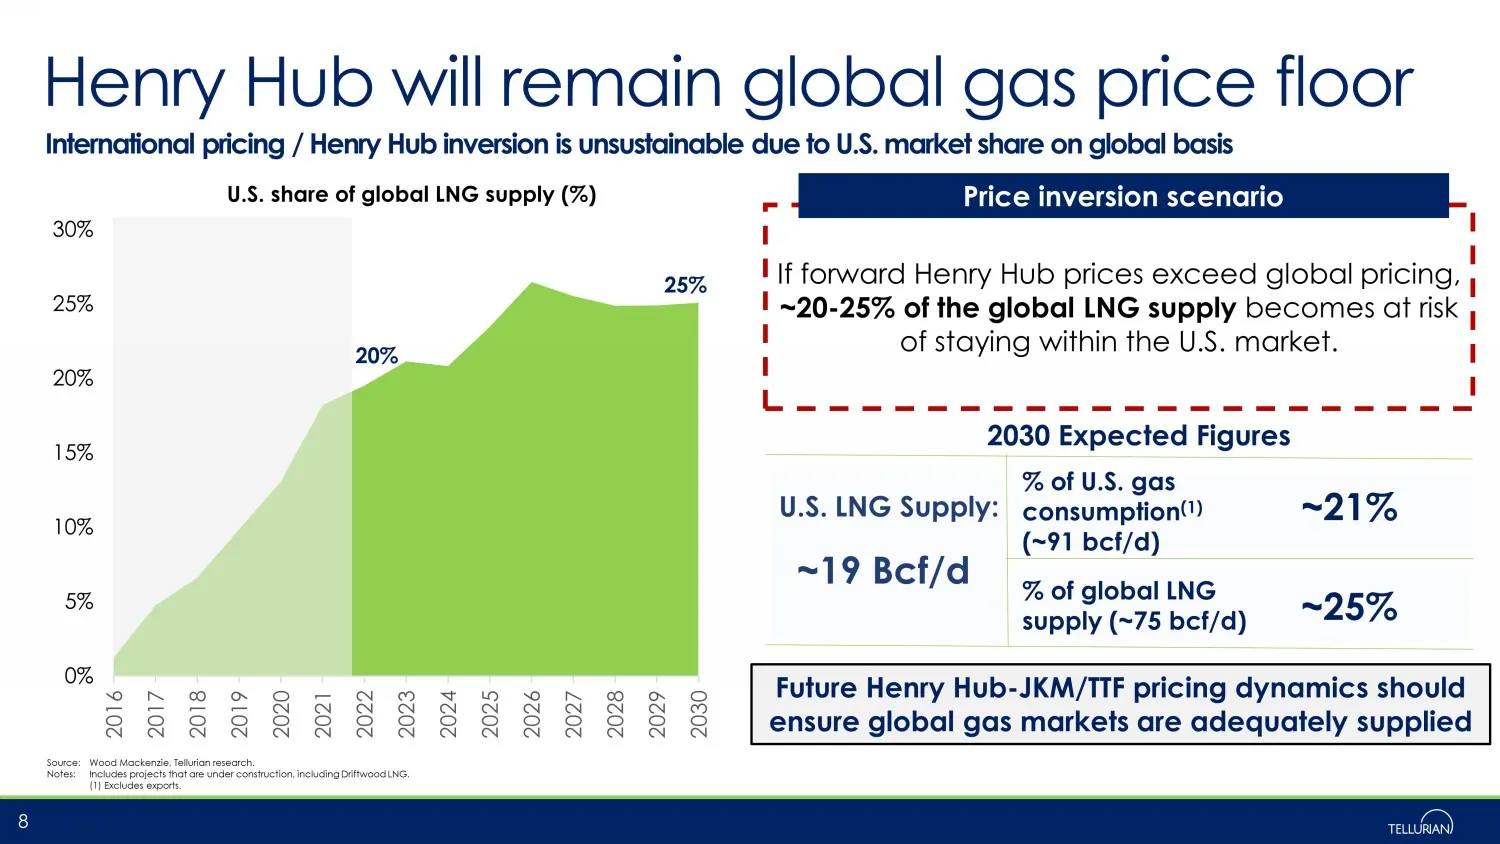
If forward Henry Hub prices exceed global pricing, ~ 20 - 25 % of the global LNG supply becomes at risk of staying within the U.S. market. 20% 25% 0% 5% 10% 15% 20% 25% 30% 2016 2017 2018 2019 2020 2021 2022 2023 2024 2025 2026 2027 2028 2029 2030 U.S. share of global LNG supply (%) Henry Hub will r
Slide 9: LNG supply vs. demand growth
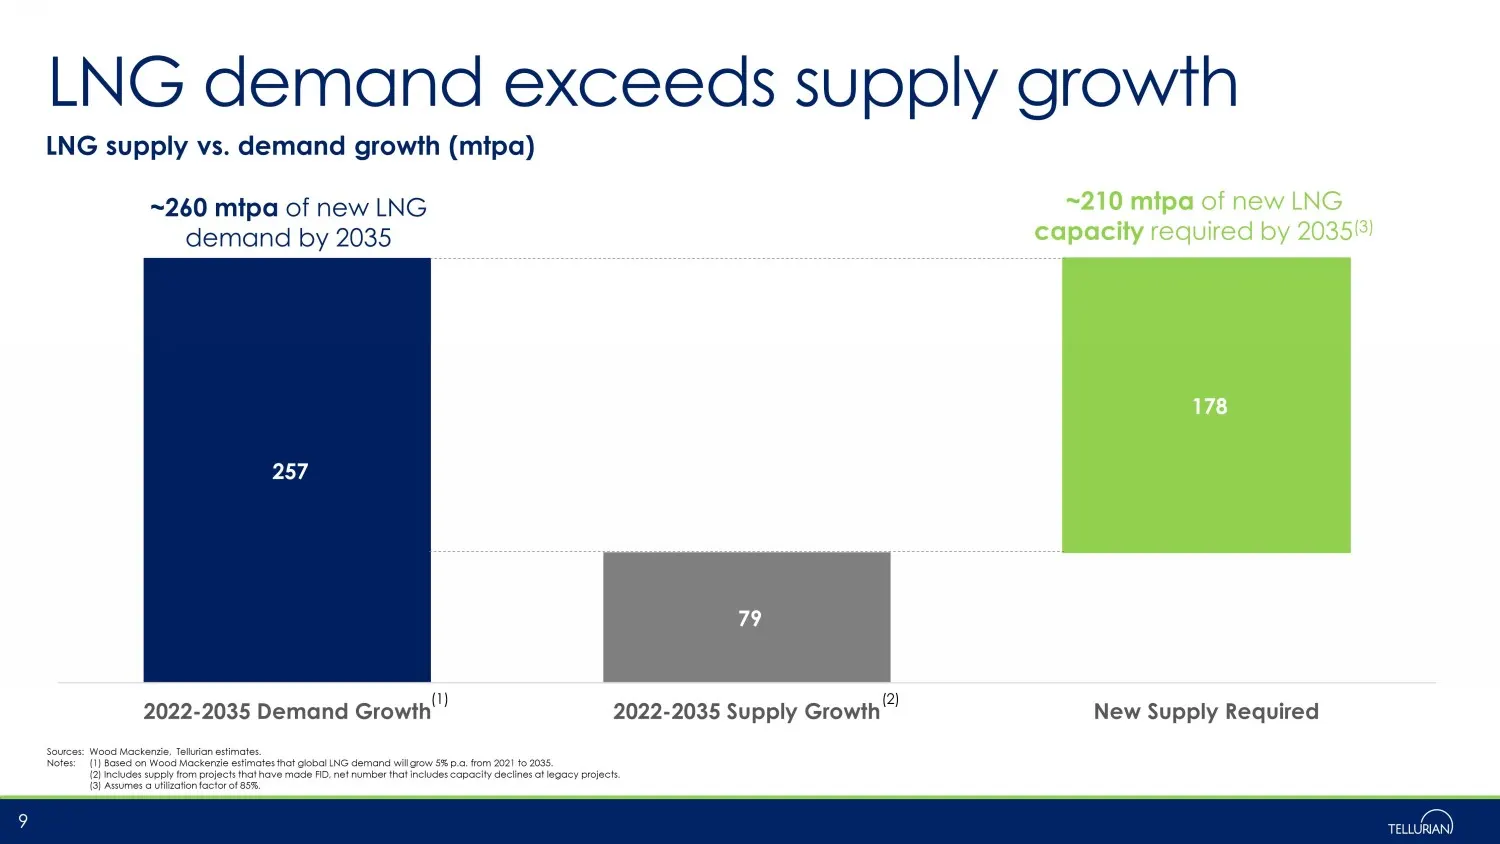
257 79 178 2022-2035 Demand Growth 2022-2035 Supply Growth New Supply Required LNG supply vs. demand growth (mtpa) LNG demand exceeds supply growth 9 Sources: Wood Mackenzie, Tellurian estimates. Notes: (1) Based on Wood Mackenzie estimates that global LNG demand will grow 5% p.a. from 2021 to 2035.
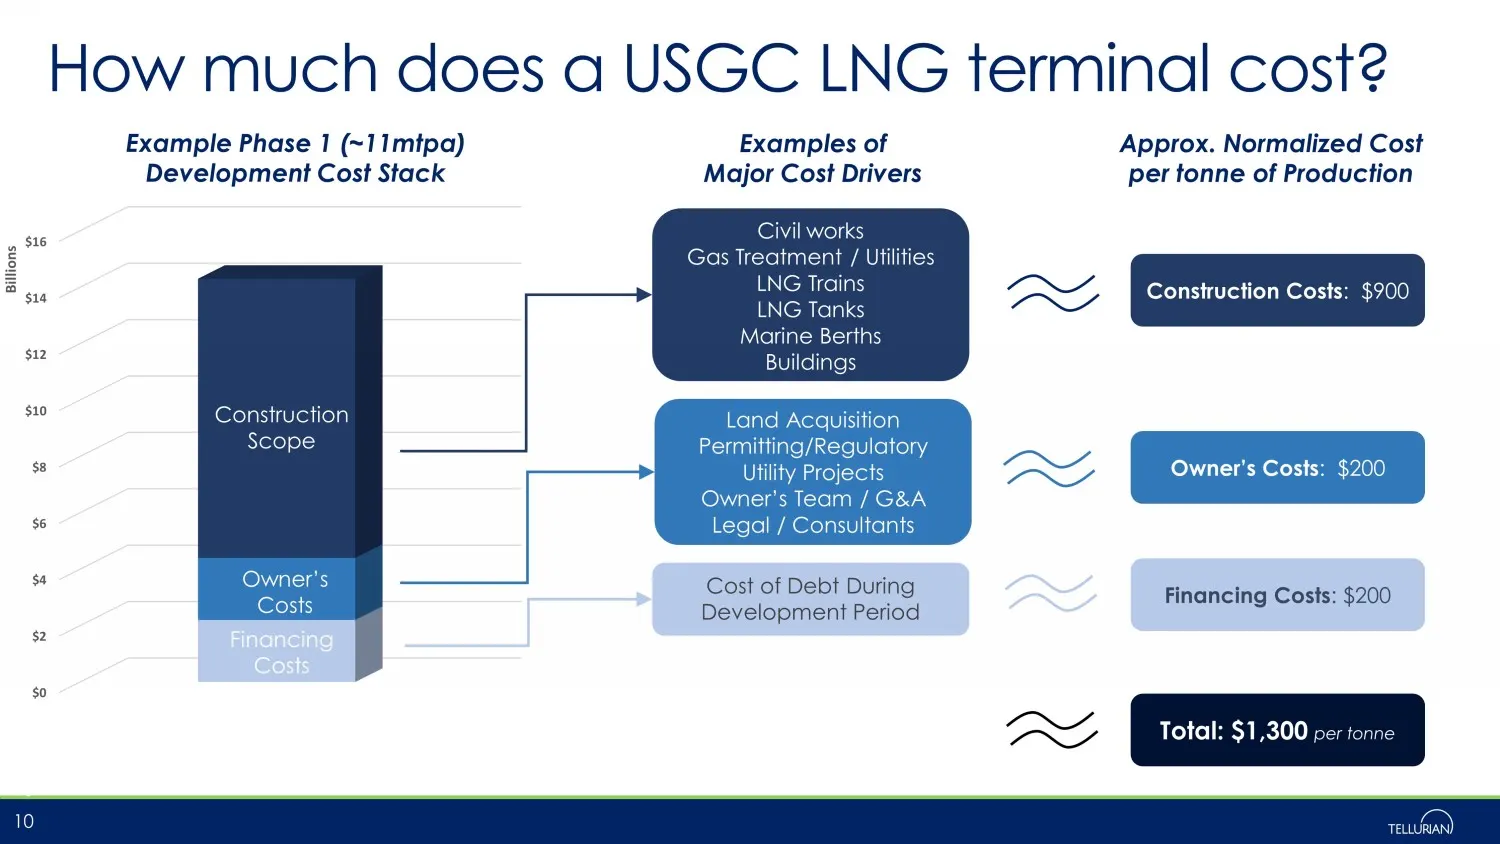
Slide 10: How much does a USGC LNG terminal cost?
$0 $2 $4 $6 $8 $10 $12 $14 $16 Billions How much does a USGC LNG terminal cost? 10 Example Phase 1 (~11mtpa) Development Cost Stack Construction Scope Owner’s Costs Financing Costs Examples of Major Cost Drivers Civil works Gas Treatment / Utilities LNG Trains LNG Tanks Marine Berths Buildings Land
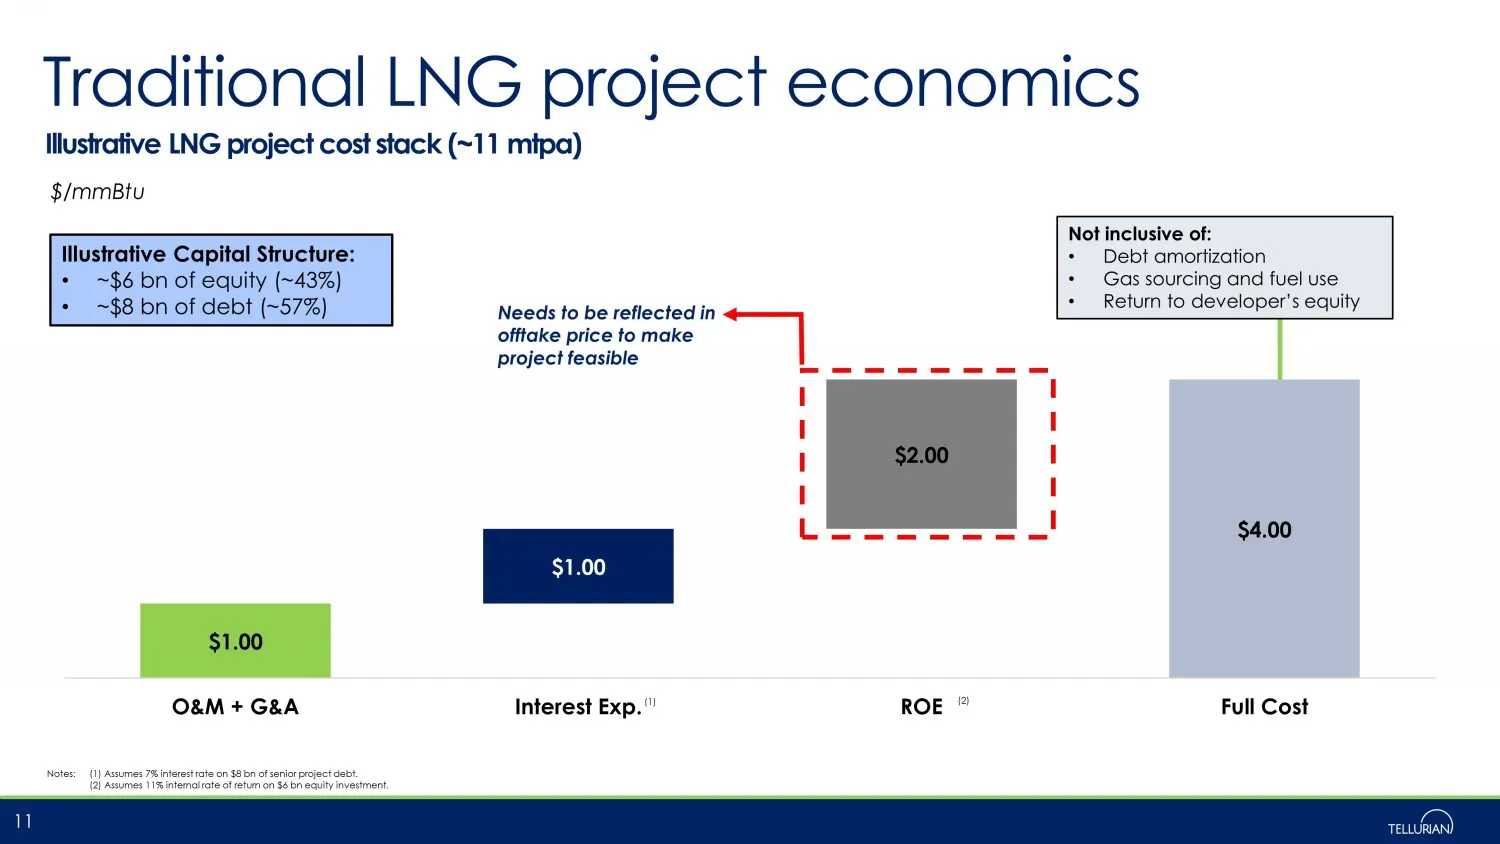
Slide 11: Traditional LNG project economics
Traditional LNG project economics 11 Illustrative LNG project cost stack (~11 mtpa ) Notes: (1) Assumes 7% interest rate on $8 bn of senior project debt. (2) Assumes 11% internal rate of return on $6 bn equity investment. Needs to be reflected in offtake price to make project feasible (1) (2) Illust
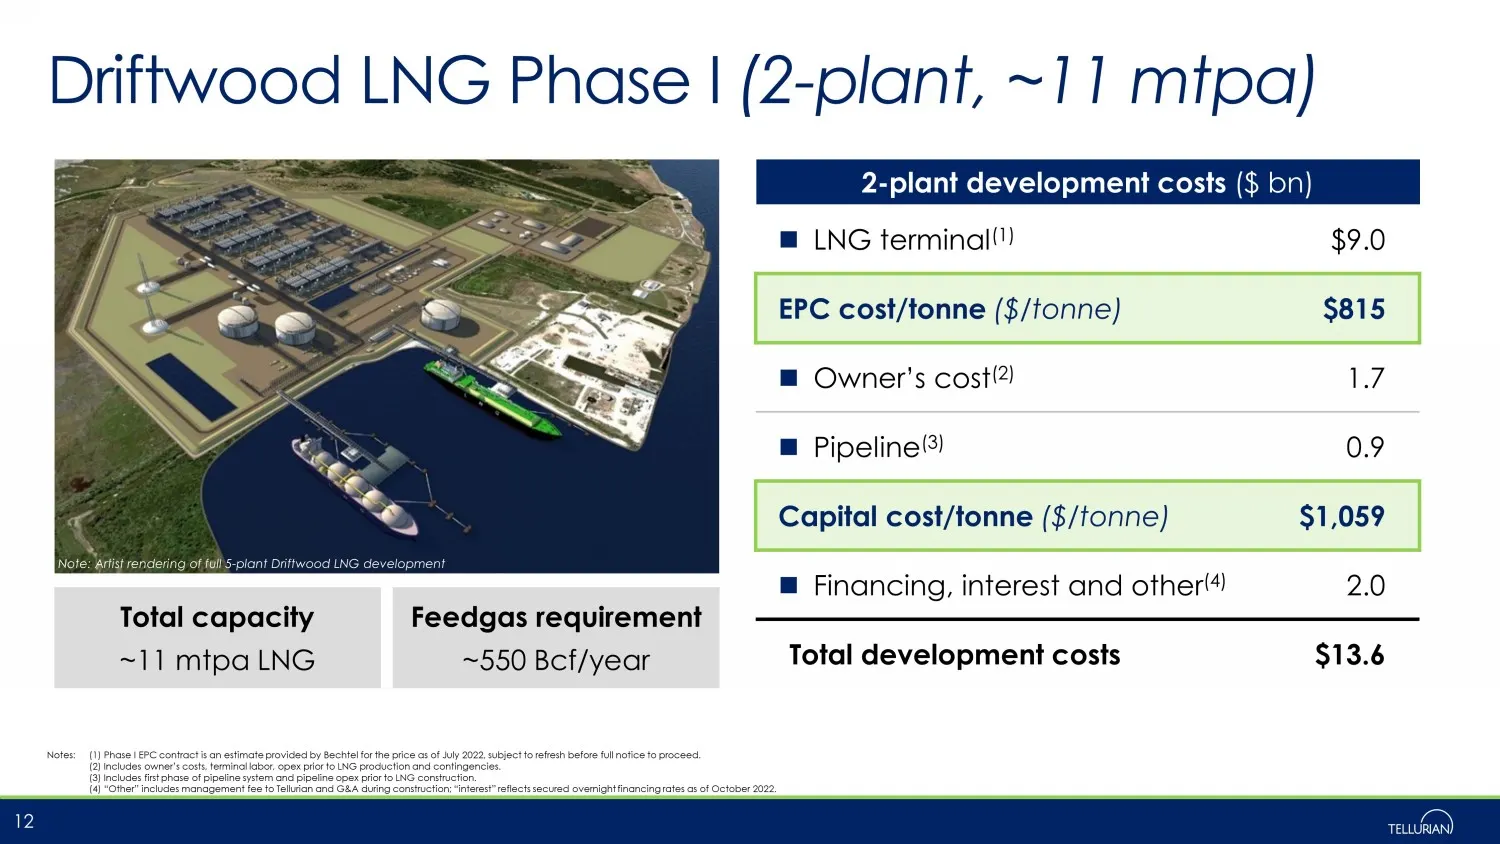
Slide 12: Driftwood LNG Phase I (2-plant, ~11 mtpa)
Driftwood LNG Phase I (2 - plant, ~11 mtpa) Notes: (1) Phase I EPC contract is an estimate provided by Bechtel for the price as of July 2022, subject to refresh before full notice to proceed. (2) Includes owner’s costs, terminal labor, opex prior to LNG production and contingencies. (3) Includes fir
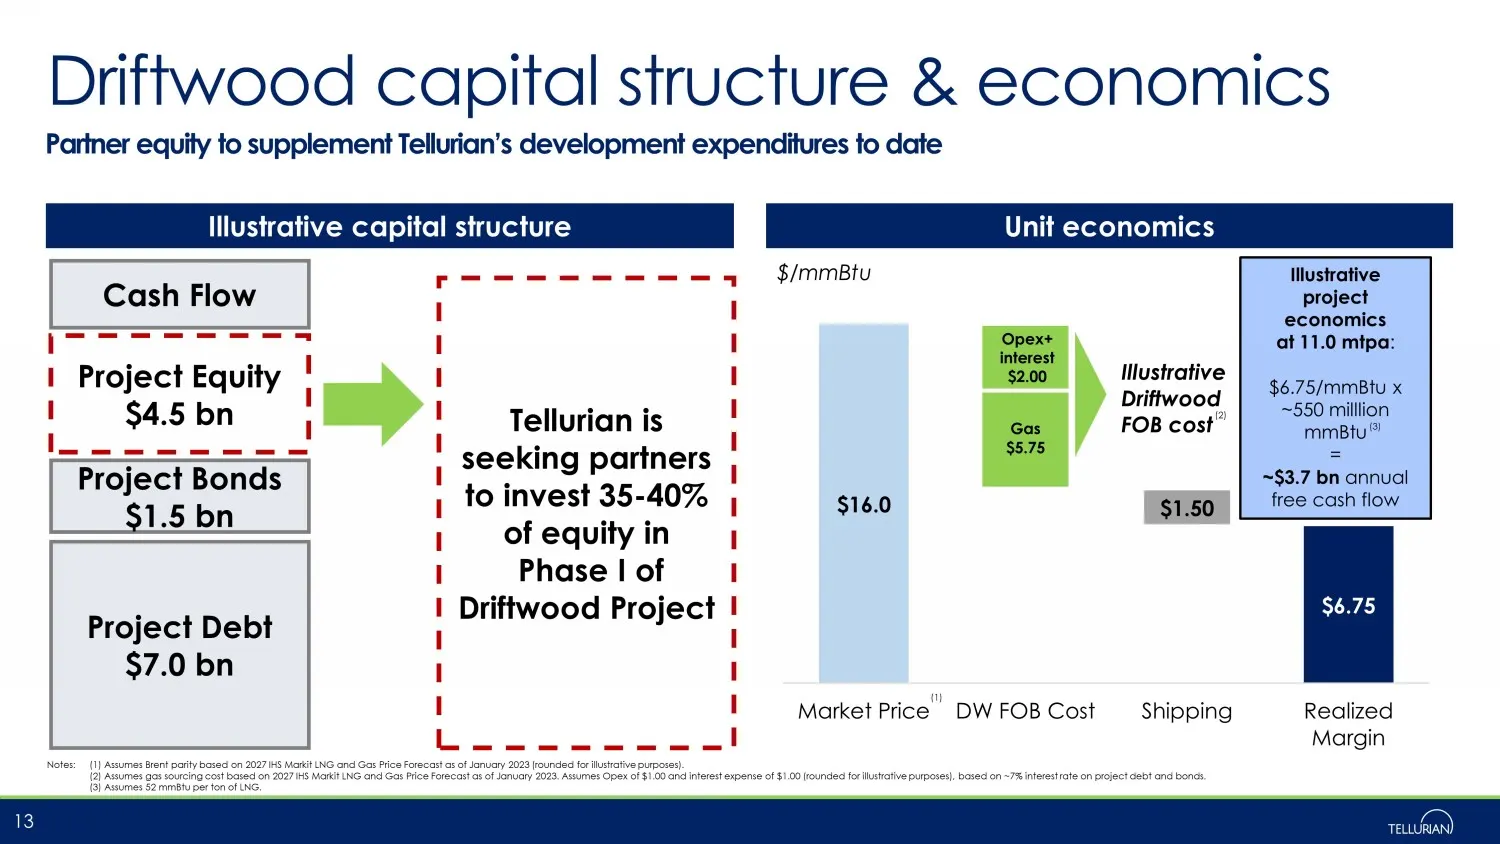
Slide 13: Driftwood capital structure & economics
$16.0 $6.75 Gas $5.75 $1.50 Market Price DW FOB Cost Shipping Realized Margin Opex + interest $2.00 Driftwood capital structure & economics 13 Illustrative project economics at 11.0 mtpa : $6.75/ mmBtu x ~550 milllion mmBtu = ~$3.7 bn annual free cash flow Illustrative Driftwood FOB cost (3) Partner
Slide 14: Illustrative cash flow at 2027 LNG pricing
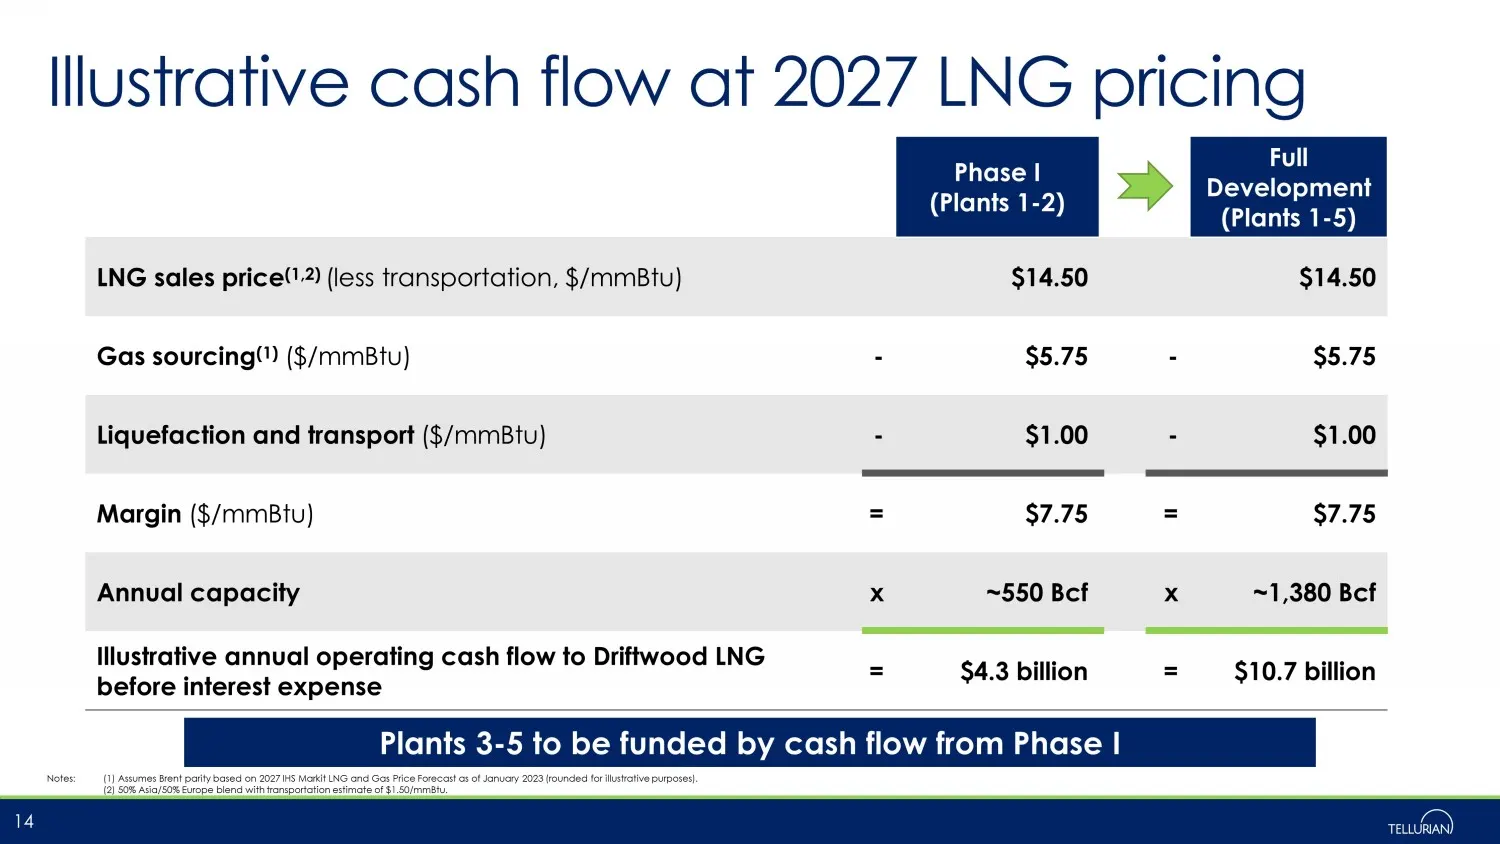
Illustrative cash flow at 2027 LNG pricing Notes: (1) Assumes Brent parity based on 2027 IHS Markit LNG and Gas Price Forecast as of January 2023 (rounded for illustrative purpose s) . (2) 50% Asia/50% Europe blend with transportation estimate of $1.50/ mmBtu . 14 Phase I (Plants 1 - 2) Full Develop
Slide 15: Contact us
Contact us ▪ Matt Phillips VP, Investor Relations & Finance +1 832 320 9331 [email protected] ▪ Joi Lecznar EVP, Public & Government Affairs +1 832 962 4044 [email protected] 15 ▪ Johan Yokay Director , Investor Relations & Assistant Treasurer +1 832 320 9327 johan.yokay@t

Slide 16: Tellurian
TELLURIAN
Slide 17: Driftwood LNG's ideal site for exports
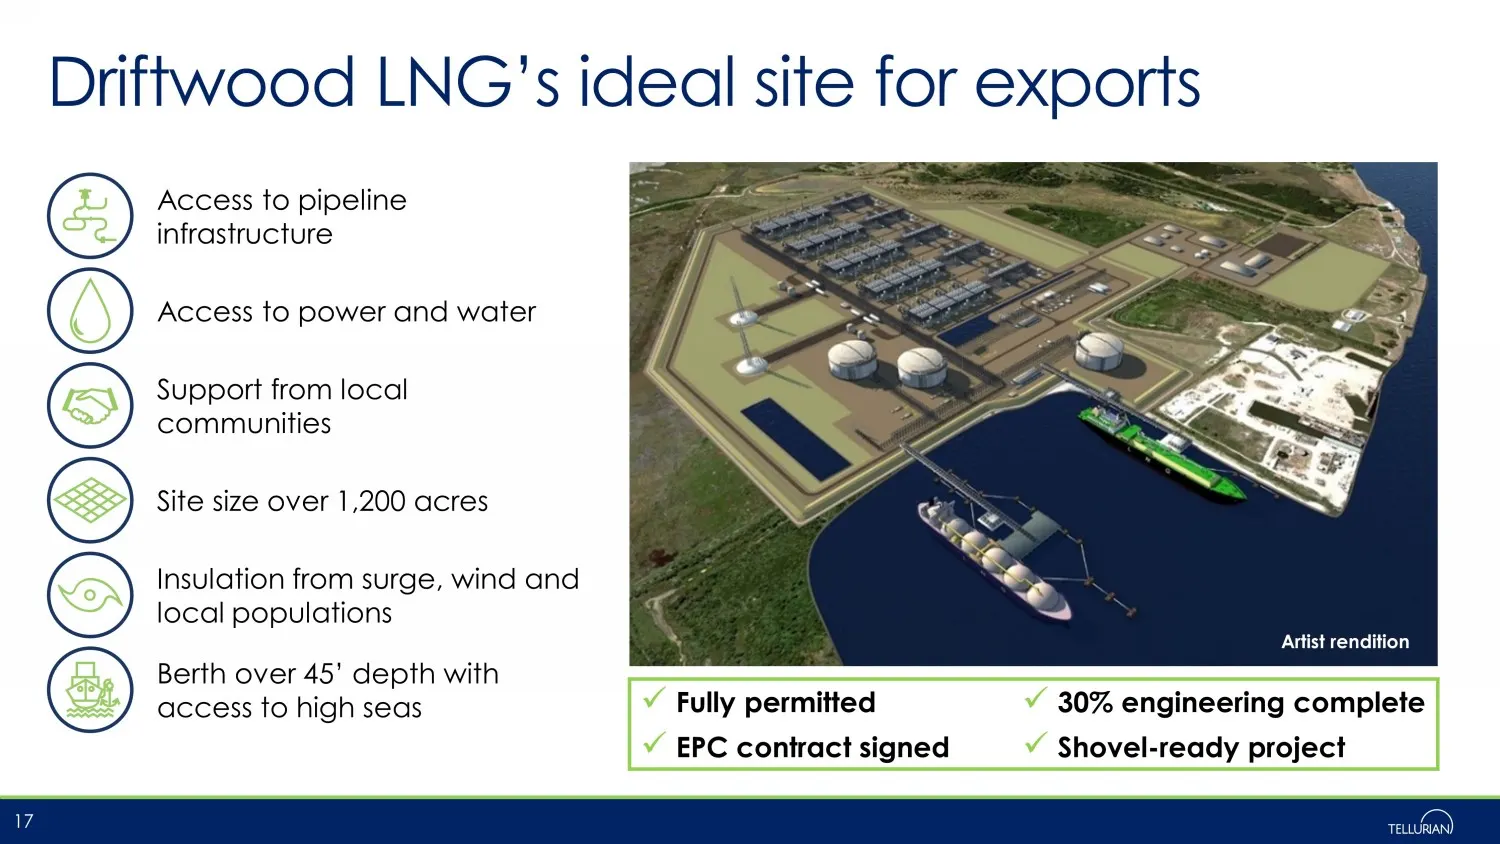
Driftwood LNG’s ideal site for exports 17 Access to power and water Berth over 45’ depth with access to high seas Support from local communities Access to pipeline infrastructure Site size over 1,200 acres Insulation from surge, wind and local populations Artist rendition x Fully permitted x 30% eng
Slide 18: Unmatched LNG development experience
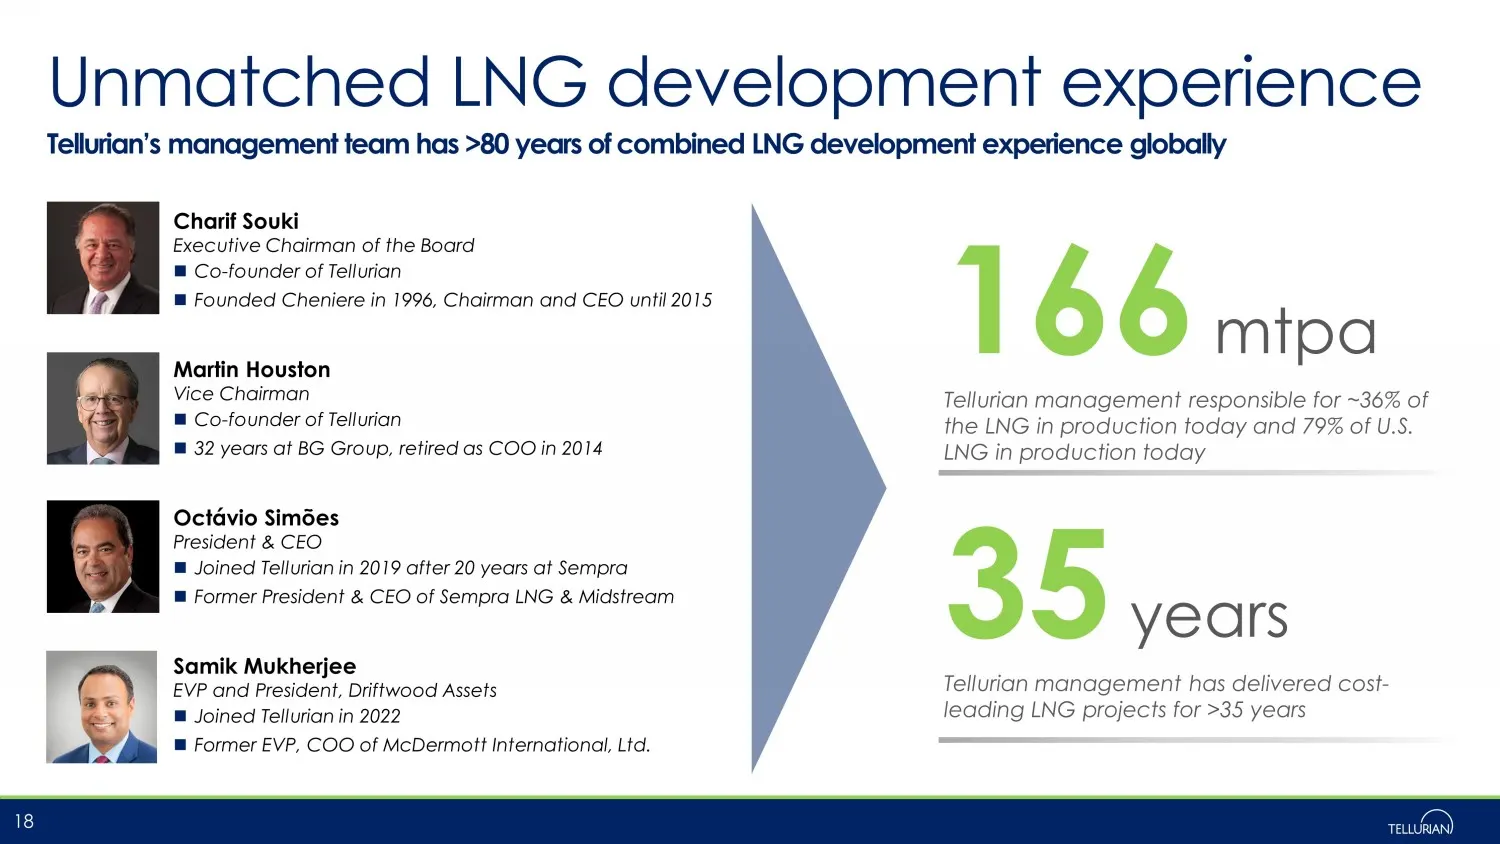
Unmatched LNG development experience Tellurian’s management team has >80 years of combined LNG development experience globally 18 Charif Souki Executive Chairman of the Board Co - founder of Tellurian Founded Cheniere in 1996, Chairman and CEO until 2015 Martin Houston Vice Chairman Co - founder of
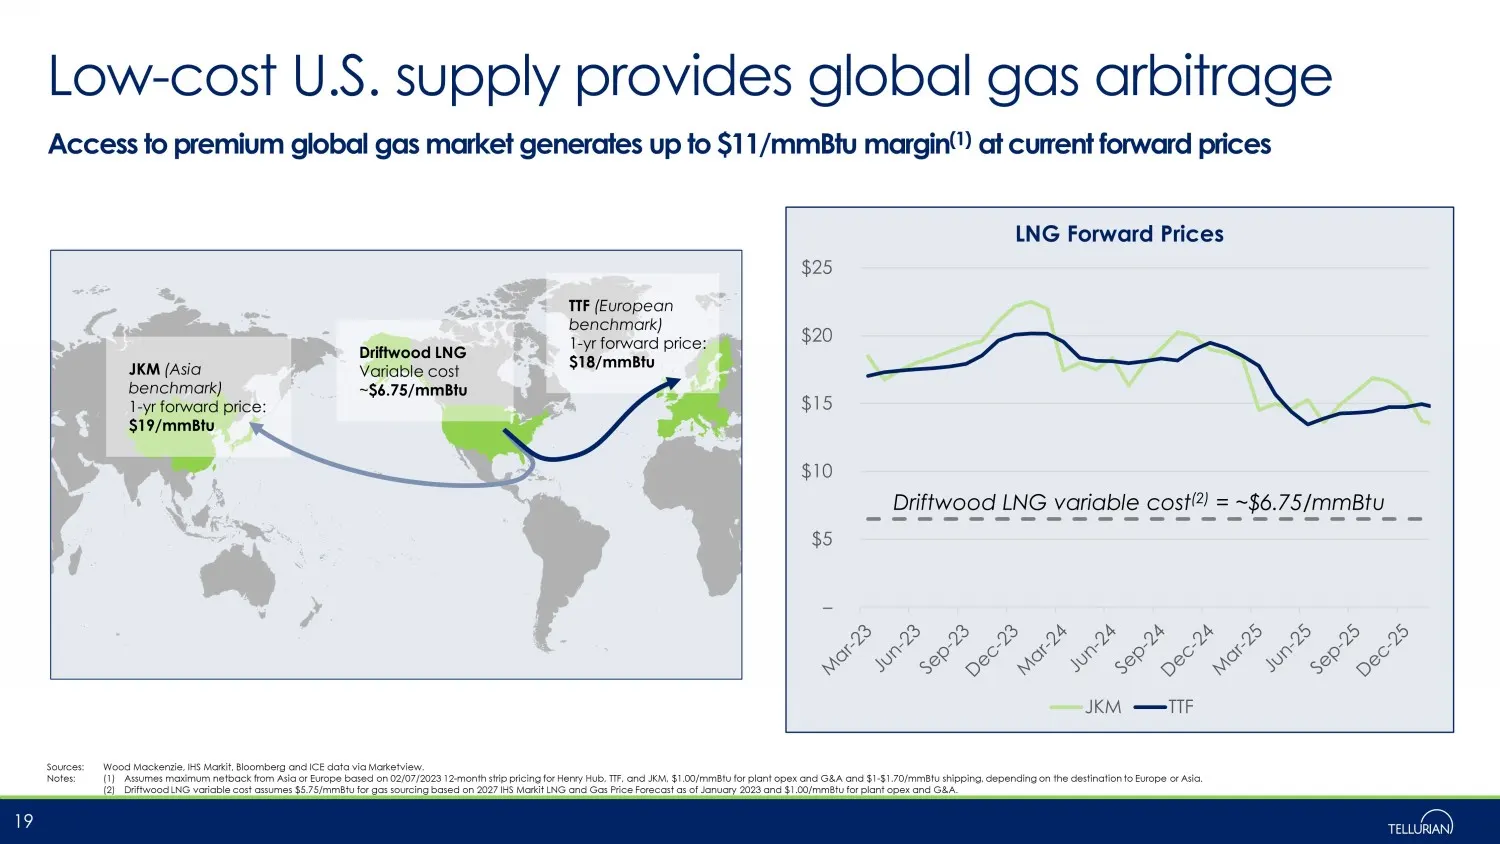
Slide 19: Low-cost U.S. supply provides global gas arbitrage
– $5 $10 $15 $20 $25 LNG Forward Prices JKM TTF Low - cost U.S. supply provides global gas arbitrage 19 Access to premium global gas market generates up to $11/ mmBtu margin (1) at current forward prices JKM (Asia benchmark) 1 - yr forward price: $19/ mmBtu TTF (European benchmark) 1 - yr forward pr
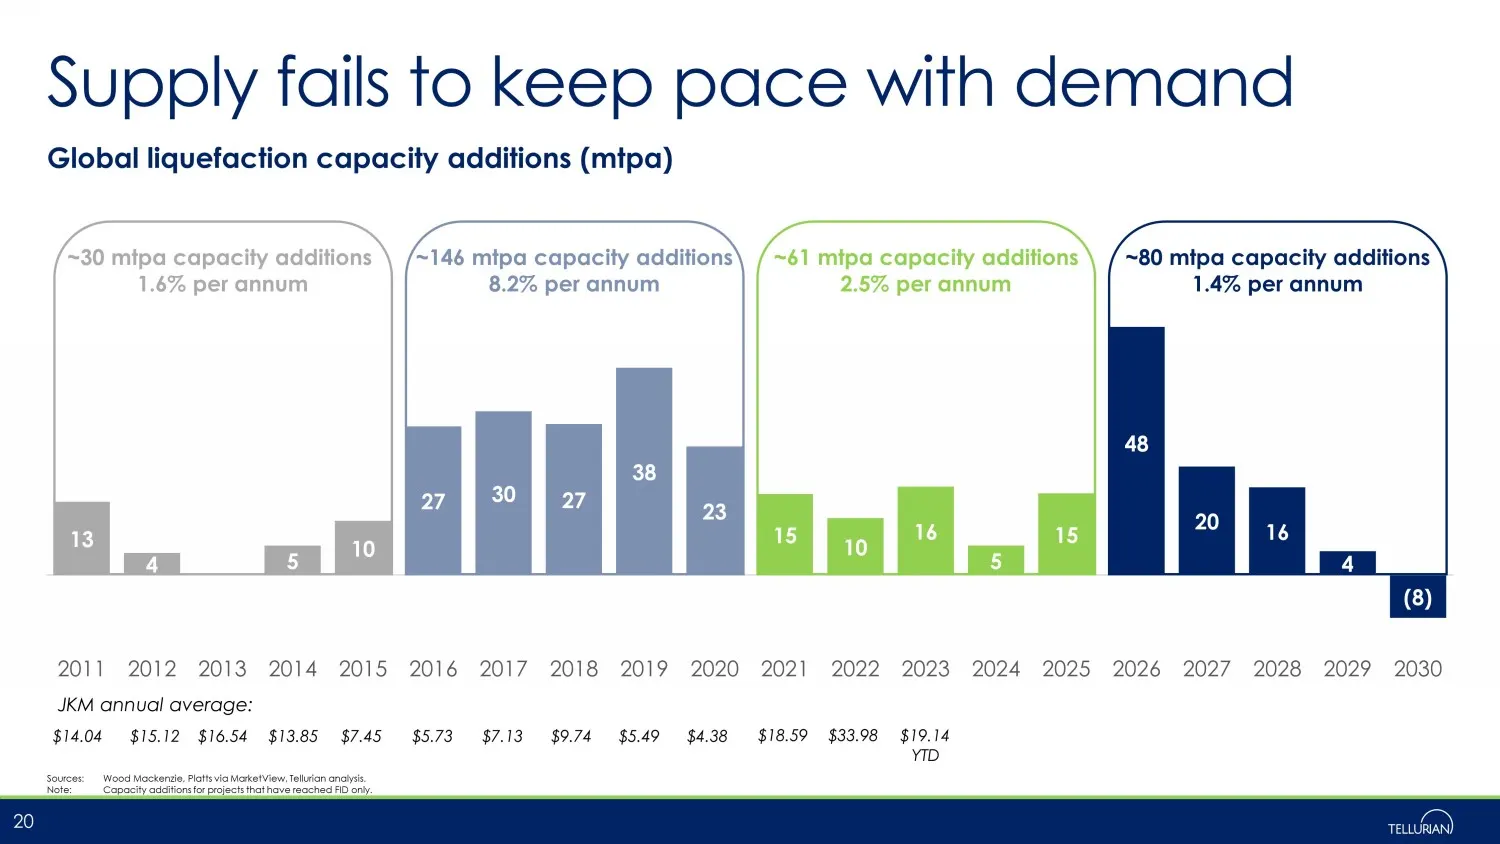
Slide 20: Supply fails to keep pace with demand
Supply fails to keep pace with demand Sources : Wood Mackenzie, Platts via MarketView , Tellurian analysis. Note: Capacity additions for projects that have reached FID only. 20 13 4 5 10 27 30 27 38 23 15 10 16 5 15 48 20 16 4 (8) 2011 2012 2013 2014 2015 2016 2017 2018 2019 2020 2021 2022 2023 2024
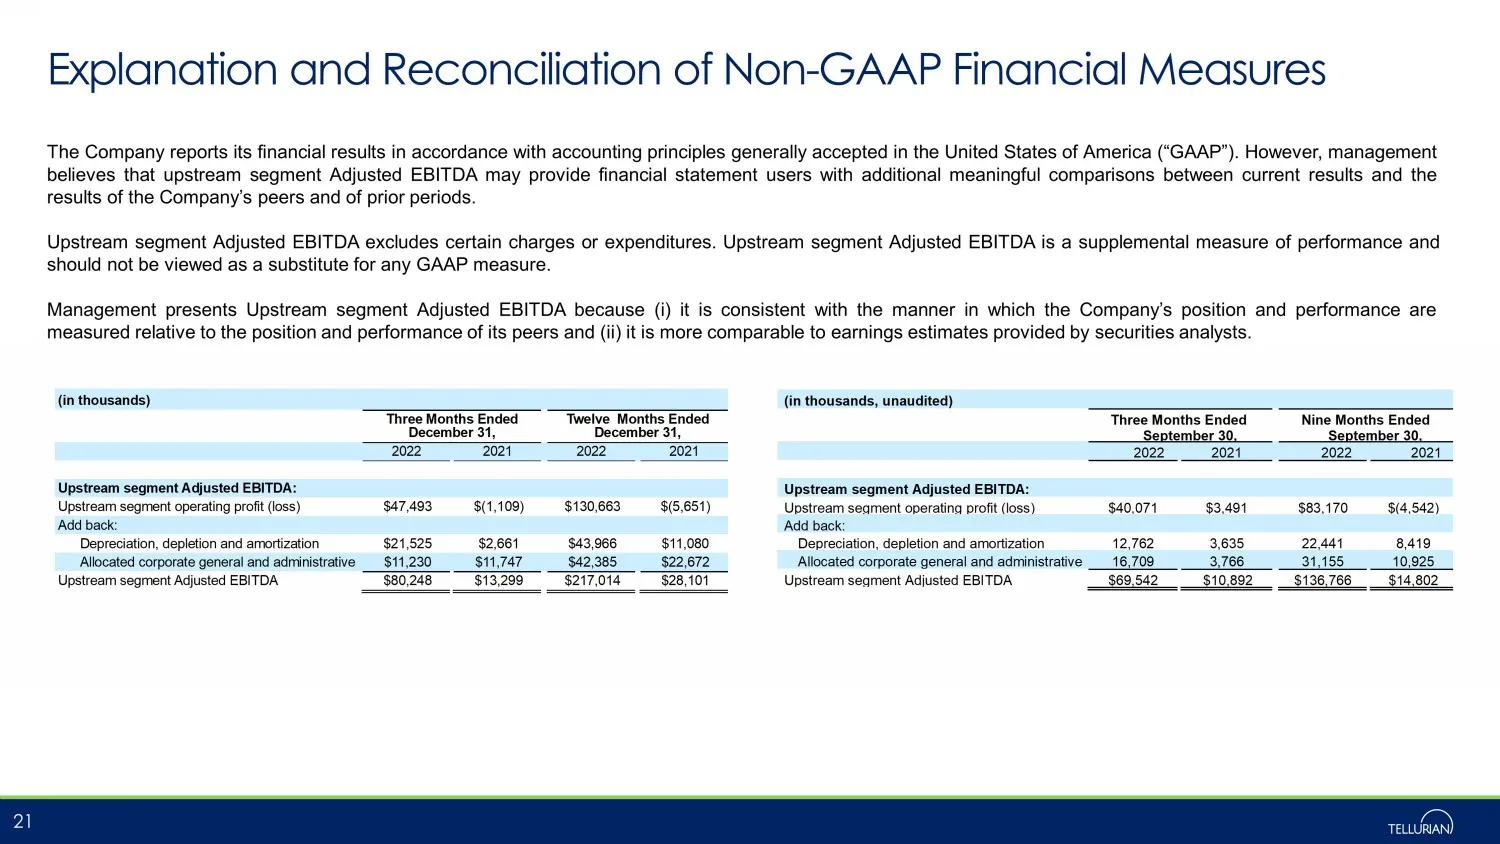
Slide 21: Non-GAAP definition and reconciliation
The Company reports its financial results in accordance with accounting principles generally accepted in the United States of America (“GAAP”) . However, management believes that upstream segment Adjusted EBITDA may provide financial statement users with additional meaningful comparisons between cur
Source: SEC EDGAR · 8-K filed Feb 22, 2023
More decks from Tellurian Inc
 Merger or Acquisition (July 2024)27 slides · Jul 22, 2024
 Investor Presentation (March 2024)16 slides · Mar 4, 2024
 Investor Presentation (August 2023)20 slides · Aug 7, 2023
 Investor Presentation (May 2023)20 slides · May 3, 2023
 Investor Presentation (November 2022)19 slides · Nov 2, 2022
 Investor Presentation (July 2022)18 slides · Jul 13, 2022