Southern Union — Lehman Brothers 2006 CEO Energy/Power Conference
30 slides from Southern Union's conference presentation, Sep 5, 2006
Slide 1: Lehman Brothers 2006 CEO Energy/Power Conference
Lehman Brothers 2006 CEO Energy/Power Conference New York September 6, 2006 www.sug.com

Slide 2: Forward-Looking Statements
Forward-Looking Statements Statements contained in this presentation that include company expectations or predictions of the future are forward-looking statements intended to be covered by the safe harbor provisions of the Securities Act of 1933 and the Securities Exchange Act of 1934. It is importa
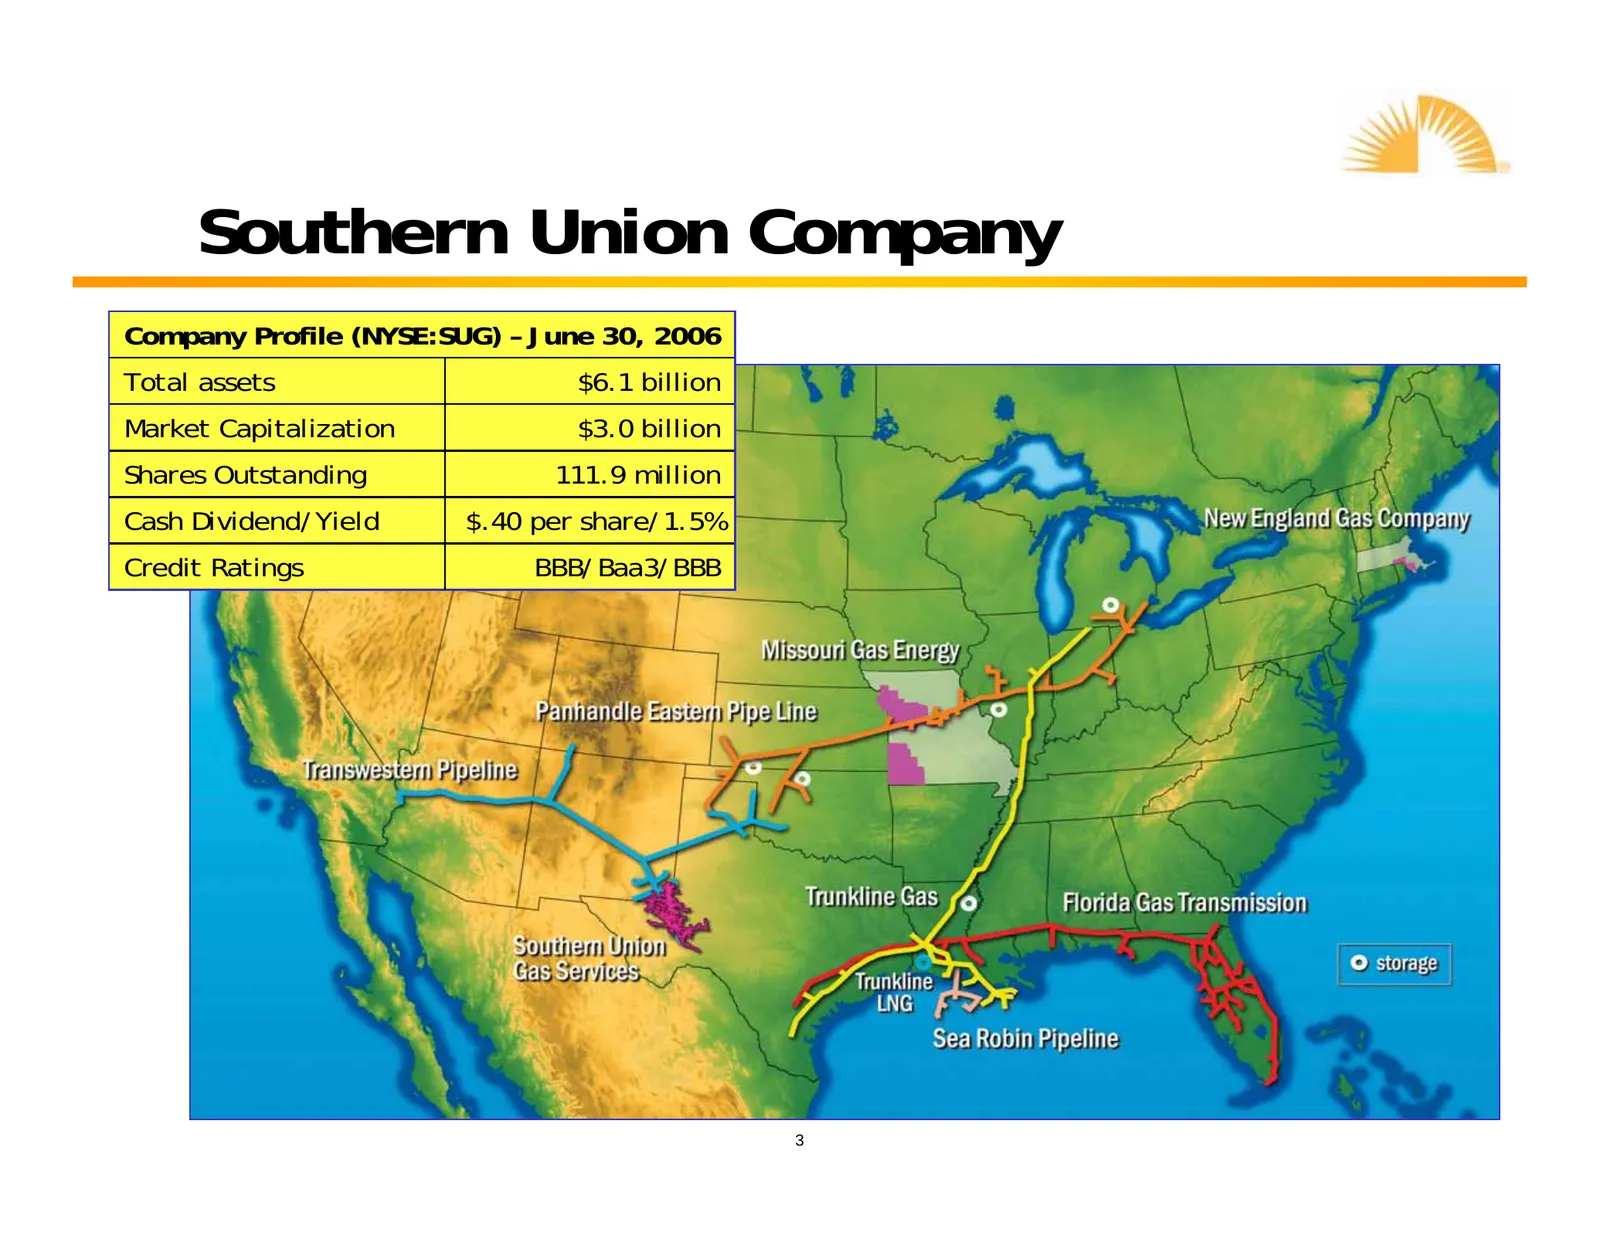
Slide 3: Southern Union Company Profile
Southern Union Company Company Profile (NYSE:SUG) – June 30, 2006 Total assets $6.1 billion Market Capitalization $3.0 billion Shares Outstanding 111.9 million Cash Dividend/Yield $.40 per share/1.5% Credit Ratings BBB/Baa3/BBB 3
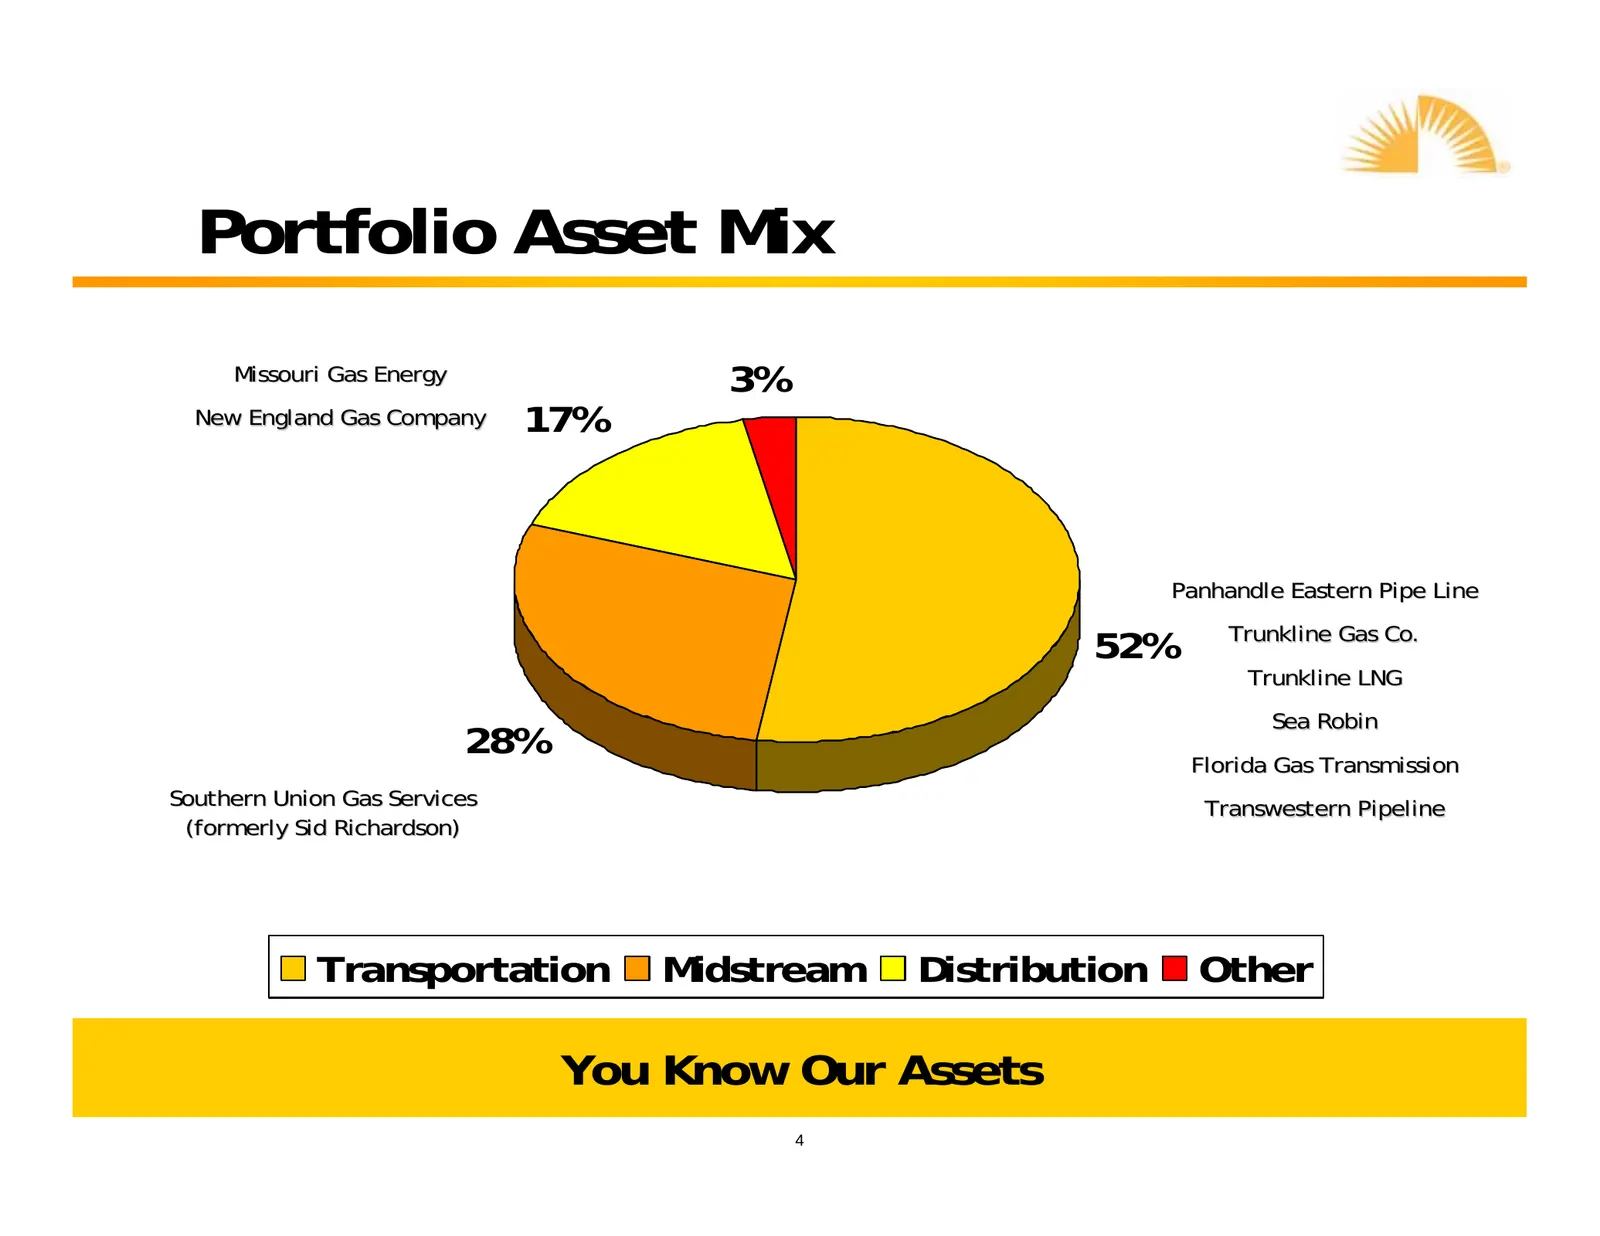
Slide 4: Portfolio Asset Mix
Portfolio Asset Mix Missouri Gas Energy 3% New England Gas Company 17% Panhandle Eastern Pipe Line Trunkline Gas Co. 52% Trunkline LNG Sea Robin 28% Florida Gas Transmission Southern Union Gas Services Transwestern Pipeline (formerly Sid Richardson) Transportation Midstream Distribution Other You Kn
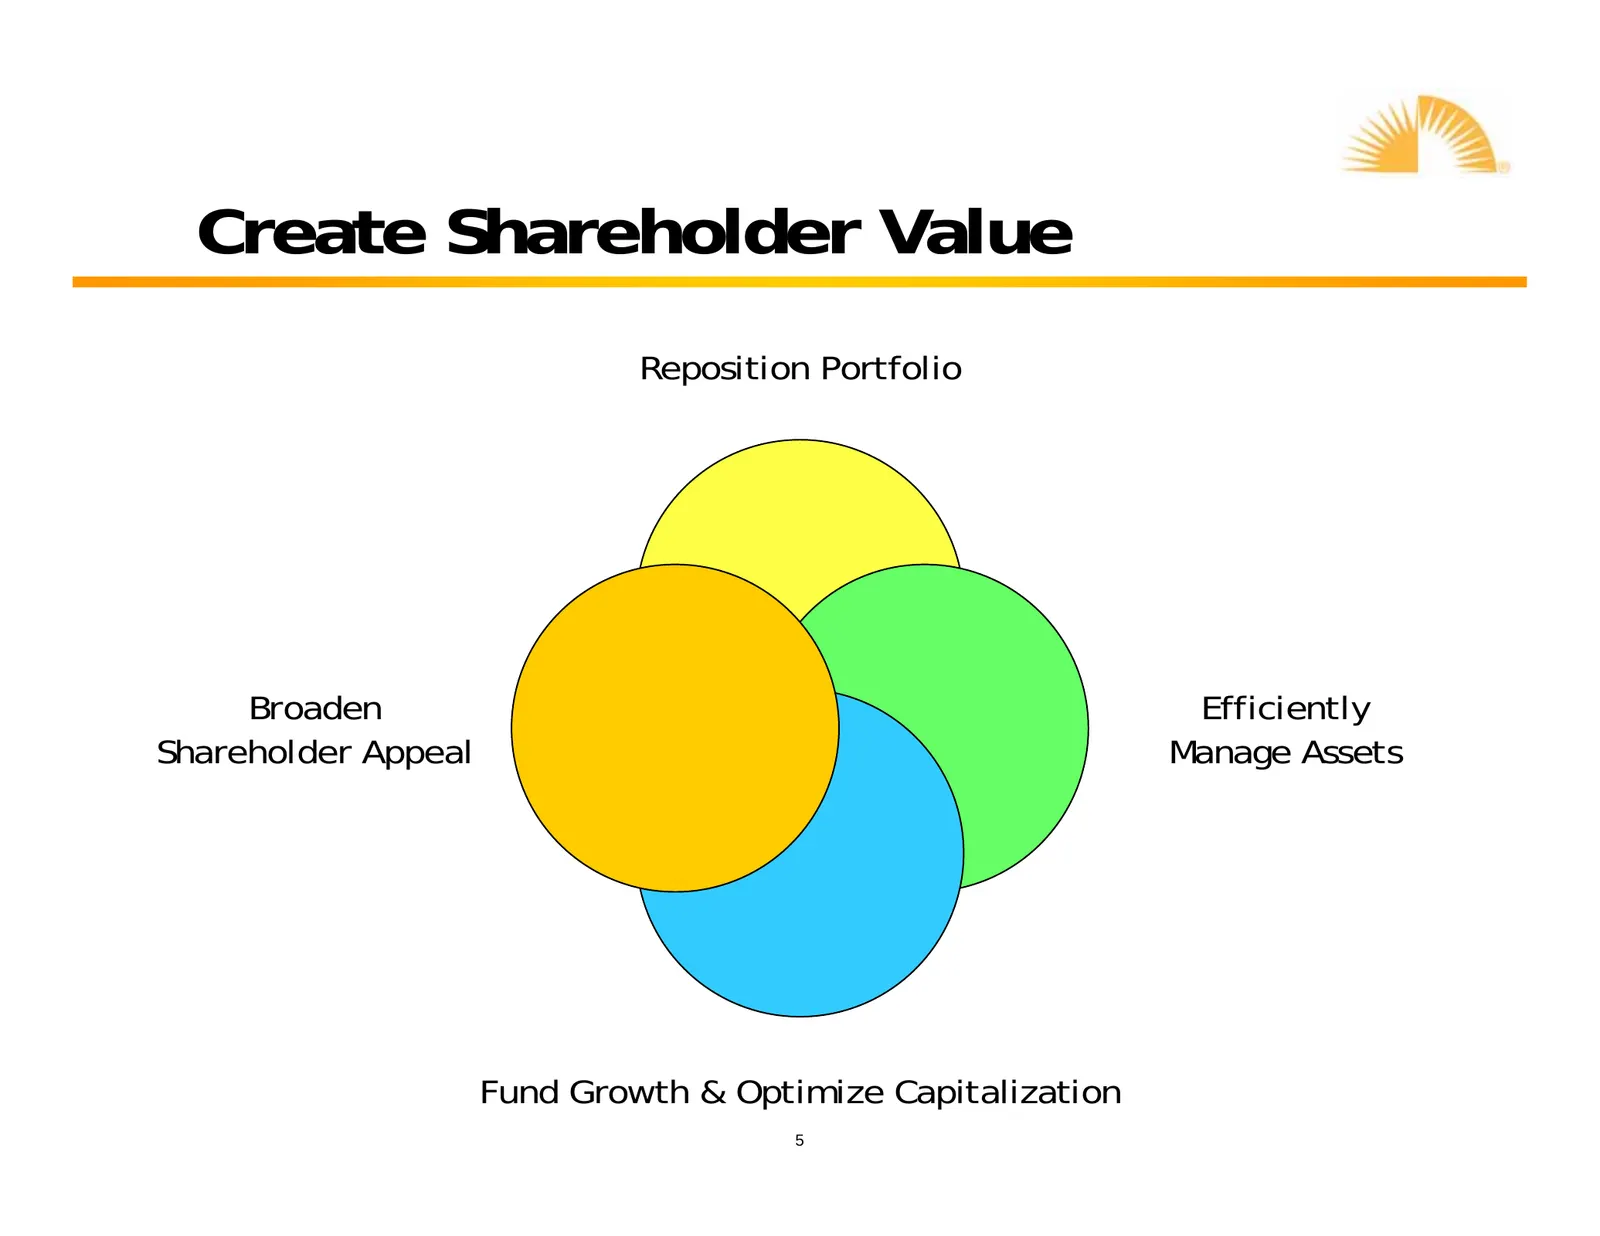
Slide 5: Create Shareholder Value
Create Shareholder Value Reposition Portfolio Broaden Efficiently Shareholder Appeal Manage Assets Fund Growth & Optimize Capitalization 5
Slide 6: Reposition Portfolio
Reposition Portfolio 9 Building portfolio of franchise-quality assets 9 Repositioning portfolio to higher returning businesses – 2003: Acquisition of Panhandle Energy/Sale of Texas distribution assets – 2004: Investment in Cross Country – 2006: Acquisition of Sid Richardson/Sale of PA & RI distribut
Slide 7: Efficiently Manage Assets
Efficiently Manage Assets 9Efficiently manage existing assets – Integrating Panhandle and Cross Country produced synergies of $25MM – Pursuing rate cases at both LDCs – Driving future savings and efficiencies with shared services Assets Managed to Maximize Free Cash Flow 7
Slide 8: Fund Growth & Optimize Capitalization
Fund Growth & Optimize Capitalization 9Utilize free cash flow to fund growth and optimize capitalization – Reinvest in high returning growth projects • Trunkline LNG • Trunkline Field Zone Expansion • SUGS projects – Optimize debt level – maximize return to shareholders • Conversion of $125MM equity
Slide 9: Broaden Shareholder Appeal
Broaden Shareholder Appeal 9SUG is taking steps to appeal to more investors including: – Changing fiscal year end from June to December – Implementing $.40 per share cash dividend in 2006 – Improving shareholder communications Raising Profile through Clarity 9
Slide 10: Delivering Value
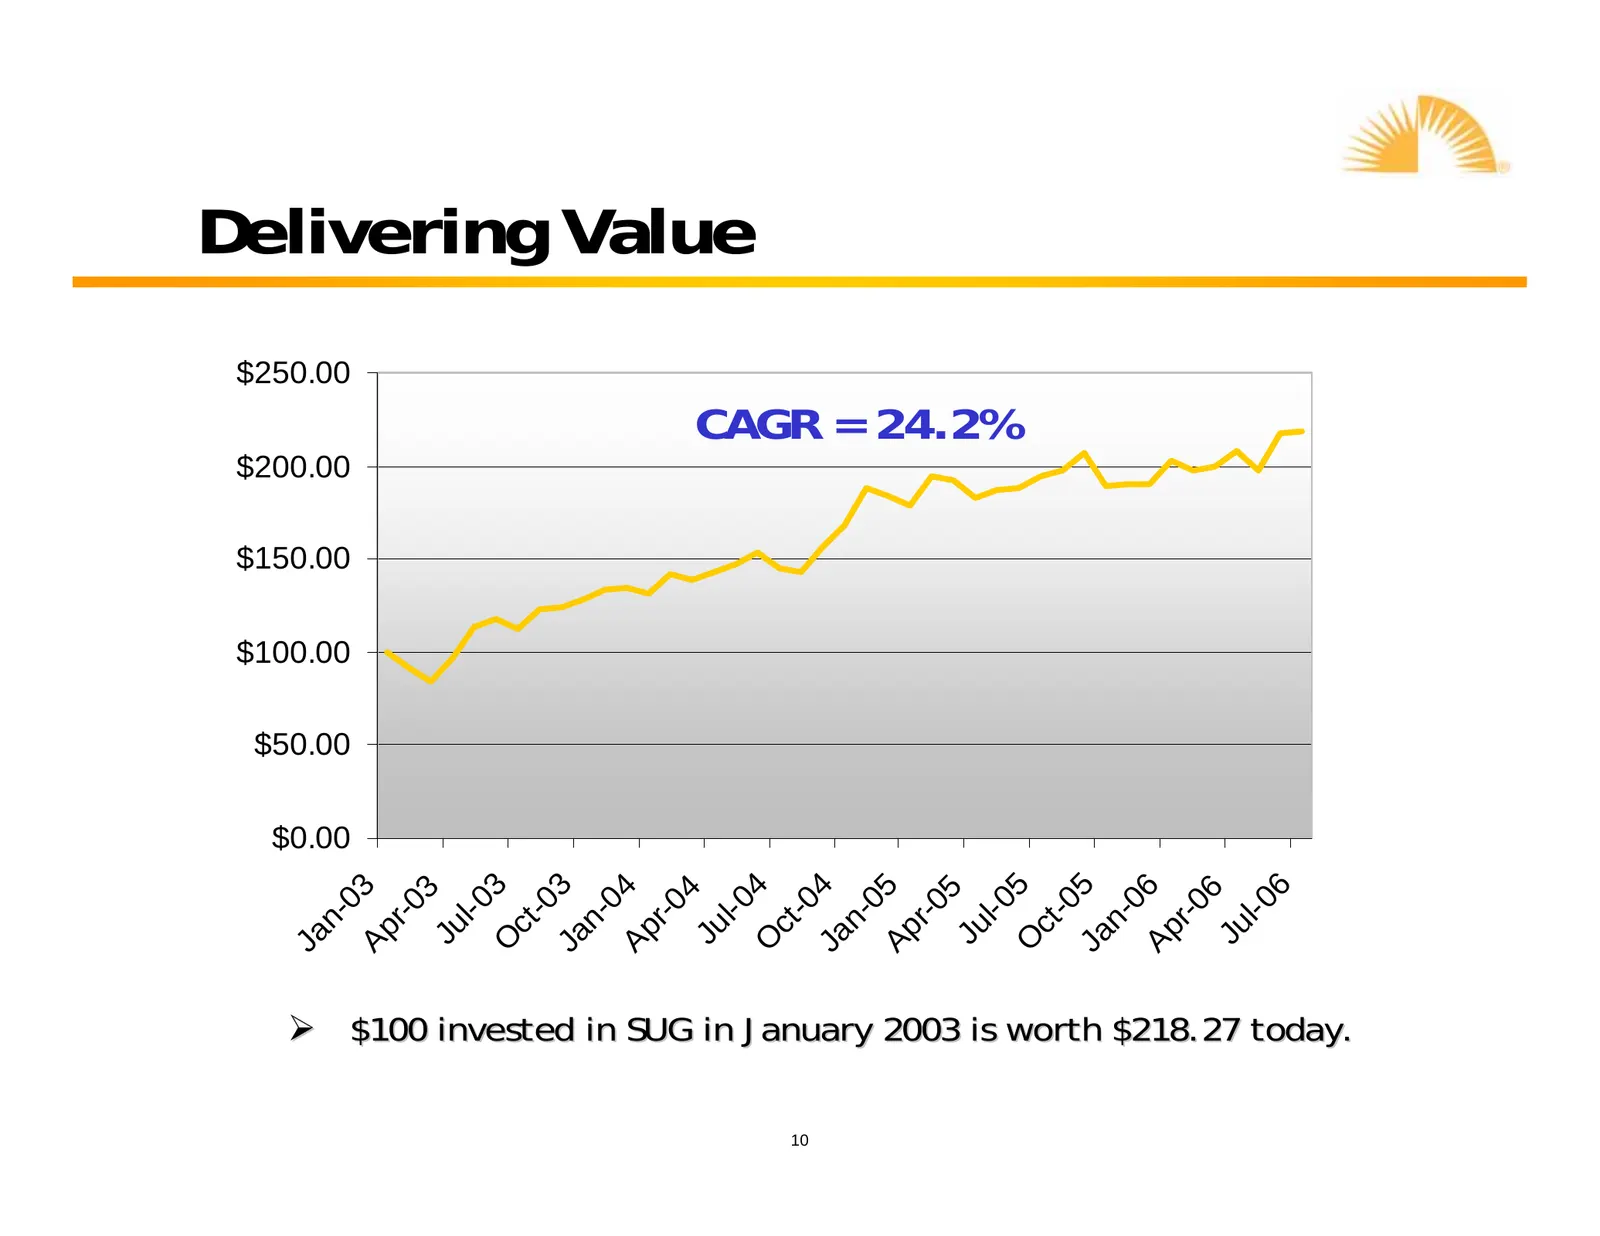
Delivering Value $250.00 CAGR = 24.2% $200.00 $150.00 $100.00 $50.00 $0.00 O 3 O 4 O 5 6 Ja 3 Ja 4 Ja 5 Ap 3 Ap 4 Ap 5 Ap 6 3 4 5 6 l-0 l-0 l-0 l-0 -0 -0 -0 0 0 0 0 r-0 r-0 r-0 r-0 n- n- n- n- ct ct ct Ju Ju Ju Ju Ja ¾ $100 invested in SUG in January 2003 is worth $218.27 today. 10
Slide 11: Consistent EPS Growth
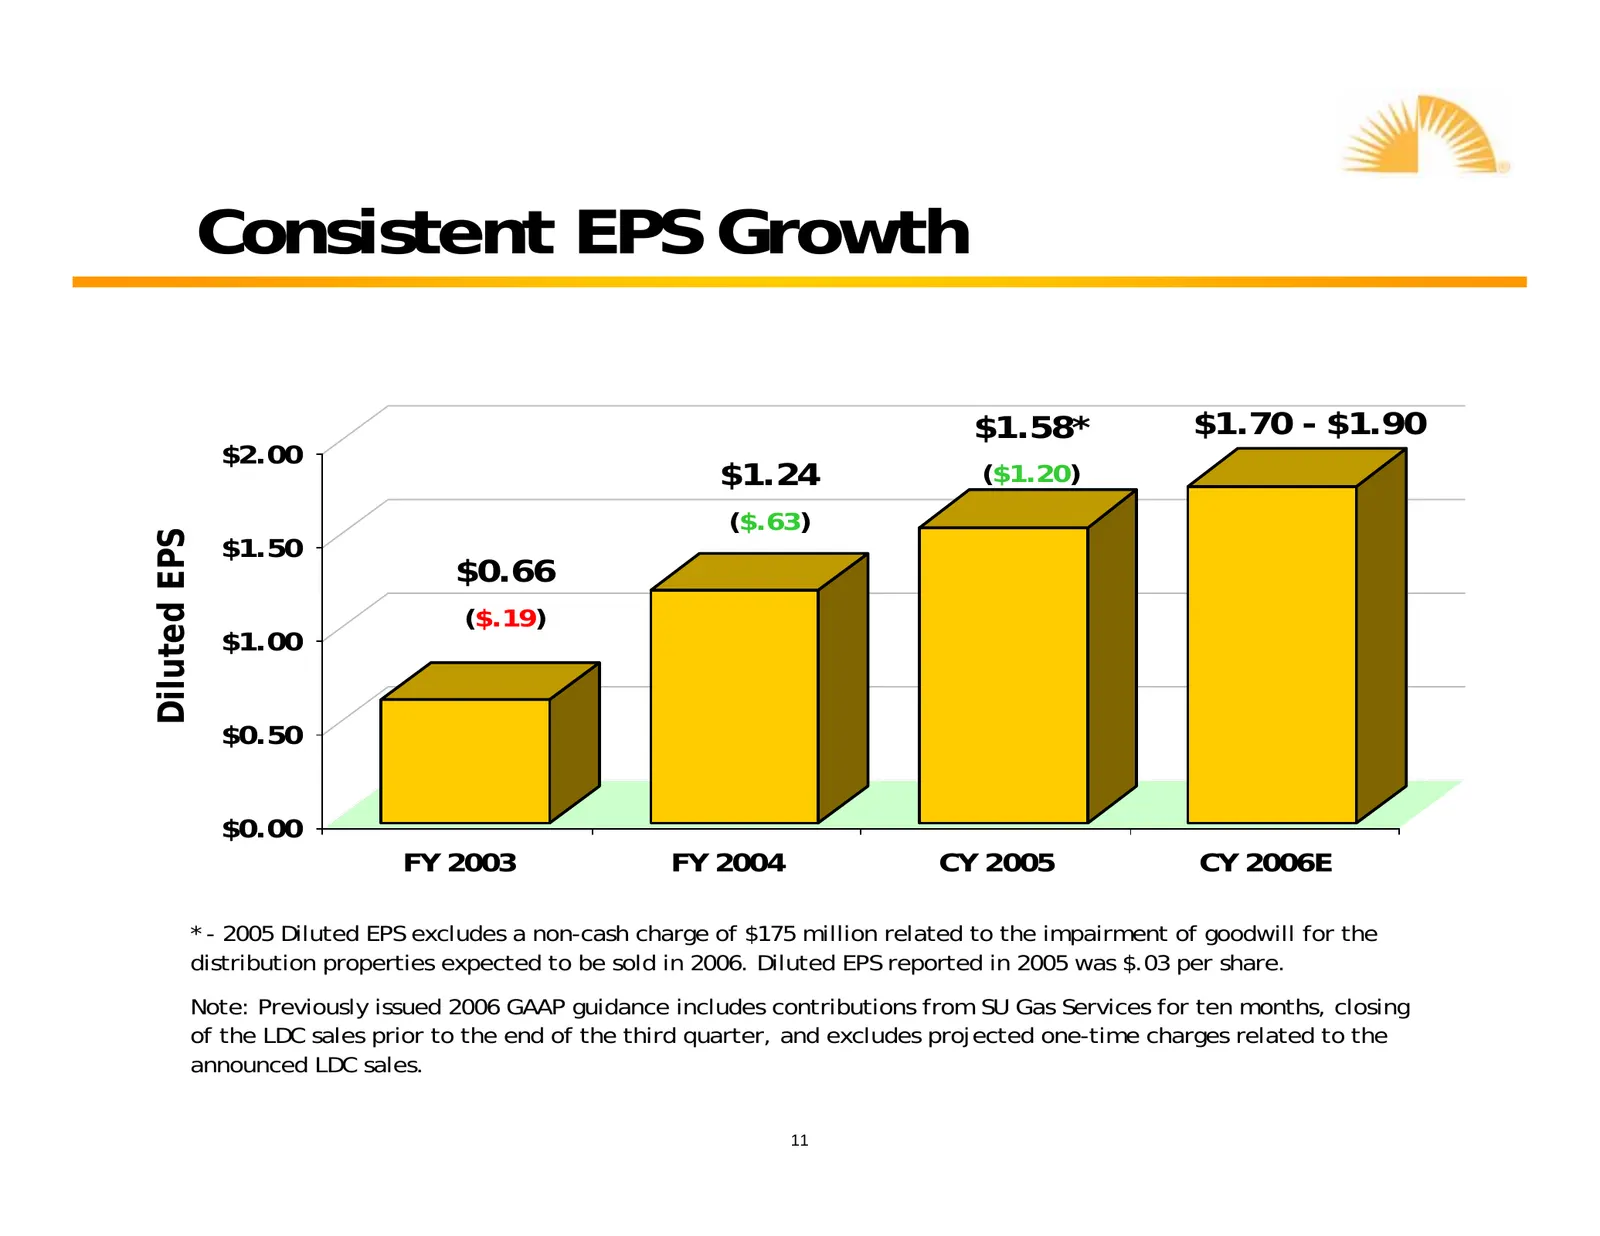
Consistent EPS Growth $1.58* $1.70 - $1.90 $2.00 $1.24 ($1.20) ($.63) $1.50 Diluted EPS $0.66 ($.19) $1.00 $0.50 $0.00 FY 2003 FY 2004 CY 2005 CY 2006E * - 2005 Diluted EPS excludes a non-cash charge of $175 million related to the impairment of goodwill for the distribution properties expected to be
Slide 12: Strong Cash Generator
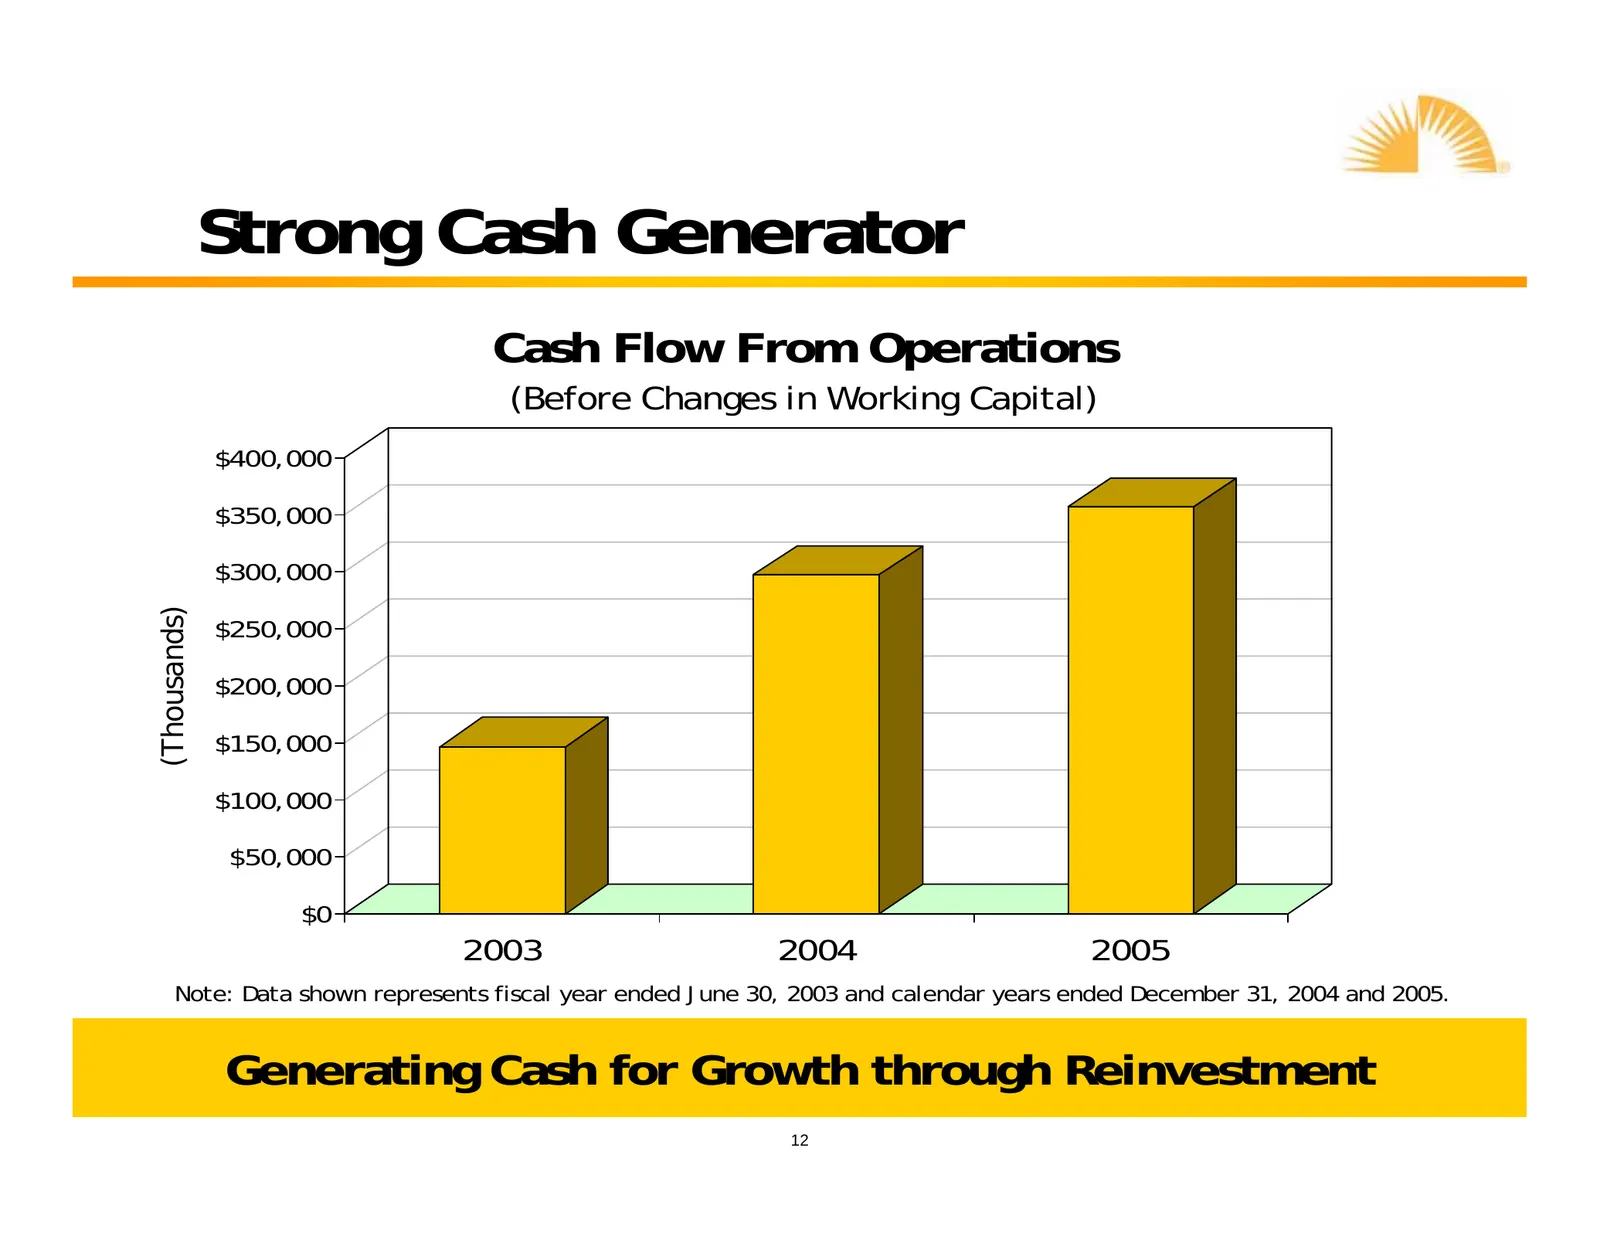
Strong Cash Generator Cash Flow From Operations (Before Changes in Working Capital) $400,000 $350,000 $300,000 (Thousands) $250,000 $200,000 $150,000 $100,000 $50,000 $0 2003 2004 2005 Note: Data shown represents fiscal year ended June 30, 2003 and calendar years ended December 31, 2004 and 2005. Ge
Slide 13: Diversified Earnings Base
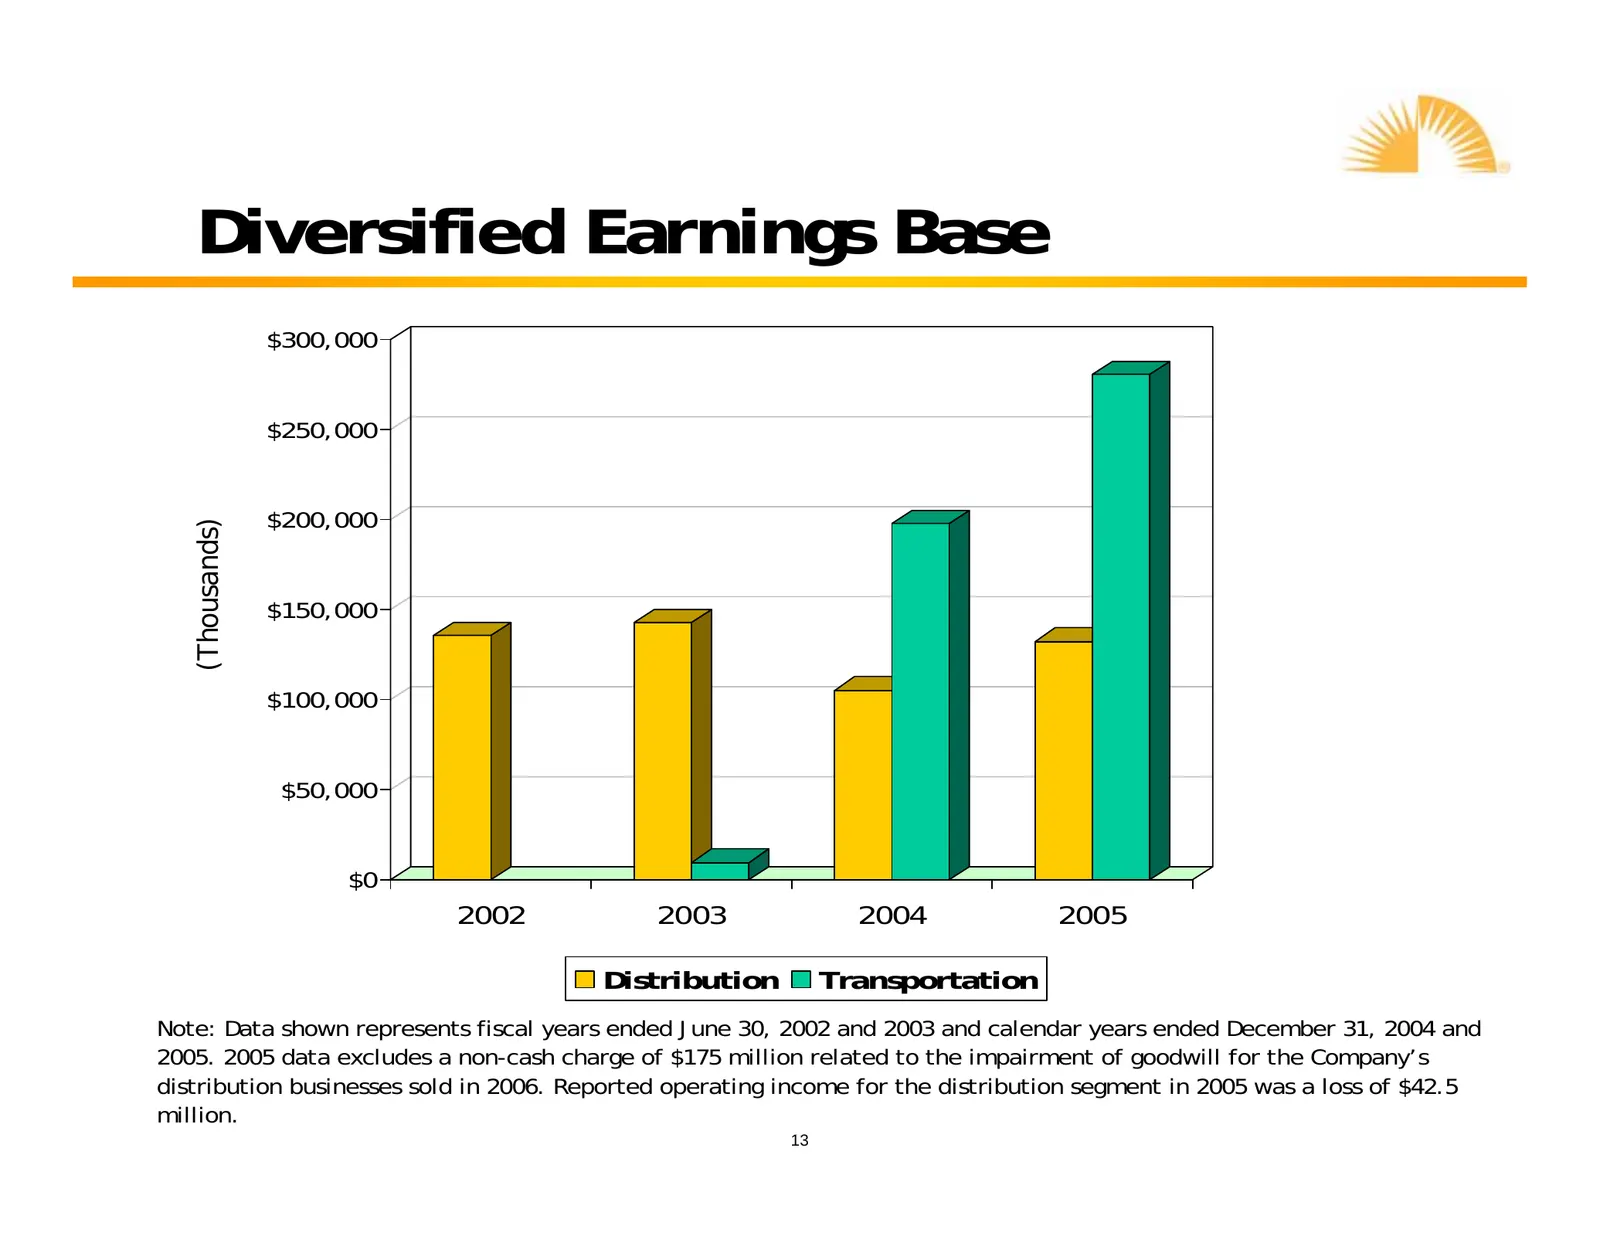
Diversified Earnings Base $300,000 $250,000 $200,000 (Thousands) $150,000 $100,000 $50,000 $0 2002 2003 2004 2005 Distribution Transportation Note: Data shown represents fiscal years ended June 30, 2002 and 2003 and calendar years ended December 31, 2004 and 2005. 2005 data excludes a non-cash charg
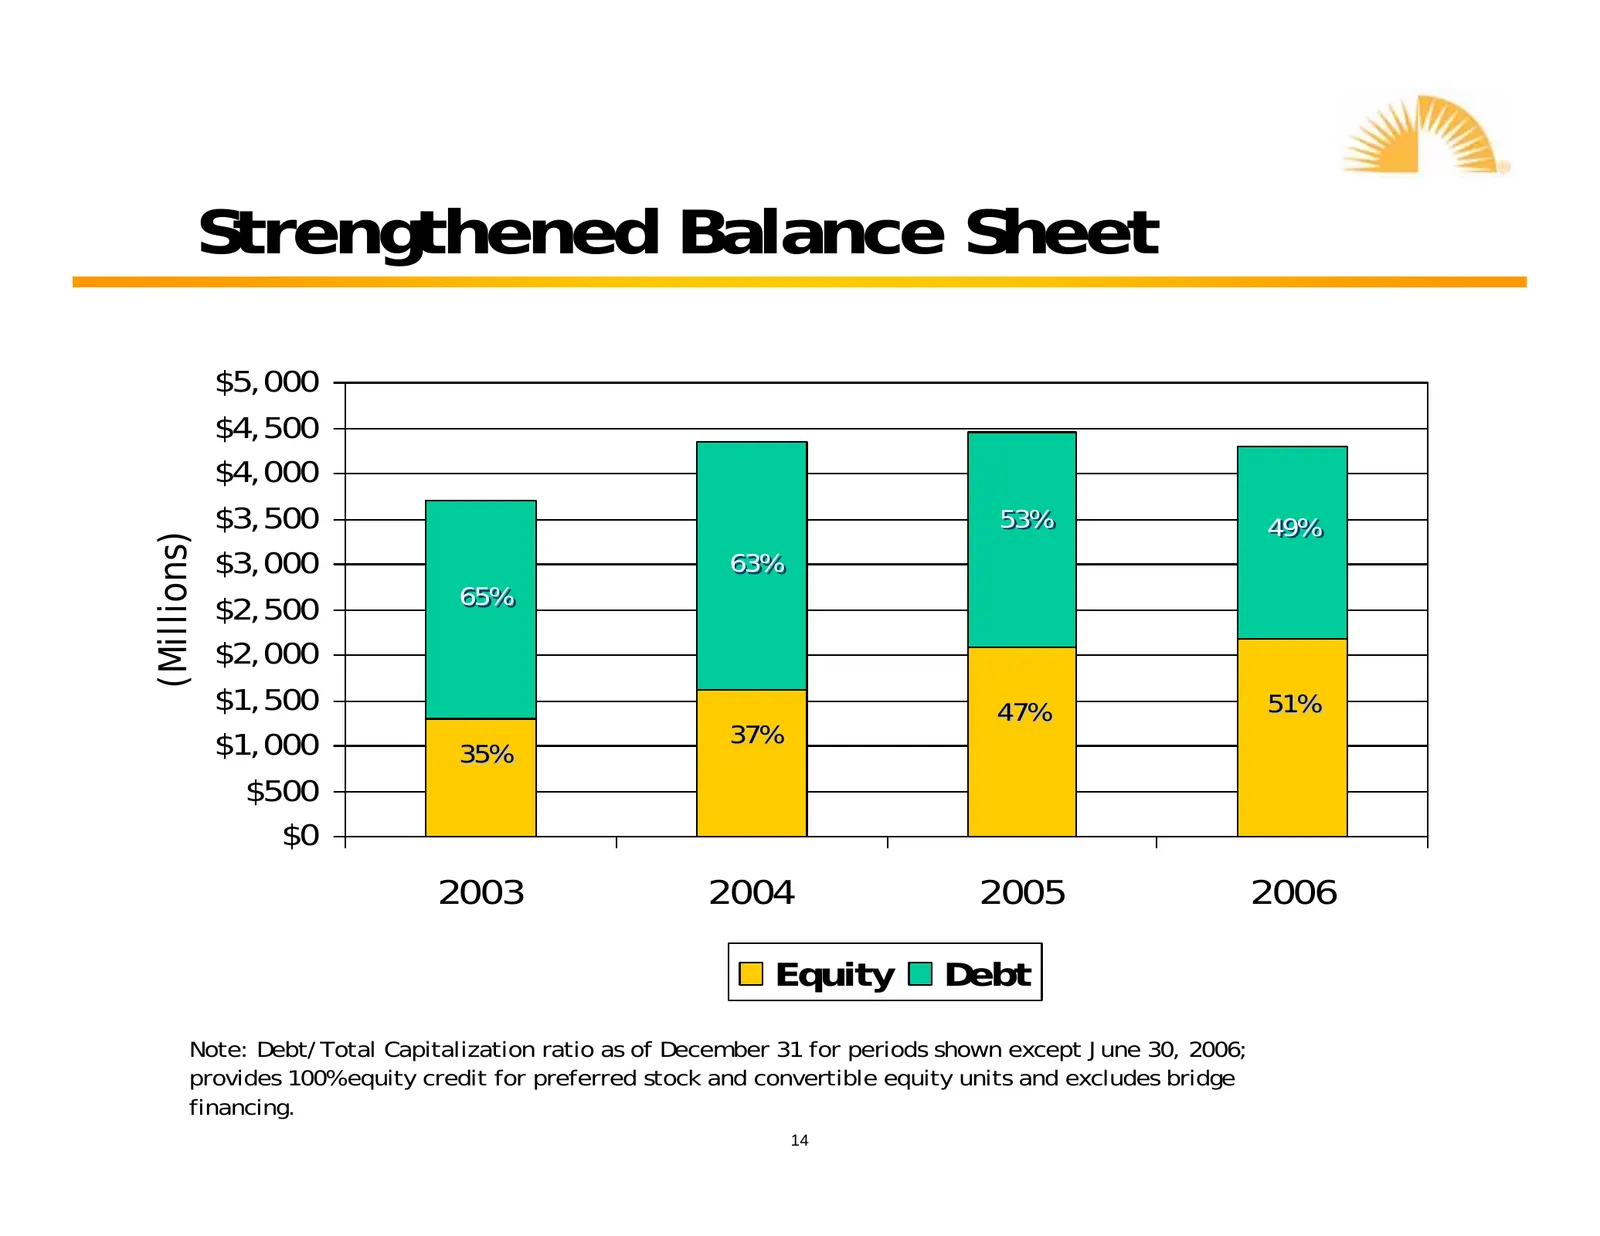
Slide 14: Strengthened Balance Sheet
Strengthened Balance Sheet $5,000 $4,500 $4,000 $3,500 53% 49% (Millions) $3,000 63% $2,500 65% $2,000 $1,500 47% 51% $1,000 37% 35% $500 $0 2003 2004 2005 2006 Equity Debt Note: Debt/Total Capitalization ratio as of December 31 for periods shown except June 30, 2006; provides 100% equity credit for
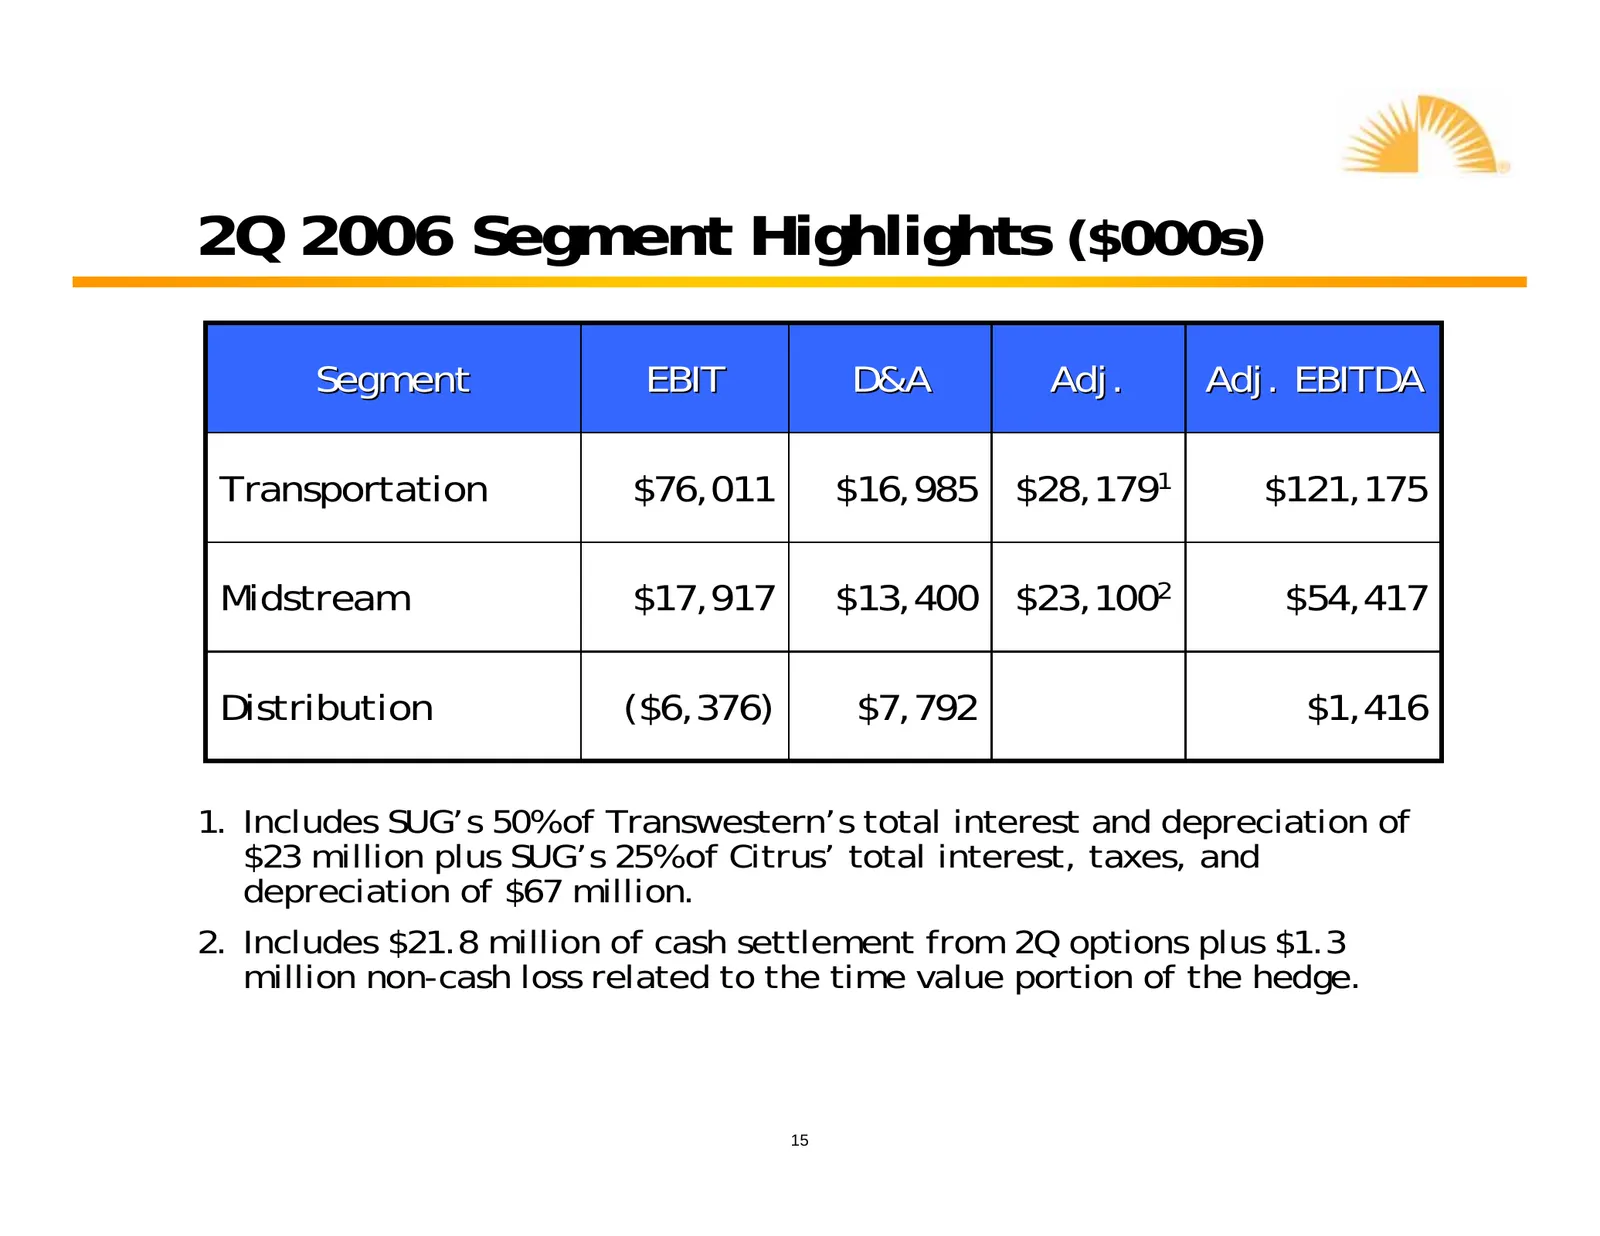
Slide 15: 2Q 2006 Segment Highlights ($000s)
2Q 2006 Segment Highlights ($000s) Segment EBIT D&A Adj. Adj. EBITDA Transportation $76,011 $16,985 $28,1791 $121,175 Midstream $17,917 $13,400 $23,1002 $54,417 Distribution ($6,376) $7,792 $1,416 1. Includes SUG’s 50% of Transwestern’s total interest and depreciation of $23 million plus SUG’s 25% o
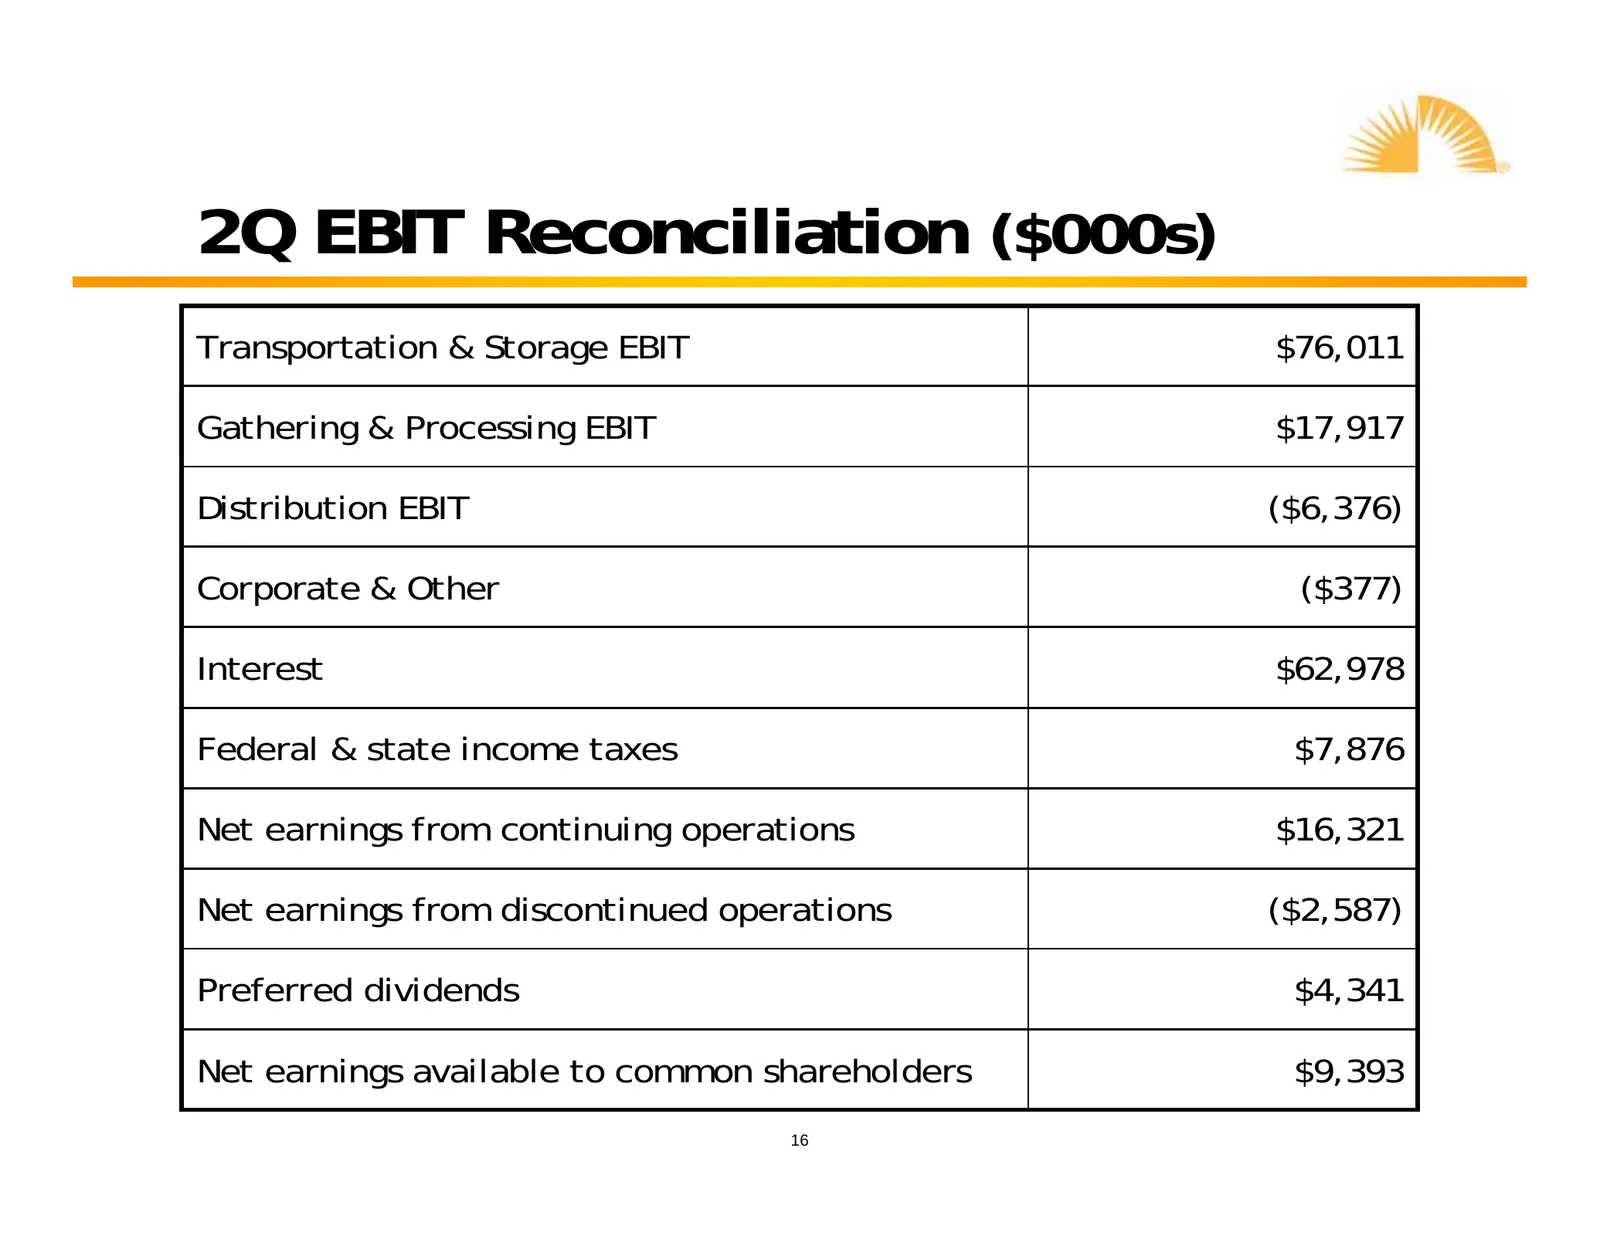
Slide 16: 2Q EBIT Reconciliation ($000s)
2Q EBIT Reconciliation ($000s) Transportation & Storage EBIT $76,011 Gathering & Processing EBIT $17,917 Distribution EBIT ($6,376) Corporate & Other ($377) Interest $62,978 Federal & state income taxes $7,876 Net earnings from continuing operations $16,321 Net earnings from discontinued operations
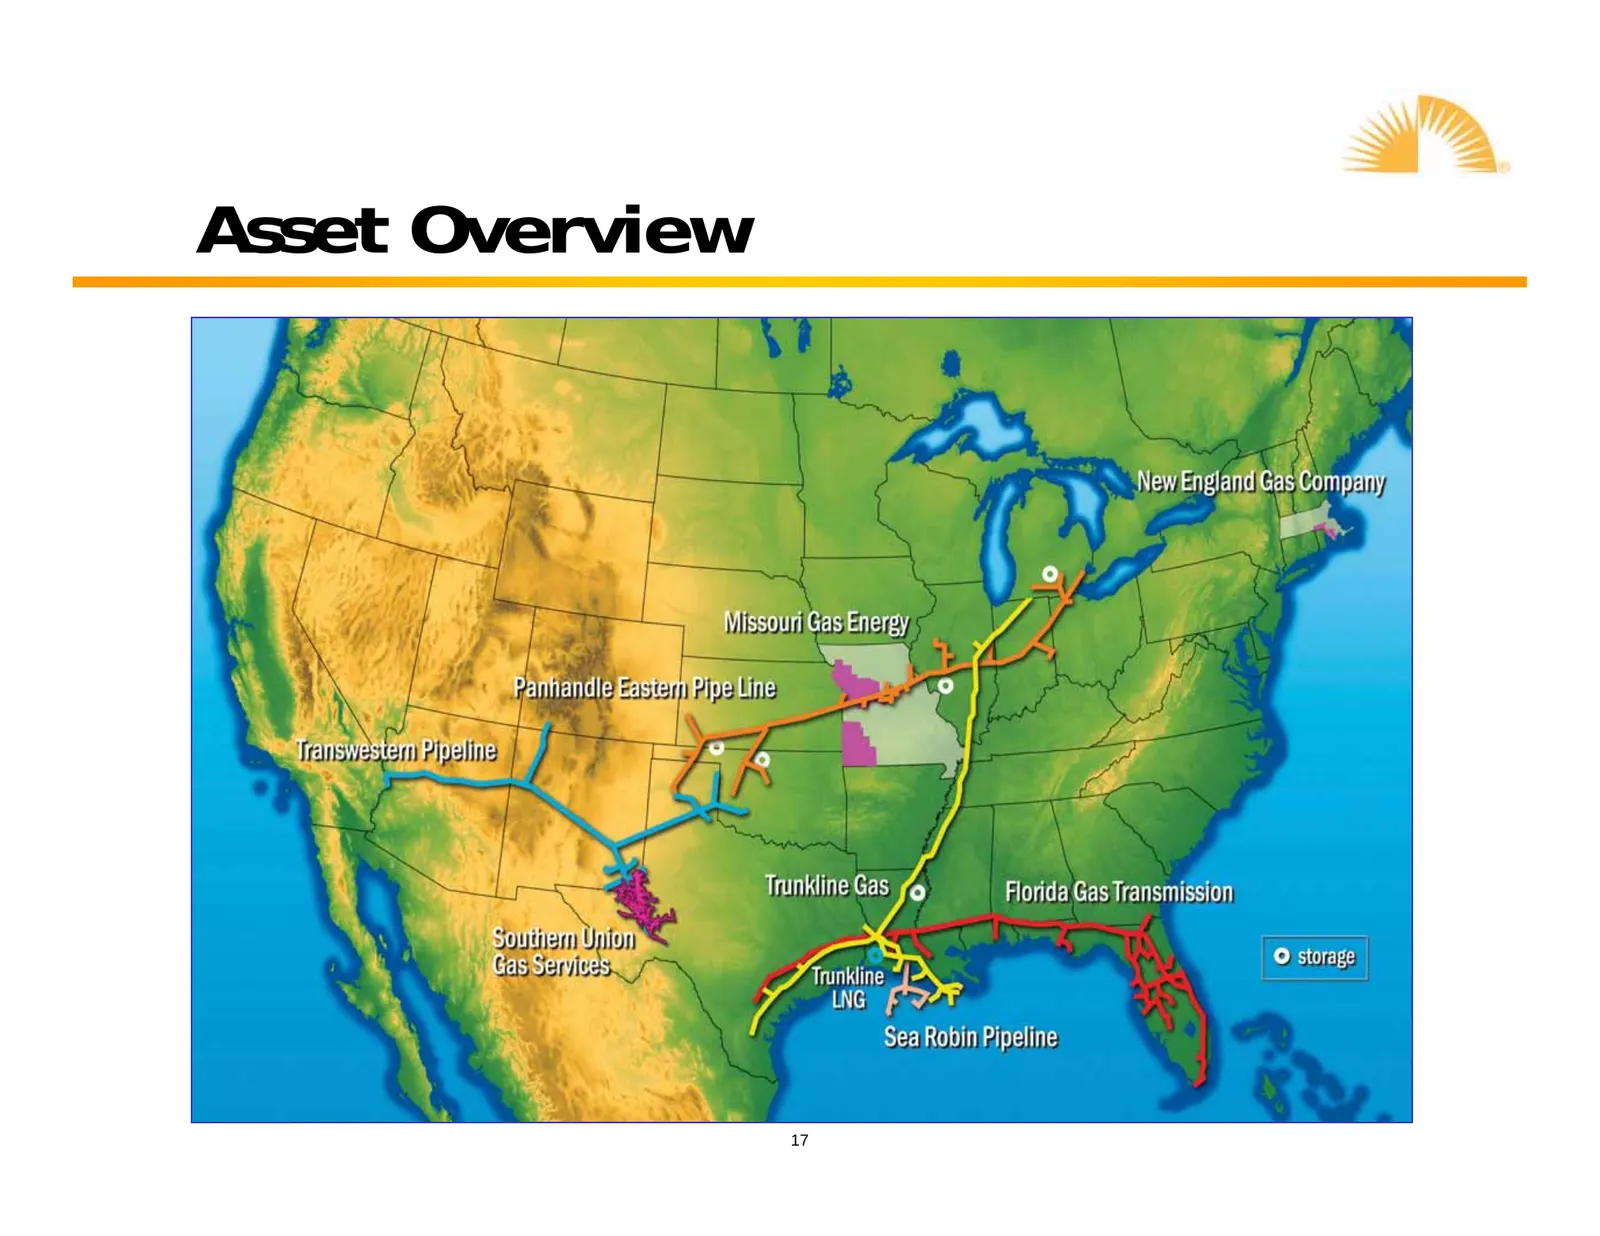
Slide 17: Asset Overview
‘se a a NEW Enea Come =m -¥— | _ = 7 oe aa soln Gas Energy | : 5 pF eae be See i Lee ita Pesinivali fle Swe re Kim PIDENES j ian Trunkline Gas / Florida Gas Transmission Th Trunkline = A LNG ie y Sea Robin Pipeline O storage
Slide 18: Distribution Assets
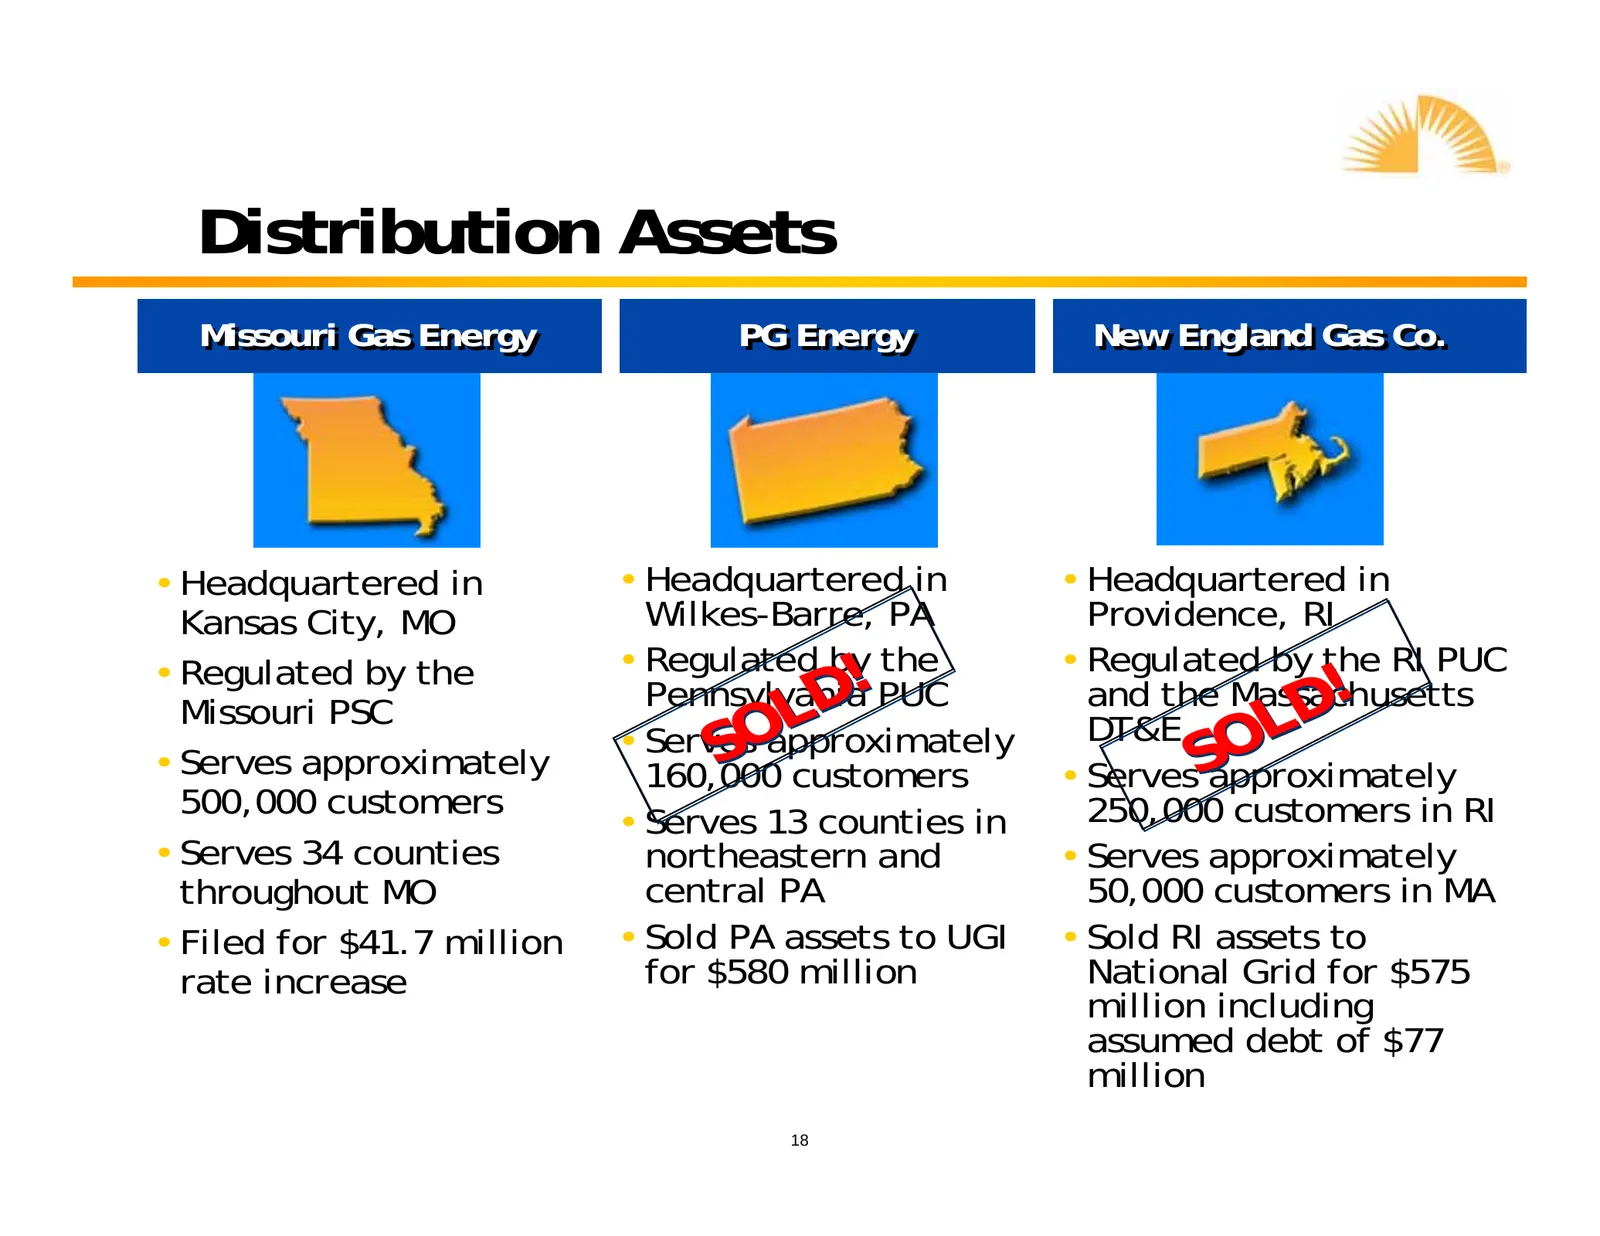
Distribution Assets Missouri Missouri Gas Gas Energy Energy PG PG Energy Energy New New England England Gas Gas Co. Co. • Headquartered in • Headquartered in • Headquartered in Kansas City, MO Wilkes-Barre, PA Providence, RI • Regulated by the D ! • Regulated by the • Regulated by the RI PUC D ! Mis
Slide 19: Transportation & Storage Business
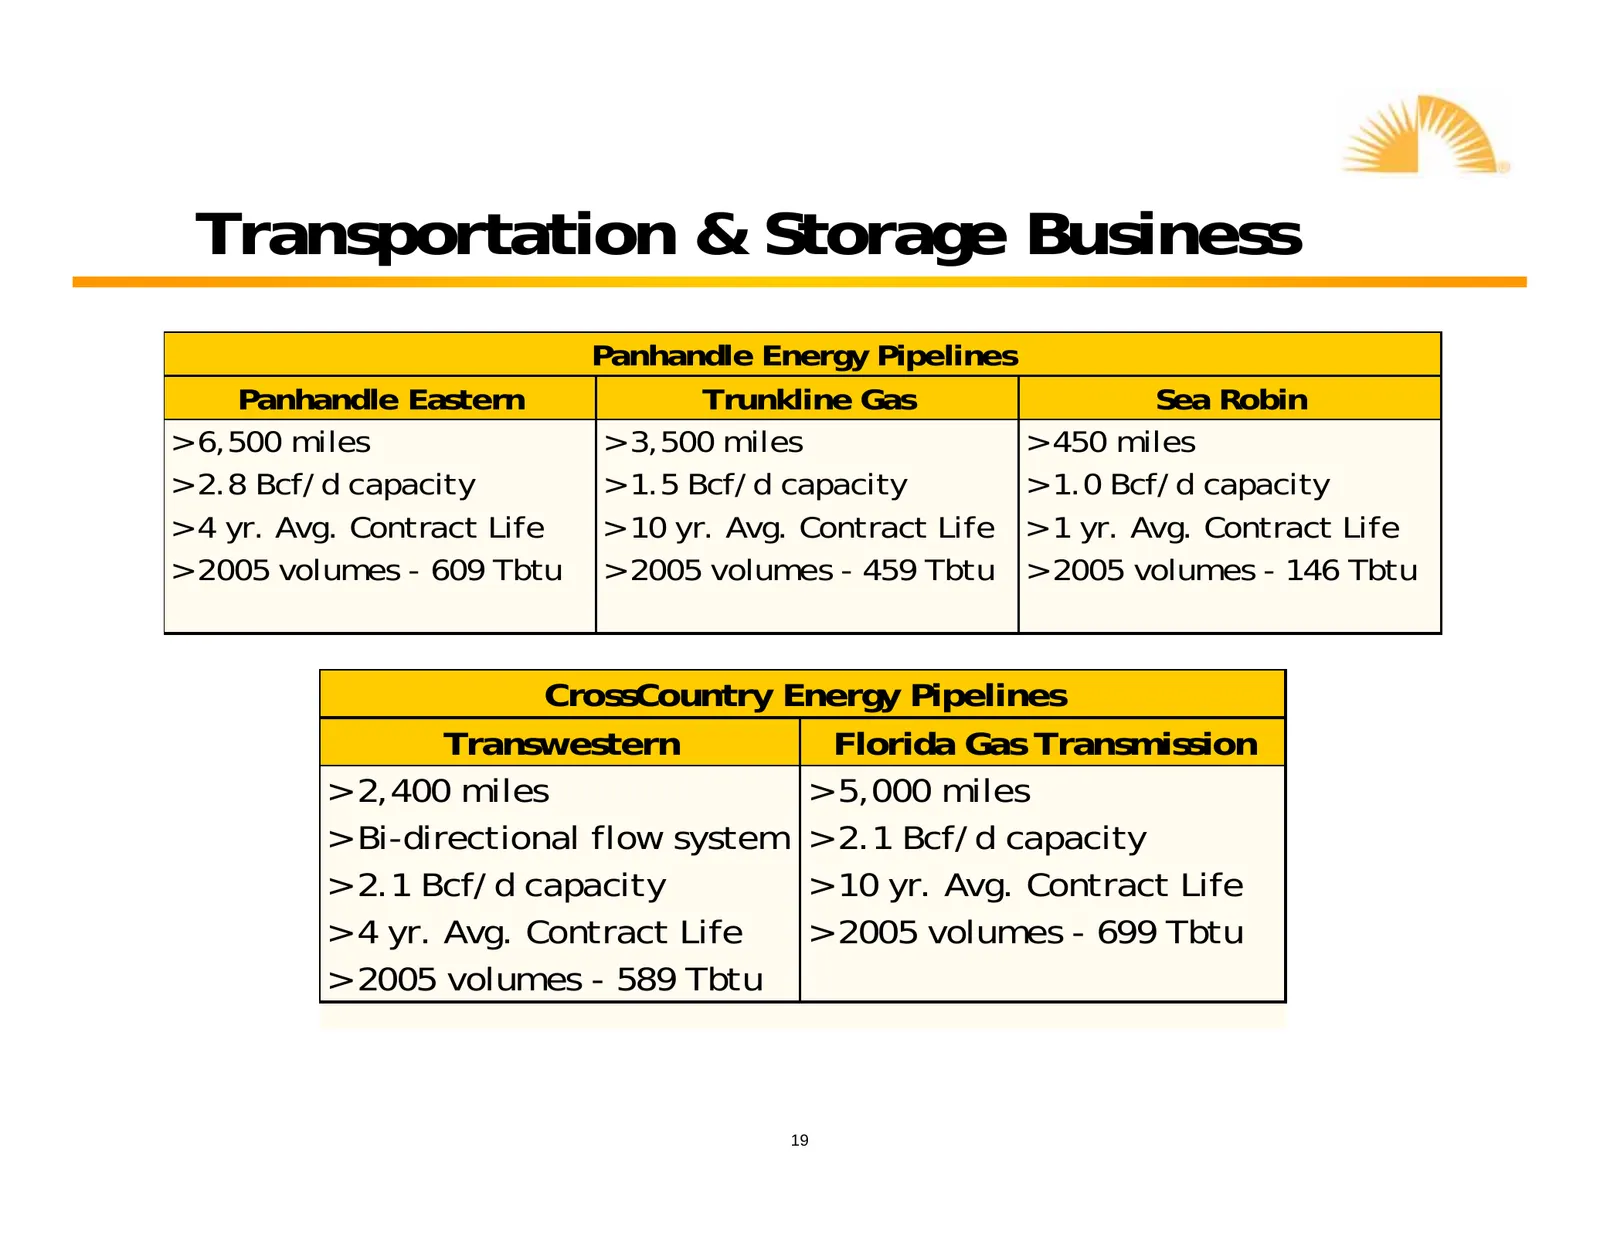
Transportation & Storage Business Panhandle Energy Pipelines Panhandle Eastern Trunkline Gas Sea Robin > 6,500 miles > 3,500 miles > 450 miles > 2.8 Bcf/d capacity > 1.5 Bcf/d capacity > 1.0 Bcf/d capacity > 4 yr. Avg. Contract Life > 10 yr. Avg. Contract Life > 1 yr. Avg. Contract Life > 2005 volum
Slide 20: Key Characteristics
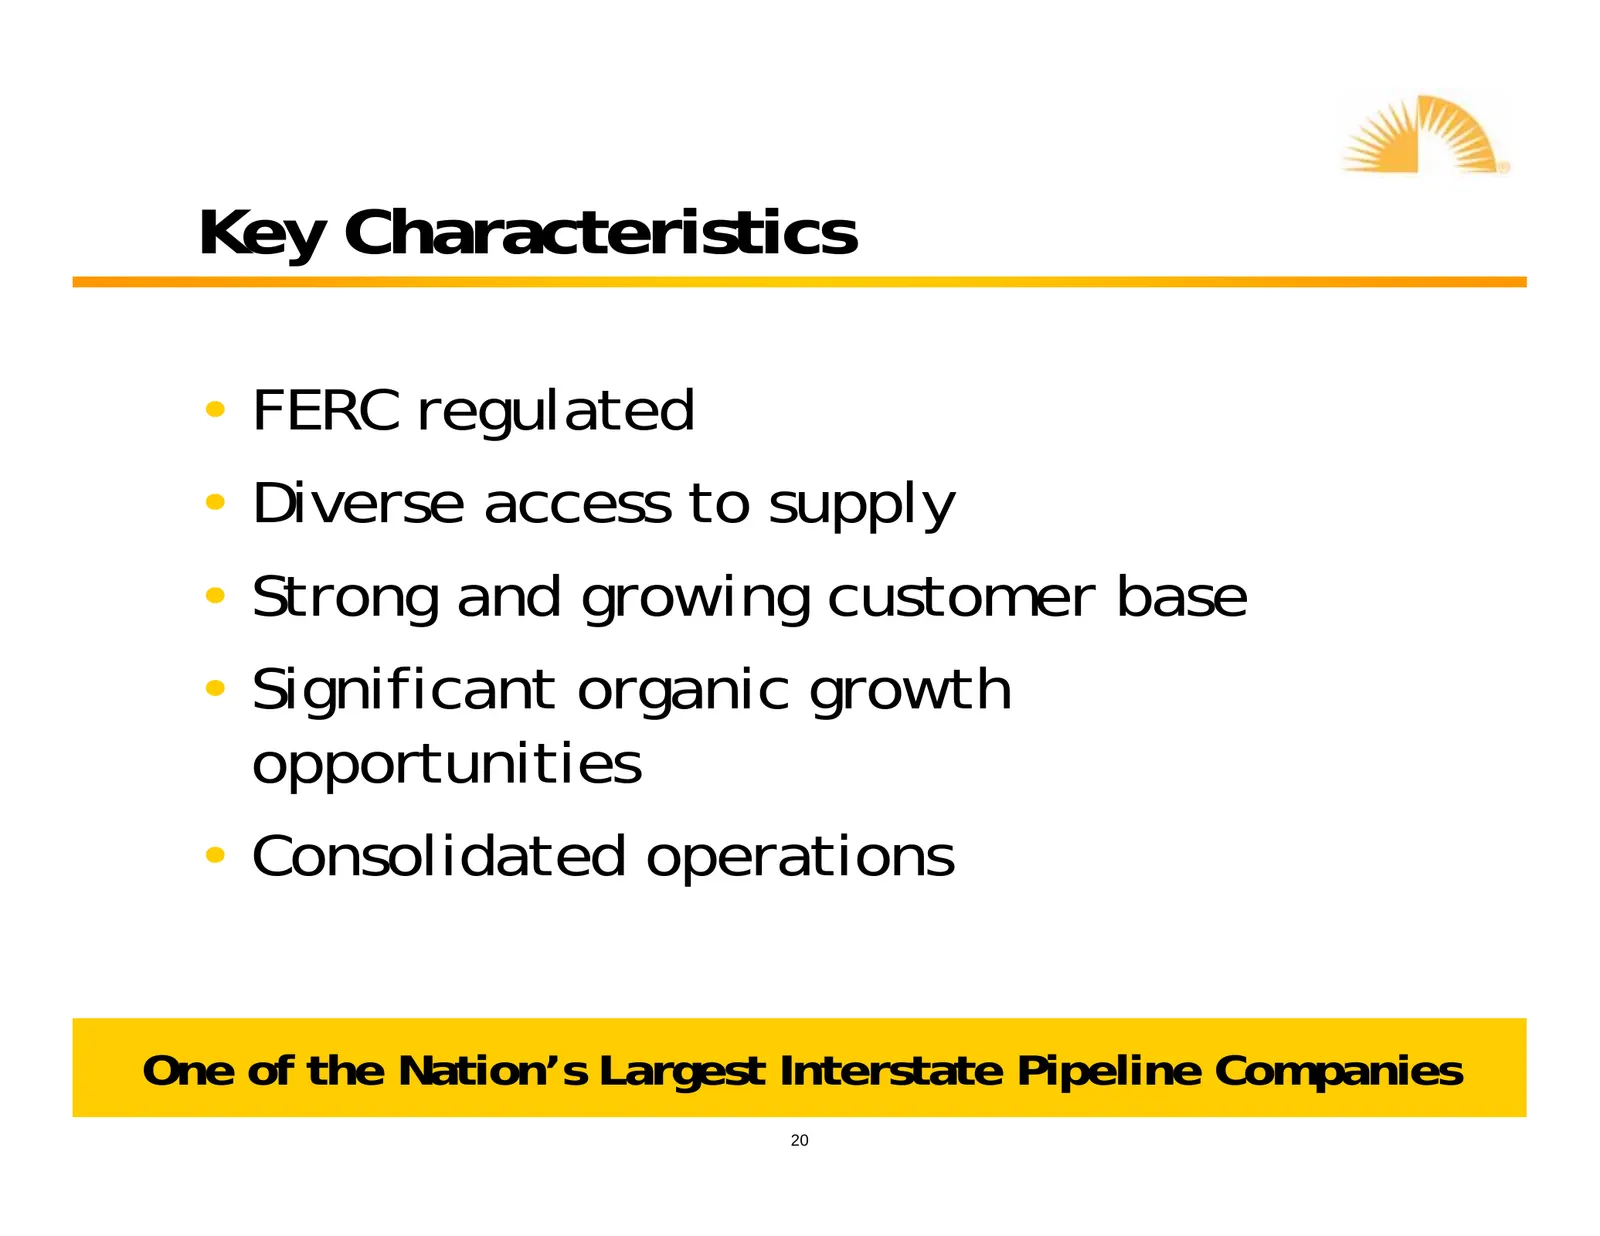
Key Characteristics • FERC regulated • Diverse access to supply • Strong and growing customer base • Significant organic growth opportunities • Consolidated operations One of the Nation’s Largest Interstate Pipeline Companies 20
Slide 21: Trunkline LNG Company
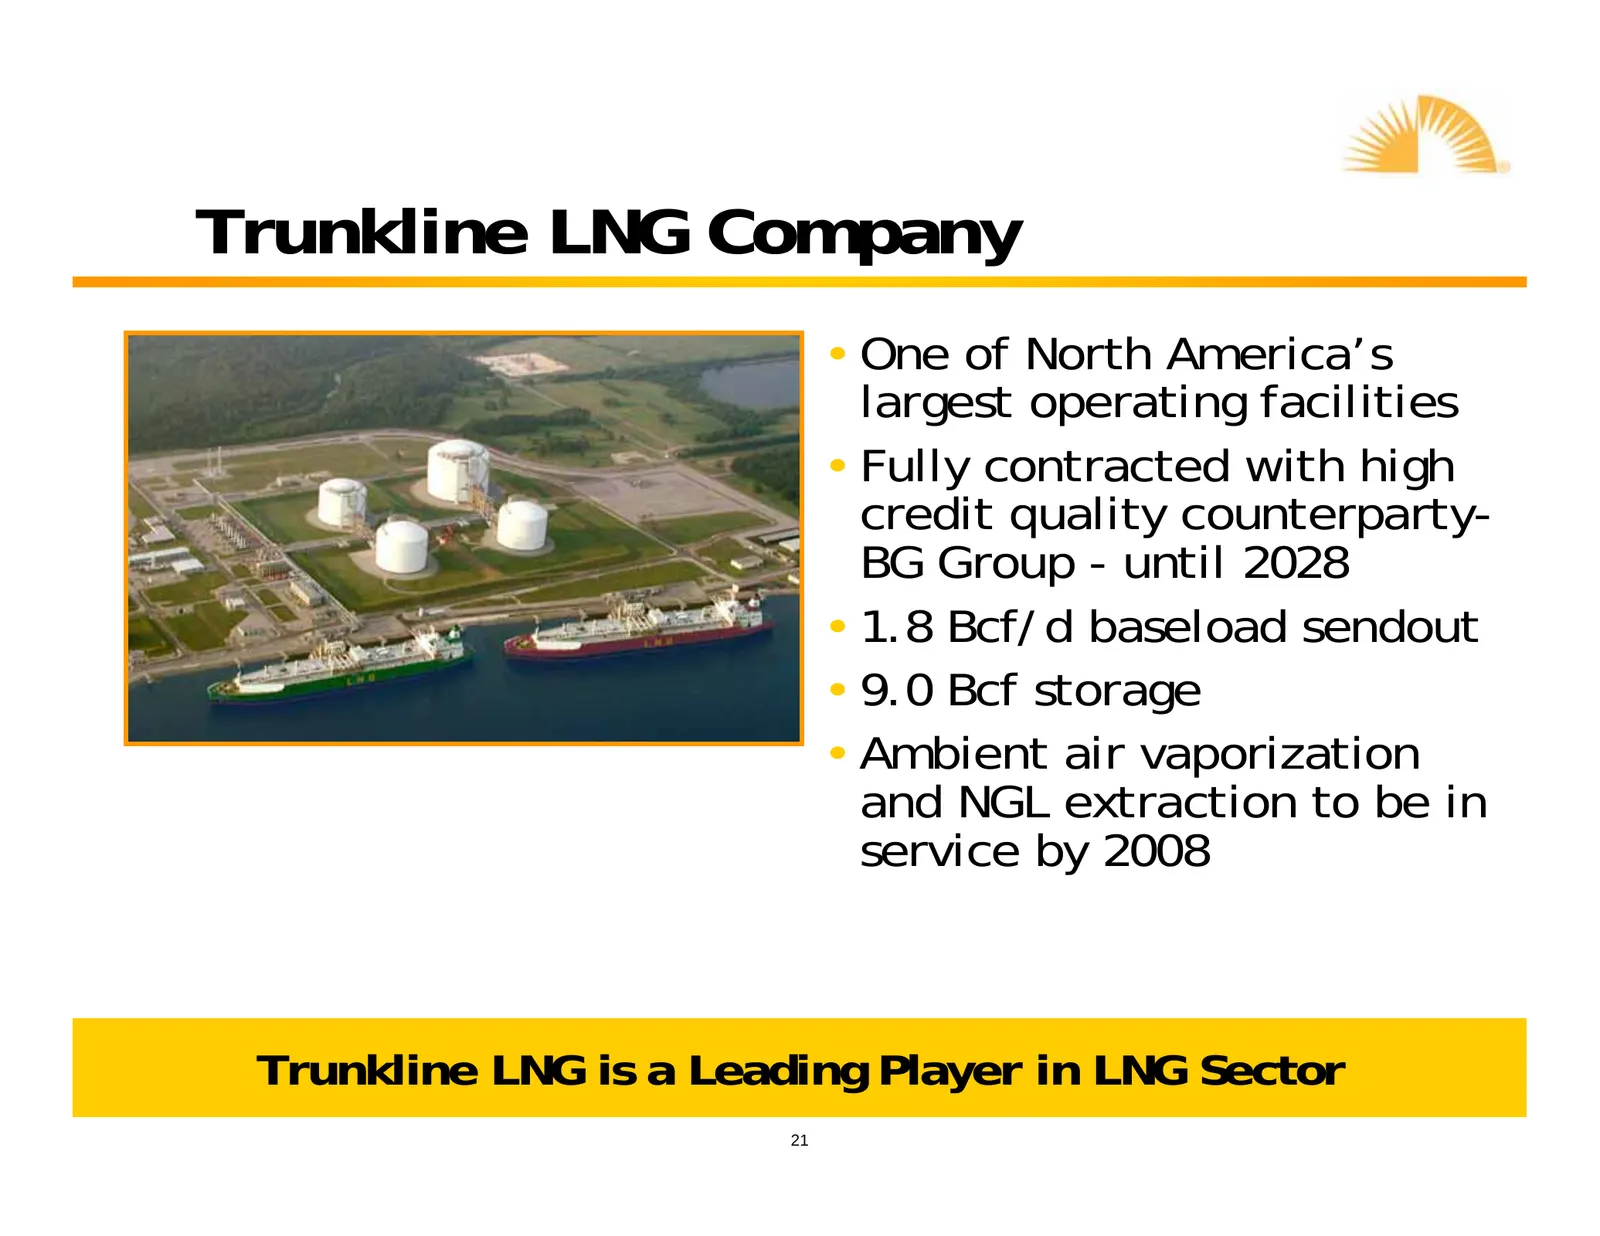
Trunkline LNG Company • One of North America’s largest operating facilities • Fully contracted with high credit quality counterparty- BG Group - until 2028 • 1.8 Bcf/d baseload sendout • 9.0 Bcf storage Above: Artist's rendering of expanded facility. • Ambient air vaporization and NGL extraction to
Slide 22: Strong Organic Growth
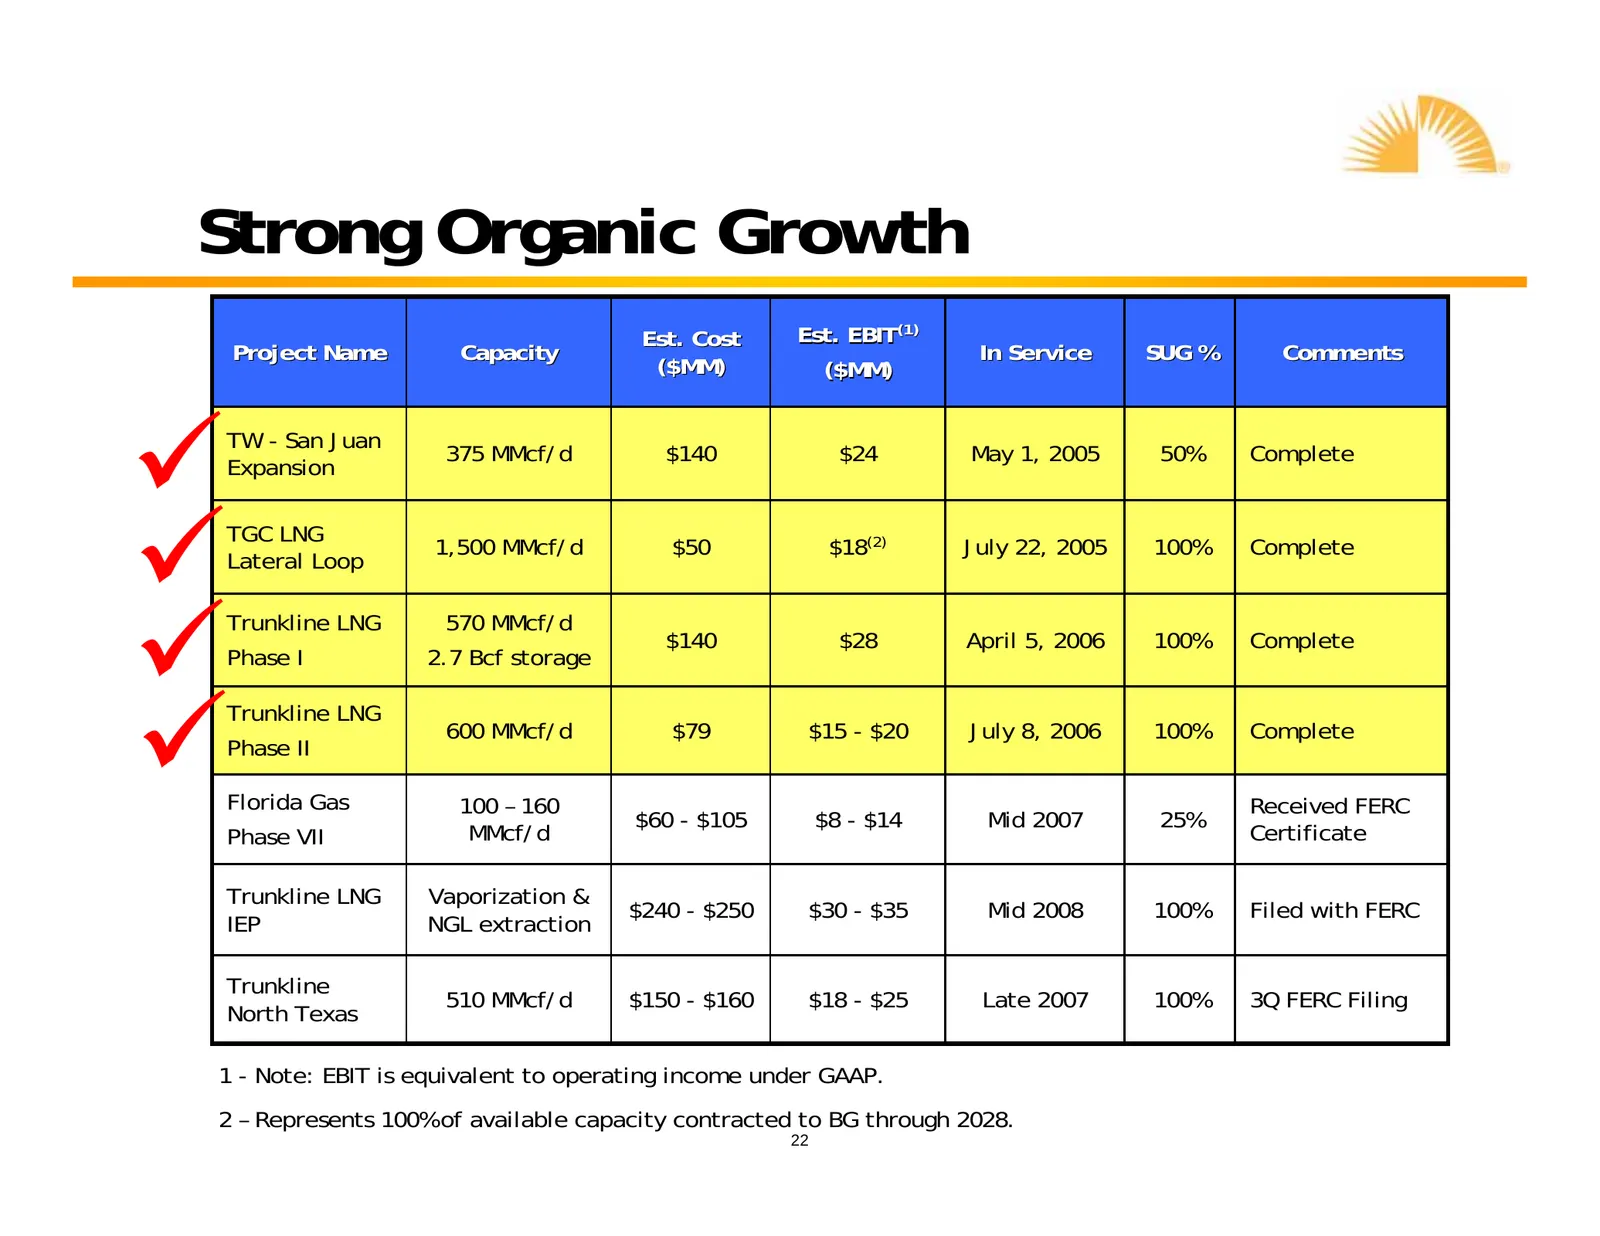
Strong Organic Growth Est. Cost Est. EBIT(1) Project Name Capacity In Service SUG % Comments ($MM) ($MM) 9 TW - San Juan Expansion 375 MMcf/d $140 $24 May 1, 2005 50% Complete 9 TGC LNG Lateral Loop 1,500 MMcf/d $50 $18(2) July 22, 2005 100% Complete 9 Trunkline LNG 570 MMcf/d $140 $28 April 5, 2006
Slide 23: Gathering & Processing Business
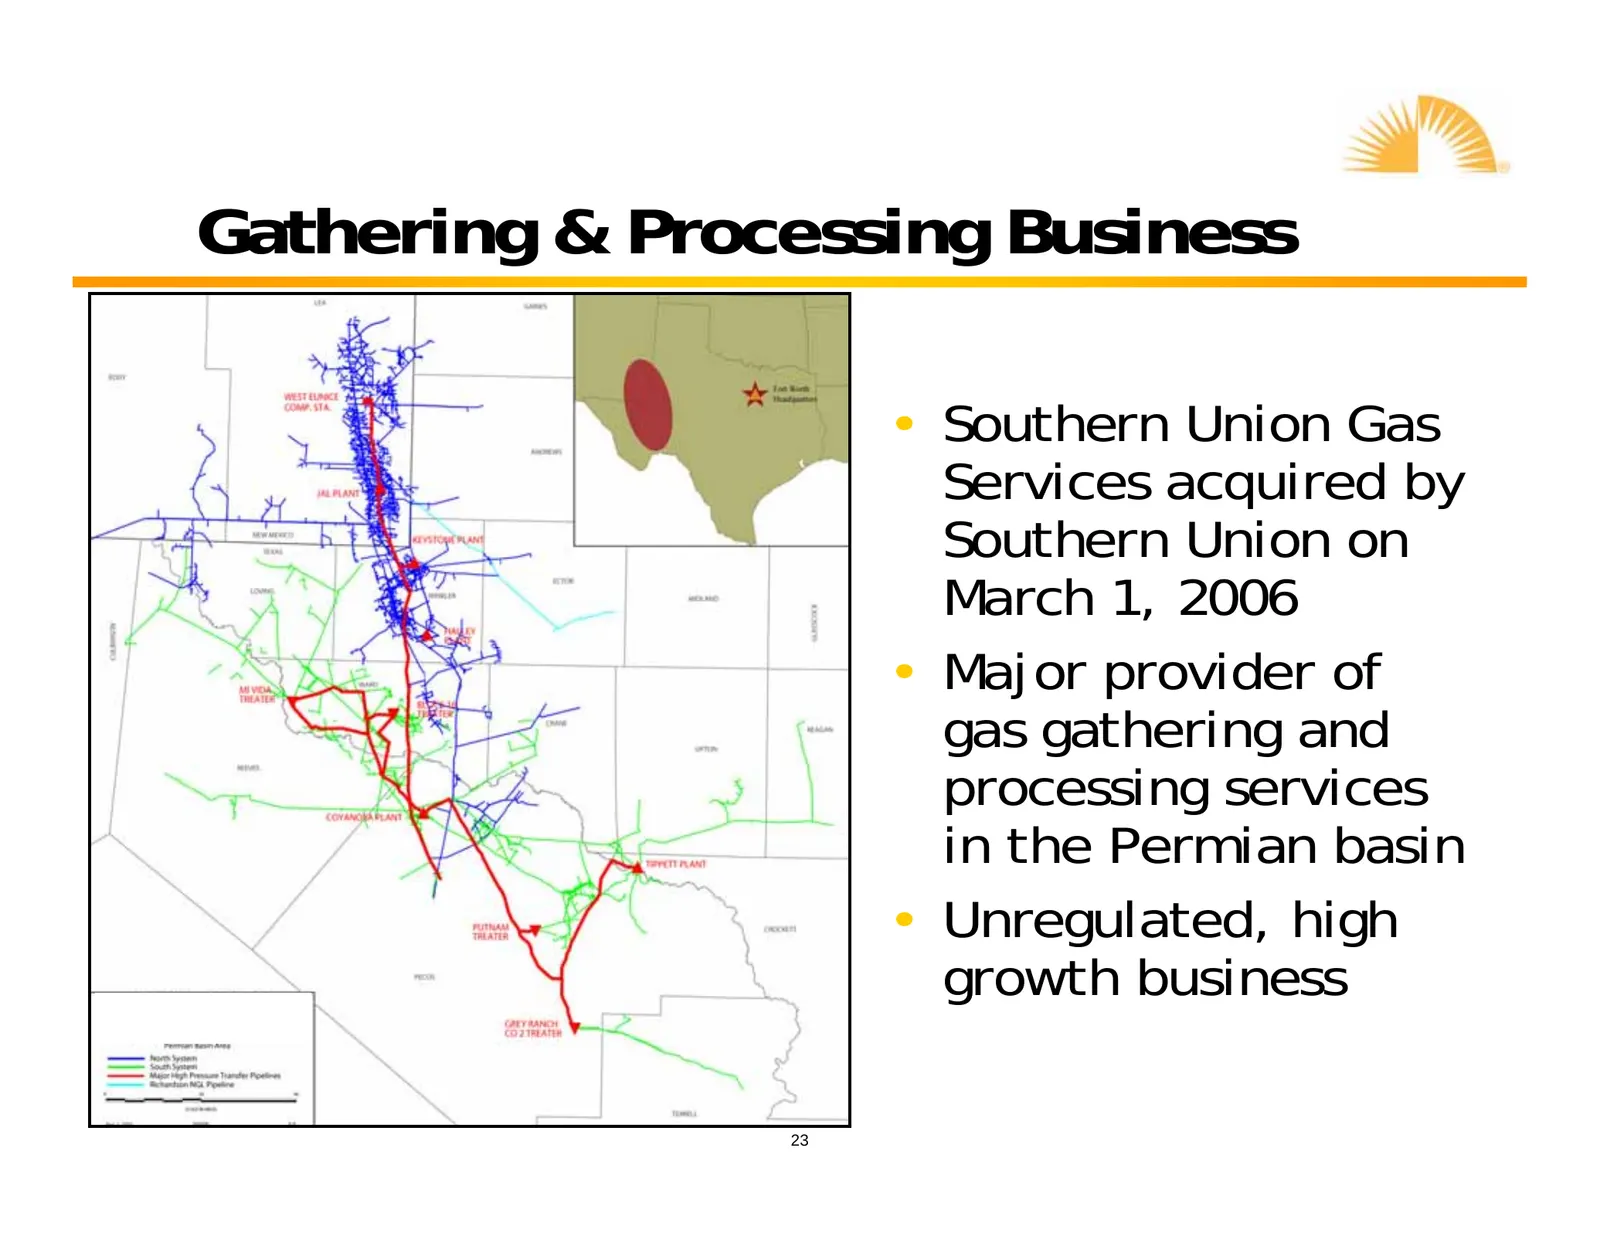
Gathering & Processing Business • Southern Union Gas Services acquired by Southern Union on March 1, 2006 • Major provider of gas gathering and processing services in the Permian basin • Unregulated, high growth business 23
Slide 24: System Detail
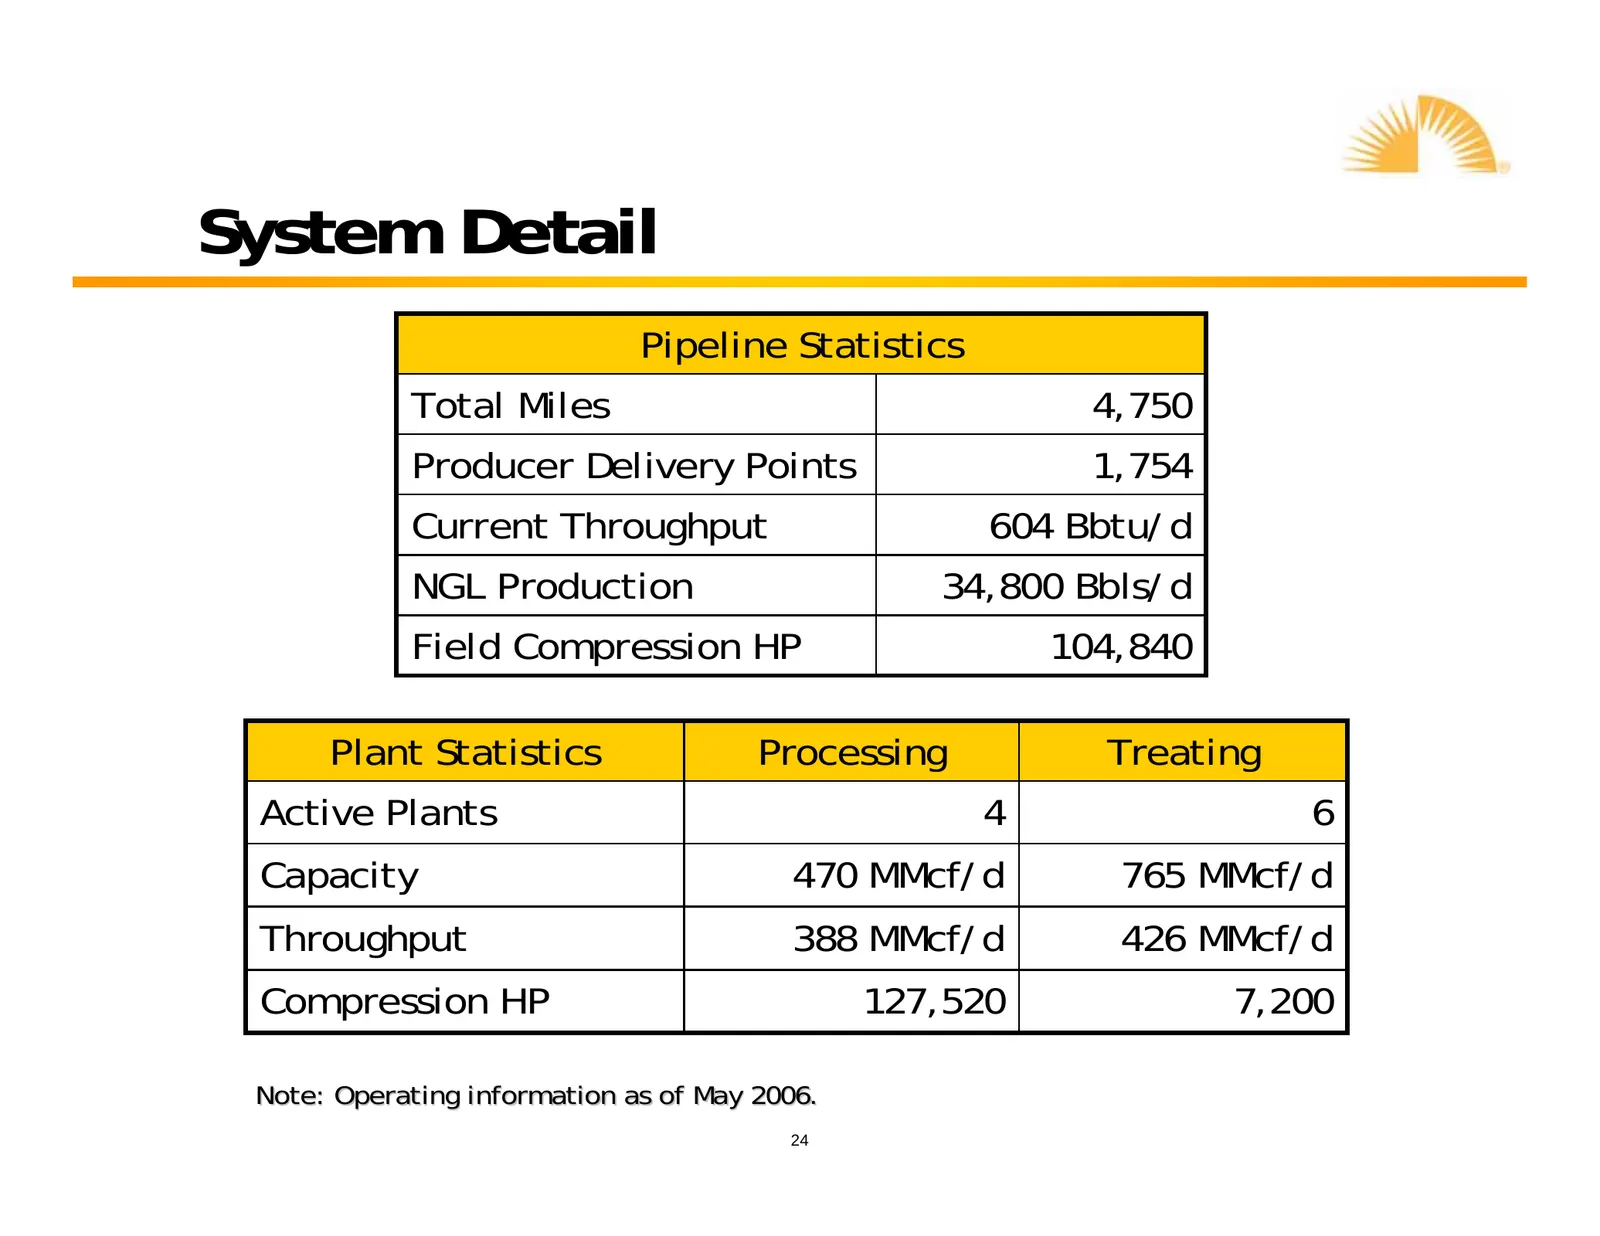
System Detail Pipeline Statistics Total Miles 4,750 Producer Delivery Points 1,754 Current Throughput 604 Bbtu/d NGL Production 34,800 Bbls/d Field Compression HP 104,840 Plant Statistics Processing Treating Active Plants 4 6 Capacity 470 MMcf/d 765 MMcf/d Throughput 388 MMcf/d 426 MMcf/d Compressio
Slide 25: Differentiating Factors
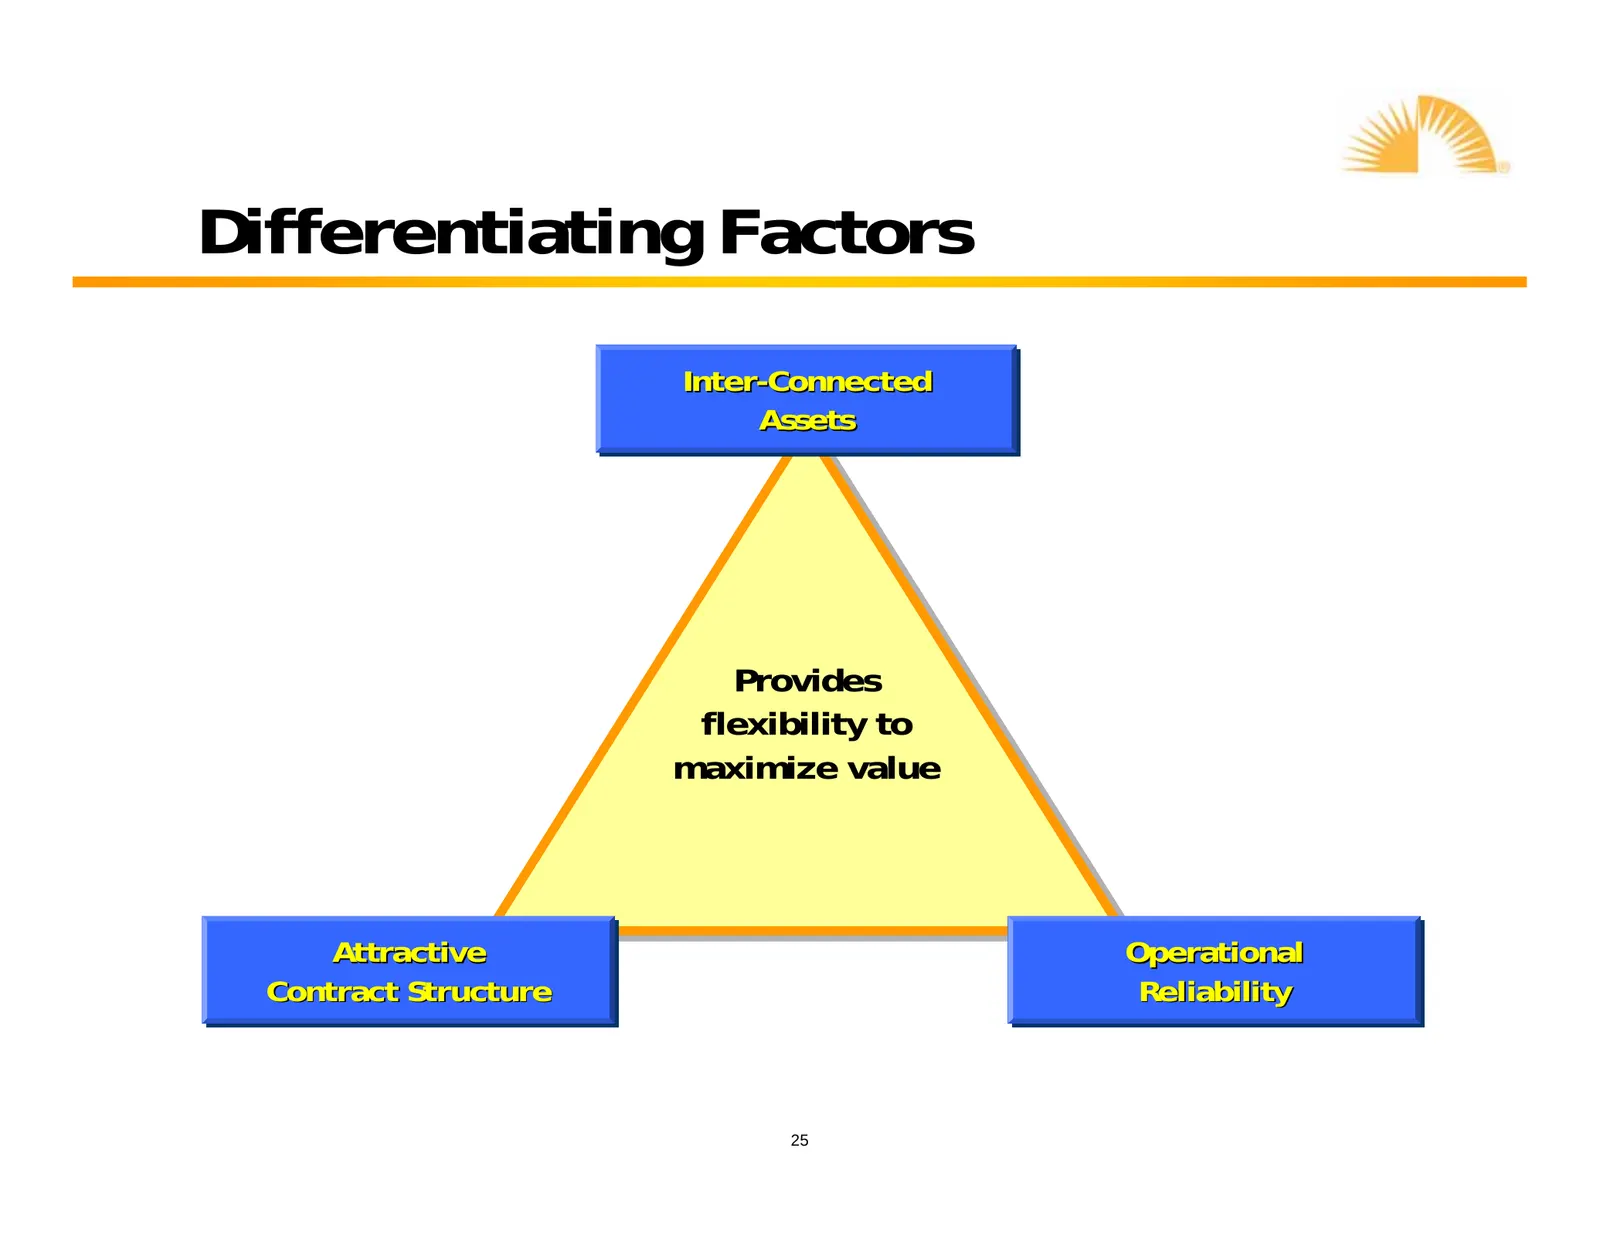
Differentiating Factors Inter -Connected Inter-Connected Assets Assets Provides flexibility to maximize value Attractive Attractive Operational Operational Contract Contract Structure Structure Reliability Reliability 25
Slide 26: Attractive Contract Risk
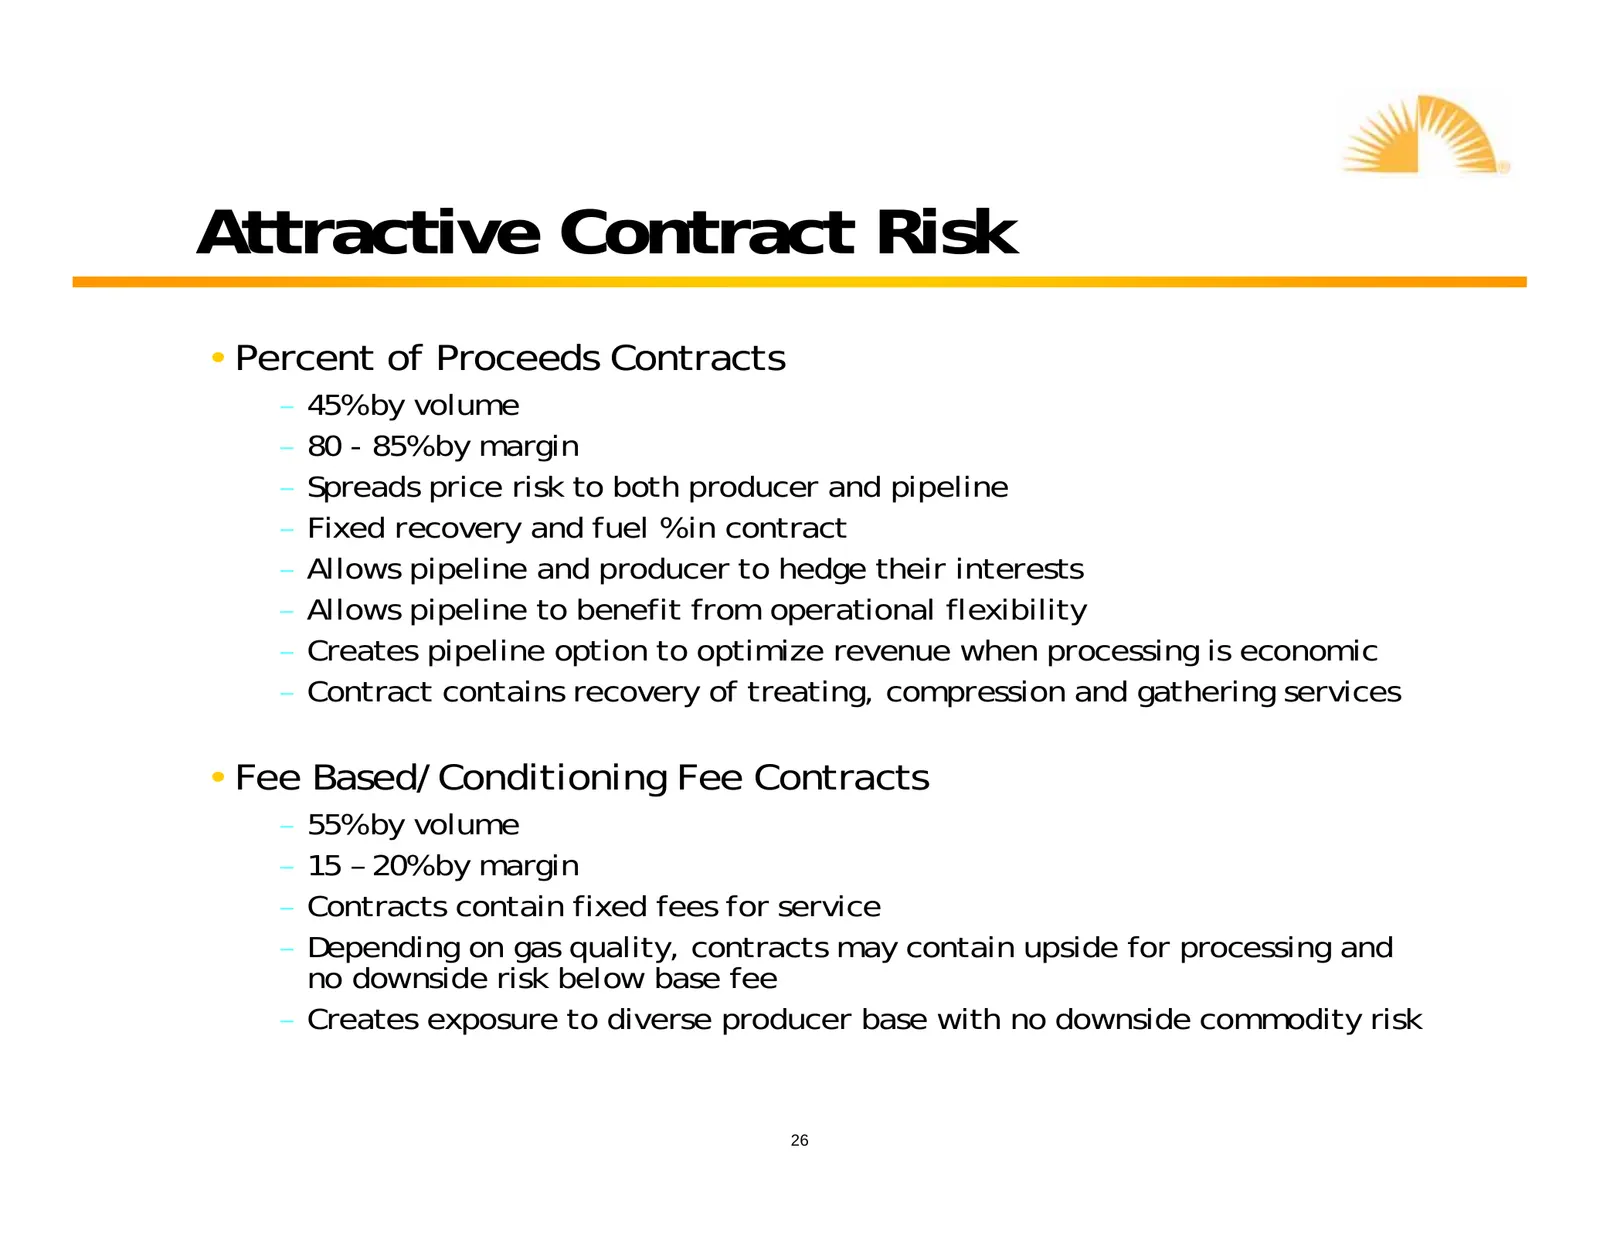
Attractive Contract Risk • Percent of Proceeds Contracts – 45% by volume – 80 - 85% by margin – Spreads price risk to both producer and pipeline – Fixed recovery and fuel % in contract – Allows pipeline and producer to hedge their interests – Allows pipeline to benefit from operational flexibility –
Slide 27: Operational Reliability
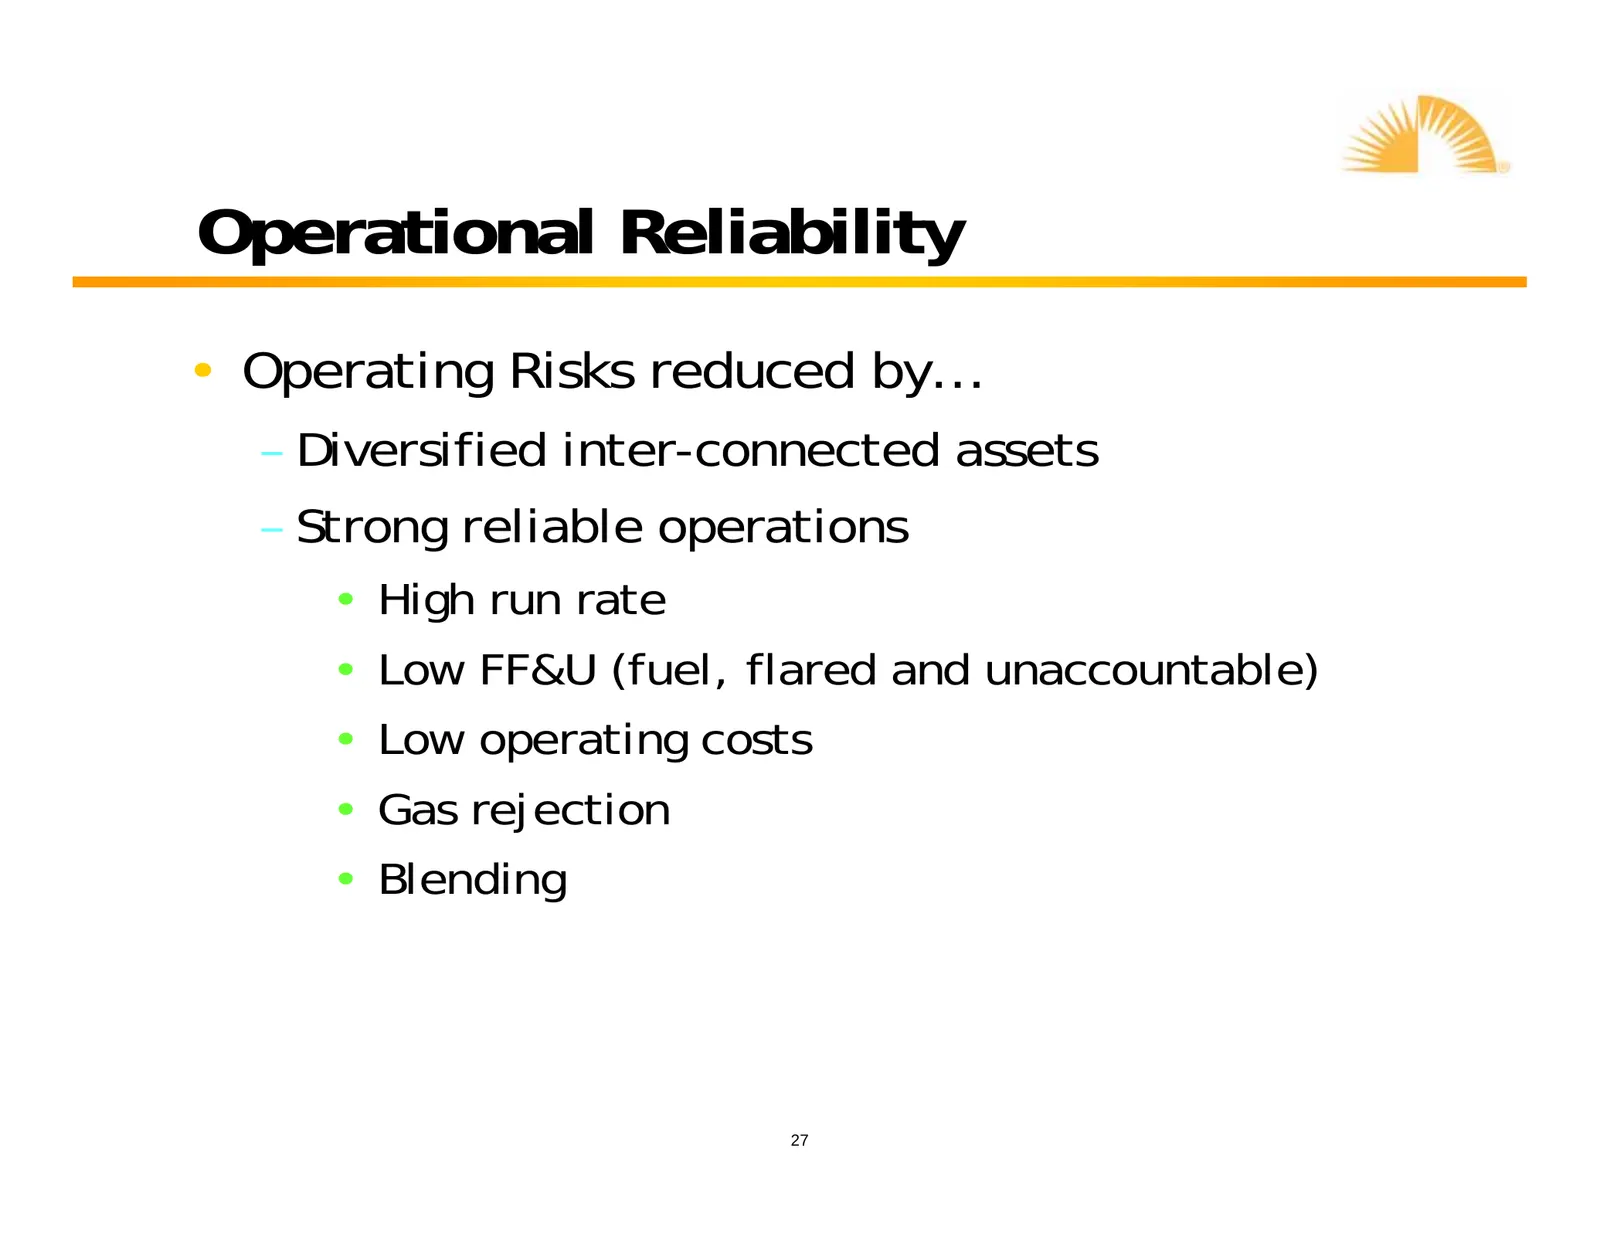
Operational Reliability • Operating Risks reduced by… – Diversified inter-connected assets – Strong reliable operations • High run rate • Low FF&U (fuel, flared and unaccountable) • Low operating costs • Gas rejection • Blending 27
Slide 28: Manageable Commodity Exposure
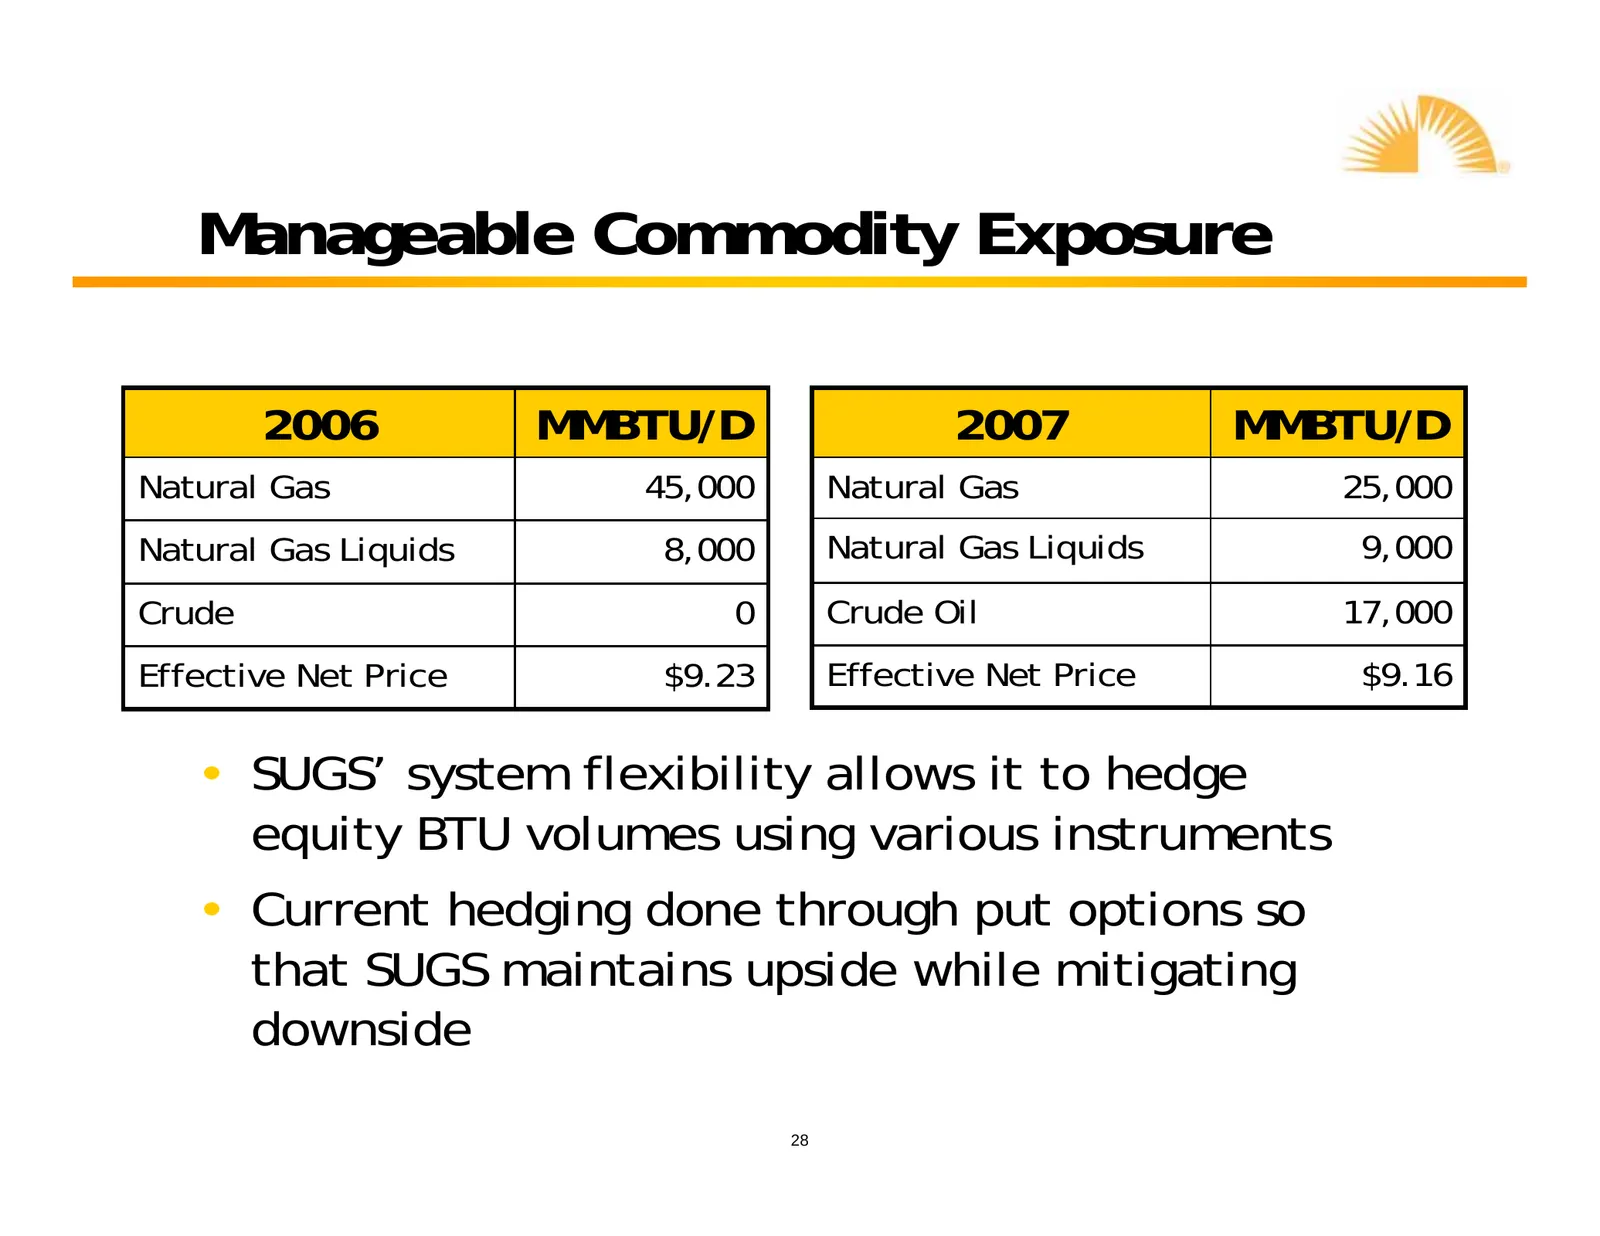
Manageable Commodity Exposure 2006 MMBTU/D 2007 MMBTU/D Natural Gas 45,000 Natural Gas 25,000 Natural Gas Liquids 8,000 Natural Gas Liquids 9,000 Crude 0 Crude Oil 17,000 Effective Net Price $9.23 Effective Net Price $9.16 • SUGS’ system flexibility allows it to hedge equity BTU volumes using variou
Slide 29: SUGS Growth Projects
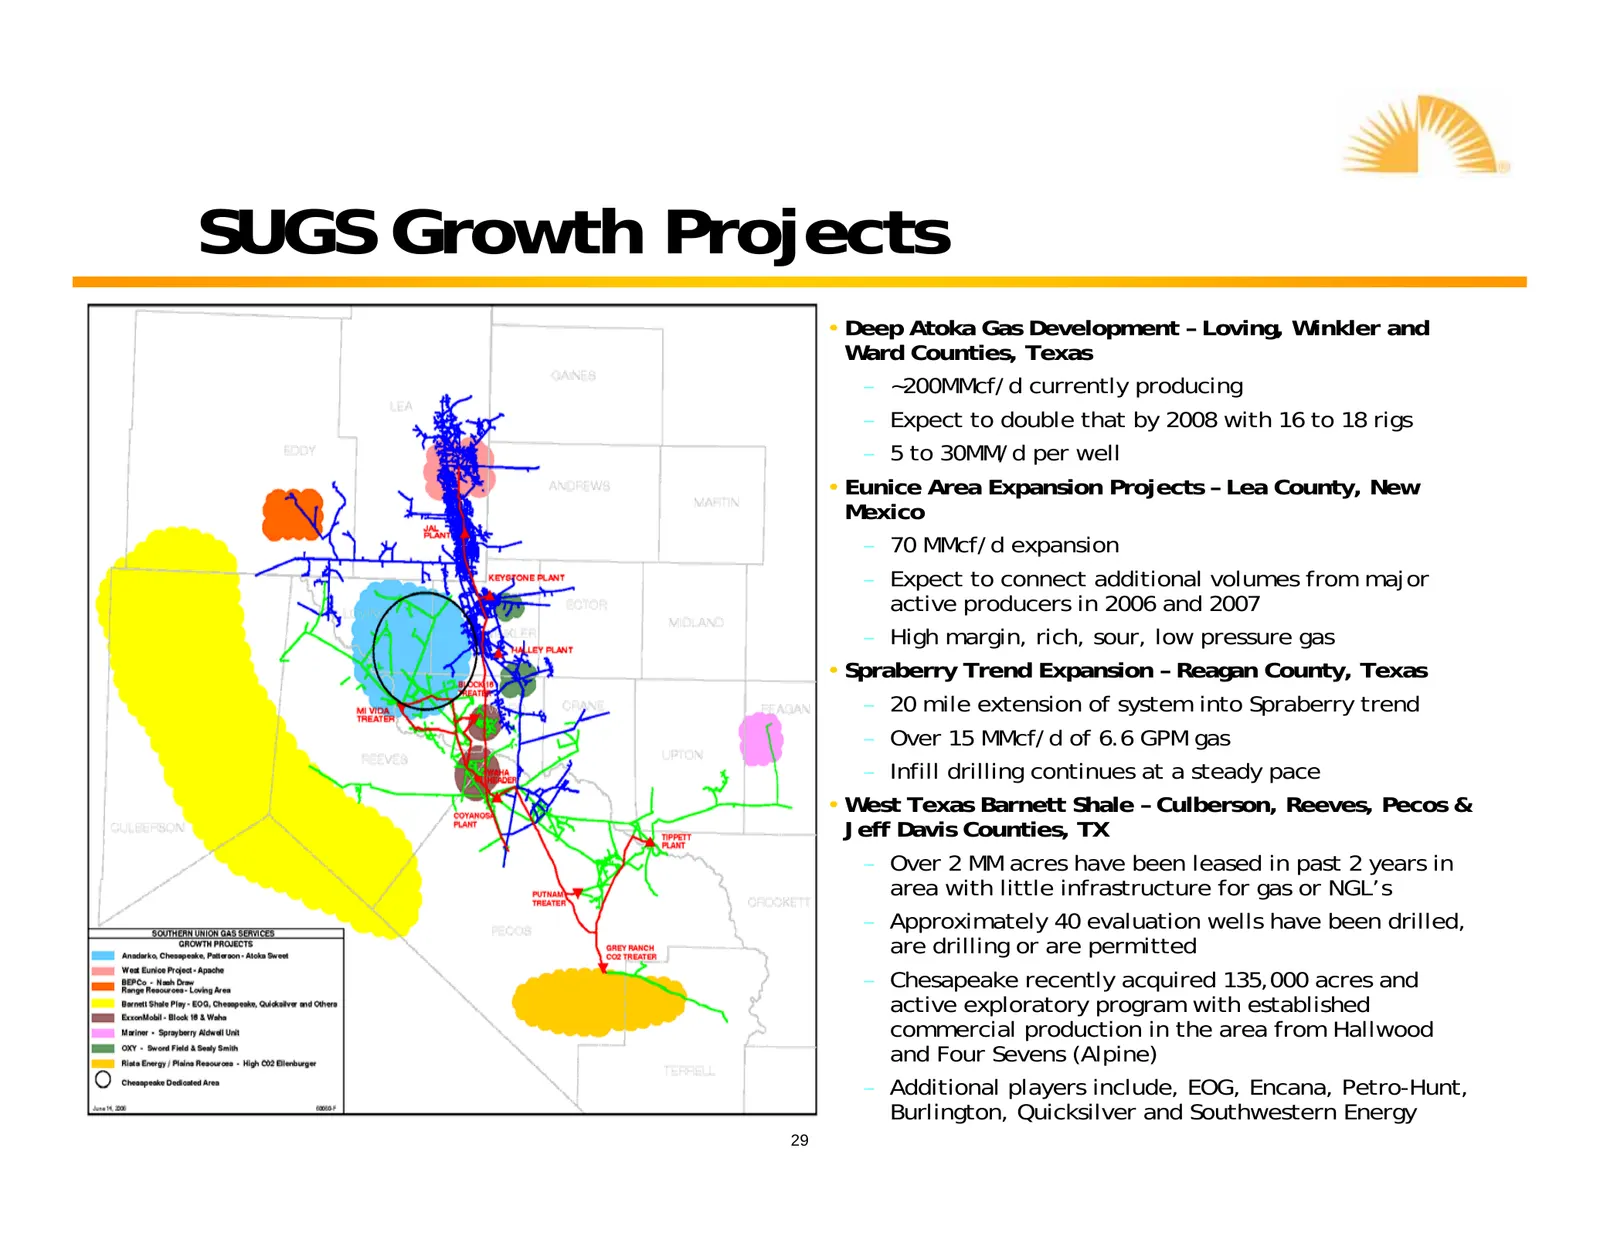
SUGS Growth Projects • Deep Atoka Gas Development – Loving, Winkler and Ward Counties, Texas – ~200MMcf/d currently producing – Expect to double that by 2008 with 16 to 18 rigs – 5 to 30MM/d per well • Eunice Area Expansion Projects – Lea County, New Mexico – 70 MMcf/d expansion – Expect to connect

Slide 30: Questions
Questions wl”
Source: SEC EDGAR · 8-K filed Sep 5, 2006
More decks from Southern Union Co
 Barclays Capital Investment Grade Energy and Pipeline Conference 201232 slides · Mar 8, 2012
 Debt Investor Presentation (February 2012)33 slides · Feb 22, 2012
 Merger or Acquisition (July 2011)11 slides · Jul 5, 2011
 Merger or Acquisition (June 2011)22 slides · Jun 16, 2011
 Investor Presentation (February 2011)37 slides · Feb 25, 2011
 BMO Capital Markets 2010 Utilities and Pipelines Day23 slides · Nov 30, 2010