Chiquita Brands International Inc
Chiquita Brands International — Investor Presentation (December 2013)
42 slides from Chiquita Brands International's investor presentation, Dec 10, 2013
Slide 1: Investor Presentation December 2013
1 1 O Investor Presentation December 2013 Exhibit 99.1
Slide 2: Forward-looking statements
2 This presentation contains certain statements, including the outlook section, that are “forward-looking statements” within the meaning of the Private Securities Litigation Reform Act of 1995. These statements are subject to a number of assumptions, risks and uncertainties, many of which are beyond
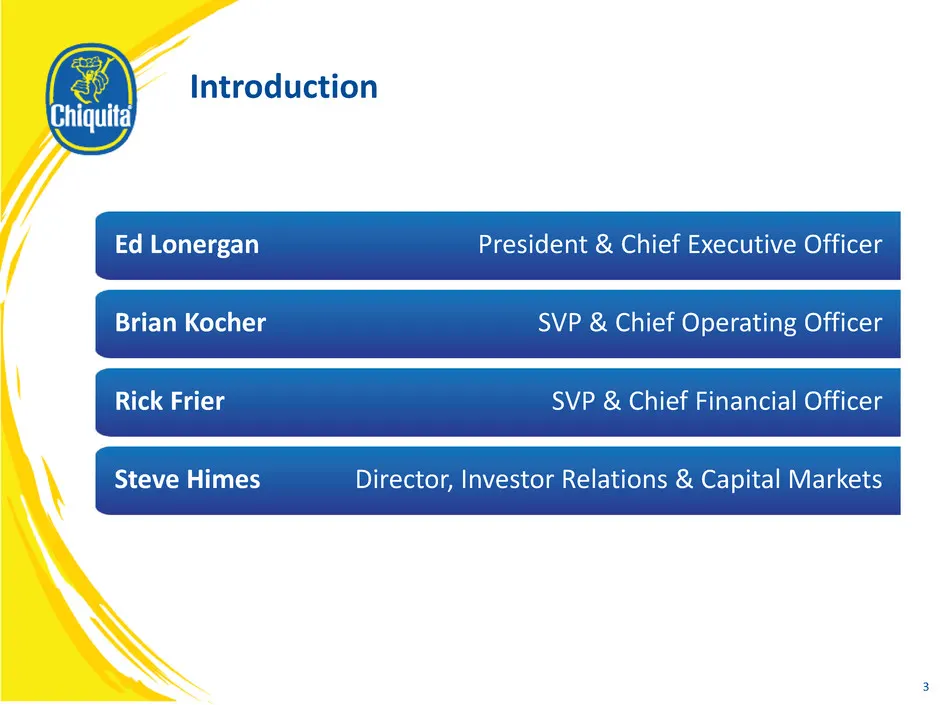
Slide 3: Introduction and presenters
3 Introduction Other Business Updates – [ ] Overview & Strategy Ed Lonergan President & Chief Executive Officer Brian Kocher SVP & Chief Operating Officer Steve Himes Director, Investor Relations & Capital Markets Rick Frier SVP & Chief Financial Officer
Slide 4: Agenda
4 Agenda Other Business Updates – [ ] Financial Update Questions and Answers Appendix Company Overview Strategic Operations
Slide 5: Company Overview
5 Company Overview
Slide 6: Company Overview
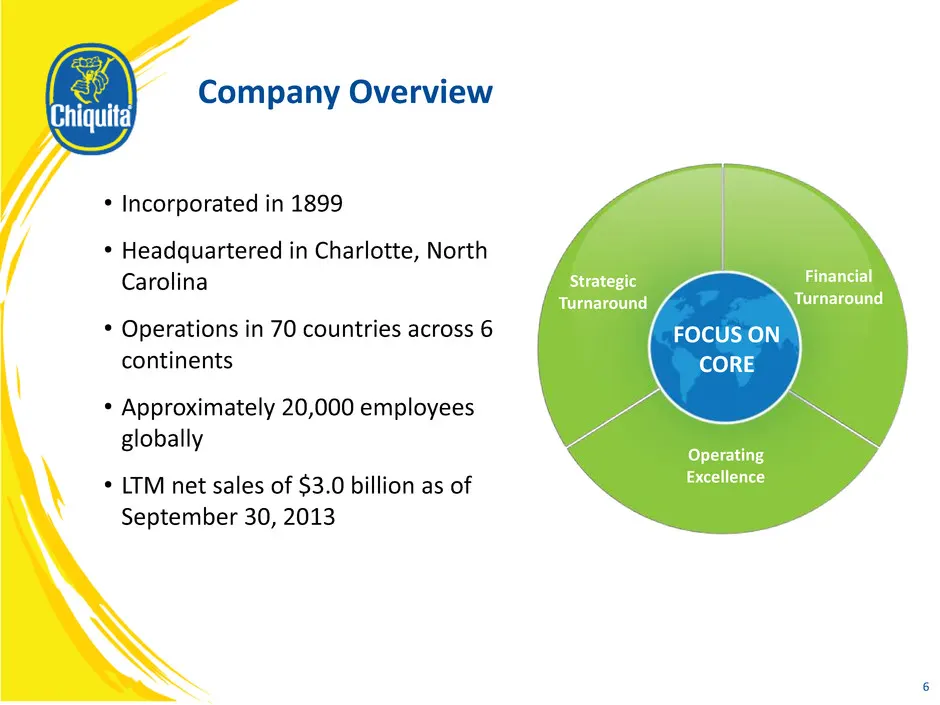
6 • Incorporated in 1899 • Headquartered in Charlotte, North Carolina • Operations in 70 countries across 6 continents • Approximately 20,000 employees globally • LTM net sales of $3.0 billion as of September 30, 2013 Company Overview Strategic Turnaround Financial Turnaround Operating Excellence FO
Slide 7: Historical Performance
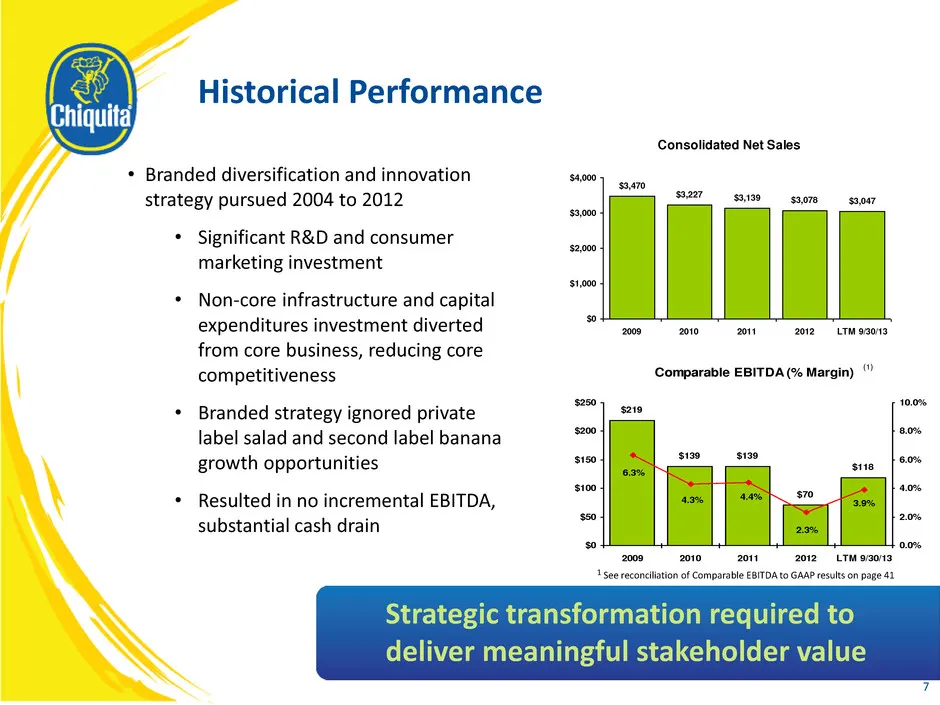
7 • Branded diversification and innovation strategy pursued 2004 to 2012 • Significant R&D and consumer marketing investment • Non-core infrastructure and capital expenditures investment diverted from core business, reducing core competitiveness • Branded strategy ignored private label salad and sec
Slide 8: Strategic Transformation: Key Principles
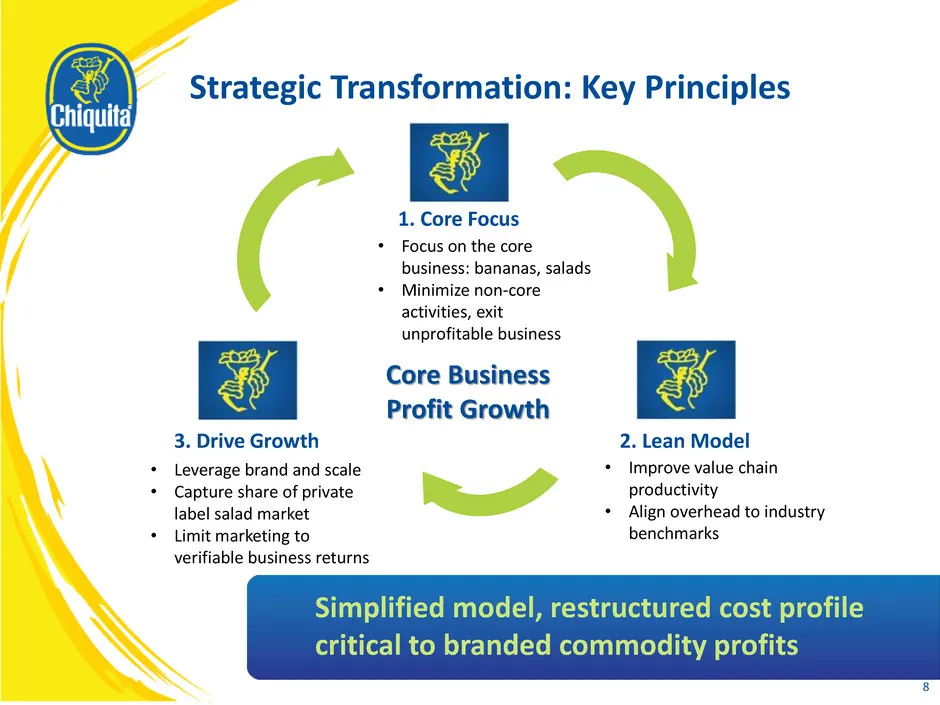
8 Strategic Transformation: Key Principles Simplifying model and restructuring cost profile are critical to commodity profits 1. Core Focus 3. Drive Growth 2. Lean Model • Focus on the core business: bananas, salads • Minimize non-core activities, exit unprofitable business • Leverage brand and scal
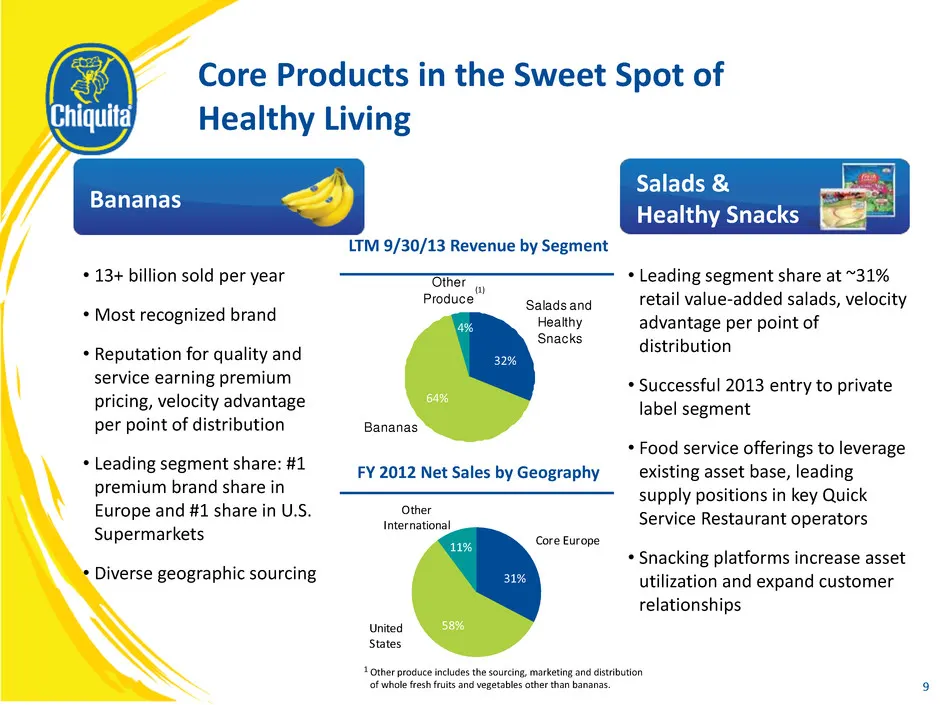
Slide 9: Core Products in the Sweet Spot of Healthy Living
• 13+ billion sold per year • Most recognized brand • Reputation for quality and service earning premium pricing, velocity advantage per point of distribution • Leading segment share: #1 premium brand share in Europe and #1 share in U.S. Supermarkets • Diverse geographic sourcing • Leading segment s
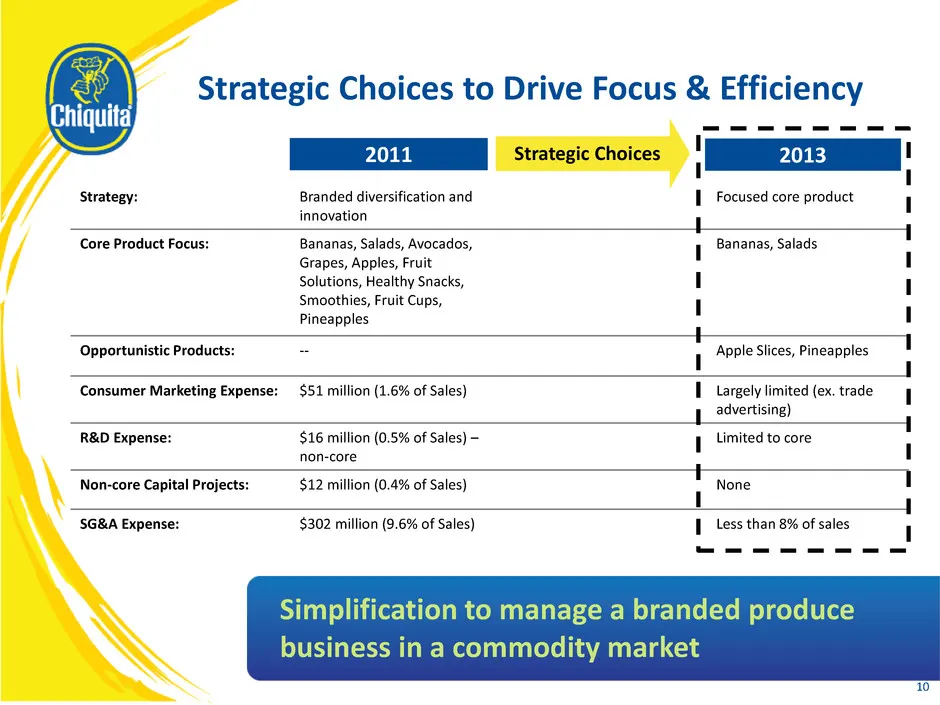
Slide 10: Strategic Choices to Drive Focus & Efficiency
Strategy: Branded diversification and innovation Focused core product Core Product Focus: Bananas, Salads, Avocados, Grapes, Apples, Fruit Solutions, Healthy Snacks, Smoothies, Fruit Cups, Pineapples Bananas, Salads Opportunistic Products: -- Apple Slices, Pineapples Consumer Marketing Expense: $51
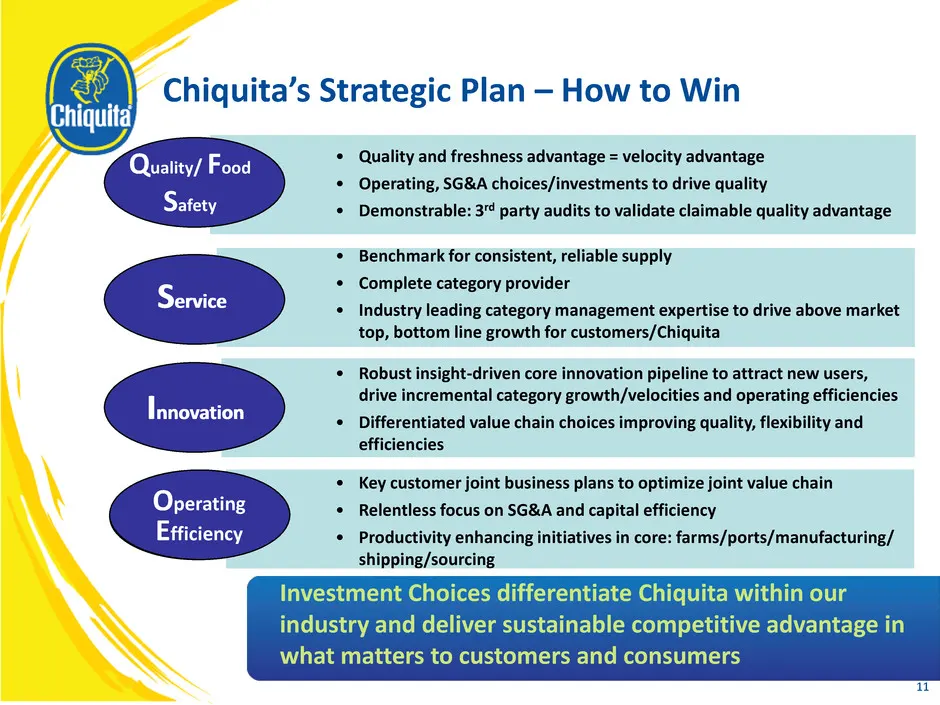
Slide 11: Chiquita's Strategic Plan – How to Win
Operating Efficiency Innovation Service Chiquita’s Strategic Plan – How to Win 11 • Quality and freshness advantage = velocity advantage • Operating, SG&A choices/investments to drive quality • Demonstrable: 3rd party audits to validate claimable quality advantage • Benchmark for consistent, reliabl
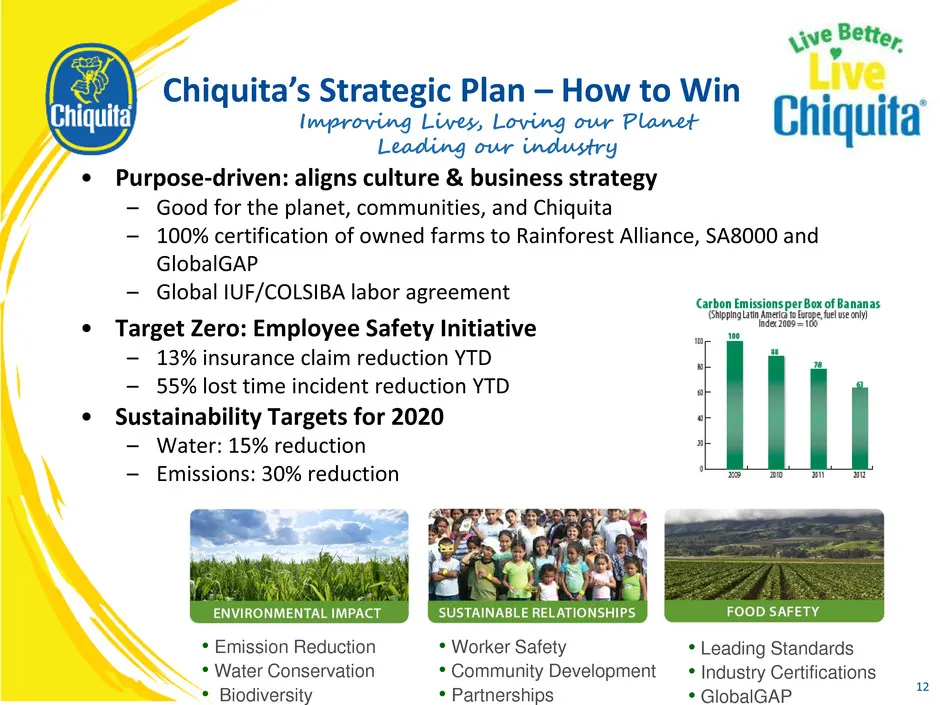
Slide 12: Improving Lives, Loving our Planet, Leading our Industry
• Purpose-driven: aligns culture & business strategy – Good for the planet, communities, and Chiquita – 100% certification of owned farms to Rainforest Alliance, SA8000 and GlobalGAP – Global IUF/COLSIBA labor agreement • Target Zero: Employee Safety Initiative – 13% insurance claim reduction YTD –
Slide 13: 2013 Promises Made, Promises Kept
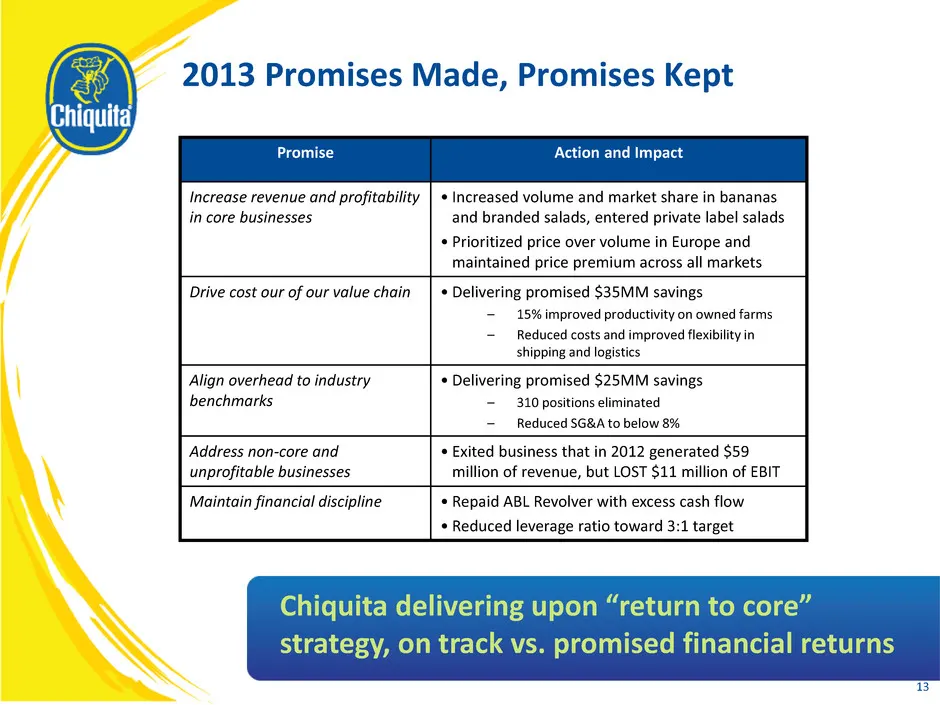
2013 Promises Made, Promises Kept Chiquita delivering upon “return to core” strategy, on track vs. promised financial returns Promise Action and Impact Increase revenue and profitability in core businesses • Increased volume and market share in bananas and branded salads, entered private label salad
Slide 14: Company Overview - Bananas
14 Company Overview - Bananas
Slide 15: Chiquita Brand Valued by Consumers
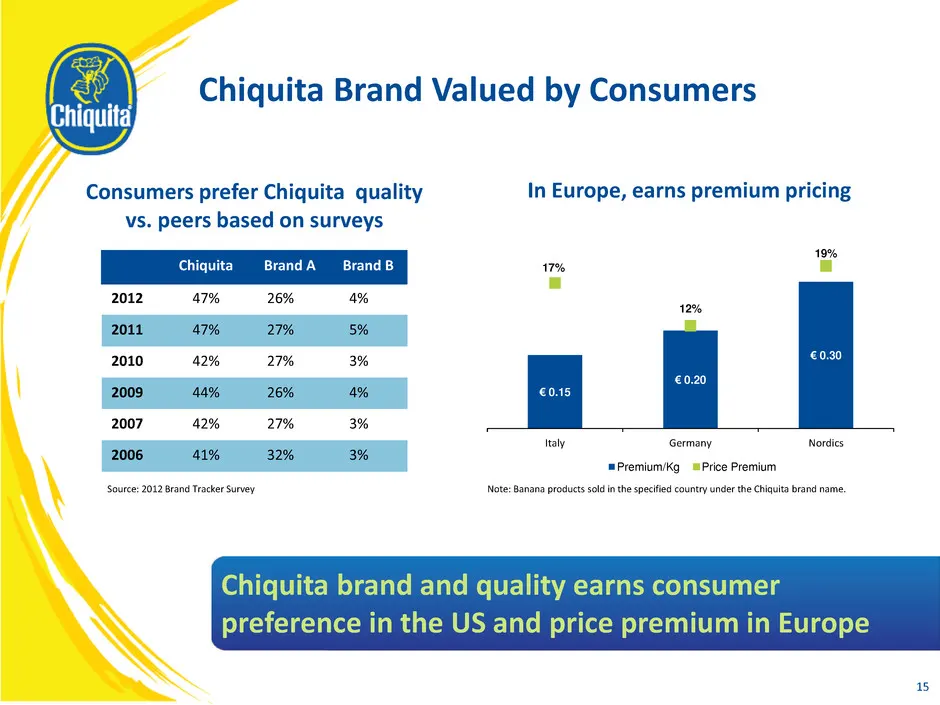
15 Chiquita Brand Valued by Consumers Note: Banana products sold in the specified country under the Chiquita brand name. Chiquita brand drives consumer preference in the US and price premium in Europe Chiquita Brand A Brand B 2012 47% 26% 4% 2011 47% 27% 5% 2010 42% 27% 3% 2009 44% 26% 4% 2007 42% 2
Slide 16: Chiquita Brand Valued by Retailers
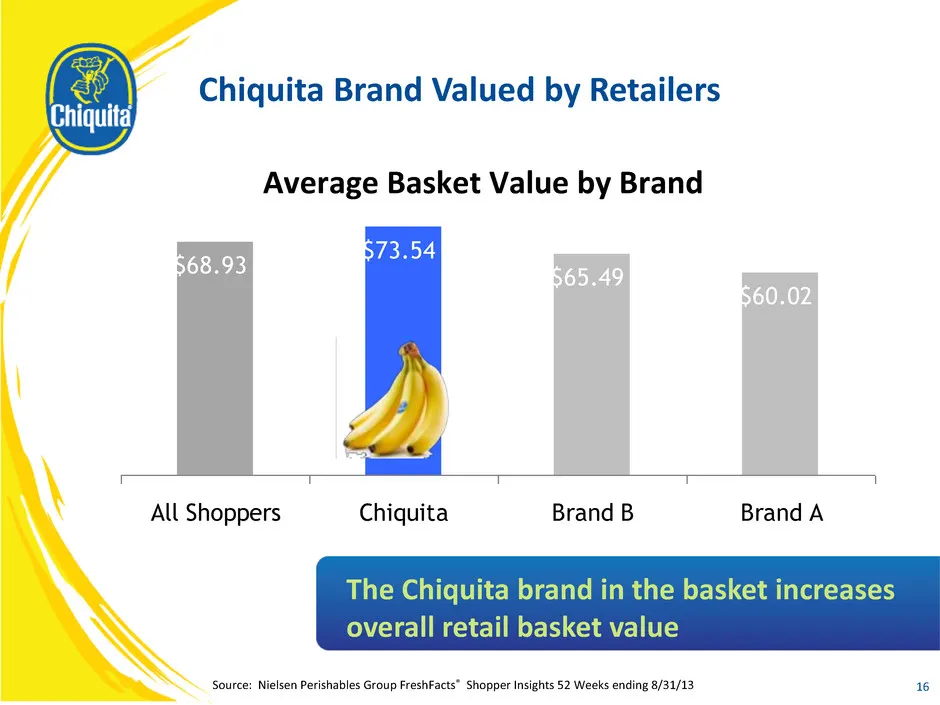
$68.93 $73.54 $65.49 $60.02 All Shoppers Chiquita Brand B Brand A Average Basket Value by Brand Source: Nielsen Perishables Group FreshFacts® Shopper Insights 52 Weeks ending 8/31/13 Chiquita Brand Valued by Retailers The Chiquita brand in the basket increases overall retail basket value 16
Slide 17: Growing Banana Market Share
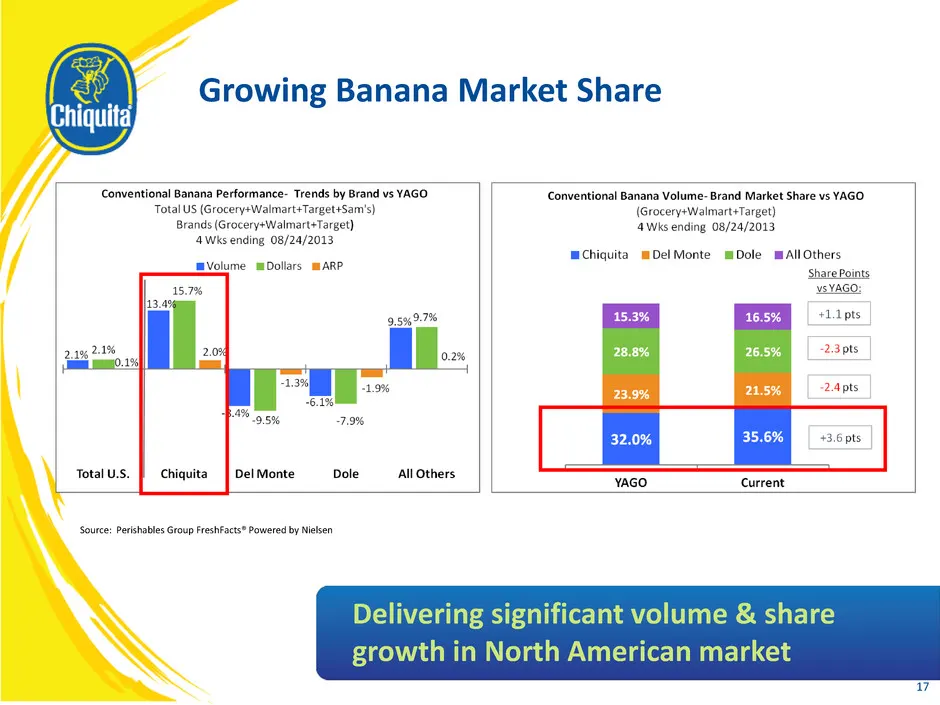
Growing Banana Market Share 17 Source: Perishables Group FreshFacts® Powered by Nielsen Delivering significant volume & share growth in North American market
Slide 18: Prioritizing Price over Volume in Core Europe
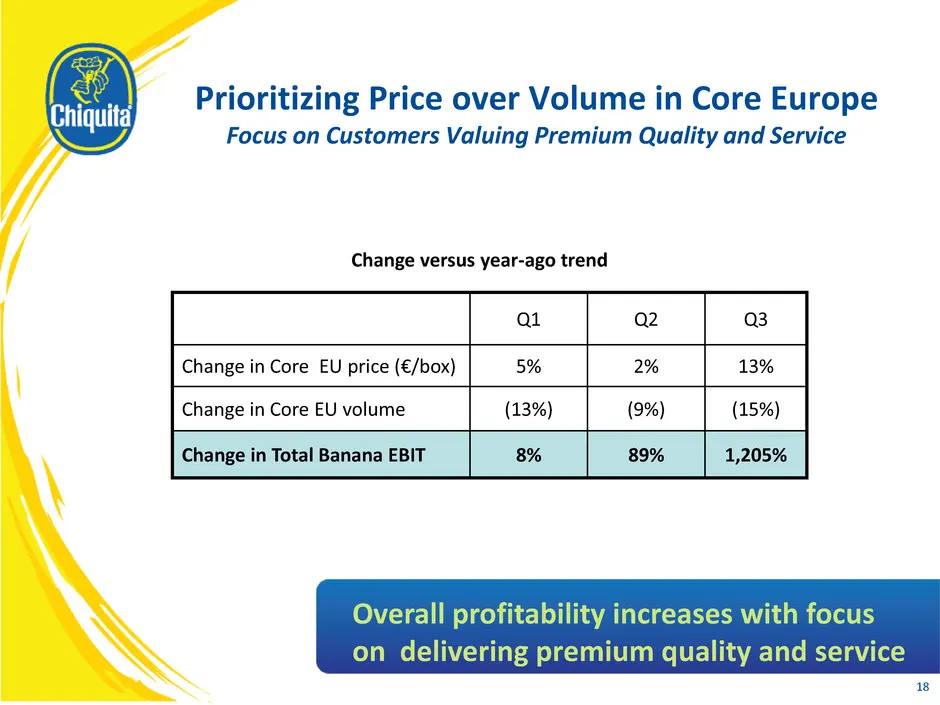
Prioritizing Price over Volume in Core Europe Focus on Customers Valuing Premium Quality and Service Change versus year-ago trend Q1 Q2 Q3 Change in Core EU price (€/box) 5% 2% 13% Change in Core EU volume (13%) (9%) (15%) Change in Total Banana EBIT 8% 89% 1,205% Overall profitability increases wit
Slide 19: Company Overview - Salads
19 Company Overview - Salads
Slide 20: Chiquita's Salad Strategy
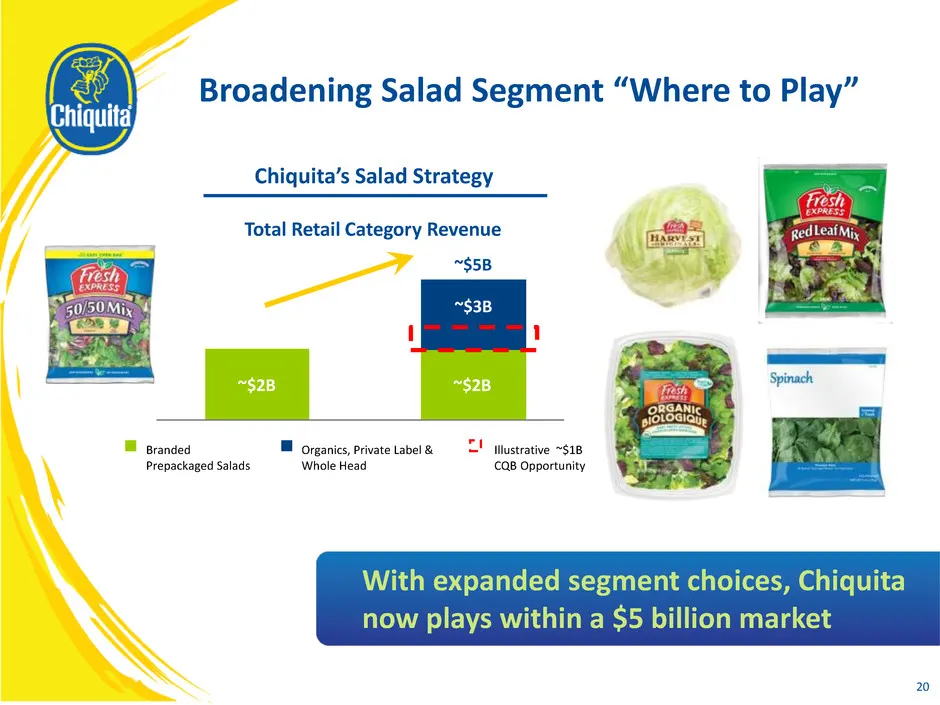
Chiquita’s Salad Strategy ~$3B ~$2B Branded Prepackaged Salads Organics, Private Label & Whole Head $468 ~$5B ~$2B With expanded segment choices, Chiquita now plays within a $5 billion market Total Retail Category Revenue 20 Broadening Salad Segment “Where to Play” Illustrative ~$1B CQB Opportunity
Slide 21: Growing Retail Value-Added Salad Volume
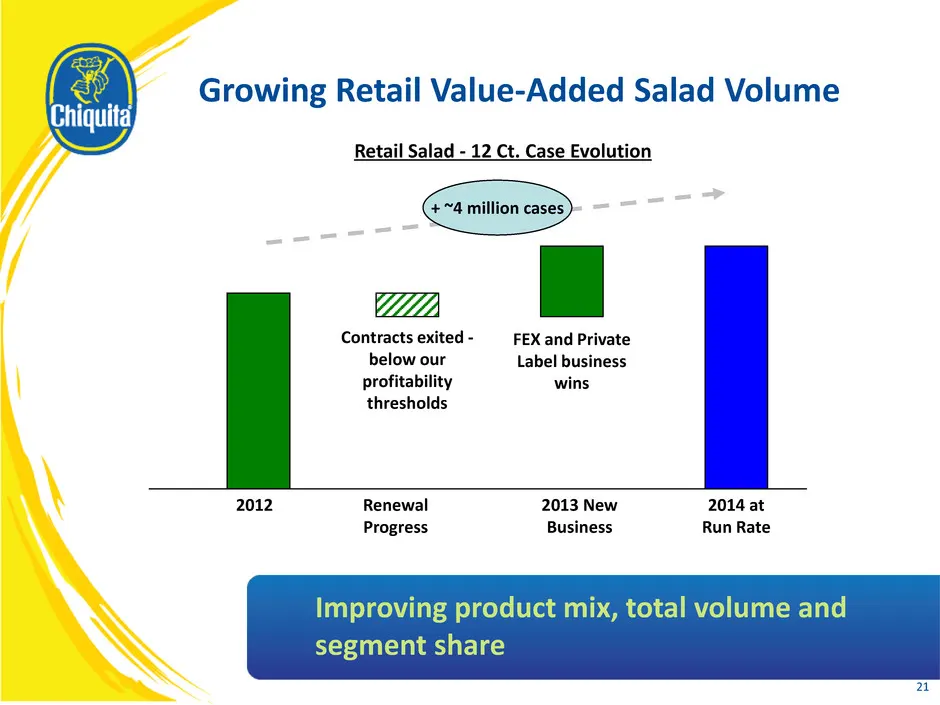
Growing Retail Value-Added Salad Volume 21 Retail Salad - 12 Ct. Case Evolution 2012 Renewal Progress Contracts exited - below our profitability thresholds 2013 New Business FEX and Private Label business wins 2014 at Run Rate + ~4 million cases Improving product mix, total volume and segment share
Slide 22: Driving the Category for the 1st Time Since 2007
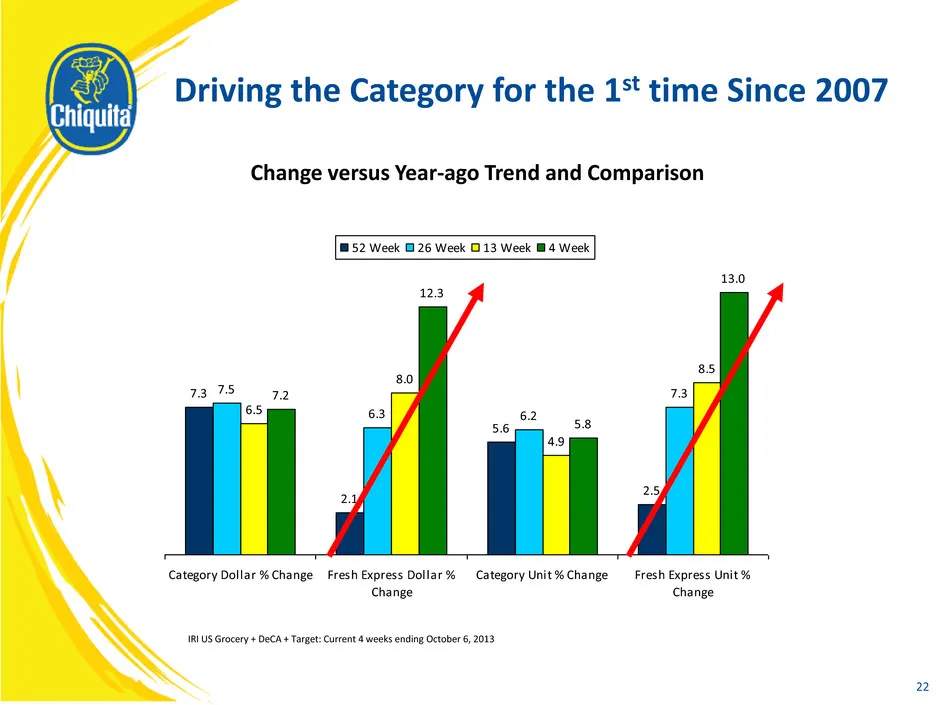
7.3 2.1 5.6 2.5 7.5 6.3 6.2 7.3 6.5 8.0 4.9 8.5 7.2 12.3 5.8 13.0 Category Dollar % Change Fresh Express Dollar % Change Category Unit % Change Fresh Express Unit % Change 52 Week 26 Week 13 Week 4 Week Driving the Category for the 1st time Since 2007 Change versus Year-ago Trend and Comparison IRI
Slide 23: Strategic Operations - Bananas
23 Strategic Operations - Bananas
Slide 24: Global Banana Supply/Demand Dynamics
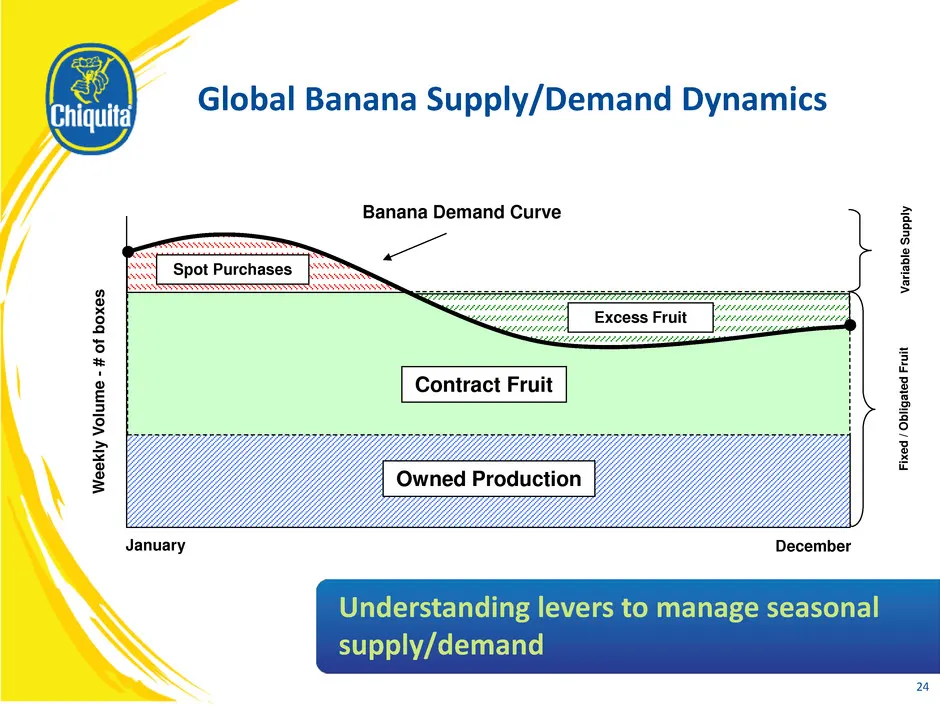
24 Global Banana Supply/Demand Dynamics W e e k ly V olum e - # o f box e s December January Owned Production F ix e d / O b li g a te d Fru it V a ri a b le Su p p ly Contract Fruit Spot Purchases Excess Fruit Understanding levers to manage supply in seasonal supply/demand markets seasonal supply/d
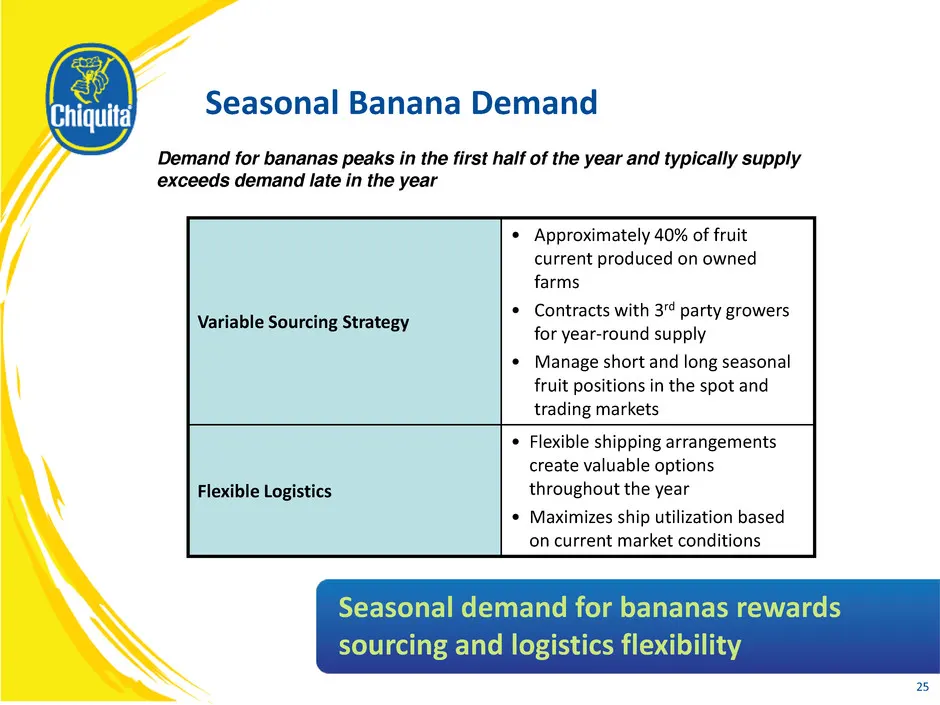
Slide 25: Seasonal Banana Demand
Seasonal Banana Demand Seasonal demand for bananas rewards sourcing and logistics flexibility Variable Sourcing Strategy • Approximately 40% of fruit current produced on owned farms • Contracts with 3rd party growers for year-round supply • Manage short and long seasonal fruit positions in the spot
Slide 26: Owned Farms - Bananas
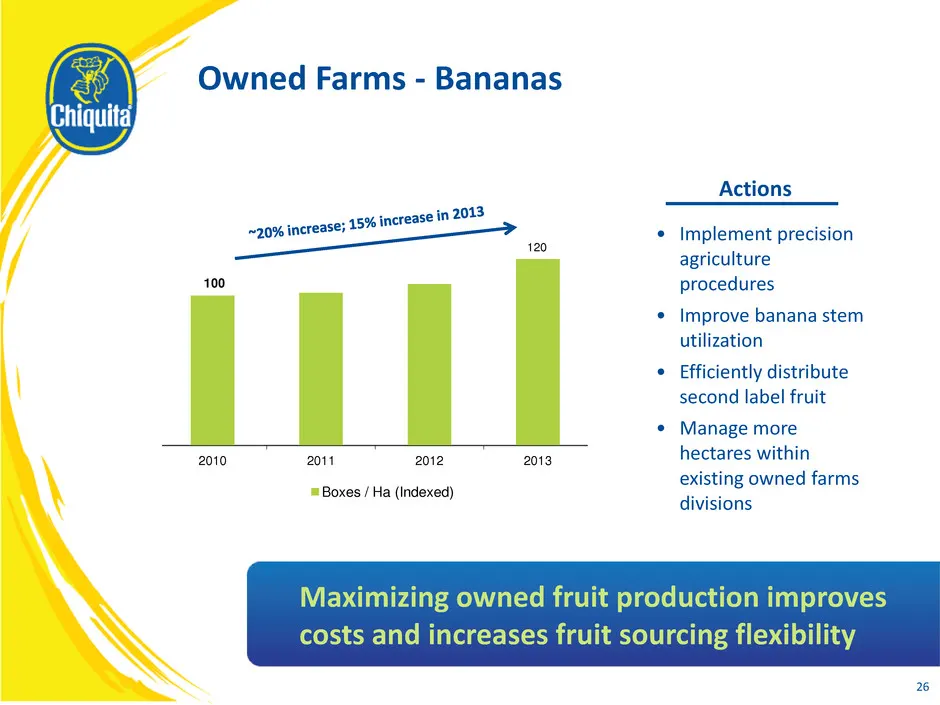
• Implement precision agriculture procedures • Improve banana stem utilization • Efficiently distribute second label fruit • Manage more hectares within existing owned farms divisions 100 102 108 124 2010 2011 2012 2013 Boxes / Ha (Indexed) 26 Owned Farms - Bananas Maximizing owned fruit production
Slide 27: Shipping and Logistics
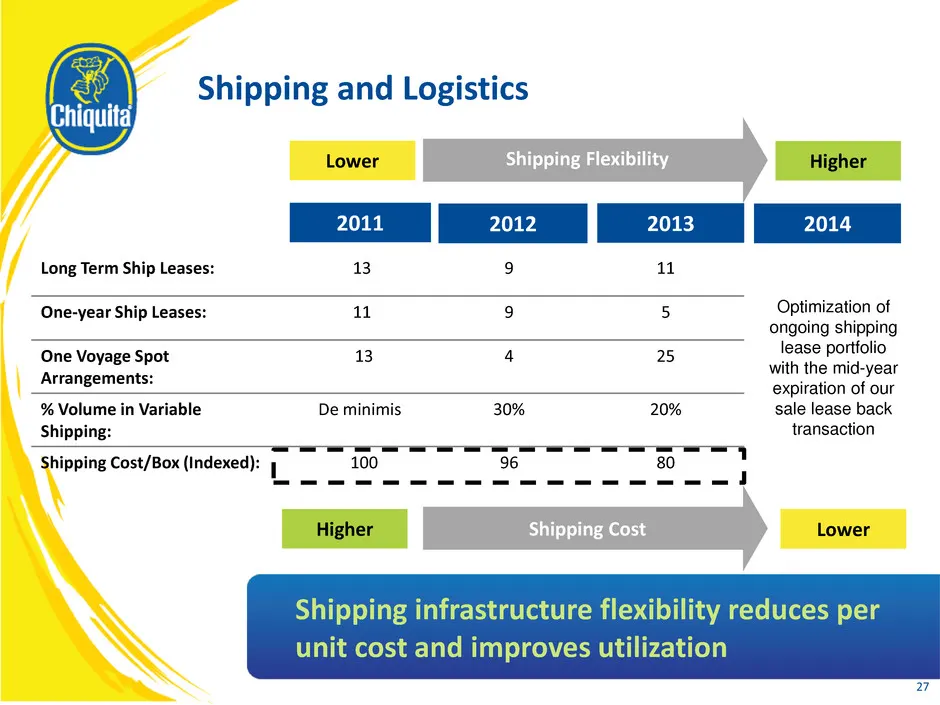
Shipping and Logistics 27 Shipping infrastructure flexibility reduces per unit cost and improves utilization Long Term Ship Leases: 13 9 11 One-year Ship Leases: 11 9 5 One Voyage Spot Arrangements: 13 4 25 % Volume in Variable Shipping: De minimis 30% 20% Shipping Cost/Box (Indexed): 100 96 80 2011
Slide 28: Strategic Operations - Salads
28 Strategic Operations - Salads
Slide 29: Salad priorities: Managing costs
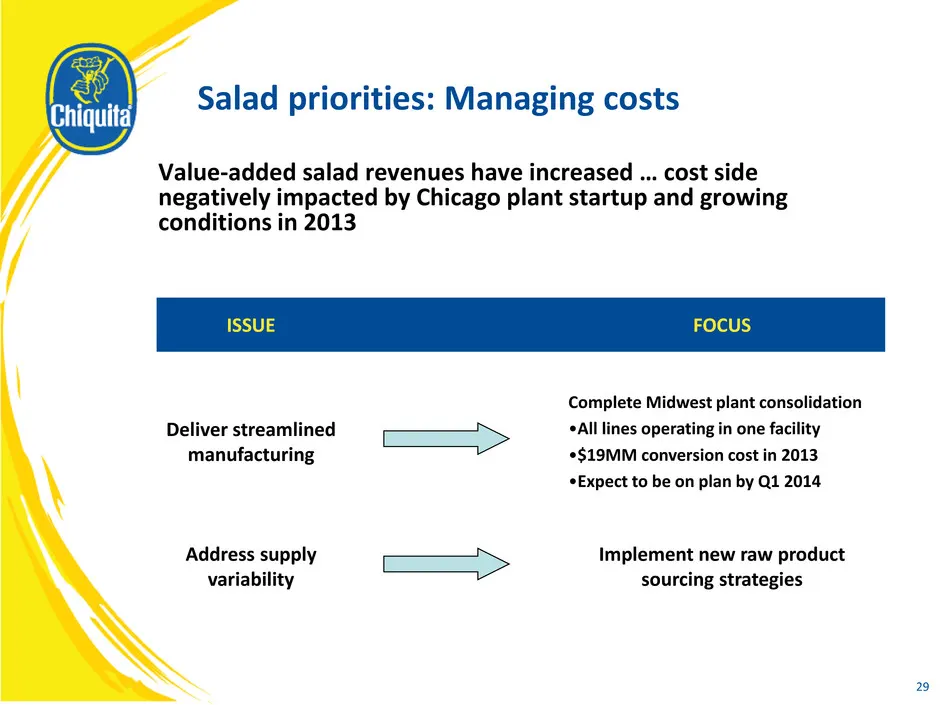
Salad priorities: Managing costs Value-added salad revenues have increased … cost side negatively impacted by Chicago plant startup and growing conditions in 2013 ISSUE FOCUS Deliver streamlined manufacturing Complete Midwest plant consolidation •All lines operating in one facility •$19MM conversion
Slide 30: Mitigating Salad Raw Product Seasonal Impacts
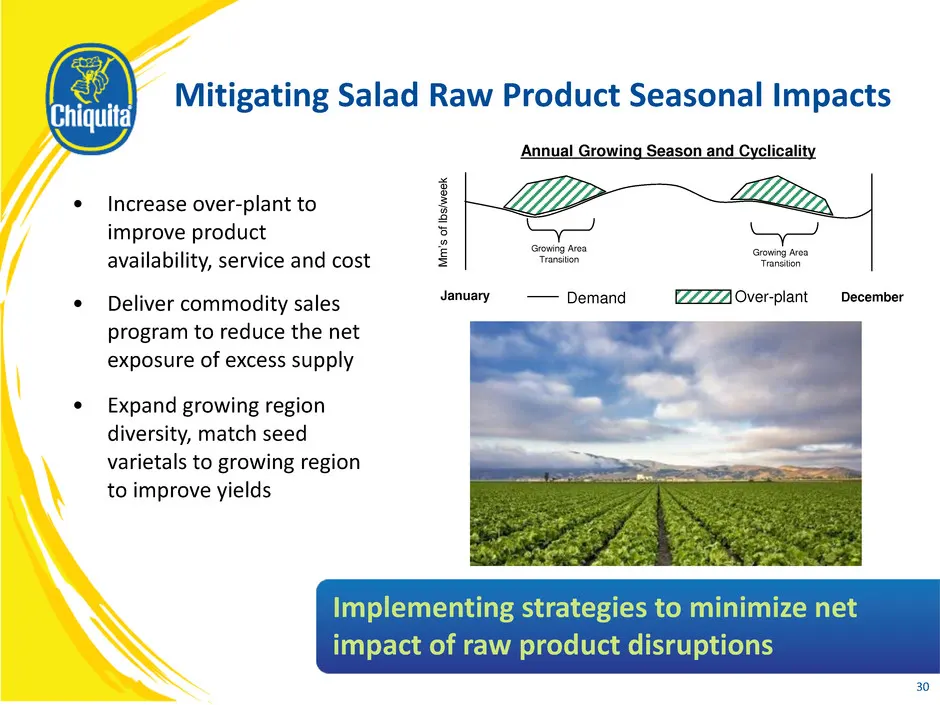
30 Mitigating Salad Raw Product Seasonal Impacts Implementing strategies to minimize net impact of raw product disruptions • Increase over-plant to improve product availability, service and cost Demand January December Growing Area Transition Growing Area Transition Over-plant Annual Growing Season
Slide 31: Financial Update
31 Financial Update
Slide 32: 3Q 2013 Financial Summary
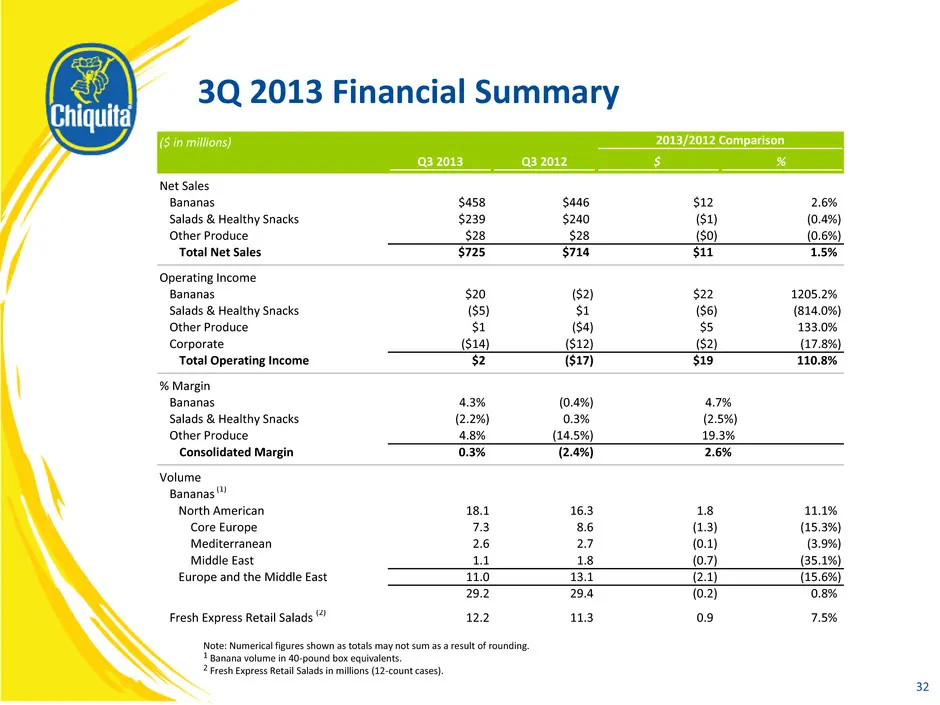
32 3Q 2013 Financial Summary Note: Numerical figures shown as totals may not sum as a result of rounding. 1 Banana volume in 40-pound box equivalents. 2 Fresh Express Retail Salads in millions (12-count cases). ($ in millions) Q3 2013 Q3 2012 $ % Net Sales Bananas $458 $446 $12 2.6% Salads & Healthy
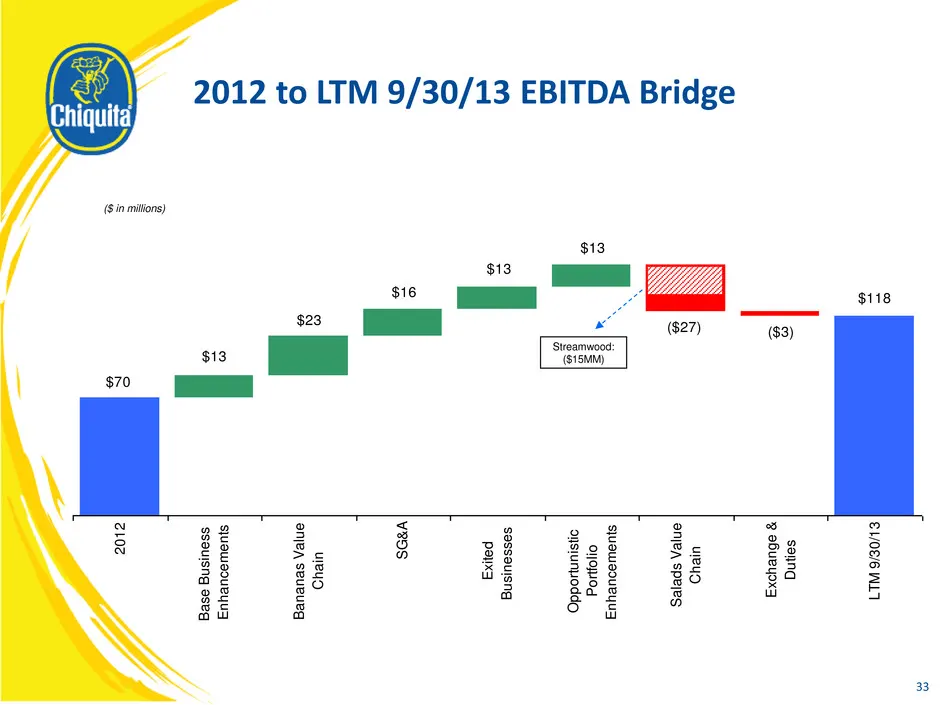
Slide 33: 2012 to LTM 9/30/13 EBITDA Bridge
$13 ($3) $70 $13 $13 $23 $16 $118 ($27) 20 12 Ba se Bu sin es s En ha nc em en ts Ba na na s V alu e Ch ain S G& A Ex ite d Bu sin ess es Op po rtu nis tic Po rtfo lio En ha nc em en ts Sa lad s V alu e Ch ain Ex ch an ge & Du tie s LT M 9/3 0/1 3 2012 to LTM 9/30/13 EBITDA Bridge ($ in millions) 33
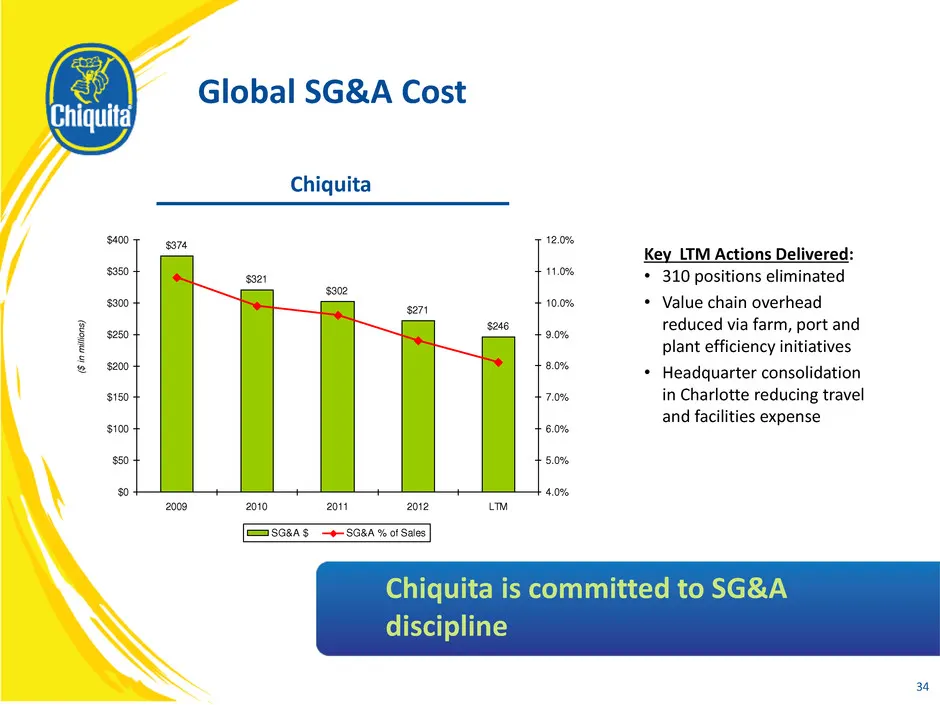
Slide 34: Global SG&A Cost
34 Global SG&A Cost Chiquita is committed to SG&A discipline Key LTM Actions Delivered: • 310 positions eliminated • Value chain overhead reduced via farm, port and plant efficiency initiatives • Headquarter consolidation in Charlotte reducing travel and facilities expense ($ in m ill io n s ) $374
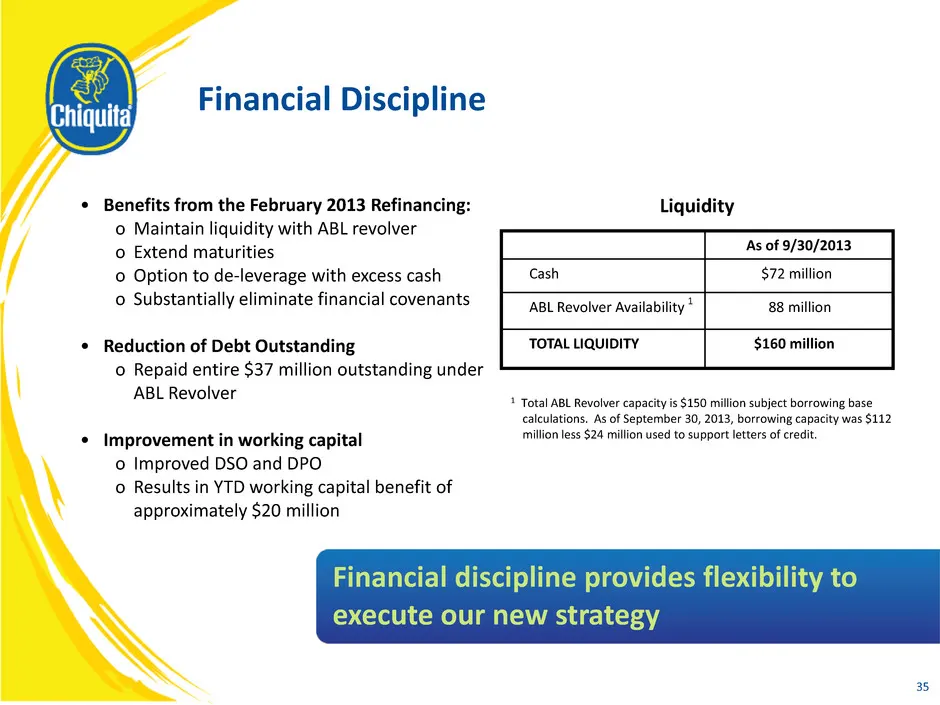
Slide 35: Financial Discipline
35 Financial Discipline Financial discipline provides flexibility to execute our new strategy As of 9/30/2013 Cash $72 million ABL Revolver Availability 1 88 million TOTAL LIQUIDITY $160 million 1 Total ABL Revolver capacity is $150 million subject borrowing base calculations. As of September 30, 20
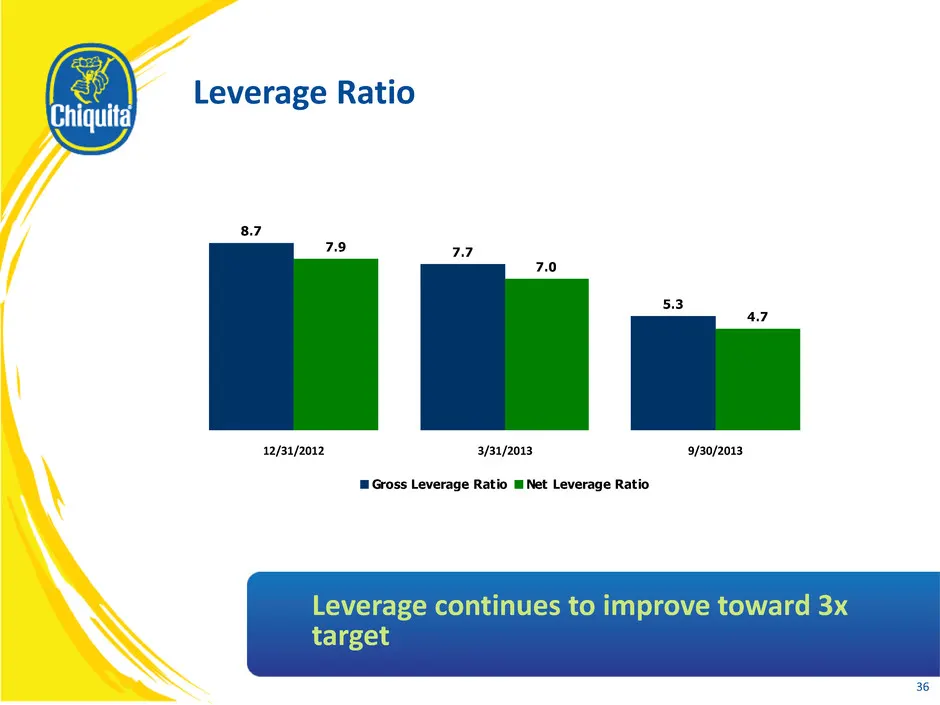
Slide 36: Leverage Ratio
Leverage Ratio 36 8.7 7.7 5.3 7.9 7.0 4.7 12/31/2012 3/31/2013 9/30/2013 Gross Leverage Ratio Net Leverage Ratio Leverage continues to improve toward 3x target
Slide 37: Long-term Financial Objectives
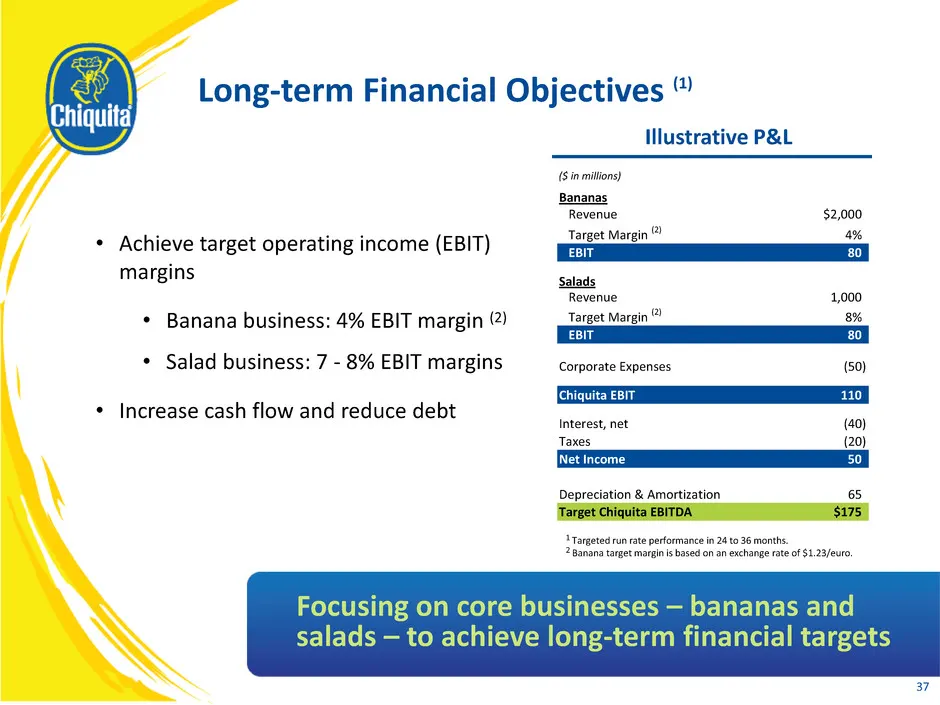
• Achieve target operating income (EBIT) margins • Banana business: 4% EBIT margin (2) • Salad business: 7 - 8% EBIT margins • Increase cash flow and reduce debt Long-term Financial Objectives (1) Focusing on core businesses – bananas and salads – to achieve long-term financial targets 37 1 Targeted
Slide 38: 2013 Summary and 2014 Preview
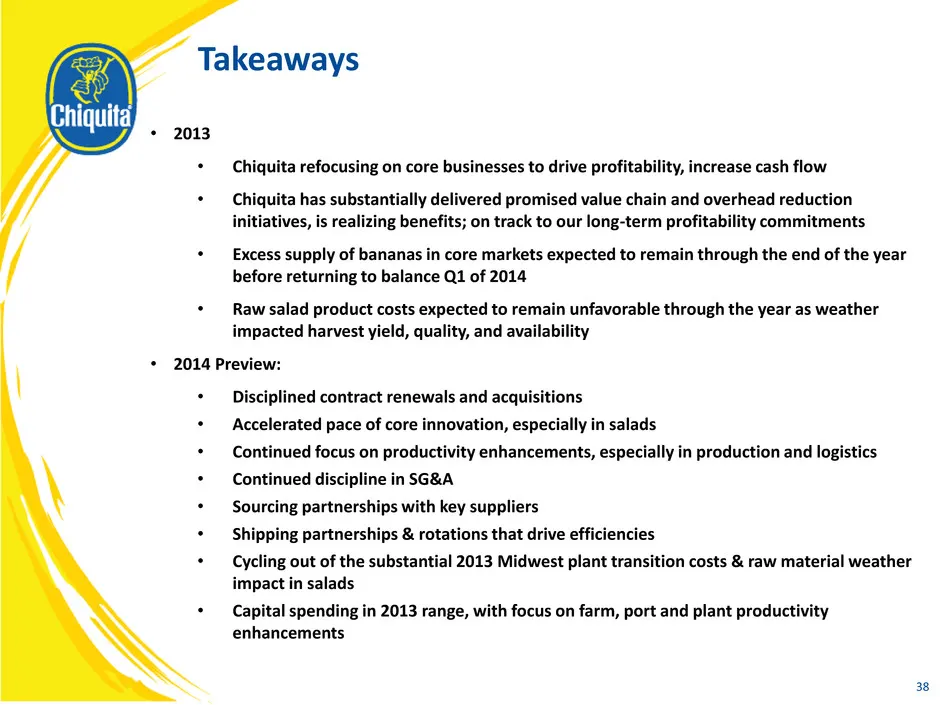
• 2013 • Chiquita refocusing on core businesses to drive profitability, increase cash flow • Chiquita has substantially delivered promised value chain and overhead reduction initiatives, is realizing benefits; on track to our long-term profitability commitments • Excess supply of bananas in core mar
Slide 39: Questions & Answers
Chiquita Brands Questions & Answers
Slide 40: Appendix
40 Appendix
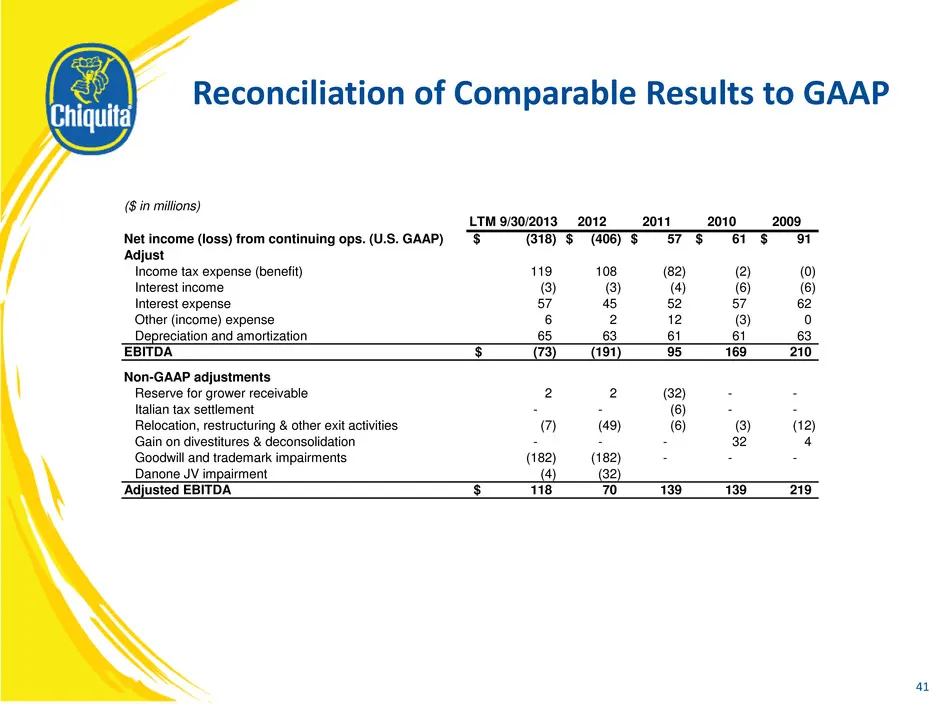
Slide 41: Reconciliation of Comparable Results to GAAP
41 Reconciliation of Comparable Results to GAAP ($ in millions) LTM 9/30/2013 2012 2011 2010 2009 Net income (loss) from continuing ops. (U.S. GAAP) (318)$ (406)$ 57$ 61$ 91$ Adjust Income tax expense (benefit) 119 108 (82) (2) (0) Interest income (3) (3) (4) (6) (6) Interest expense 57 45 52 57 62
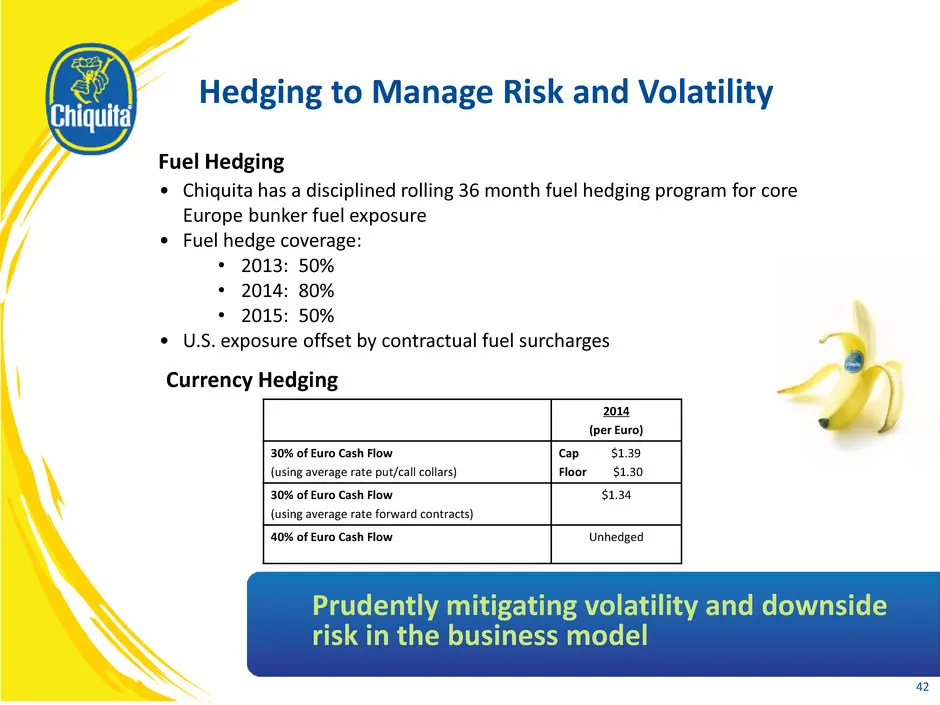
Slide 42: Hedging to Manage Risk and Volatility
42 • Chiquita has a disciplined rolling 36 month fuel hedging program for core Europe bunker fuel exposure • Fuel hedge coverage: • 2013: 50% • 2014: 80% • 2015: 50% • U.S. exposure offset by contractual fuel surcharges Hedging to Manage Risk and Volatility 2014 (per Euro) 30% of Euro Cash Flow (usi
Source: SEC EDGAR · 8-K filed Dec 10, 2013
More decks from Chiquita Brands International Inc
 Merger or Acquisition (October 2014)24 slides · Oct 20, 2014
 Merger or Acquisition (October 2014)23 slides · Oct 20, 2014
 Proxy Contest (October 2014)15 slides · Oct 16, 2014
 Merger or Acquisition (October 2014)15 slides · Oct 14, 2014
 Proxy Contest (September 2014)28 slides · Sep 23, 2014
 Merger or Acquisition (September 2014)23 slides · Sep 17, 2014