Copano Energy L.L.C — SMH Capital Investor Growth Conference 2007
29 slides from Copano Energy L.L.C's conference presentation, Nov 9, 2007
Slide 1: Copano Energy SMH Capital Investor Growth Conference
Copano Energy NASDAQ: CPNO SMH Capital Investor Growth Conference New York, NY November 8 - 9, 2007
Slide 2: Disclaimer
Disclaimer Statements made by representatives of Copano Energy, L.L.C. (the "Company") during this presentation may constitute "forward-looking statements" as defined by the Securities and Exchange Commission. All statements, other than statements of historical facts, made by representatives of the
Slide 3: Introduction to Copano Energy, L.L.C.
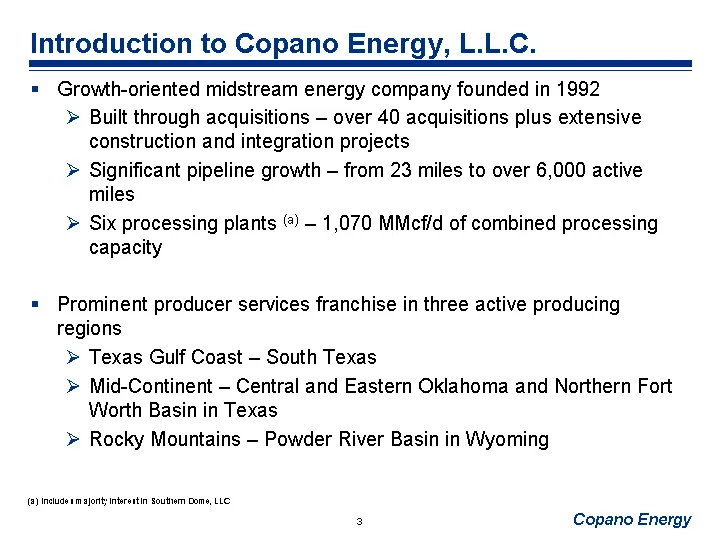
Introduction to Copano Energy, L.L.C. Growth-oriented midstream energy company founded in 1992 Built through acquisitions - over 40 acquisitions plus extensive construction and integration projects Significant pipeline growth - from 23 miles to over 6,000 active miles Six processing plants (a) - 1,0
Slide 4: Overview
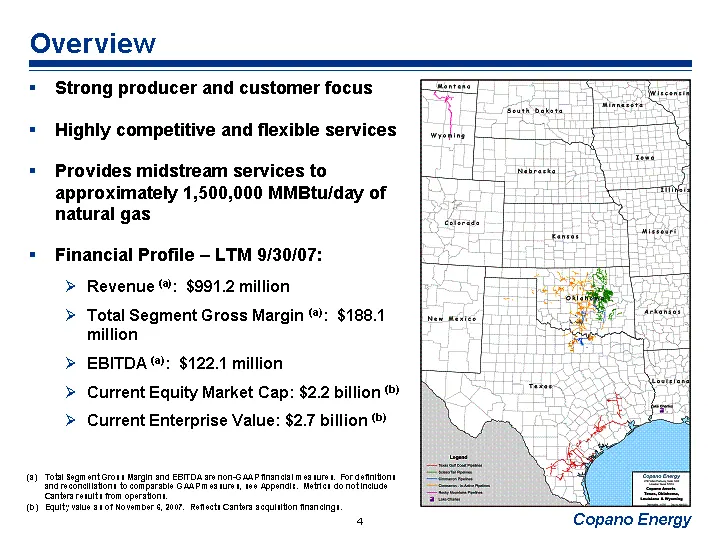
Overview Strong producer and customer focus Highly competitive and flexible services Provides midstream services to approximately 1,500,000 MMBtu/day of natural gas Financial Profile - LTM 9/30/07: Revenue (a): $991.2 million Total Segment Gross Margin (a): $188.1 million EBITDA (a): $122.1 million
Slide 5: Copano's LLC Structure
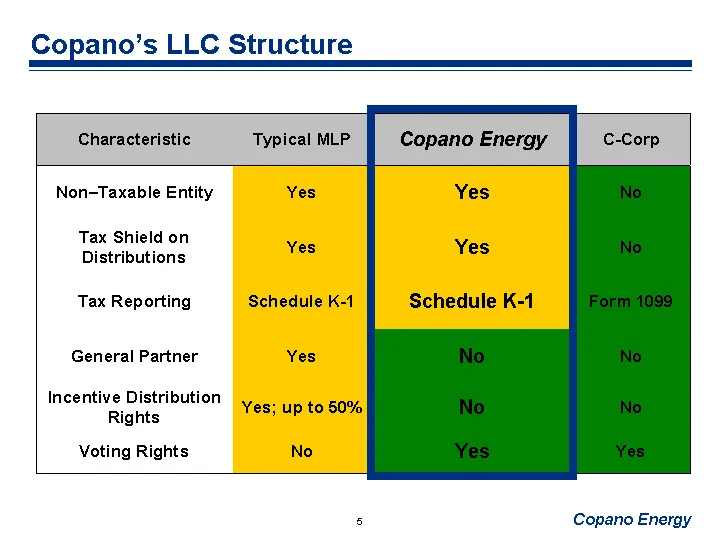
Copano's LLC Structure Characteristic Typical MLP Copano Energy C-Corp Non-Taxable Entity Yes Yes No Tax Shield on Distributions Yes Yes No Tax Reporting Schedule K-1 Schedule K-1 Form 1099 General Partner Yes No No Incentive Distribution Rights Yes; up to 50% No No Voting Rights No Yes Yes
Slide 6: LLC Benefits
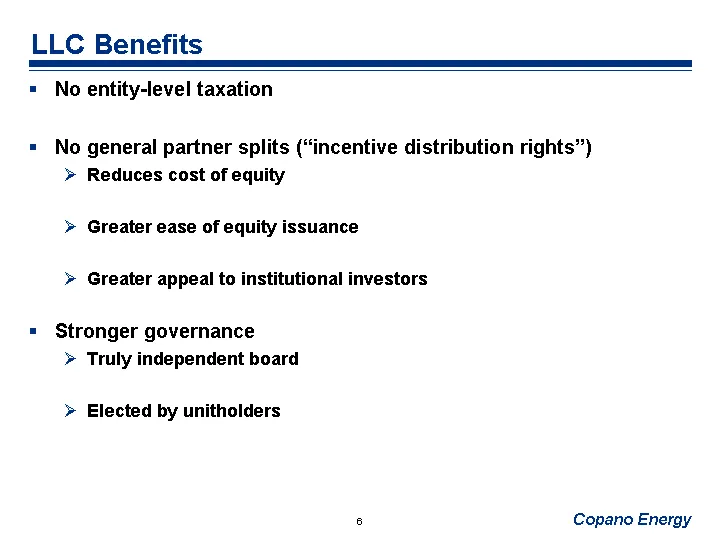
LLC Benefits No entity-level taxation No general partner splits ("incentive distribution rights") Reduces cost of equity Greater ease of equity issuance Greater appeal to institutional investors Stronger governance Truly independent board Elected by unitholders
Slide 7: CPNO Distributions vs. MLP with IDR's
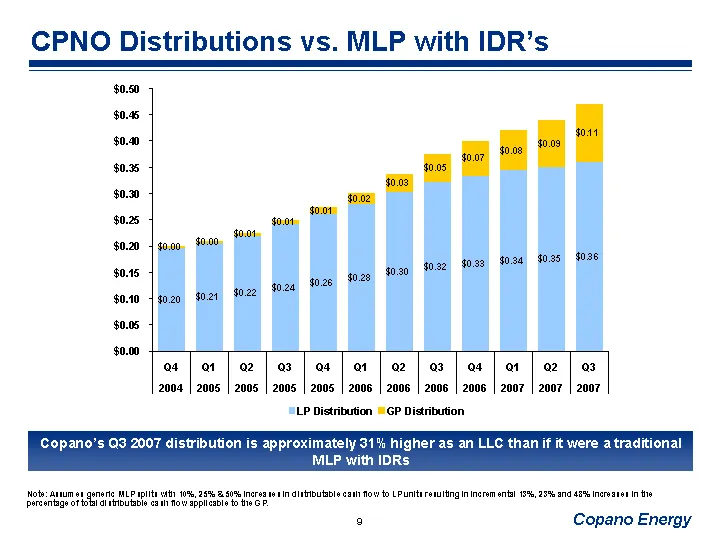
CPNO Distributions vs. MLP with IDR's Note: Assumes generic MLP splits with 10%, 25% & 50% increases in distributable cash flow to LP units resulting in incremental 13%, 23% and 48% increases in the percentage of total distributable cash flow applicable to the GP. Copano's Q3 2007 distribution is ap
Slide 8: General Partner Incentive Distribution Loads
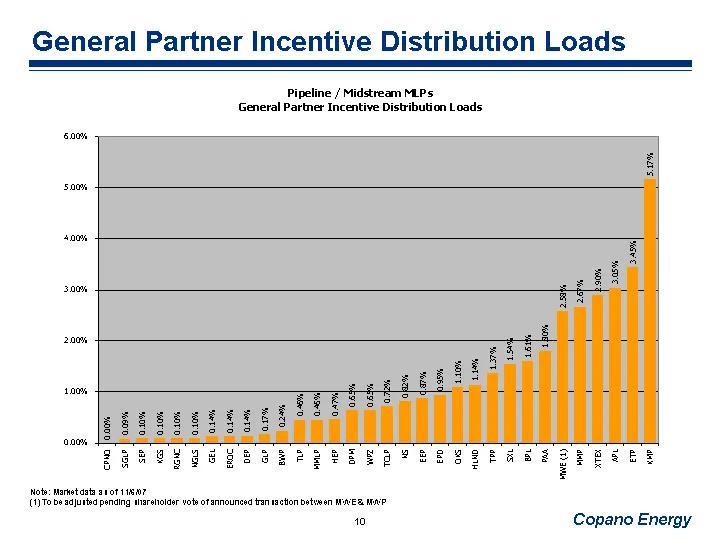
General Partner Incentive Distribution Loads Note: Market data as of 11/6/07 (1) To be adjusted pending shareholder vote of announced transaction between MWE & MWP
Slide 9: Comparative Distribution Yield
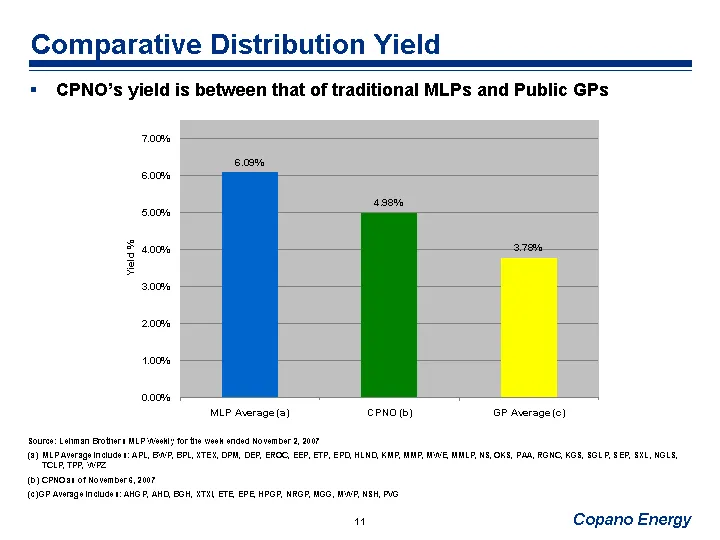
Comparative Distribution Yield CPNO's yield is between that of traditional MLPs and Public GPs Source: Lehman Brothers MLP Weekly for the week ended November 2, 2007 MLP Average includes: APL, BWP, BPL, XTEX, DPM, DEP, EROC, EEP, ETP, EPD, HLND, KMP, MMP, MWE, MMLP, NS, OKS, PAA, RGNC, KGS, SGLP, SE
Slide 10: Business Strategy
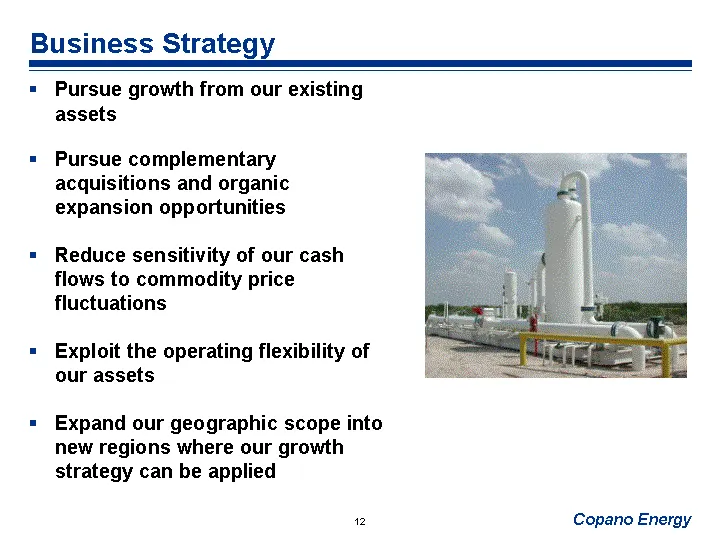
Business Strategy Pursue growth from our existing assets Pursue complementary acquisitions and organic expansion opportunities Reduce sensitivity of our cash flows to commodity price fluctuations Exploit the operating flexibility of our assets Expand our geographic scope into new regions where our g
Slide 11: Mid-Continent
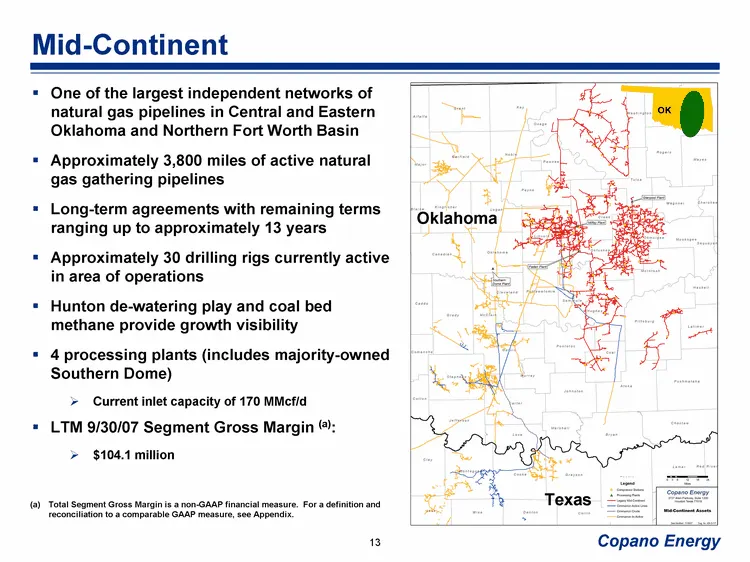
Mid-Continent One of the largest independent networks of natural gas pipelines in Central and Eastern Oklahoma and Northern Fort Worth Basin Approximately 3,800 miles of active natural gas gathering pipelines Long-term agreements with remaining terms ranging up to approximately 13 years Approximatel
Slide 12: Rocky Mountains - Cantera Acquisition
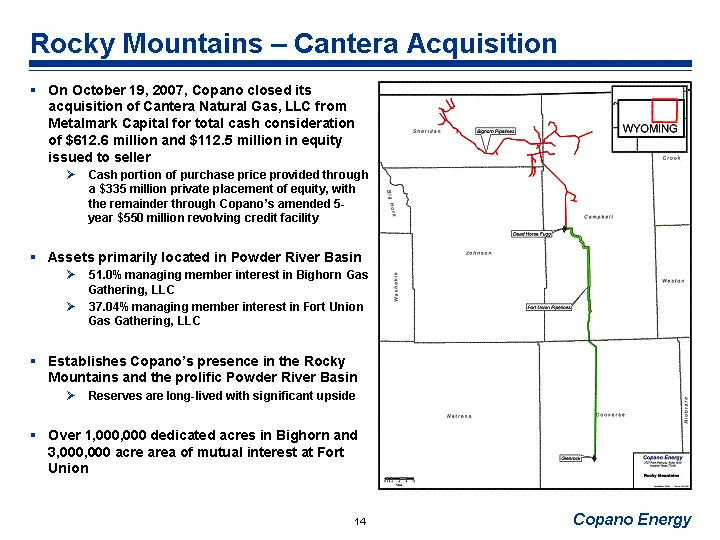
Rocky Mountains - Cantera Acquisition On October 19, 2007, Copano closed its acquisition of Cantera Natural Gas, LLC from Metalmark Capital for total cash consideration of $612.6 million and $112.5 million in equity issued to seller Cash portion of purchase price provided through a $335 million priv
Slide 13: Rocky Mountains - Cantera Acquisition (cont'd)
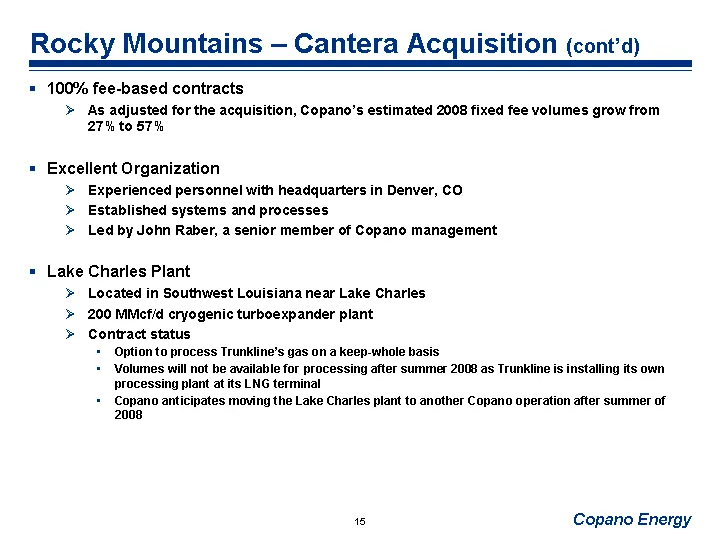
Rocky Mountains - Cantera Acquisition (cont'd) 100% fee-based contracts As adjusted for the acquisition, Copano's estimated 2008 fixed fee volumes grow from 27% to 57% Excellent Organization Experienced personnel with headquarters in Denver, CO Established systems and processes Led by John Raber, a
Slide 14: Texas Gulf Coast Pipelines
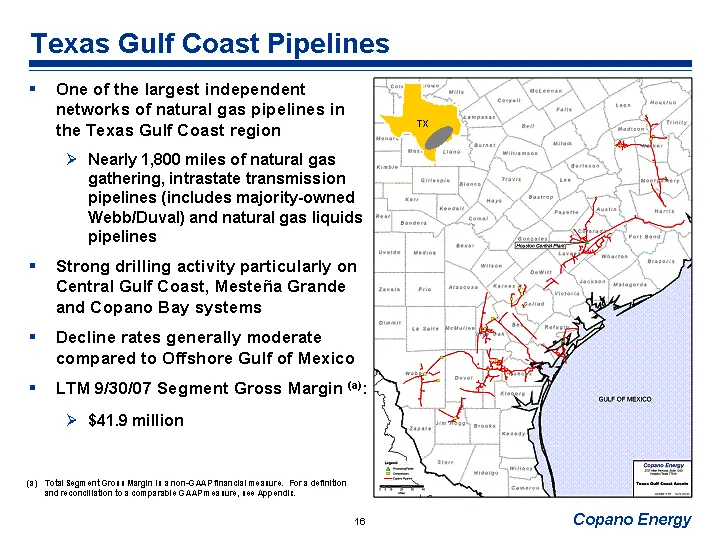
Texas Gulf Coast Pipelines One of the largest independent networks of natural gas pipelines in the Texas Gulf Coast region Nearly 1,800 miles of natural gas gathering, intrastate transmission pipelines (includes majority-owned Webb/Duval) and natural gas liquids pipelines Strong drilling activity pa
Slide 15: Texas Gulf Coast Processing
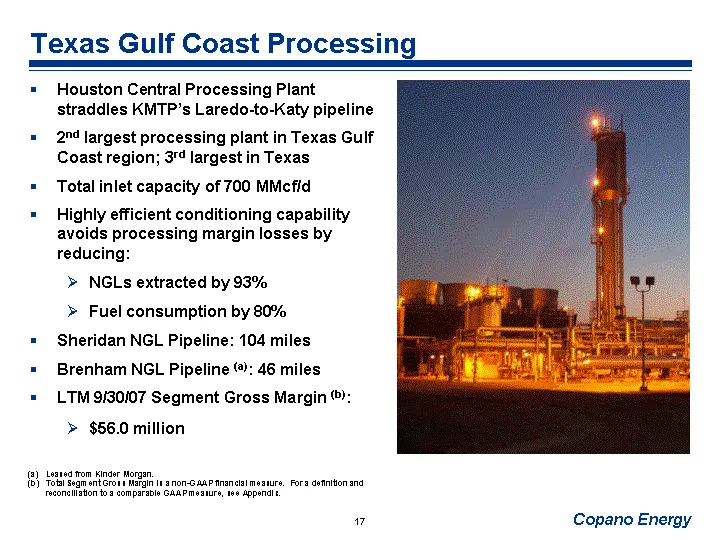
Texas Gulf Coast Processing Houston Central Processing Plant straddles KMTP's Laredo-to-Katy pipeline 2nd largest processing plant in Texas Gulf Coast region; 3rd largest in Texas Total inlet capacity of 700 MMcf/d Highly efficient conditioning capability avoids processing margin losses by reducing:
Slide 16: Producer Relationships
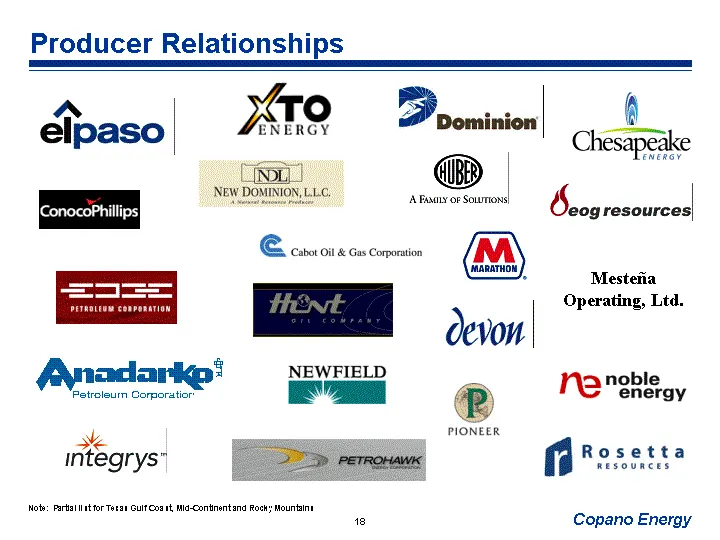
Producer Relationships Note: Partial list for Texas Gulf Coast, Mid-Continent and Rocky Mountains Mestena Operating, Ltd.
Slide 17: Highly-Rated Service Provider
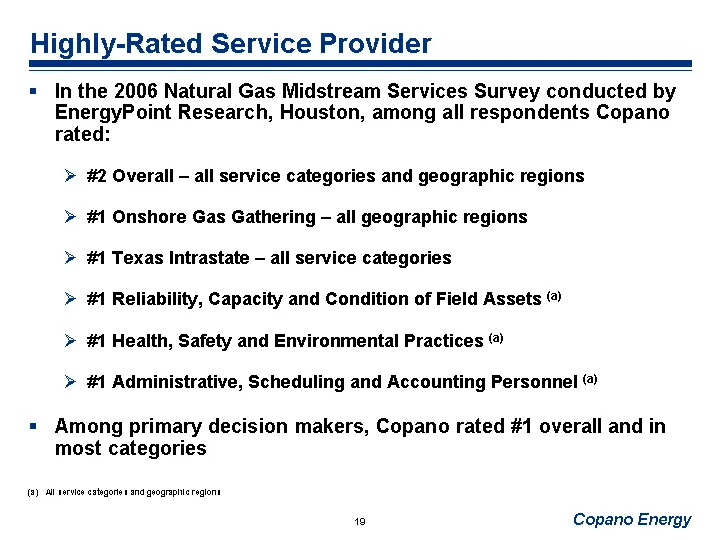
Highly-Rated Service Provider In the 2006 Natural Gas Midstream Services Survey conducted by EnergyPoint Research, Houston, among all respondents Copano rated: #2 Overall - all service categories and geographic regions #1 Onshore Gas Gathering - all geographic regions #1 Texas Intrastate - all servi
Slide 18: Organic Growth & Bolt-on Capital Spending
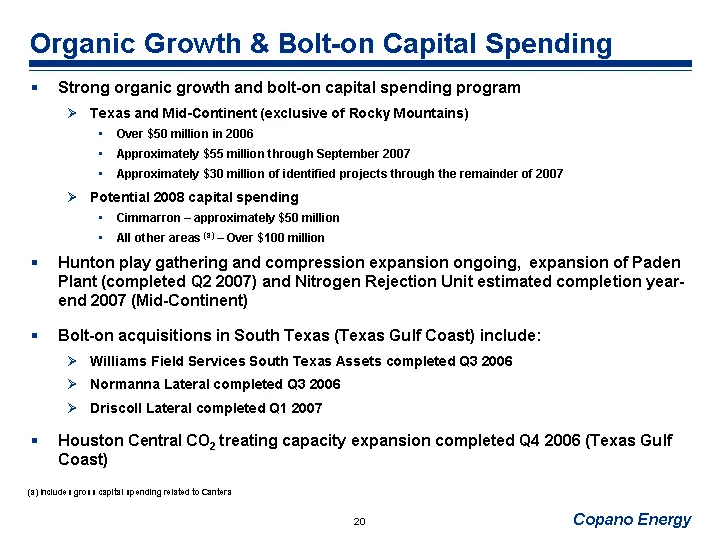
Organic Growth & Bolt-on Capital Spending Strong organic growth and bolt-on capital spending program Texas and Mid-Continent (exclusive of Rocky Mountains) Over $50 million in 2006 Approximately $55 million through September 2007 Approximately $30 million of identified projects through the remainder
Slide 19: Hedging Program and Risk Management
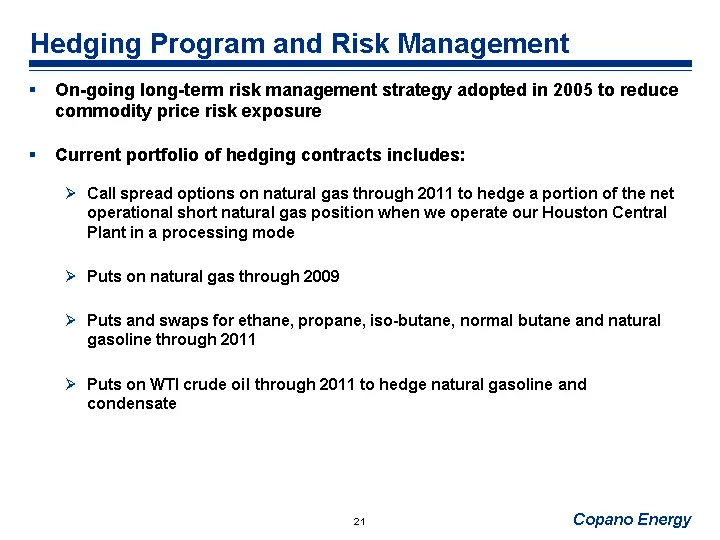
Hedging Program and Risk Management On-going long-term risk management strategy adopted in 2005 to reduce commodity price risk exposure Current portfolio of hedging contracts includes: Call spread options on natural gas through 2011 to hedge a portion of the net operational short natural gas positio
Slide 20: Financial Structure
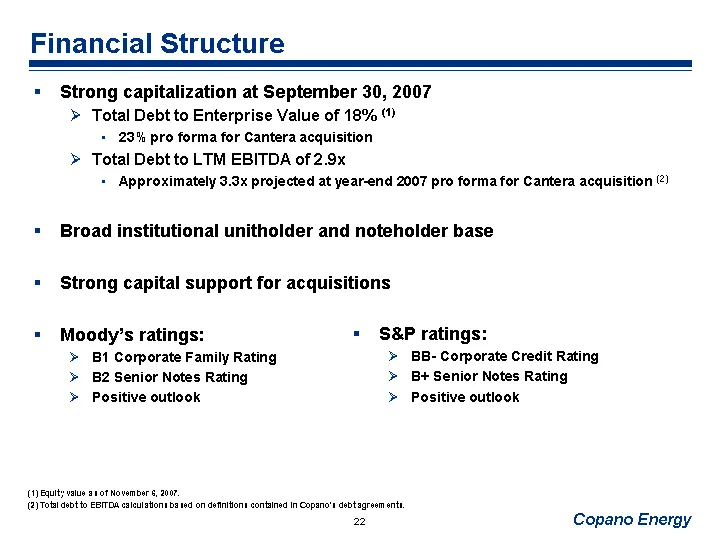
Financial Structure Strong capitalization at September 30, 2007 Total Debt to Enterprise Value of 18% (1) 23% pro forma for Cantera acquisition Total Debt to LTM EBITDA of 2.9x Approximately 3.3x projected at year-end 2007 pro forma for Cantera acquisition (2) Broad institutional unitholder and note
Slide 21: Financial Policy
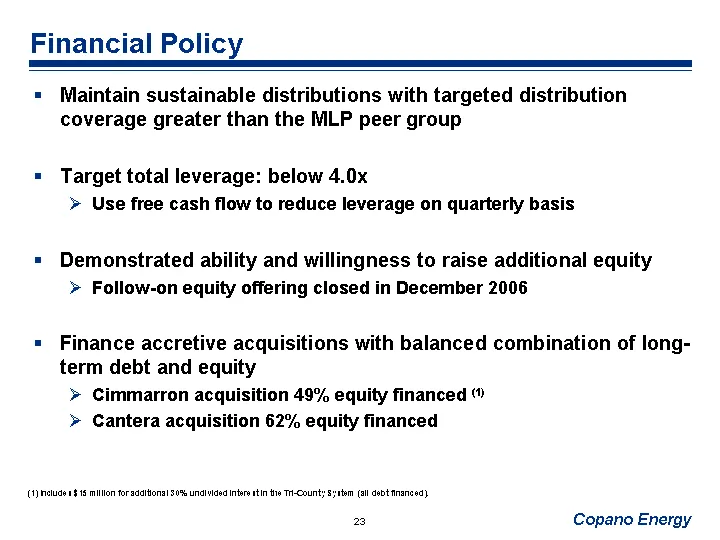
Financial Policy Maintain sustainable distributions with targeted distribution coverage greater than the MLP peer group Target total leverage: below 4.0x Use free cash flow to reduce leverage on quarterly basis Demonstrated ability and willingness to raise additional equity Follow-on equity offering
Slide 22: Experienced Management Team and Board of Directors
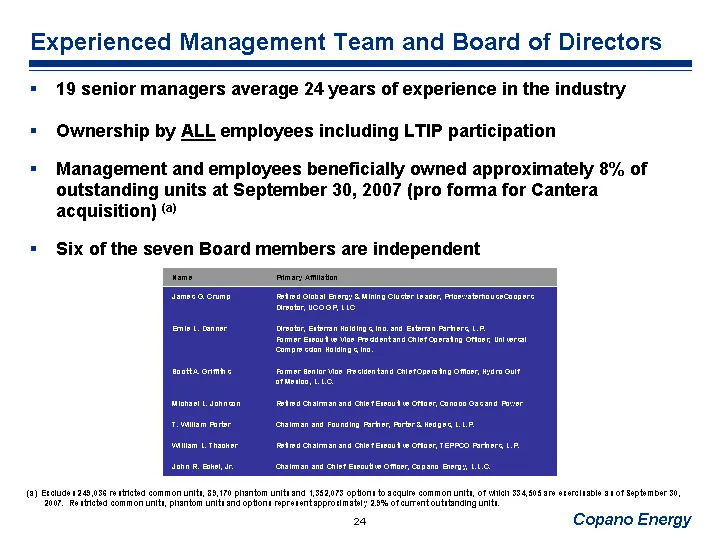
Experienced Management Team and Board of Directors 19 senior managers average 24 years of experience in the industry Ownership by ALL employees including LTIP participation Management and employees beneficially owned approximately 8% of outstanding units at September 30, 2007 (pro forma for Cantera
Slide 23: Total Segment Gross Margin
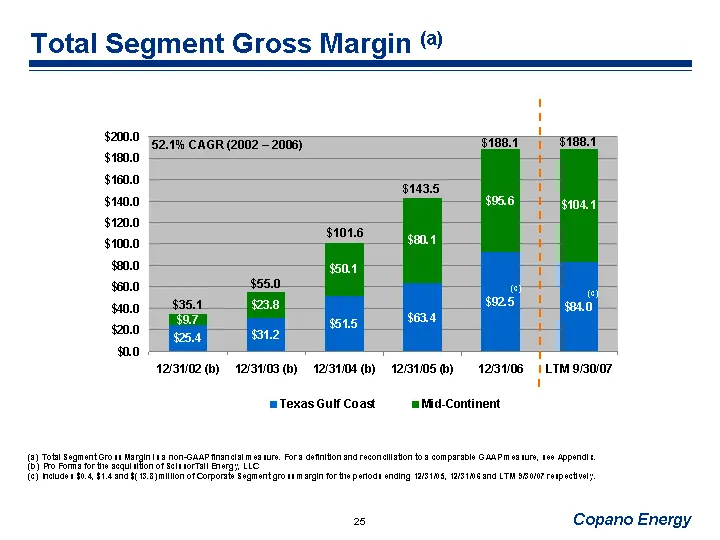
(c) $35.1 $55.0 $101.6 $143.5 (c) 52.1% CAGR (2002 - 2006) $188.1 Total Segment Gross Margin (a) (a) Total Segment Gross Margin is a non-GAAP financial measure. For a definition and reconciliation to a comparable GAAP measure, see Appendix. (b) Pro Forma for the acquisition of ScissorTail Energy, LL
Slide 24: Combined EBITDA
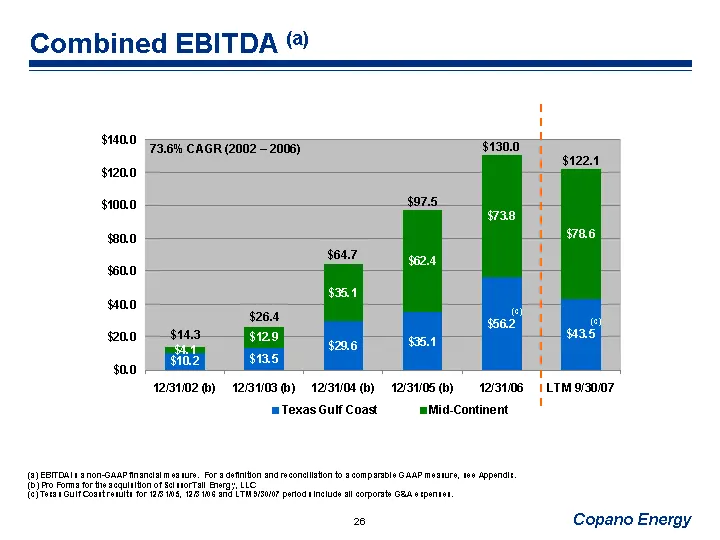
Combined EBITDA (a) (a) EBITDA is a non-GAAP financial measure. For a definition and reconciliation to a comparable GAAP measure, see Appendix. (b) Pro Forma for the acquisition of ScissorTail Energy, LLC (c) Texas Gulf Coast results for 12/31/05, 12/31/06 and LTM 9/30/07 periods include all corpora
Slide 25: Key Investment Merits
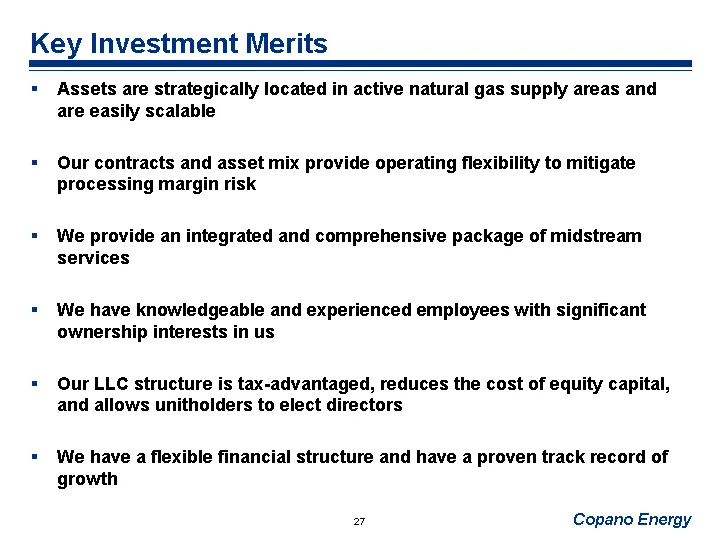
Key Investment Merits Assets are strategically located in active natural gas supply areas and are easily scalable Our contracts and asset mix provide operating flexibility to mitigate processing margin risk We provide an integrated and comprehensive package of midstream services We have knowledgeabl
Slide 26: Appendix
Appendix
Slide 27: Reconciliation of Non-GAAP Financial Measures: Gross Margin
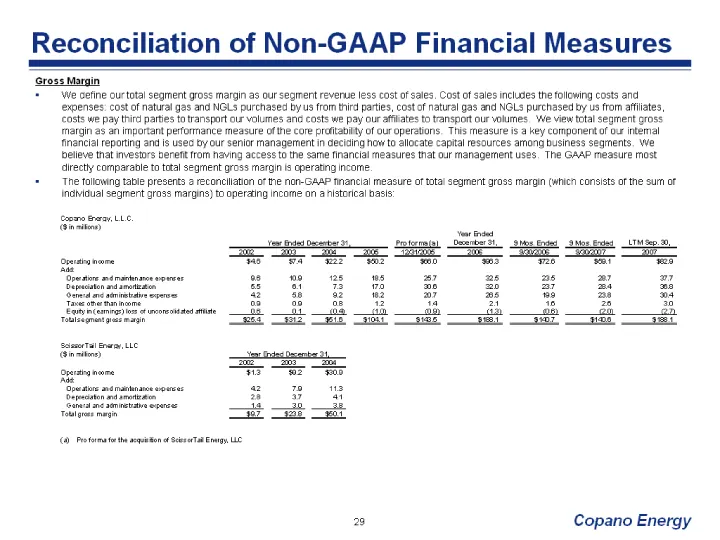
Reconciliation of Non-GAAP Financial Measures Gross Margin We define our total segment gross margin as our segment revenue less cost of sales. Cost of sales includes the following costs and expenses: cost of natural gas and NGLs purchased by us from third parties, cost of natural gas and NGLs purcha
Slide 28: Reconciliation of Non-GAAP Financial Measures: EBITDA
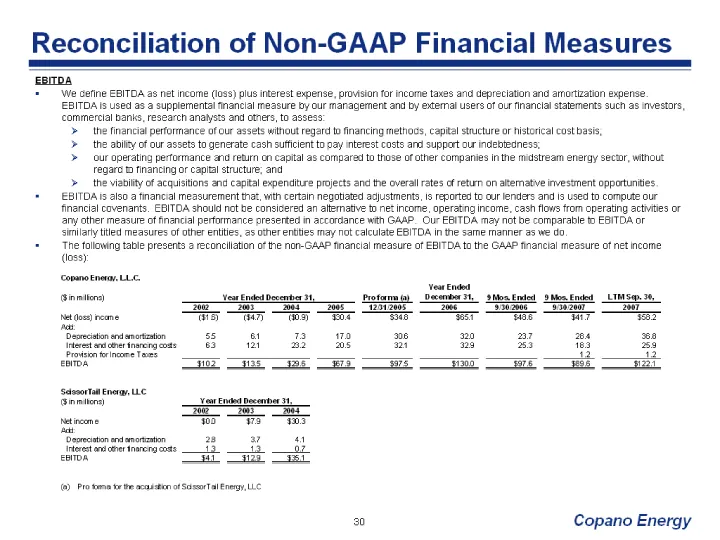
Reconciliation of Non-GAAP Financial Measures EBITDA We define EBITDA as net income (loss) plus interest expense, provision for income taxes and depreciation and amortization expense. EBITDA is used as a supplemental financial measure by our management and by external users of our financial statemen
Slide 29: Copano Energy
Copano Energy NASDAQ: CPNO
Source: SEC EDGAR · 8-K filed Nov 9, 2007
More decks from Copano Energy L.L.C.
 2012 RBC Capital Markets MLP Conference35 slides · Nov 15, 2012
 2012 Citi One-on-One MLP/Midstream Infrastructure Conference35 slides · Aug 21, 2012
 Investor Presentation (June 2012)34 slides · Jun 18, 2012
 NAPTP 2012 MLP Investor Conference34 slides · May 22, 2012
 Morgan Stanley MLP and Diversified Natural Gas Corporate Access Day 201245 slides · Mar 7, 2012
 2011 RBC Capital Markets MLP Conference42 slides · Nov 17, 2011