CenterState Bank — CenterState Banks — Sandler O'Neill + Partners East Coast Financial Services Conference 2015
34 slides from CenterState Bank's conference presentation, Nov 10, 2015
Slide 1: Sandler O'Neill East Coast Financial Services Conference
Sandler O’Neill + Partners, L.P. East Coast Financial Services Conference Palm Beach, FL November 11, 2015 Exhibit 99.1
Slide 2: Forward Looking Statement
This presentation contains forward-looking statements, as defined by Federal Securities Laws, relating to present or future trends or factors affecting the operations, markets and products of CenterState Banks, Inc. (CSFL). These statements are provided to assist in the understanding of future finan
Slide 3: Corporate Overview
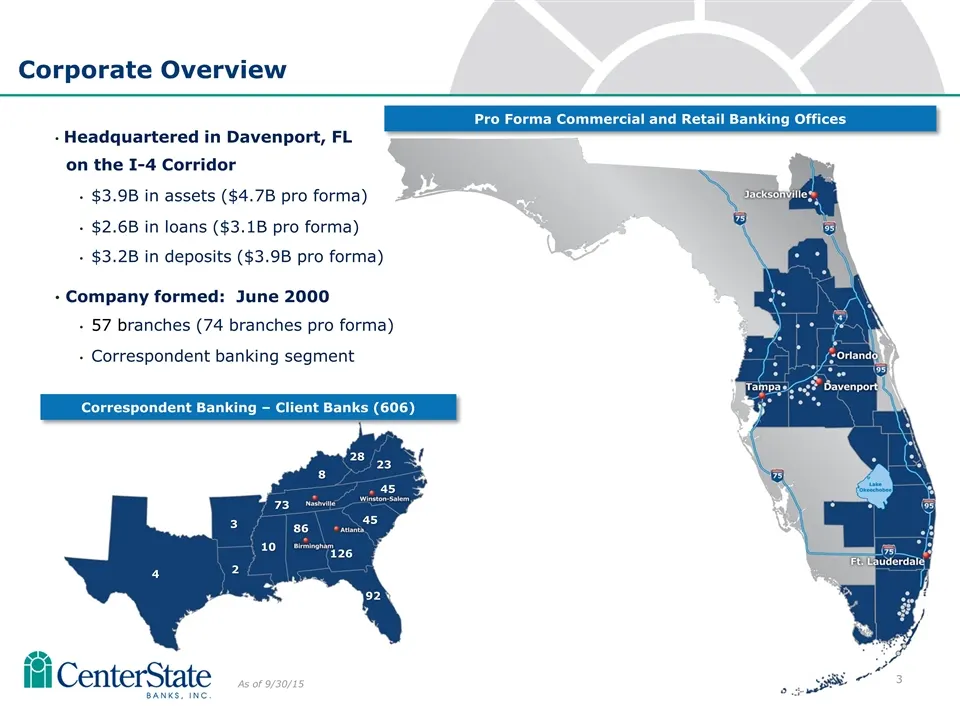
4 3 2 10 86 73 92 126 45 45 8 23 28 As of 9/30/15 Headquartered in Davenport, FL on the I-4 Corridor $3.9B in assets ($4.7B pro forma) $2.6B in loans ($3.1B pro forma) $3.2B in deposits ($3.9B pro forma) Company formed: June 2000 57 branches (74 branches pro forma) Correspondent banking segment Corp
Slide 4: Banking the Sunshine State
Banking the Sunshine State
Slide 5: Why invest in Florida?
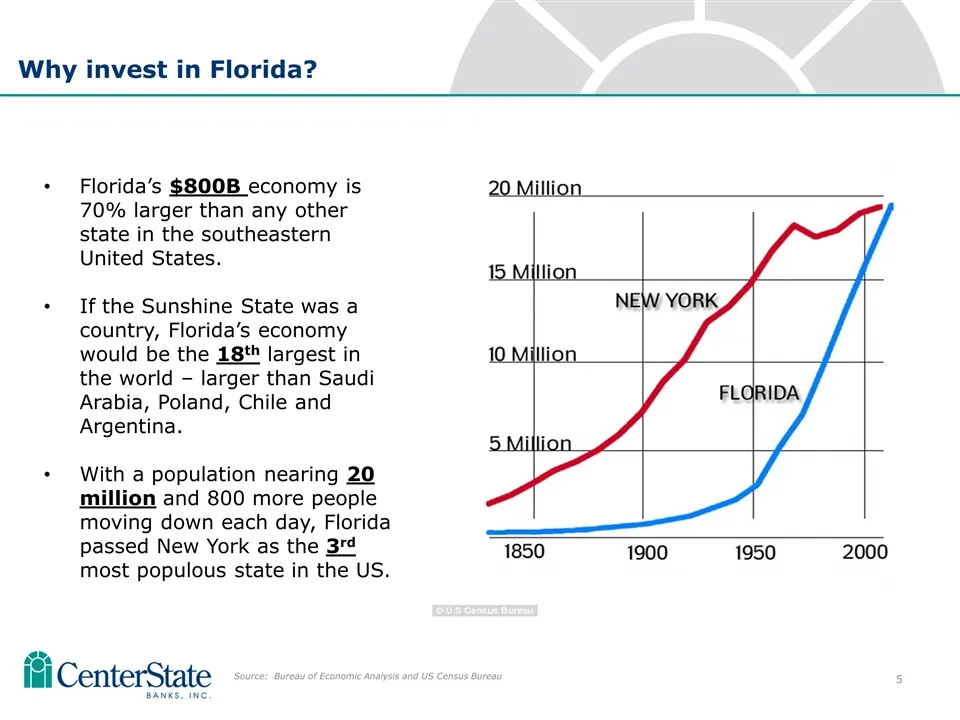
Florida’s $800B economy is 70% larger than any other state in the southeastern United States. If the Sunshine State was a country, Florida’s economy would be the 18th largest in the world – larger than Saudi Arabia, Poland, Chile and Argentina. With a population nearing 20 million and 800 more peopl
Slide 6: Why invest in Florida? Housing and employment
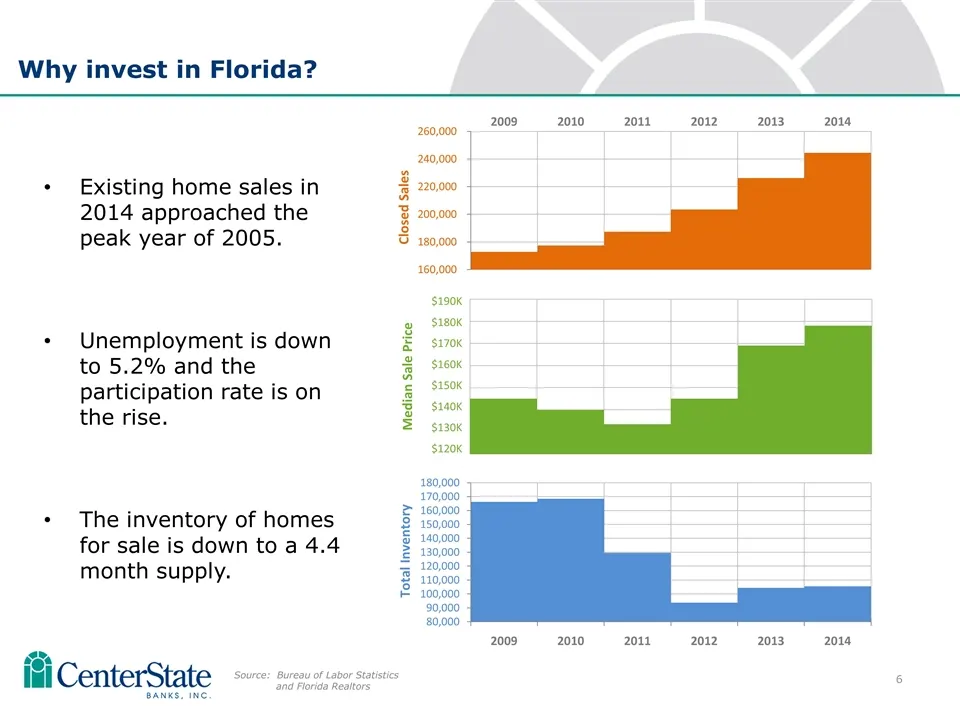
Existing home sales in 2014 approached the peak year of 2005. Unemployment is down to 5.2% and the participation rate is on the rise. The inventory of homes for sale is down to a 4.4 month supply. Why invest in Florida? Source: Bureau of Labor Statistics and Florida Realtors Median Sale Price $190K
Slide 7: Why invest in Florida? Tourism
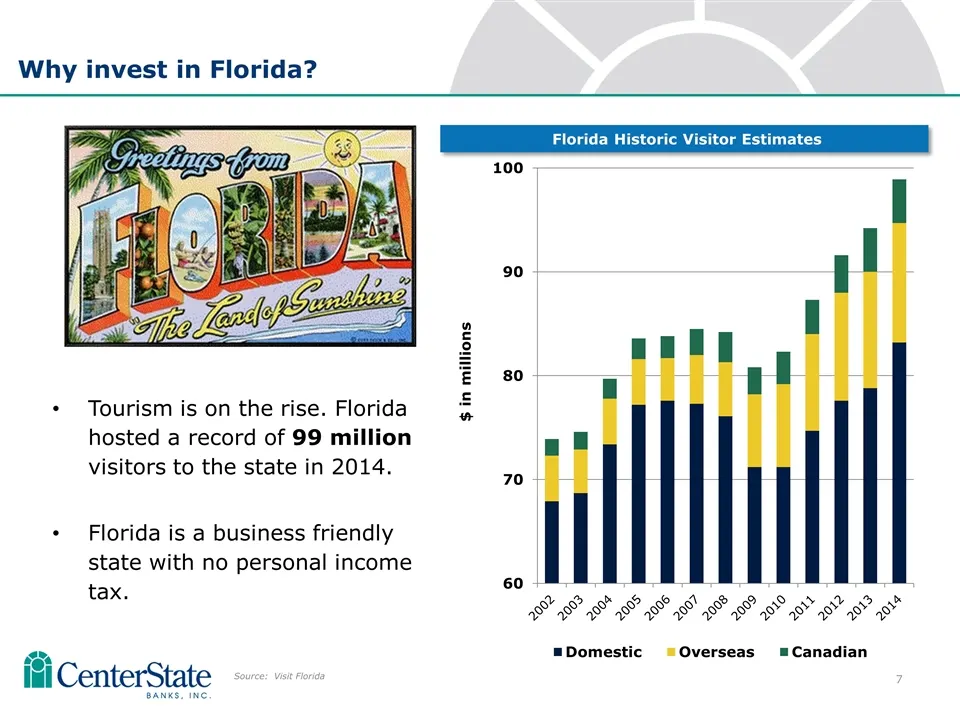
Tourism is on the rise. Florida hosted a record of 99 million visitors to the state in 2014. Florida is a business friendly state with no personal income tax. Why invest in Florida? Source: Visit Florida Florida Historic Visitor Estimates
Slide 8: Capital Management
Capital Management
Slide 9: CSFL – Best Positioned Florida Consolidator
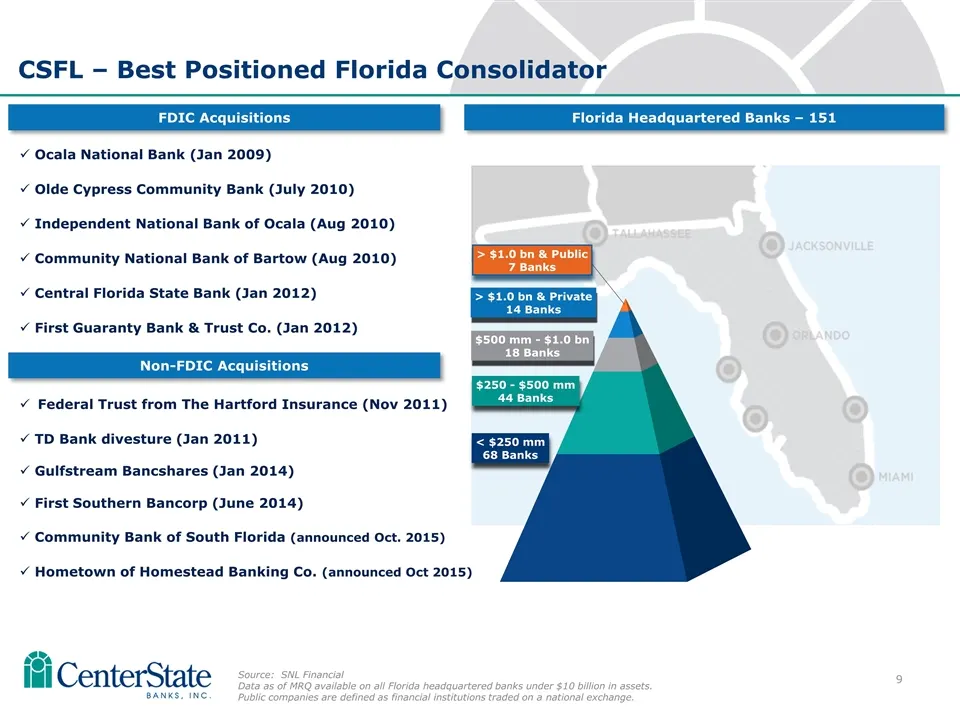
18 CSFL – Best Positioned Florida Consolidator Source: SNL Financial Data as of MRQ available on all Florida headquartered banks under $10 billion in assets. Public companies are defined as financial institutions traded on a national exchange. Ocala National Bank (Jan 2009) Olde Cypress Community Ba
Slide 10: 3Q15 Acquisitions
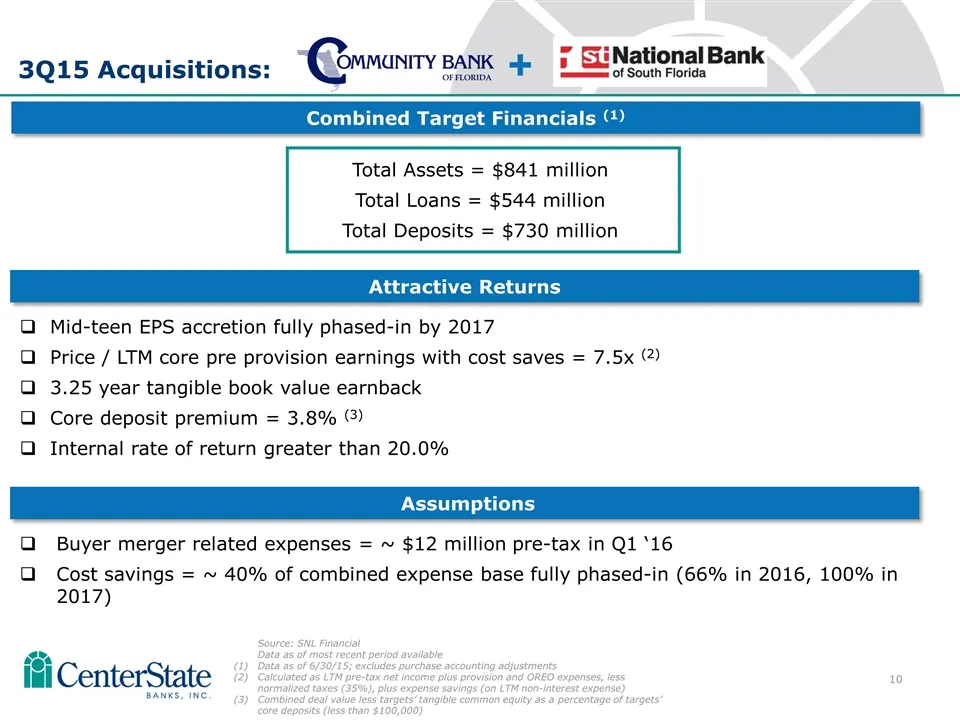
3Q15 Acquisitions: Total Assets = $841 million Total Loans = $544 million Total Deposits = $730 million Assumptions Buyer merger related expenses = ~ $12 million pre-tax in Q1 ‘16 Cost savings = ~ 40% of combined expense base fully phased-in (66% in 2016, 100% in 2017) Combined Target Financials (1)
Slide 11: Overview of Pro Forma Franchise
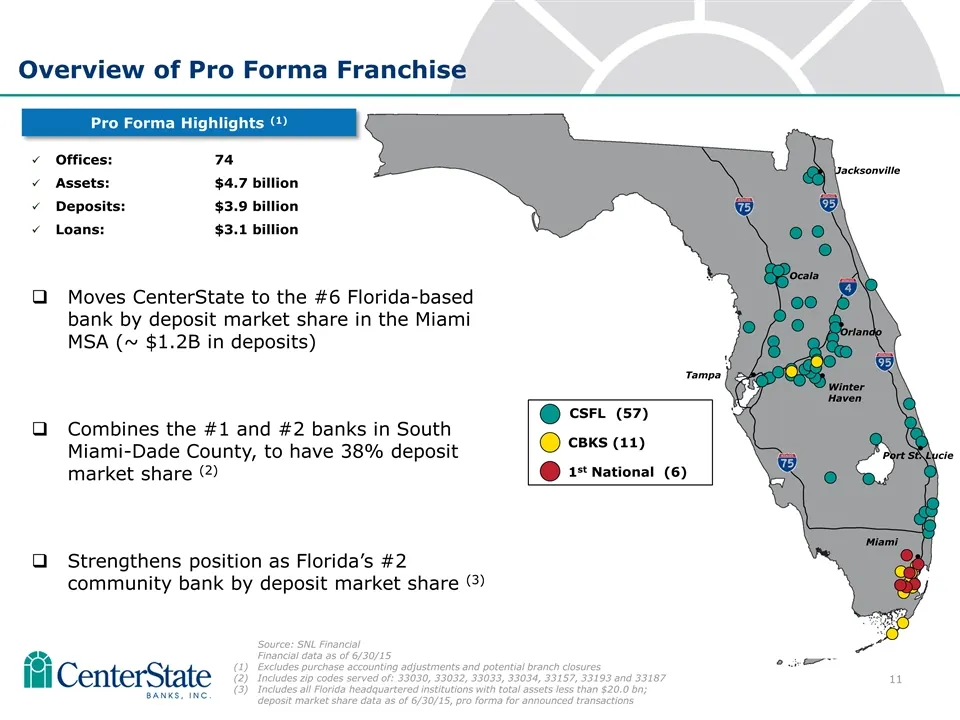
Offices: 74 Assets: $4.7 billion Deposits: $3.9 billion Loans: $3.1 billion CSFL (57) CBKS (11) 1st National (6) Tampa Jacksonville Orlando Winter Haven Miami Port St. Lucie Overview of Pro Forma Franchise Source: SNL Financial Financial data as of 6/30/15 Excludes purchase accounting adjustments an
Slide 12: Significant Branch Overlap
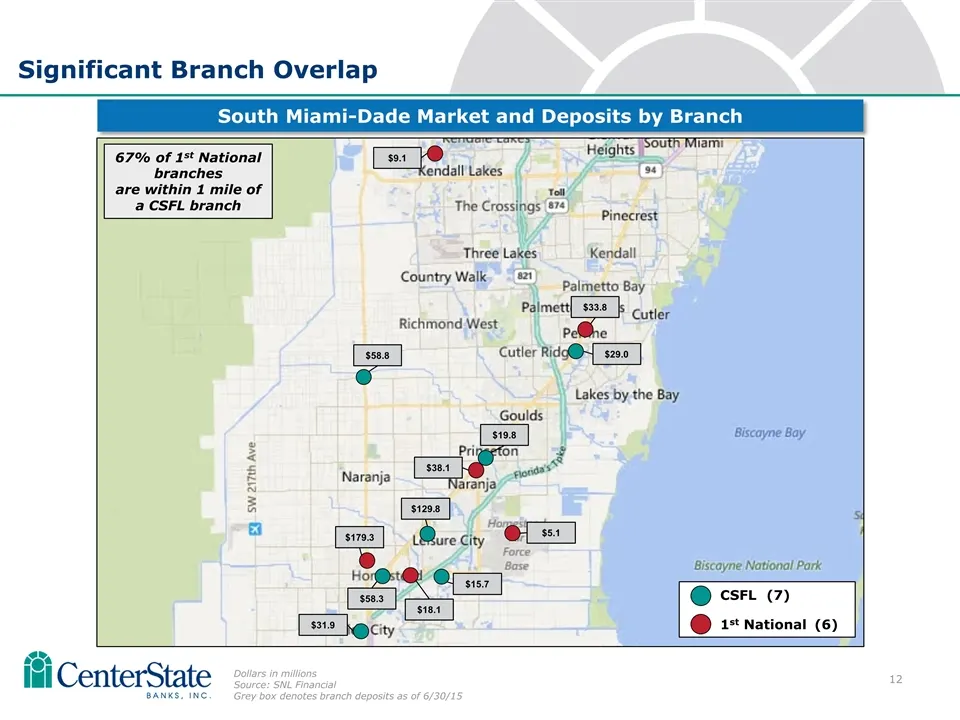
Significant Branch Overlap South Miami-Dade Market and Deposits by Branch Dollars in millions Source: SNL Financial Grey box denotes branch deposits as of 6/30/15 $29.0 $19.8 $31.9 $179.3 67% of 1st National branches are within 1 mile of a CSFL branch CSFL (7) 1st National (6) $58.3 $15.7 $18.1 $129
Slide 13: Earnings
Earnings
Slide 14: Profitability Metrics
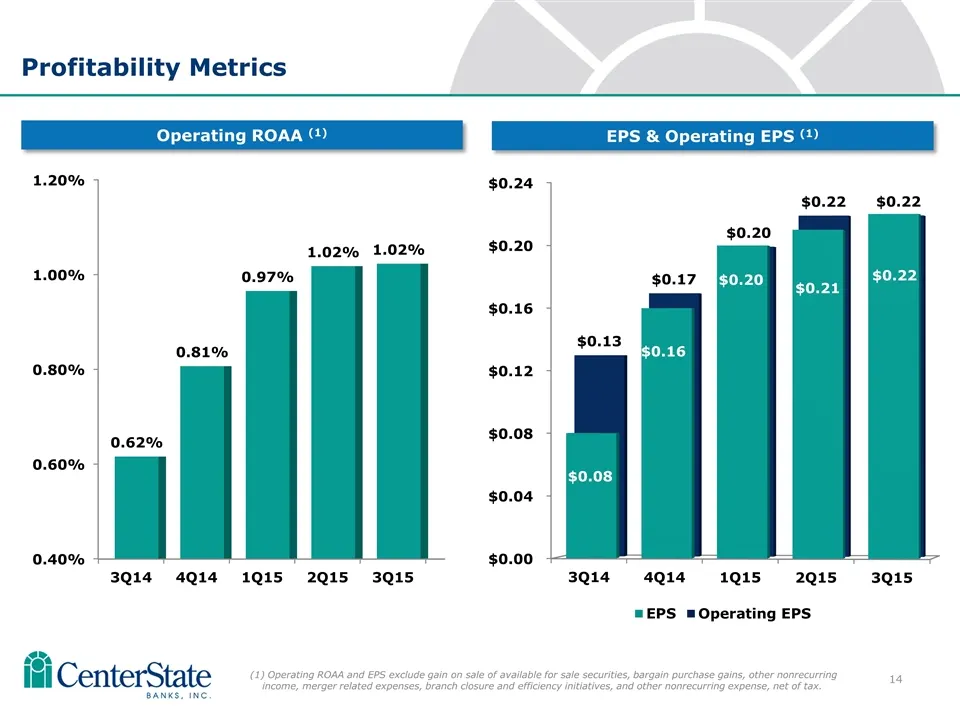
Operating ROAA (1) Profitability Metrics EPS & Operating EPS (1) (1) Operating ROAA and EPS exclude gain on sale of available for sale securities, bargain purchase gains, other nonrecurring income, merger related expenses, branch closure and efficiency initiatives, and other nonrecurring expense, ne
Slide 15: Operating Earnings Per Share: Historical and Consensus Forecast
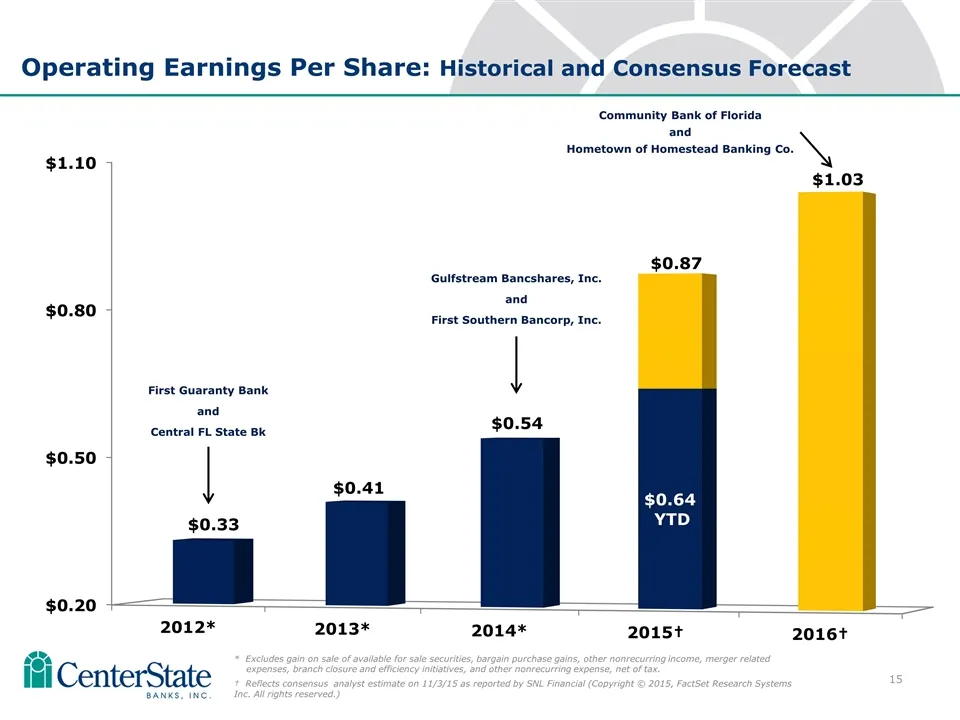
$0.87 Operating Earnings Per Share: Historical and Consensus Forecast First Guaranty Bank and Central FL State Bk Gulfstream Bancshares, Inc. and First Southern Bancorp, Inc. * Excludes gain on sale of available for sale securities, bargain purchase gains, other nonrecurring income, merger related e
Slide 16: PCI Loans – Net Loan/IA Income Improvement
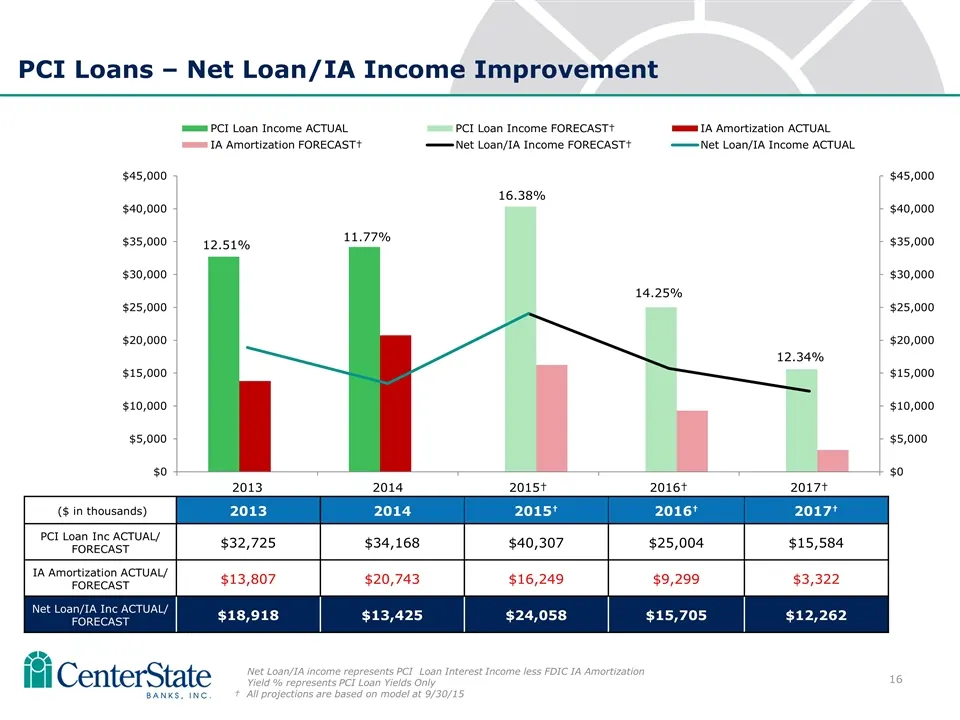
PCI Loans – Net Loan/IA Income Improvement Net Loan/IA income represents PCI Loan Interest Income less FDIC IA Amortization Yield % represents PCI Loan Yields Only † All projections are based on model at 9/30/15 ($ in thousands) 2013 2014 2015† 2016† 2017† PCI Loan Inc ACTUAL/ FORECAST $32,725 $34,1
Slide 17: Operating Performance & Efficiencies The Catalysts Ahead
Operating Performance & Efficiencies The Catalysts Ahead
Slide 18: Loan Production by Quarter
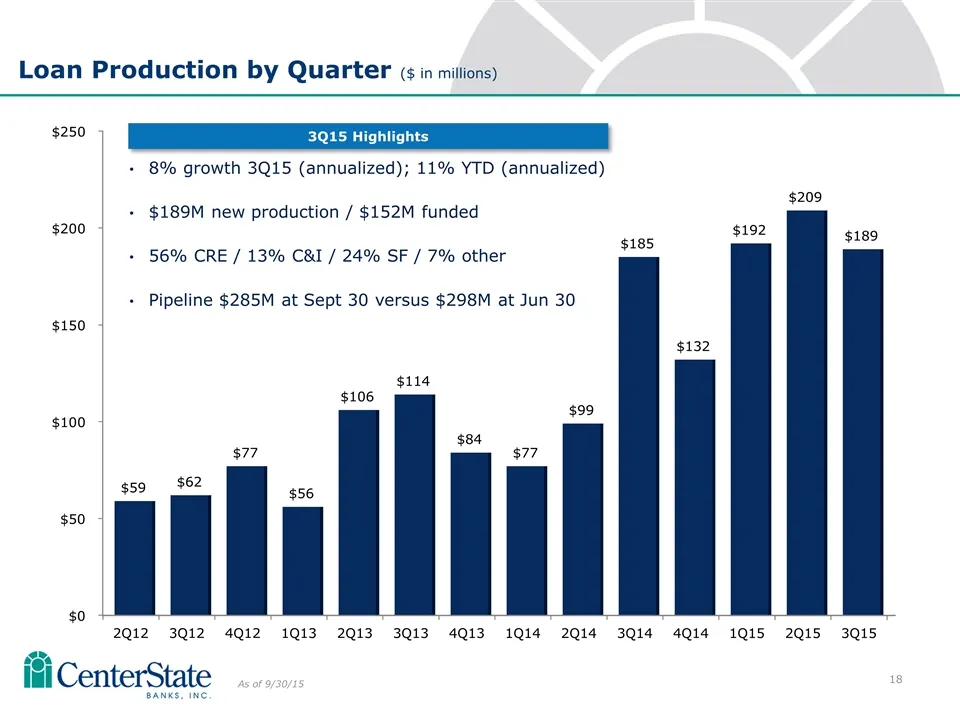
Loan Production by Quarter ($ in millions) 8% growth 3Q15 (annualized); 11% YTD (annualized) $189M new production / $152M funded 56% CRE / 13% C&I / 24% SF / 7% other Pipeline $285M at Sept 30 versus $298M at Jun 30 As of 9/30/15 3Q15 Highlights
Slide 19: Building Franchise Value with Core Deposits
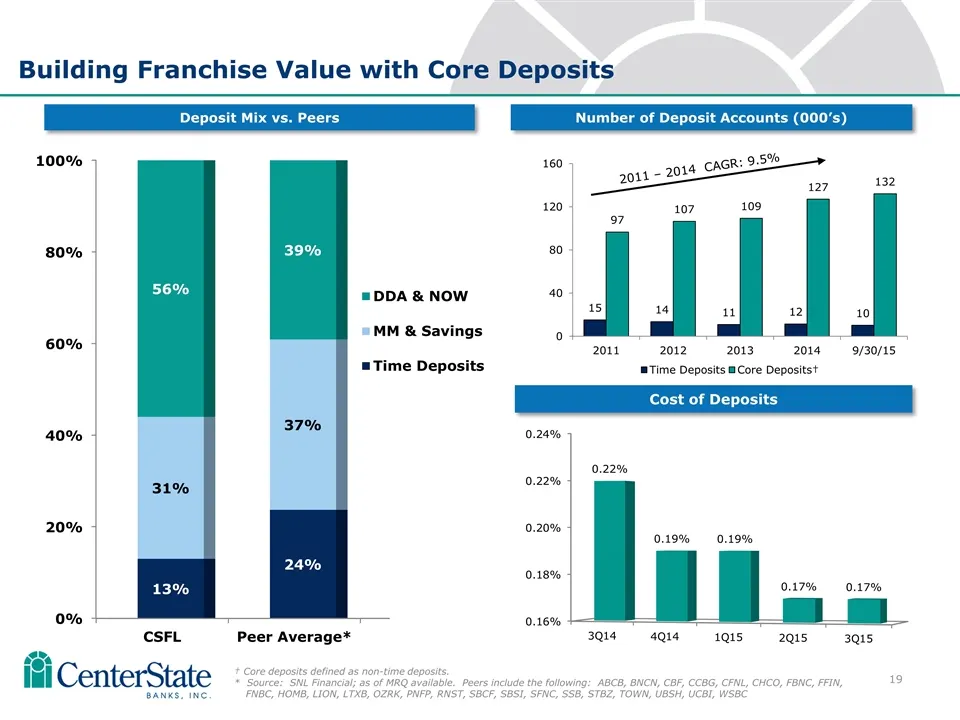
Number of Deposit Accounts (000’s) Building Franchise Value with Core Deposits Cost of Deposits 2011 – 2014 CAGR: 9.5% Deposit Mix vs. Peers † Core deposits defined as non-time deposits. * Source: SNL Financial; as of MRQ available. Peers include the following: ABCB, BNCN, CBF, CCBG, CFNL, CHCO, FBN
Slide 20: Operating Leverage Through Branch Consolidation
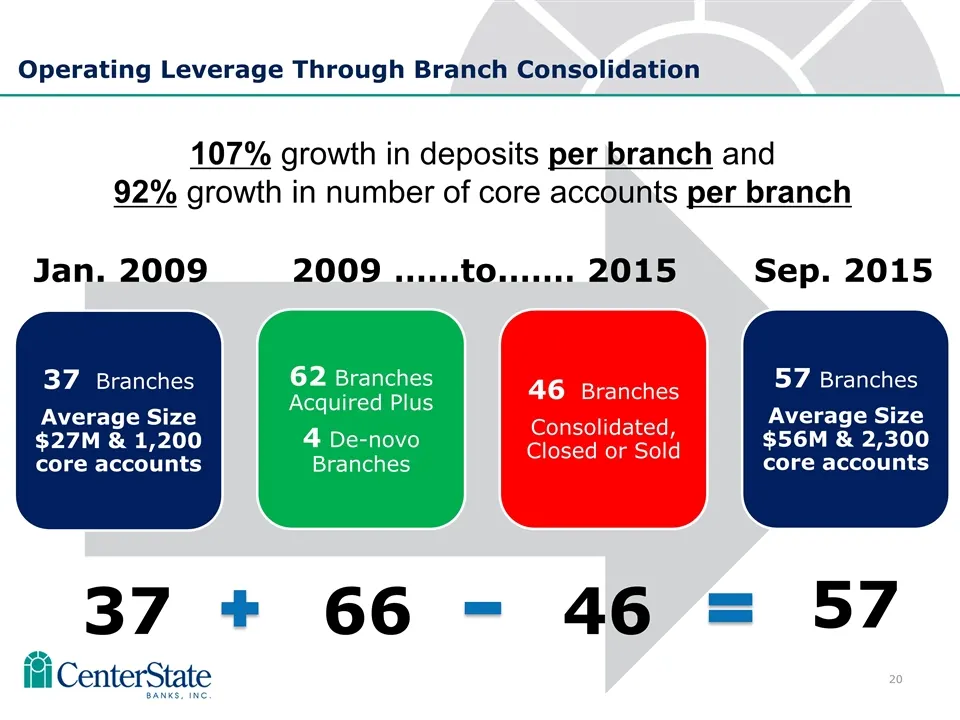
Operating Leverage Through Branch Consolidation 107% growth in deposits per branch and 92% growth in number of core accounts per branch 37 66 46 57 Jan. 2009 2009 ……to.…… 2015 Sep. 2015 37 Branches Average Size $27M & 1,200 core accounts 62 Branches Acquired Plus 4 De-novo Branches 46 Branches Conso
Slide 21: Efficiency Ratio
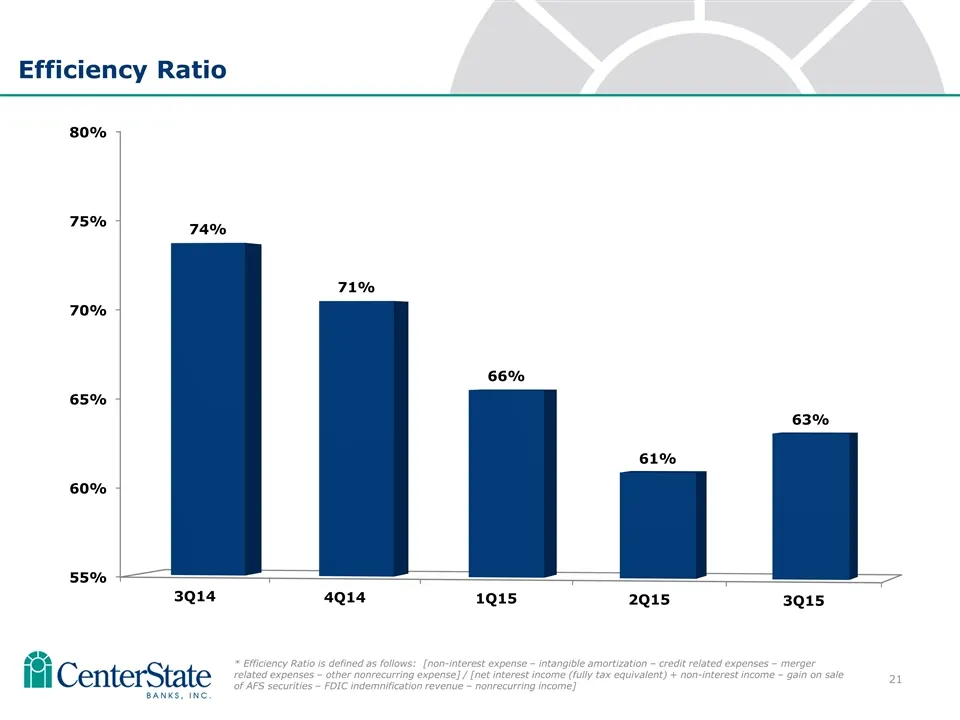
10 Efficiency Ratio * Efficiency Ratio is defined as follows: [non-interest expense – intangible amortization – credit related expenses – merger related expenses – other nonrecurring expense] / [net interest income (fully tax equivalent) + non-interest income – gain on sale of AFS securities – FDIC
Slide 22: Summary and Investment Thesis
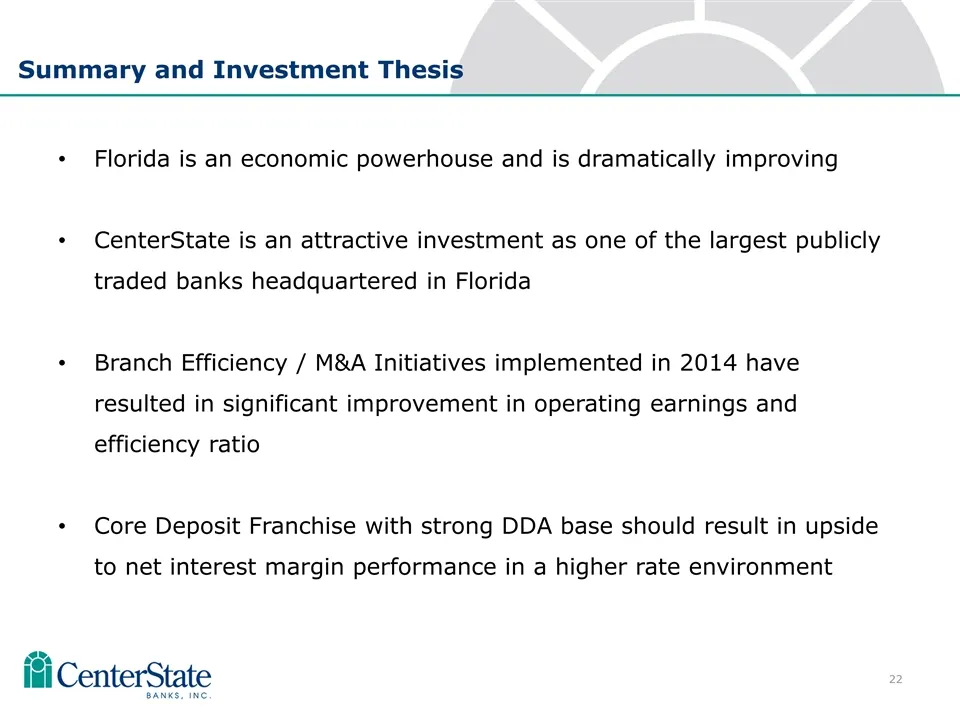
Summary and Investment Thesis Florida is an economic powerhouse and is dramatically improving CenterState is an attractive investment as one of the largest publicly traded banks headquartered in Florida Branch Efficiency / M&A Initiatives implemented in 2014 have resulted in significant improvement
Slide 23: Appendix
Appendix
Slide 24: Total Loans by Type
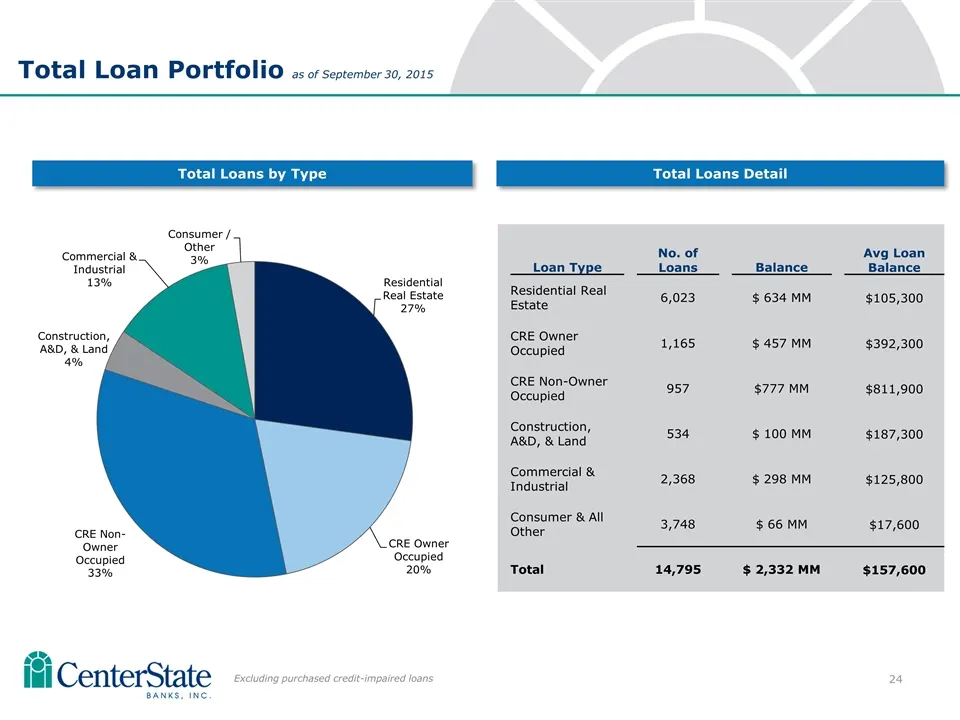
Total Loans by Type Total Loans Detail Loan Type No. of Loans Balance Avg Loan Balance Residential Real Estate 6,023 $ 634 MM $105,300 CRE Owner Occupied 1,165 $ 457 MM $392,300 CRE Non-Owner Occupied 957 $777 MM $811,900 Construction, A&D, & Land 534 $ 100 MM $187,300 Commercial & Industrial 2,368
Slide 25: Loans, excluding PCI loans: Yields, Balances, NPAs
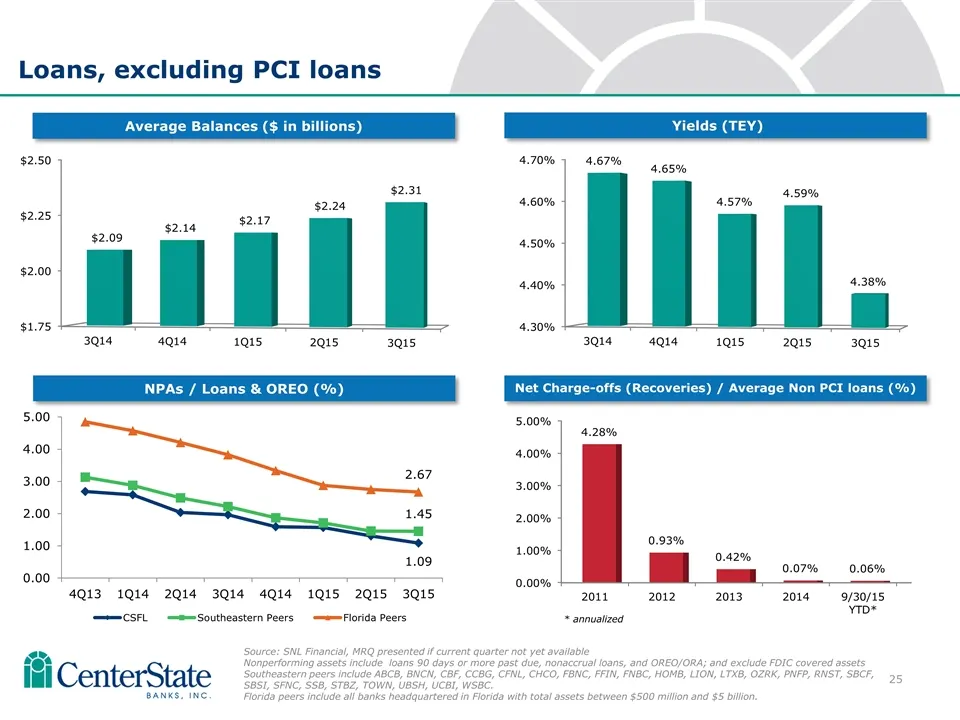
Loans, excluding PCI loans Yields (TEY) Average Balances ($ in billions) NPAs / Loans & OREO (%) Source: SNL Financial, MRQ presented if current quarter not yet available Nonperforming assets include loans 90 days or more past due, nonaccrual loans, and OREO/ORA; and exclude FDIC covered assets Sout
Slide 26: Non-Performing Assets
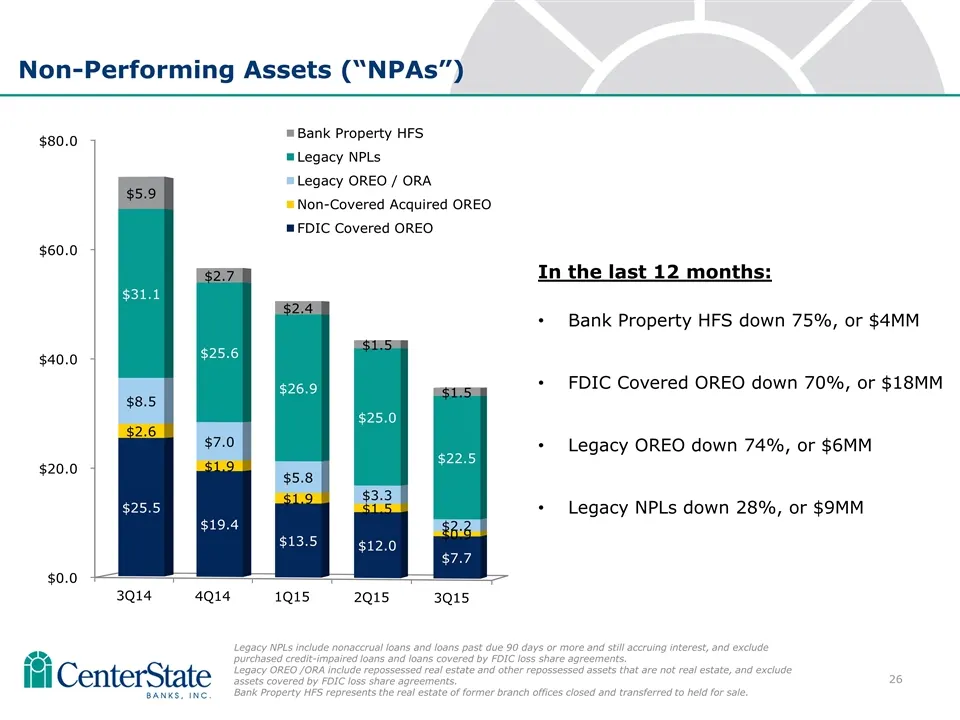
Non-Performing Assets (“NPAs”) In the last 12 months: Bank Property HFS down 75%, or $4MM FDIC Covered OREO down 70%, or $18MM Legacy OREO down 74%, or $6MM Legacy NPLs down 28%, or $9MM Legacy NPLs include nonaccrual loans and loans past due 90 days or more and still accruing interest, and exclude
Slide 27: Total Deposits by Type
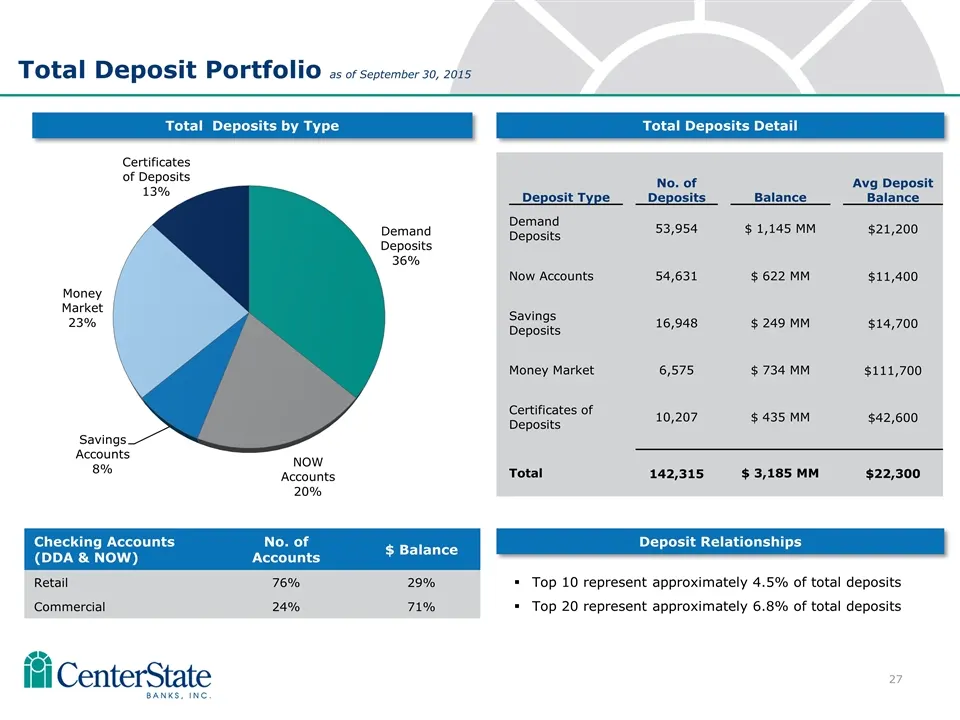
Total Deposits by Type Total Deposits Detail 23 Total Deposit Portfolio as of September 30, 2015 Deposit Type No. of Deposits Balance Avg Deposit Balance Demand Deposits 53,954 $ 1,145 MM $21,200 Now Accounts 54,631 $ 622 MM $11,400 Savings Deposits 16,948 $ 249 MM $14,700 Money Market 6,575 $ 734 M
Slide 28: Net Interest Margin
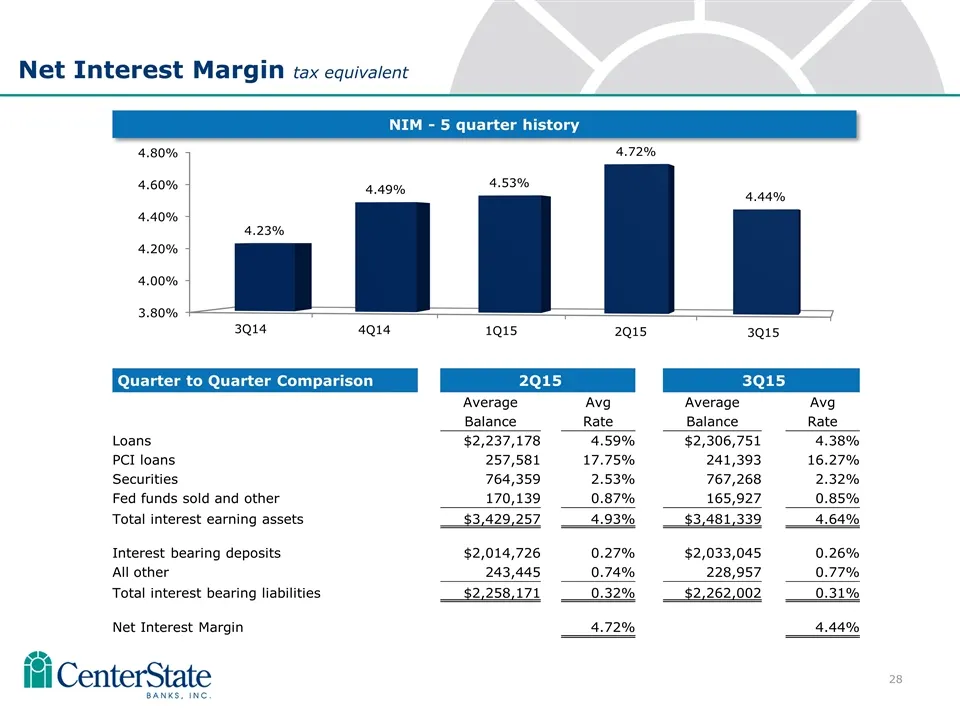
Net Interest Margin tax equivalent Quarter to Quarter Comparison 2Q15 3Q15 Average Avg Average Avg Balance Rate Balance Rate Loans $2,237,178 4.59% $2,306,751 4.38% PCI loans 257,581 17.75% 241,393 16.27% Securities 764,359 2.53% 767,268 2.32% Fed funds sold and other 170,139 0.87% 165,927 0.85% Tot
Slide 29: Non-Interest Income – 3Q15 Components
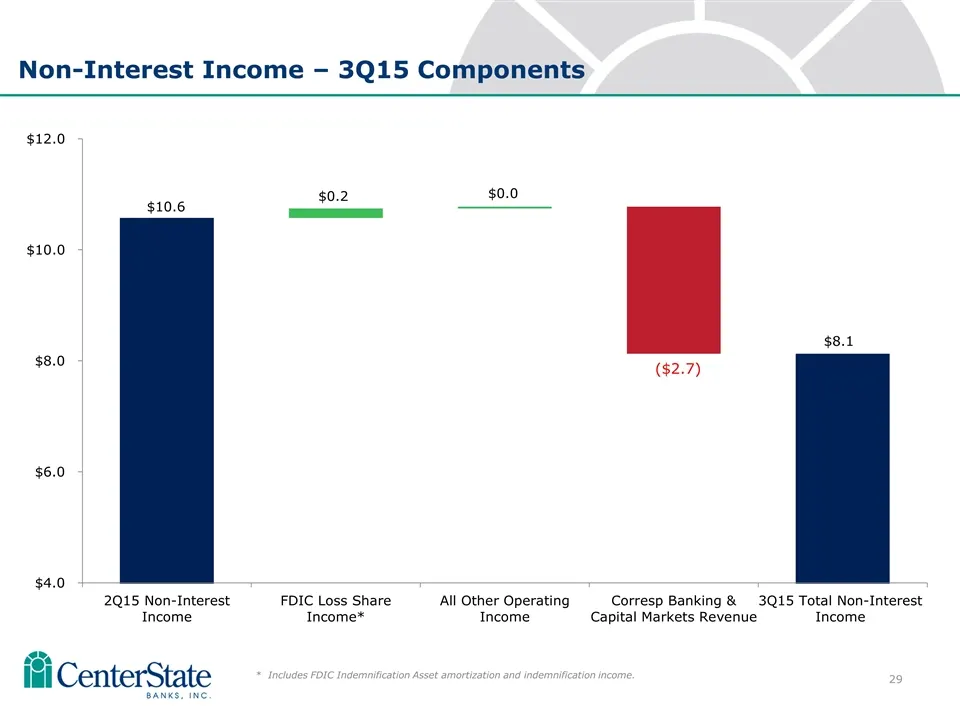
Non-Interest Income – 3Q15 Components * Includes FDIC Indemnification Asset amortization and indemnification income. ($2.7)
Slide 30: Correspondent Banking Income Analysis
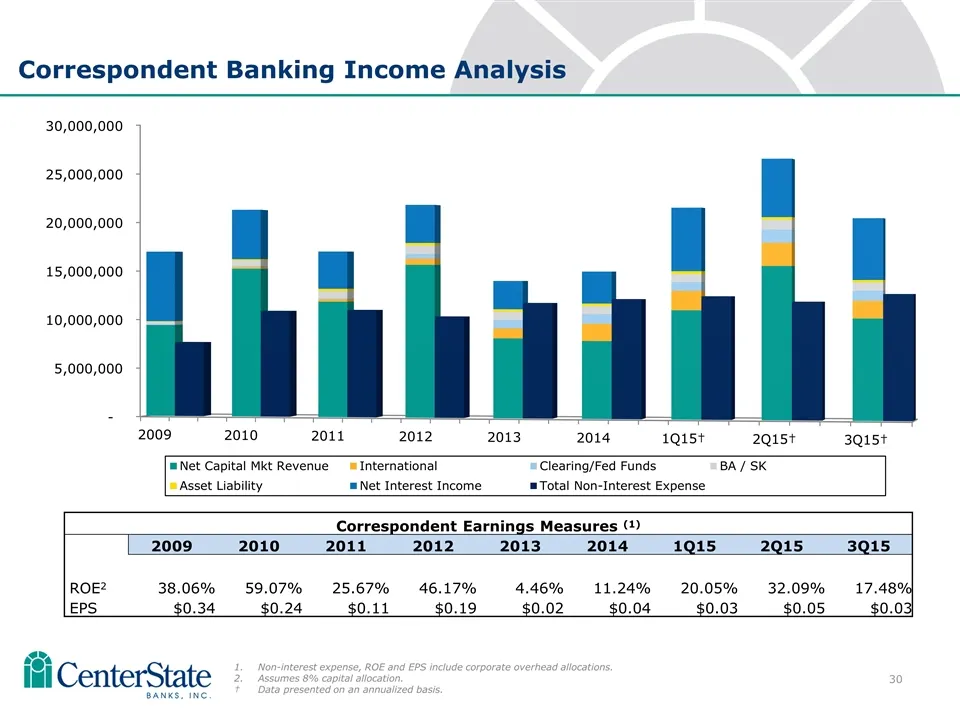
Non-interest expense, ROE and EPS include corporate overhead allocations. Assumes 8% capital allocation. †Data presented on an annualized basis. Correspondent Banking Income Analysis Correspondent Earnings Measures (1) 2009 2010 2011 2012 2013 2014 1Q15 2Q15 3Q15 ROE2 38.06% 59.07% 25.67% 46.17% 4.4
Slide 31: Non-Interest Expense – 3Q15 Components
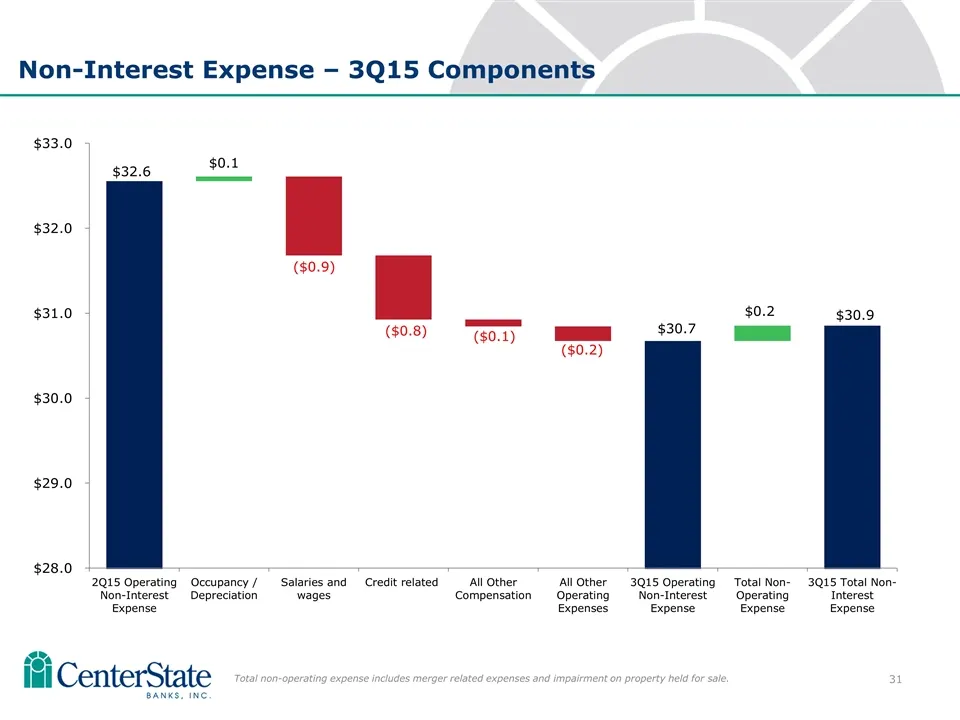
Non-Interest Expense – 3Q15 Components ($0.1) ($0.8) ($0.2) ($0.9) Total non-operating expense includes merger related expenses and impairment on property held for sale.
Slide 32: Analyst Coverage
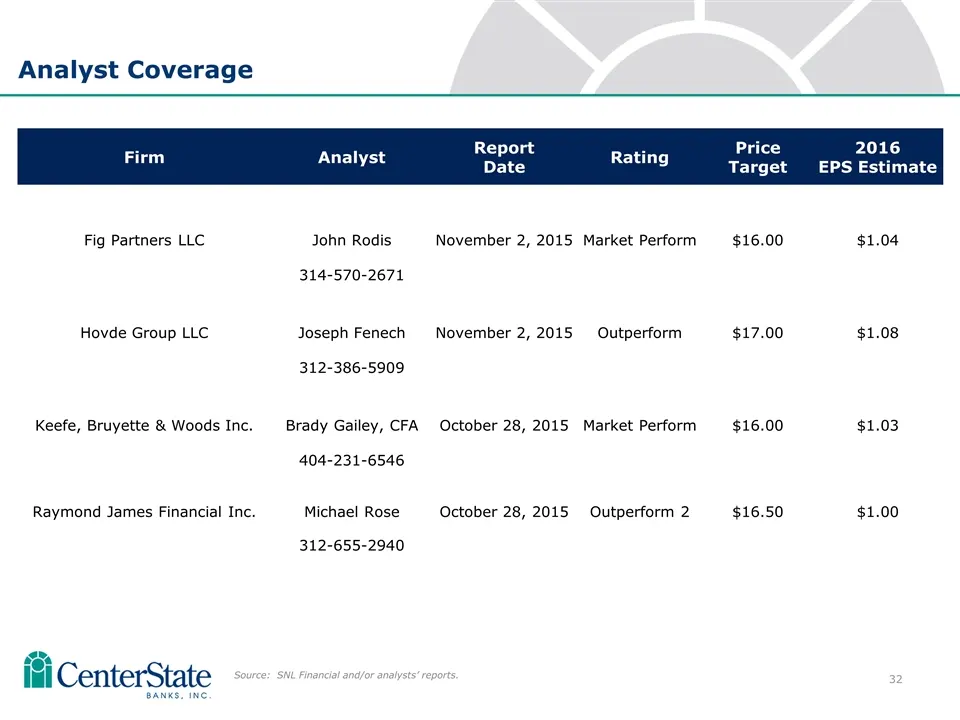
Analyst Coverage Source: SNL Financial and/or analysts’ reports. Firm Analyst Report Rating Price 2016 Date Target EPS Estimate Fig Partners LLC John Rodis November 2, 2015 Market Perform $16.00 $1.04 314-570-2671 Hovde Group LLC Joseph Fenech November 2, 2015 Outperform $17.00 $1.08 312-386-5909 Ke
Slide 33: Investor Contacts
Investor Contacts Ernie Pinner Executive Chairman [email protected] 863-419-7732 John Corbett President & Chief Executive Officer [email protected] 863-294-6383 Jim Antal Chief Financial Officer [email protected] 863-419-7775 Steve Young Treasurer Chief Operating Officer of
Slide 34: CenterState
iti CenterState wwww.centerstatebanks com
Source: SEC EDGAR · 8-K filed Nov 10, 2015
More decks from CenterState Bank Corporation
 IPO Roadshow (May 2020)42 slides · May 21, 2020
 D.A. Davidson 22nd Annual Financial Institution Virtual Conference (May 2020)25 slides · May 6, 2020
 Q1 2020 Earnings Presentation25 slides · Apr 23, 2020
 Merger or Acquisition (January 2020)24 slides · Jan 27, 2020
 Q3 2019 Earnings Presentation28 slides · Nov 4, 2019
 Investor Presentation (July 2019)28 slides · Jul 30, 2019