HD Supply — Non-Deal Roadshow (September 2013)
16 slides from HD Supply's roadshow presentation, Sep 17, 2013

Slide 1: 2013 Second-Quarter Non-deal Roadshow Materials
2013 Second-Quarter September 2013 Non-deal Roadshow Materials
Slide 2: Disclaimers
Disclaimers Forward-Looking Statements This presentation includes “forward-looking statements” within the meaning of Section 27A of the Securities Act and Section 21E of the Exchange Act. Forward-looking statements are subject to known and unknown risks and uncertainties, many of which may be beyond
Slide 3: Investment Themes
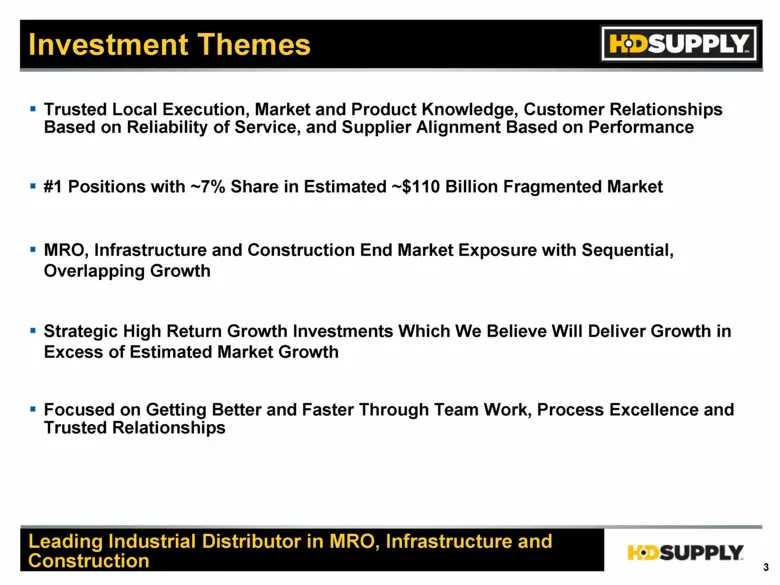
Investment Themes Leading Industrial Distributor in MRO, Infrastructure and Construction Trusted Local Execution, Market and Product Knowledge, Customer Relationships Based on Reliability of Service, and Supplier Alignment Based on Performance #1 Positions with ~7% Share in Estimated ~$110 Billion F
Slide 4: 2Q'13 Performance Highlights
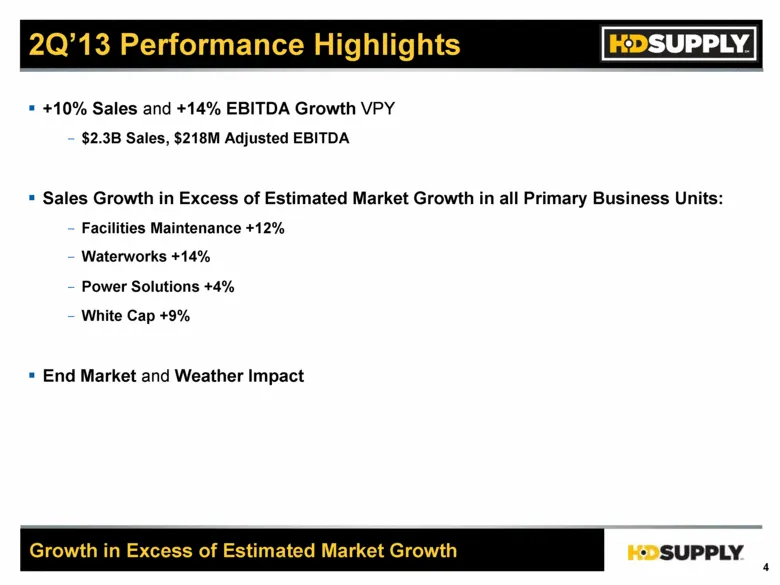
2Q’13 Performance Highlights +10% Sales and +14% EBITDA Growth VPY $2.3B Sales, $218M Adjusted EBITDA Sales Growth in Excess of Estimated Market Growth in all Primary Business Units: Facilities Maintenance +12% Waterworks +14% Power Solutions +4% White Cap +9% End Market and Weather Impact Growth in
Slide 5: 1H'13 and Guidance
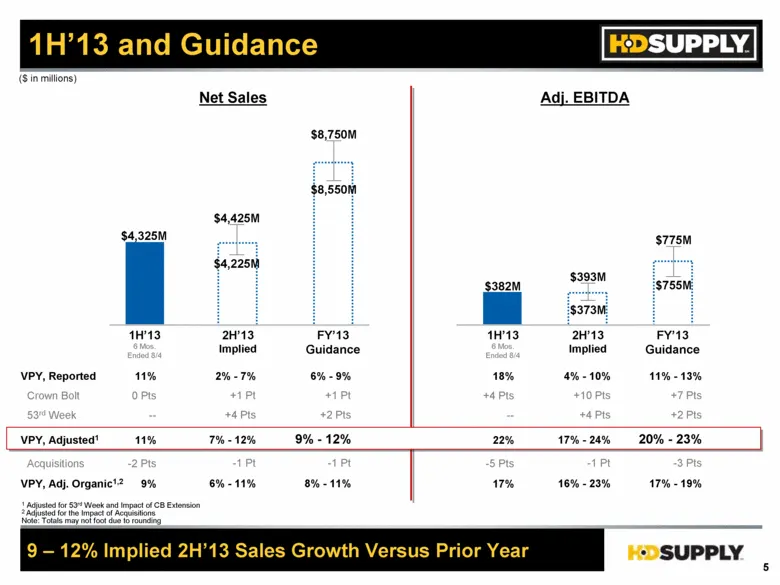
1H’13 and Guidance Net Sales Adj. EBITDA ($ in millions) 1H’13 6 Mos. Ended 8/4 2H’13 Implied $4,325M $8,750M $8,550M 1 Adjusted for 53rd Week and Impact of CB Extension 2 Adjusted for the Impact of Acquisitions Note: Totals may not foot due to rounding FY’13 Guidance $382M $775M $755M 2H’13 Implied
Slide 6: Estimated Market Outlook Framework
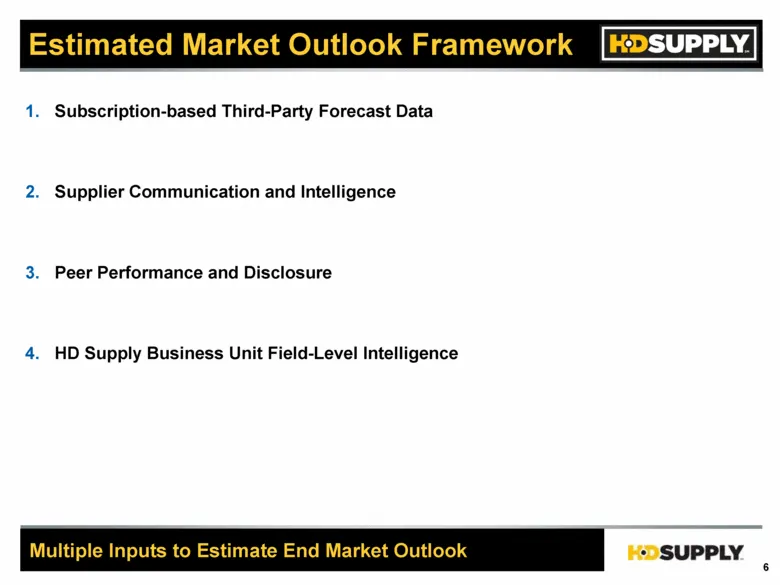
Estimated Market Outlook Framework Subscription-based Third-Party Forecast Data Supplier Communication and Intelligence Peer Performance and Disclosure HD Supply Business Unit Field-Level Intelligence Multiple Inputs to Estimate End Market Outlook 1. 2. 3. 4.
Slide 7: Market Estimates Commentary
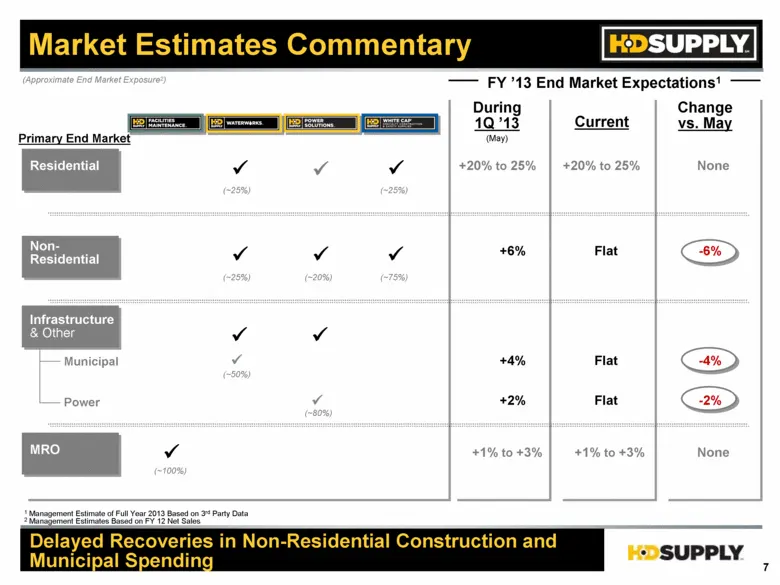
Market Estimates Commentary Delayed Recoveries in Non-Residential Construction and Municipal Spending Current Residential Non- Residential Infrastructure & Other MRO Municipal Power 1 Management Estimate of Full Year 2013 Based on 3rd Party Data 2 Management Estimates Based on FY 12 Net Sales (~20%)
Slide 8: FY'13 Guidance Range Assumptions
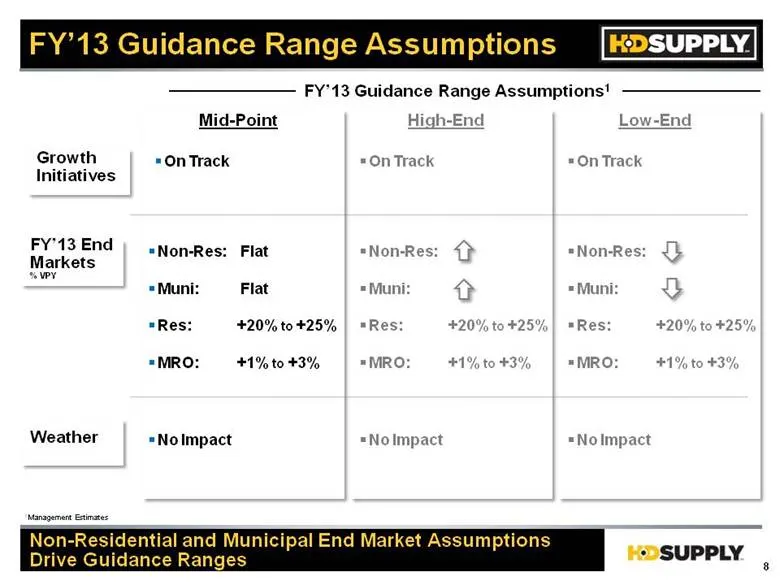
FY’13 Guidance Range Assumptions Mid-Point High-End Low-End FY’13 End Markets % VPY Weather FY’13 Guidance Range Assumptions1 No Impact No Impact No Impact Non-Res: Flat Muni: Flat Res: +20% to +25% MRO: +1% to +3% Non-Res: Muni: Res: +20% to +25% MRO: +1% to +3% Non-Res: Muni: Res: +20% to +25% MRO
Slide 9: Concluding Remarks
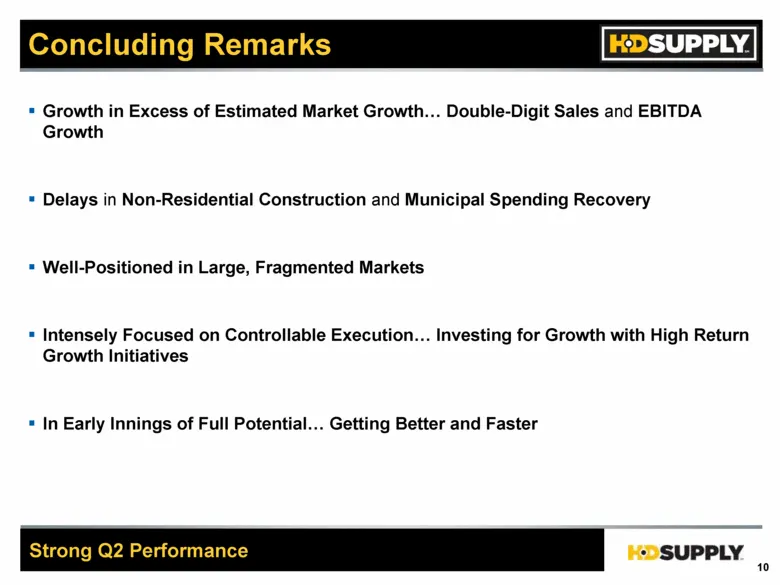
Concluding Remarks Growth in Excess of Estimated Market Growth Double-Digit Sales and EBITDA Growth Delays in Non-Residential Construction and Municipal Spending Recovery Well-Positioned in Large, Fragmented Markets Intensely Focused on Controllable Execution Investing for Growth with High Return Gr

Slide 10: Appendix
-*DSUPPLY. Appendix
Slide 11: FY'13 Sales Outlook VPY
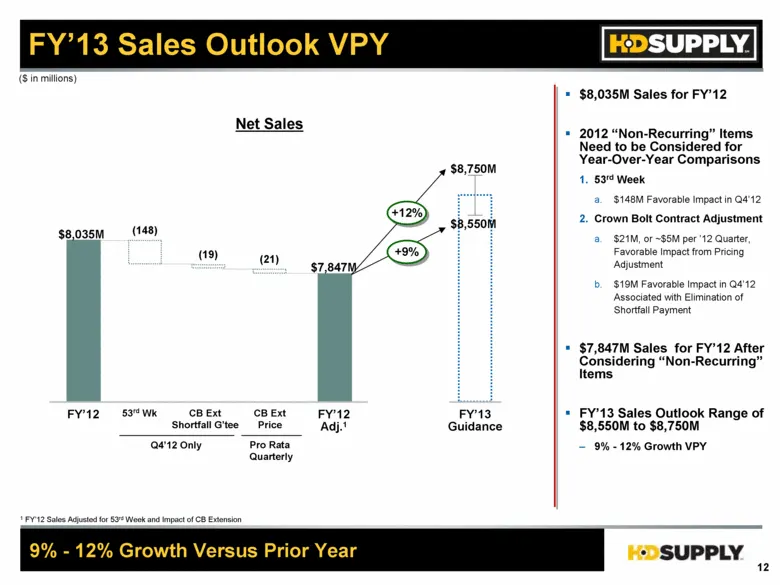
FY’13 Sales Outlook VPY $8,035M Sales for FY’12 2012 “Non-Recurring” Items Need to be Considered for Year-Over-Year Comparisons 53rd Week $148M Favorable Impact in Q4’12 Crown Bolt Contract Adjustment $21M, or ~$5M per ’12 Quarter, Favorable Impact from Pricing Adjustment $19M Favorable Impact in Q4
Slide 12: FY'13 Adj. EBITDA Outlook VPY
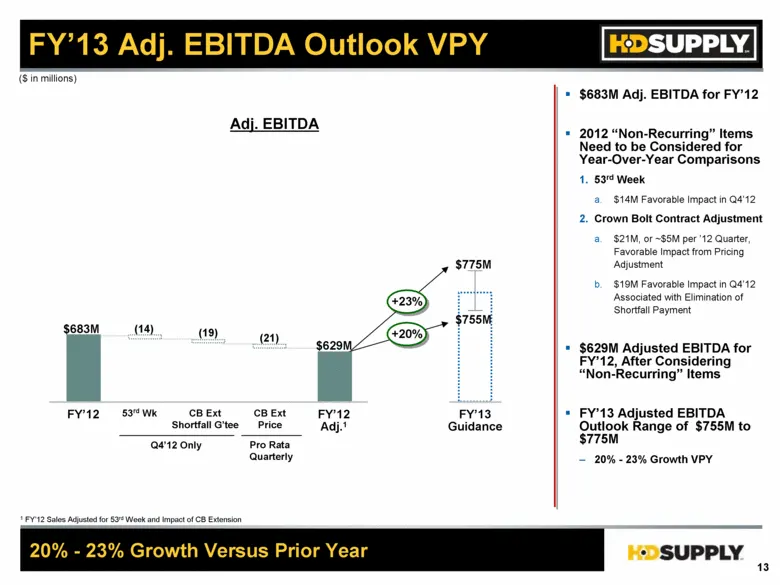
FY’13 Adj. EBITDA Outlook VPY $683M Adj. EBITDA for FY’12 2012 “Non-Recurring” Items Need to be Considered for Year-Over-Year Comparisons 53rd Week $14M Favorable Impact in Q4’12 Crown Bolt Contract Adjustment $21M, or ~$5M per ’12 Quarter, Favorable Impact from Pricing Adjustment $19M Favorable Imp
Slide 13: Q2'13 Monthly Sales Performance – Organic
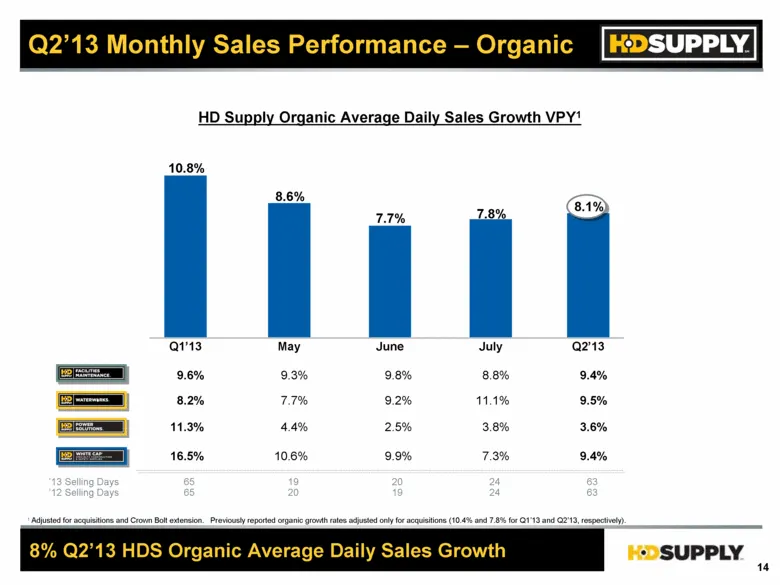
Q2’13 Monthly Sales Performance – Organic HD Supply Organic Average Daily Sales Growth VPY1 Q1’13 Q2’13 May June July 10.8% 8.6% 7.7% 7.8% 9.6% 8.2% 11.3% 9.3% 7.7% 4.4% 9.8% 9.2% 2.5% 8.8% 11.1% 3.8% 9.4% 9.5% 3.6% 8% Q2’13 HDS Organic Average Daily Sales Growth 16.5% 10.6% 9.9% 7.3% 9.4% 8.1% ’13
Slide 14: 2013 Income Tax Clarification
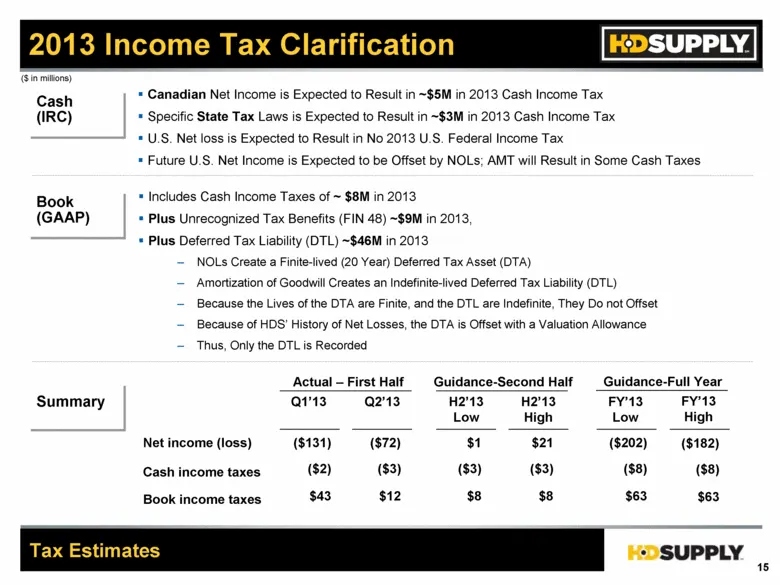
2013 Income Tax Clarification Cash (IRC) Canadian Net Income is Expected to Result in ~$5M in 2013 Cash Income Tax Specific State Tax Laws is Expected to Result in ~$3M in 2013 Cash Income Tax U.S. Net loss is Expected to Result in No 2013 U.S. Federal Income Tax Future U.S. Net Income is Expected t
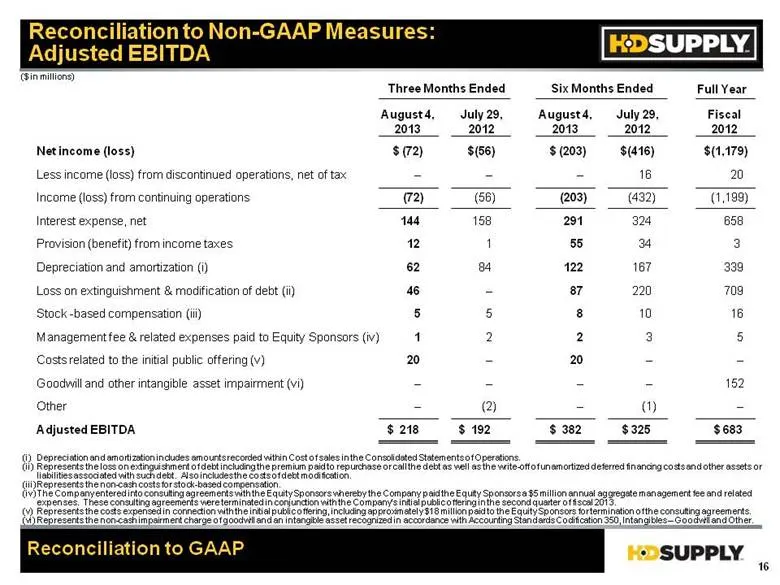
Slide 15: Reconciliation to Non-GAAP Measures: Adjusted EBITDA
Reconciliation to Non-GAAP Measures: Adjusted EBITDA Reconciliation to GAAP Net income (loss) $ (72) $(56) $ (203) $(416) Less income (loss) from discontinued operations, net of tax – – – 16 Income (loss) from continuing operations (72) (56) (203) (432) Interest expense, net 144 158 291 324 Provisio
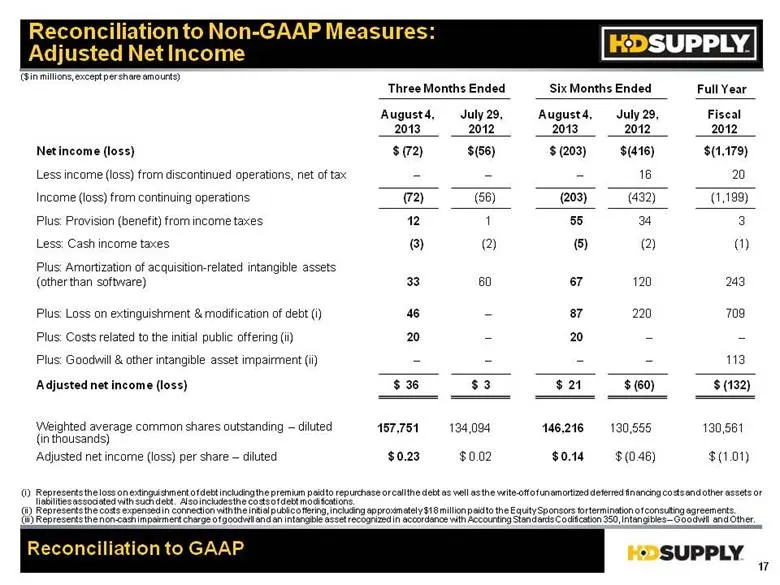
Slide 16: Reconciliation to Non-GAAP Measures: Adjusted Net Income
Reconciliation to Non-GAAP Measures: Adjusted Net Income Reconciliation to GAAP Plus: Provision (benefit) from income taxes 12 1 55 34 Plus: Amortization of acquisition-related intangible assets (other than software) 33 60 67 120 Plus: Loss on extinguishment & modification of debt (i) 46 – 87 220 Pl
Source: SEC EDGAR · 8-K filed Sep 17, 2013
More decks from HD Supply Holdings Inc
 Q2 2020 Earnings Presentation18 slides · Sep 9, 2020
 Q1 2020 Earnings Presentation21 slides · Jun 9, 2020
 Q4 2019 Earnings Presentation20 slides · Mar 17, 2020
 Q3 2019 Earnings Presentation21 slides · Dec 10, 2019
 Robert W. Baird & Co. 2019 Industrial Conference9 slides · Nov 6, 2019
 Merger or Acquisition (September 2019)21 slides · Sep 25, 2019