Mariner Energy — Howard Weil Institutional Sales Presentation (February 2007)
26 slides from Mariner Energy's conference presentation, Feb 26, 2007
Slide 1: Howard Weil Institutional Sales Presentation
Howard Weil Incorporated Institutional Sales Presentation February 22, 2007
Slide 2: Disclosure
Disclosure This presentation includes forward-looking statements within the meaning of Section 27A of the Securities Act of 1933 and Section 21E of the Securities Exchange Act of 1934. All statements, other than statements of historical facts, that address activities that Mariner assumes, plans, exp
Slide 3: Overview
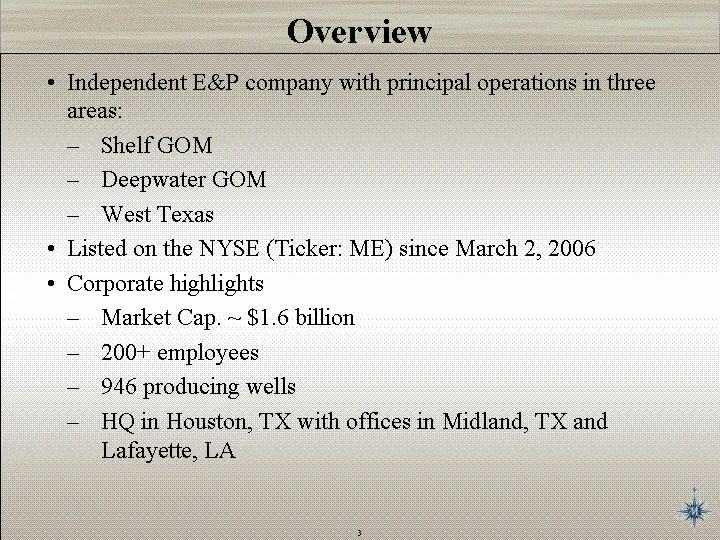
Overview Independent E&P company with principal operations in three areas: Shelf GOM Deepwater GOM West Texas Listed on the NYSE (Ticker: ME) since March 2, 2006 Corporate highlights Market Cap. ~ $1.6 billion 200+ employees 946 producing wells HQ in Houston, TX with offices in Midland, TX and Lafay
Slide 4: Balance, Efficient Growth, Opportunity
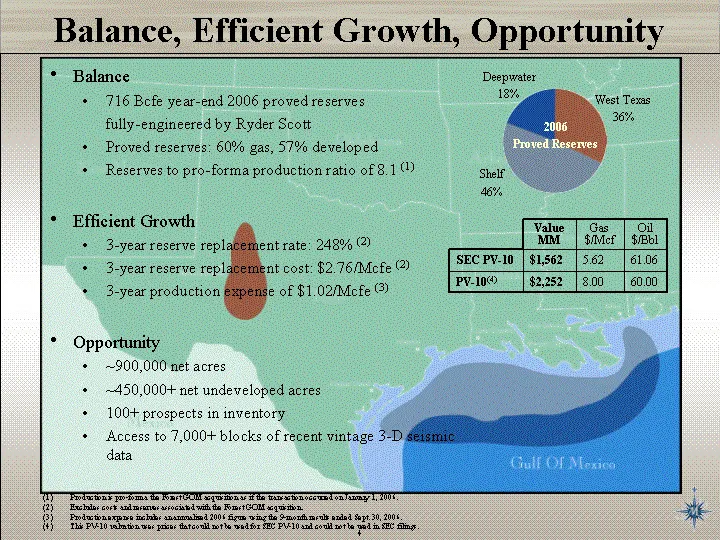
Balance, Efficient Growth, Opportunity Shelf 46% West Texas 36% Deepwater 18% 2006 Proved Reserves Balance 716 Bcfe year-end 2006 proved reserves fully-engineered by Ryder Scott Proved reserves: 60% gas, 57% developed Reserves to pro-forma production ratio of 8.1 (1) Efficient Growth 3-year reserve
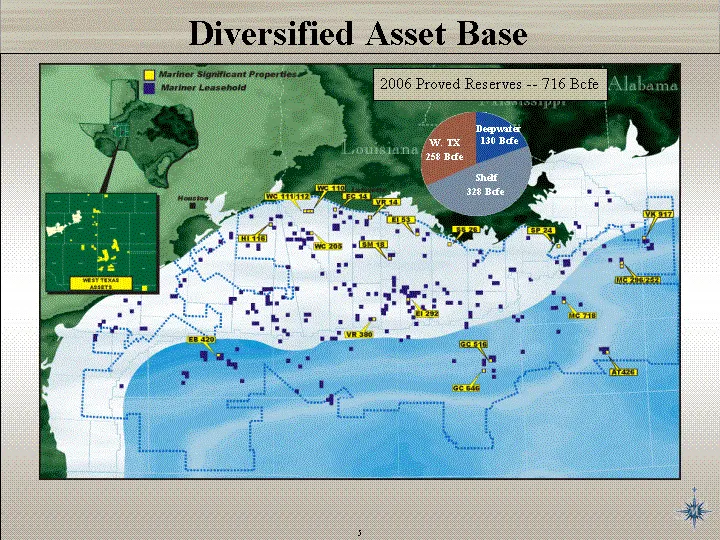
Slide 5: Diversified Asset Base
Shelf 328 Bcfe W. TX 258 Bcfe Deepwater 130 Bcfe Diversified Asset Base 2006 Proved Reserves -- 716 Bcfe
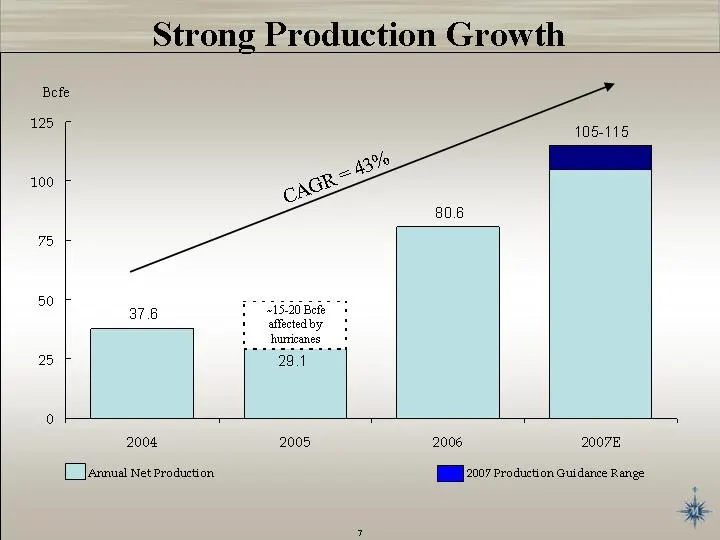
Slide 6: Strong Production Growth
Strong Production Growth 2004 2005 2006 2007E Ave Daily Prod 37.6 29.1 80.6 105 0 20 0 10 Bcfe Annual Net Production 2007 Production Guidance Range CAGR = 43% ~15-20 Bcfe affected by hurricanes
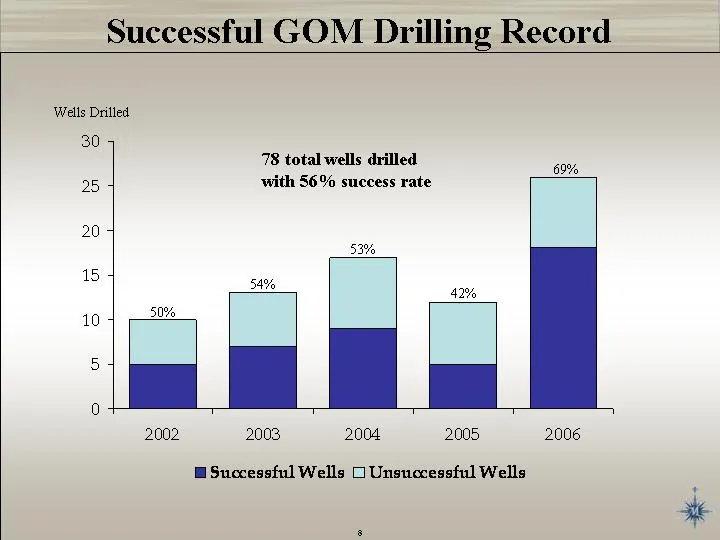
Slide 7: Successful GOM Drilling Record
2002 2003 2004 2005 2006 Successful Wells 5 7 9 5 18 Unsuccessful Wells 5 6 8 7 8 Successful GOM Drilling Record 69% 42% 53% 54% 50% 78 total wells drilled with 56% success rate Wells Drilled
Slide 8: Upside Opportunities
te se Mariner Enercy, Inc. A Upside Opportunities
Slide 9: Extensive Exploration Prospect Inventory
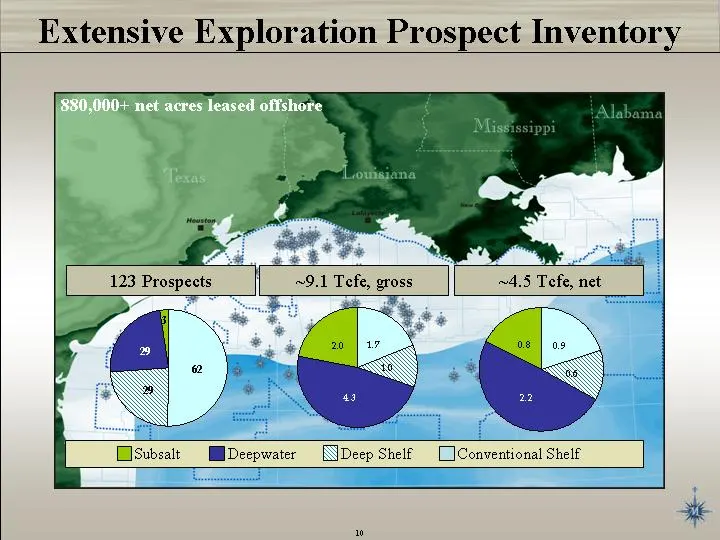
880,000+ net acres leased offshore Deep Shelf Deepwater Subsalt Conventional Shelf Conventional Shelf Deep Shelf Deepwater Sub-Salt Type 1.726 1.024 4.33 1.991 Conventional Shelf Deep Shelf Deepwater Sub-Salt Type 62 29 29 3 Conventional Shelf Deep Shelf Deepwater Sub-Salt Type 0.891 0.577 2.198 0.7
Slide 10: Seismic Coverage
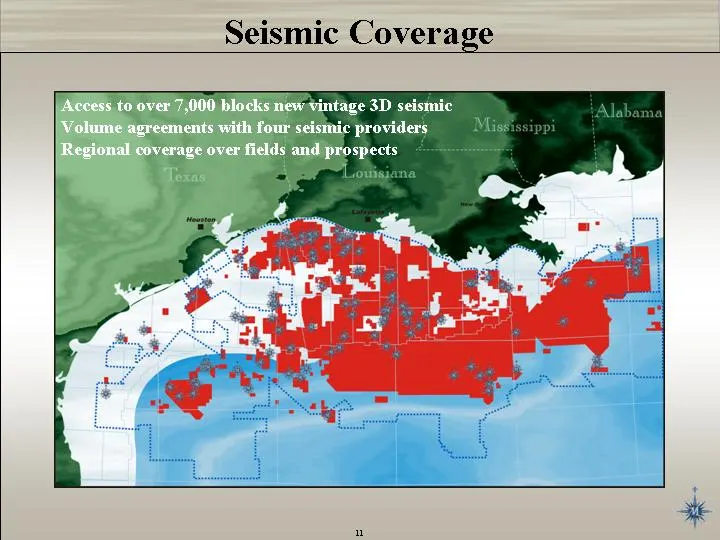
Seismic Coverage Access to over 7,000 blocks new vintage 3D seismic Volume agreements with four seismic providers Regional coverage over fields and prospects
Slide 11: 2007 MMS Lease Sale Opportunity
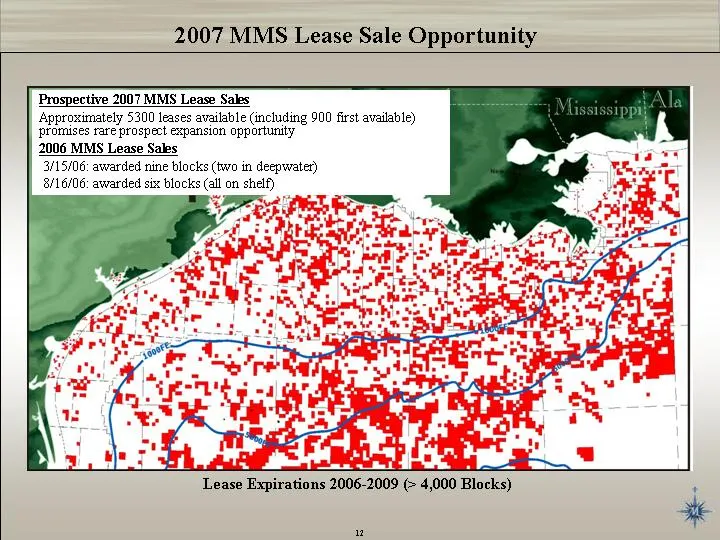
2007 MMS Lease Sale Opportunity Prospective 2007 MMS Lease Sales Approximately 5300 leases available (including 900 first available) promises rare prospect expansion opportunity 2006 MMS Lease Sales 3/15/06: awarded nine blocks (two in deepwater) 8/16/06: awarded six blocks (all on shelf) Lease Expi
Slide 12: Shelf Exploitation Opportunities
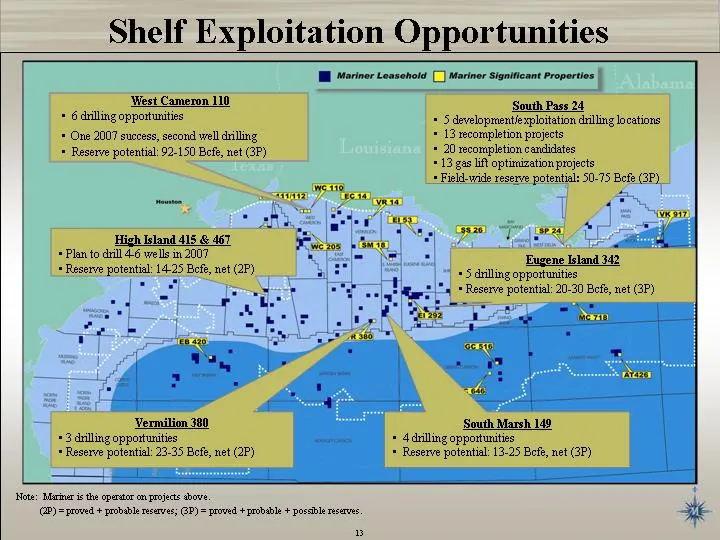
Vermilion 380 • 3 drilling opportunities • Reserve potential: 23-35 Bcfe, net (2P) South Marsh 149 • 4 drilling opportunities • Reserve potential: 13-25 Bcfe, net (3P) High Island 415 & 467 • Plan to drill 4-6 wells in 2007 • Reserve potential: 14-25 Bcfe, net (2P) Note: Mariner is the operator on p
Slide 13: Recent Success: High Island 116 #5
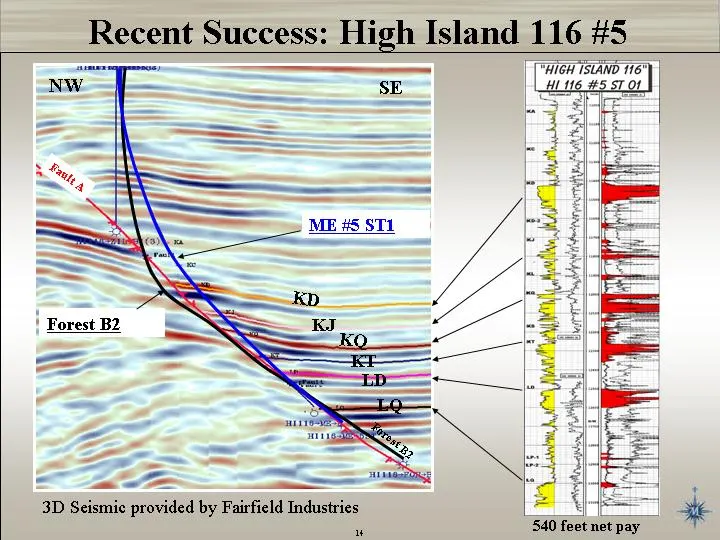
Recent Success: High Island 116 #5 Recent Success: High Island 116 #5 Recent Success: High Island 116 #5 Forest B2 LQ NW SE Forest B2 ME #5 ST1 Fault A KD LD KT KQ KJ 3D Seismic provided by Fairfield Industries 540 feet net pay
Slide 14: Continuing Success: West Cameron
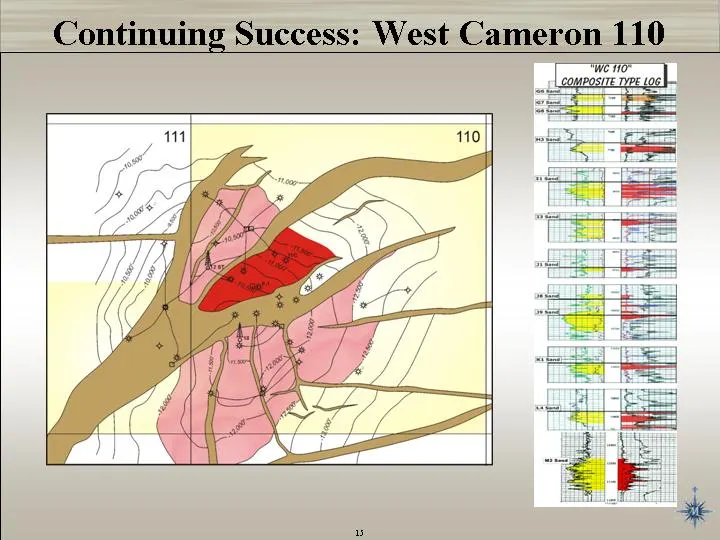
Continuing Success: West Cameron 110
Slide 15: West Texas Opportunities
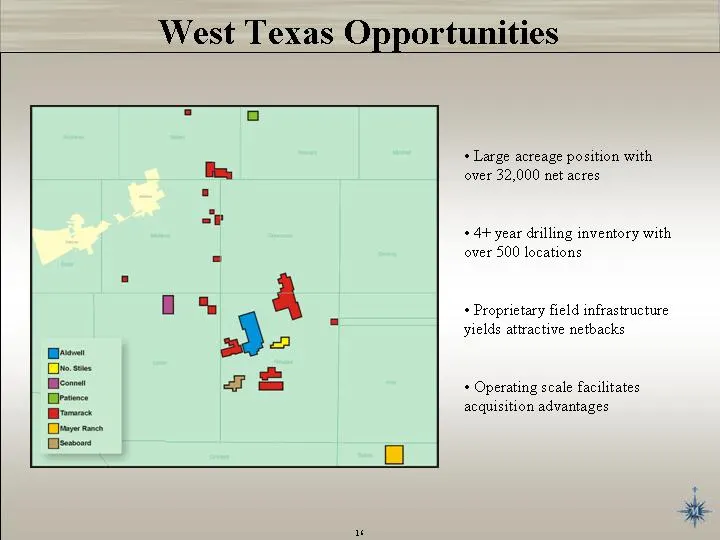
West Texas Opportunities Large acreage position with over 32,000 net acres 4+ year drilling inventory with over 500 locations Proprietary field infrastructure yields attractive netbacks Operating scale facilitates acquisition advantages
Slide 16: West Texas Performance
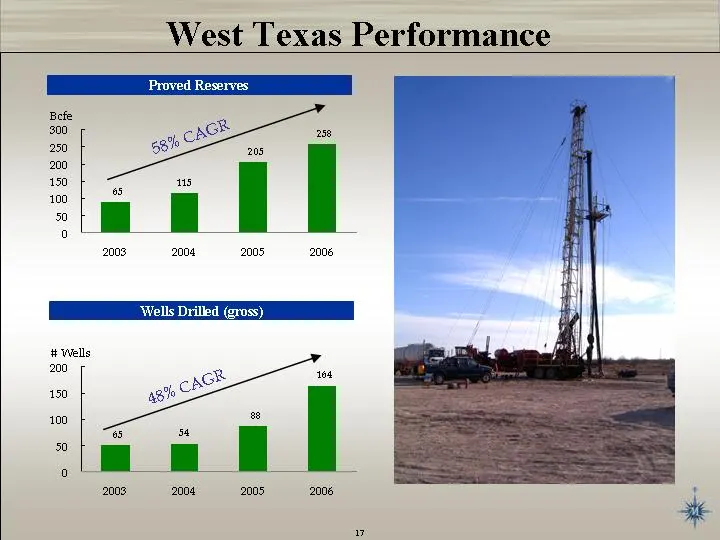
West Texas Performance Wells Drilled (gross) Proved Reserves Series 1 2003 90 2004 115 2005 205 2006 258 58% CAGR Series 1 2003 51 2004 54 2005 88 2006 164 48% CAGR Series 1 2003 51 2004 54 2005 88 2006 164
Slide 17: 2007 Drilling Program
te ye Mariner Enercy, Inc. A 2007 Drilling Program 18
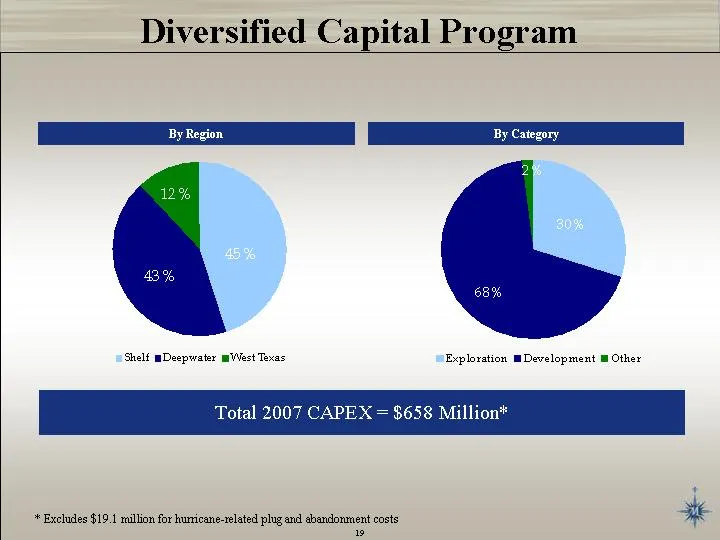
Slide 18: Diversified Capital Program
Shelf Deepwater West Texas Sacramento Basin East 0.45 0.43 0.12 0.16 Exploration Development Other East 0.3 0.68 0.02 By Region By Category Total 2007 CAPEX = $658 Million* * Excludes $19.1 million for hurricane-related plug and abandonment costs Diversified Capital Program
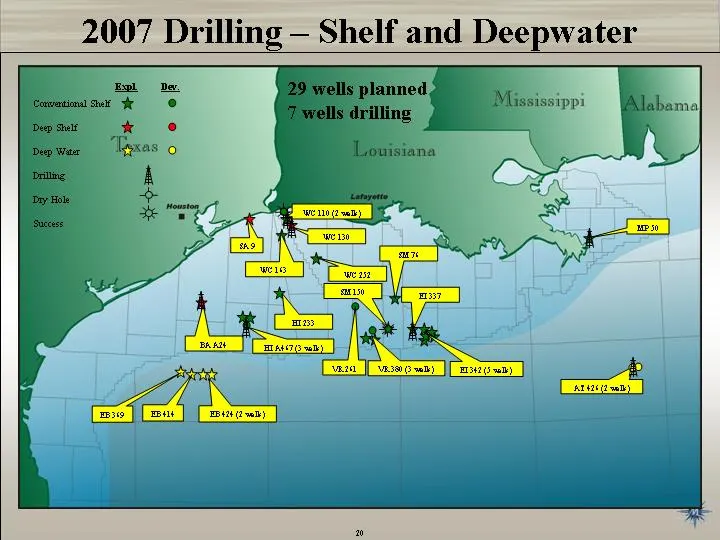
Slide 19: 2007 Drilling - Shelf and Deepwater
WC 130 MP 50 BA A24 AT 426 (2 wells) EI 337 HI A467 (3 wells) WC 110 (2 wells) 2007 Drilling - Shelf and Deepwater Expl. Conventional Shelf Deep Shelf Deep Water Drilling Dry Hole Success Dev. EB 424 (2 wells) EB 369 EB 414 SA 9 WC 252 HI 233 VR 261 VR 380 (3 wells) EI 342 (5 wells) SM 76 WC 163 SM
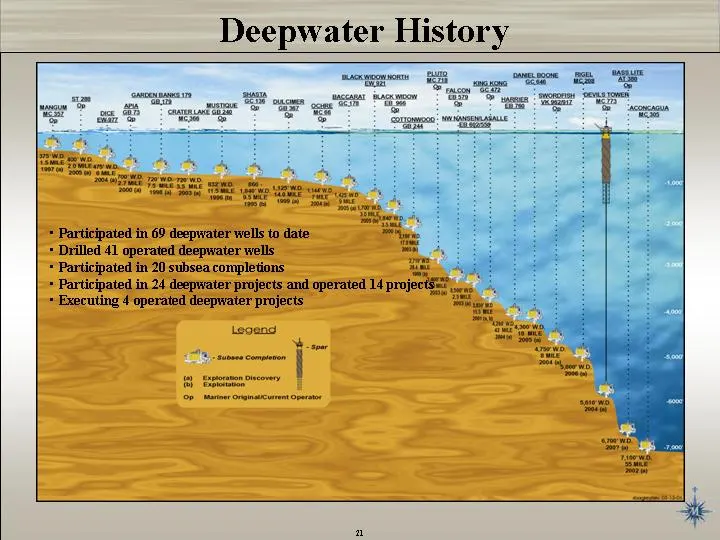
Slide 20: Deepwater History
Deepwater History Deepwater History Participated in 69 deepwater wells to date Drilled 41 operated deepwater wells Participated in 20 subsea completions Participated in 24 deepwater projects and operated 14 projects Executing 4 operated deepwater projects
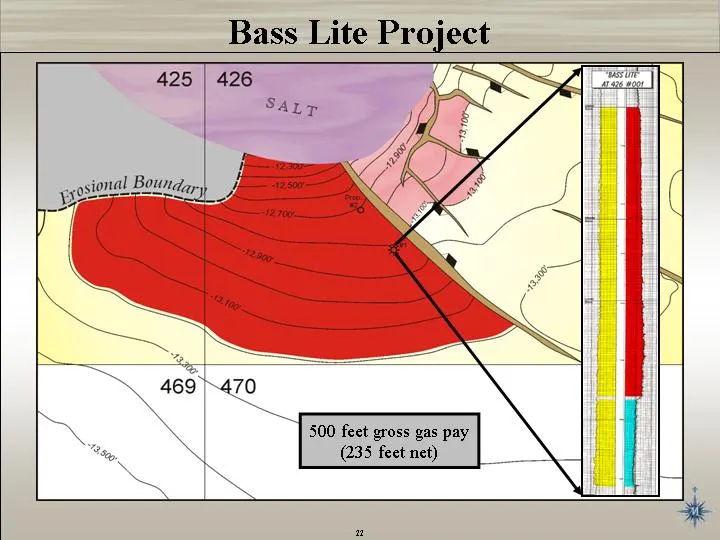
Slide 21: Bass Lite Project
500 feet gross gas pay (235 feet net) Bass Lite Project
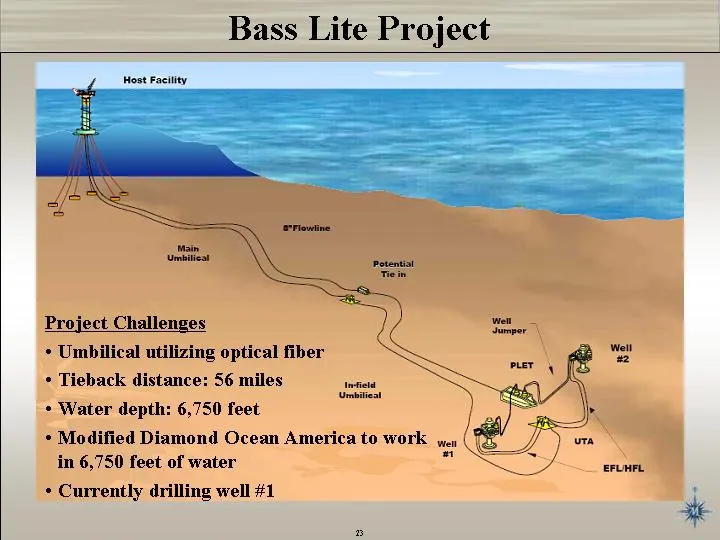
Slide 22: Bass Lite Project Challenges
Bass Lite Project Project Challenges Umbilical utilizing optical fiber Tieback distance: 56 miles Water depth: 6,750 feet Modified Diamond Ocean America to work in 6,750 feet of water Currently drilling well #1
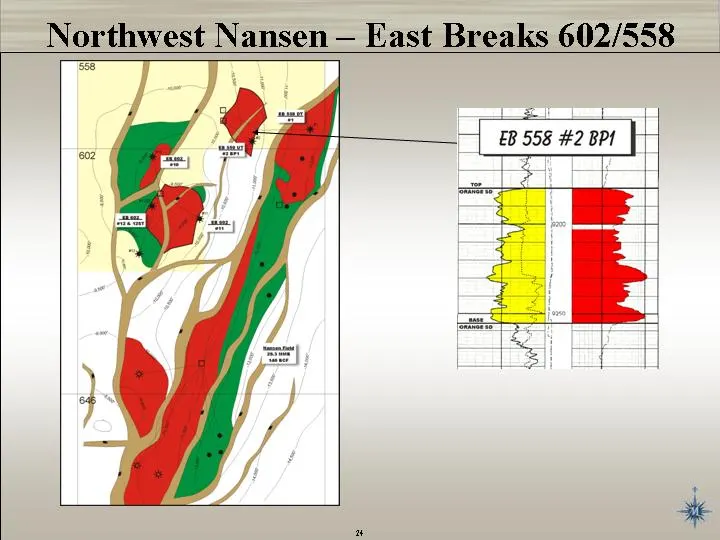
Slide 23: Northwest Nansen - East Breaks 602/558
Northwest Nansen - East Breaks 602/558
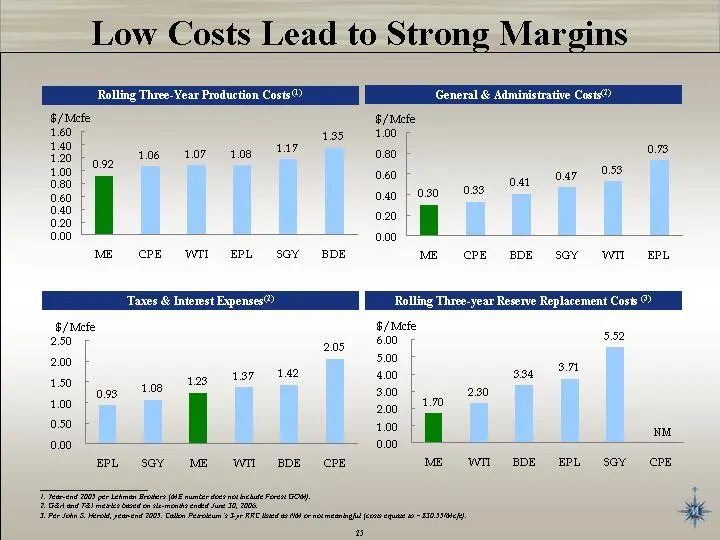
Slide 24: Low Costs Lead to Strong Margins
Series 1 ME 0.92 CPE 1.06 WTI 1.07 EPL 1.08 SGY 1.17 BDE 1.35 Series 1 EPL 0.93 SGY 1.08 ME 1.23 WTI 1.37 BDE 1.42 CPE 2.05 Series 1 ME 1.7 WTI 2.3 BDE 3.34 EPL 3.71 SGY 5.52 CPE Rolling Three-Year Production Costs (1) Rolling Three-year Reserve Replacement Costs (3) Taxes & Interest Expenses(2) ___
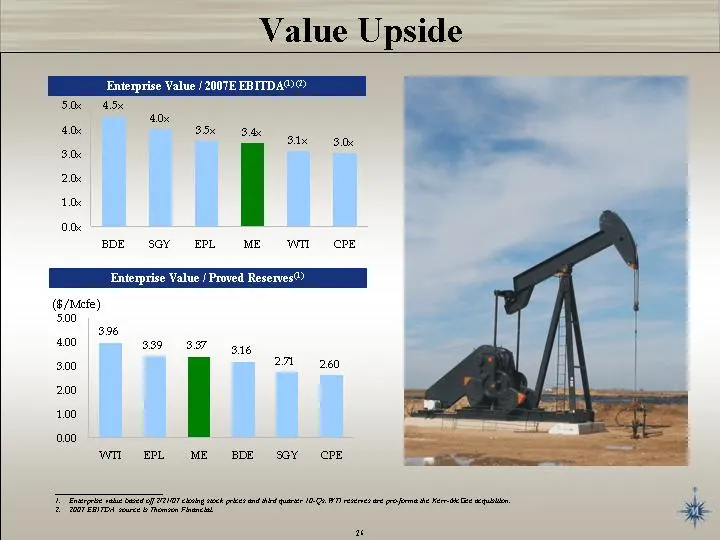
Slide 25: Value Upside
WTI EPL ME BDE SGY CPE 3.96 3.39 3.37 3.16 2.71 2.6 Enterprise Value / 2007E EBITDA(1) (2) ___________________________ Enterprise value based off 2/21/07 closing stock prices and third quarter 10-Qs. WTI reserves are pro-forma the Kerr-McGee acquisition. 2007 EBITDA source is Thomson Financial. Ente
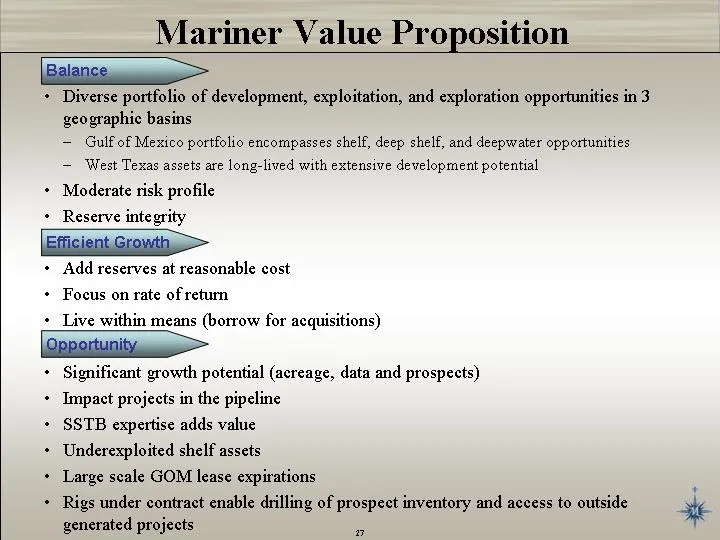
Slide 26: Mariner Value Proposition
Diverse portfolio of development, exploitation, and exploration opportunities in 3 geographic basins Gulf of Mexico portfolio encompasses shelf, deep shelf, and deepwater opportunities West Texas assets are long-lived with extensive development potential Moderate risk profile Reserve integrity Add r
Source: SEC EDGAR · 8-K filed Feb 26, 2007
More decks from Mariner Energy Inc
 Merger or Acquisition (July 2010)27 slides · Jul 27, 2010
 Merger or Acquisition (April 2010)23 slides · Apr 27, 2010
 IPAA Oil & Gas Investment Symposium April 8, 200852 slides · Apr 7, 2008
 Raymond James 29th Annual Institutional Investors Conference (March 2008)34 slides · Mar 5, 2008
 Pritchard Capital Energize 2008 Conference30 slides · Jan 8, 2008
 Investor Presentation (November 2007)30 slides · Nov 14, 2007