Mariner Energy — Pritchard Capital Energize 2008 Conference
30 slides from Mariner Energy's conference presentation, Jan 8, 2008
Slide 1: Energize 2008 Pritchard Capital
Energize 2008 Pritchard Capital January 8, 2008
Slide 2: Disclosure
Disclosure This presentation includes forward-looking statements within the meaning of Section 27A of the Securities Act of 1933 and Section 21E of the Securities Exchange Act of 1934. All statements, other than statements of historical facts, that address activities that Mariner assumes, plans, exp
Slide 3: Overview
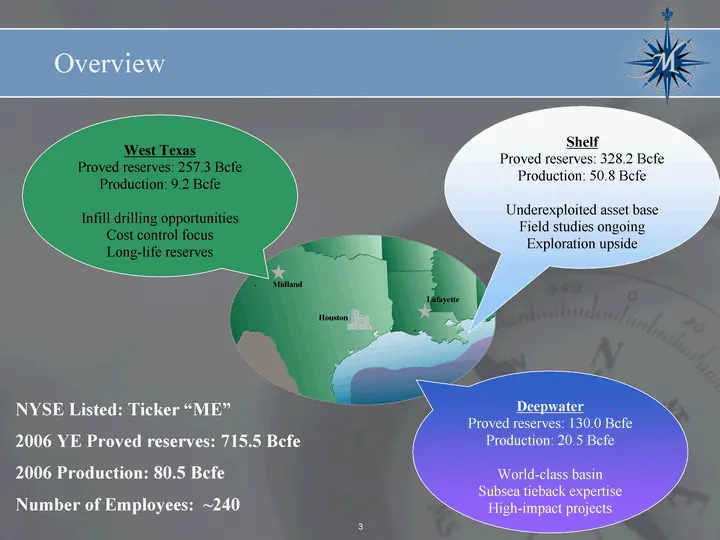
NYSE Listed: Ticker "ME" 2006 YE Proved reserves: 715.5 Bcfe 2006 Production: 80.5 Bcfe Number of Employees: ~240 Overview Overview Overview Houston Midland Lafayette West Texas Proved reserves: 257.3 Bcfe Production: 9.2 Bcfe Infill drilling opportunities Cost control focus Long-life reserves Shelf
Slide 4: Balance. Opportunity. Efficient Growth
BALANCE. OPPORTUNITY. “EFFICIENT GROWTH
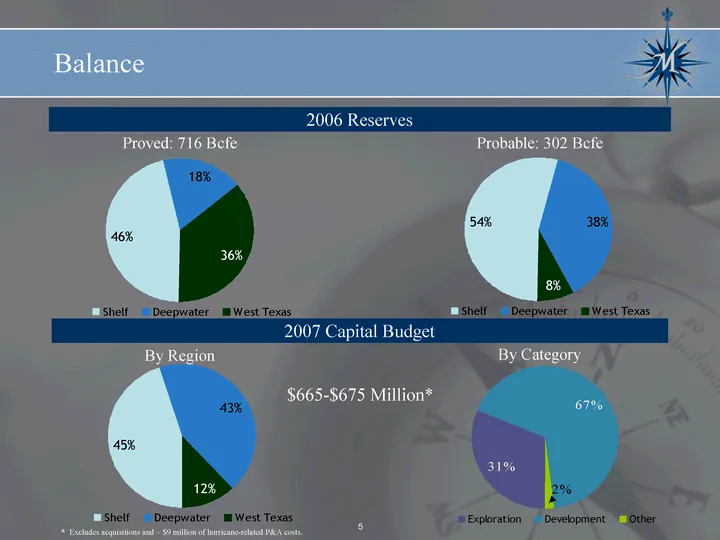
Slide 5: Balance: 2006 Reserves and 2007 Capital Budget
Shelf Deepwater West Texas Sacramento Basin East 0.45 0.43 0.12 0.16 Shelf Deepwater West Texas Sacramento Basin East 0.46 0.18 0.36 0.16 Balance Proved: 716 Bcfe 2006 Reserves * Excludes acquisitions and ~ $9 million of hurricane-related P&A costs. $665-$675 Million* 2007 Capital Budget Shelf Deepw
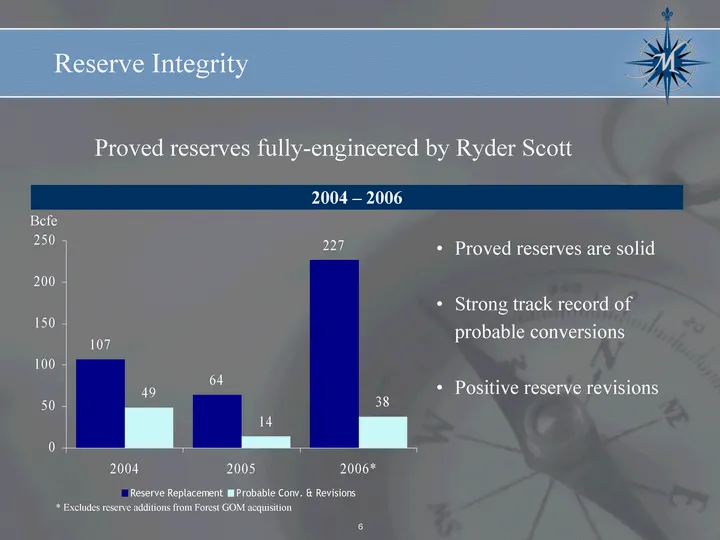
Slide 6: Reserve Integrity
Reserve Integrity Proved reserves fully-engineered by Ryder Scott 2004 2005 2006* Reserve Replacement 107 64 227 Probable Conv. & Revisions 49 14 38 2004 - 2006 Bcfe Proved reserves are solid Strong track record of probable conversions Positive reserve revisions * Excludes reserve additions from For
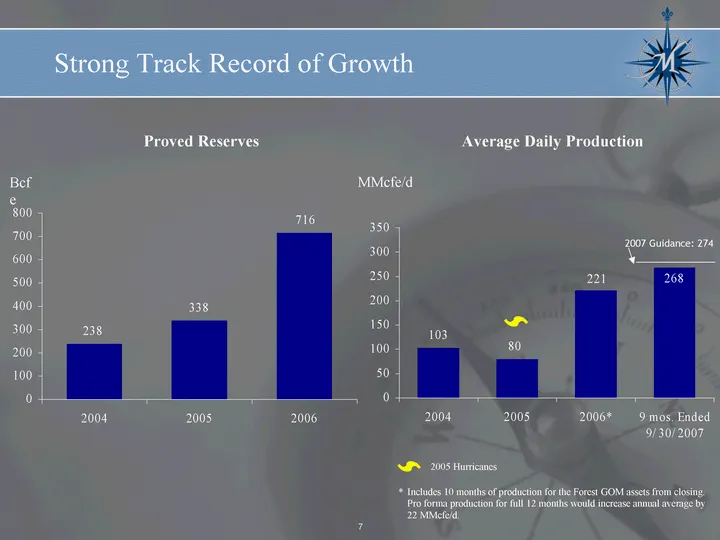
Slide 7: Strong Track Record of Growth
Strong Track Record of Growth 2004 2005 2006 Proved Reserves 238 338 716 Bcf e Proved Reserves Average Daily Production * Includes 10 months of production for the Forest GOM assets from closing. Pro forma production for full 12 months would increase annual average by 22 MMcfe/d. 2004 2005 2006* 9 mo
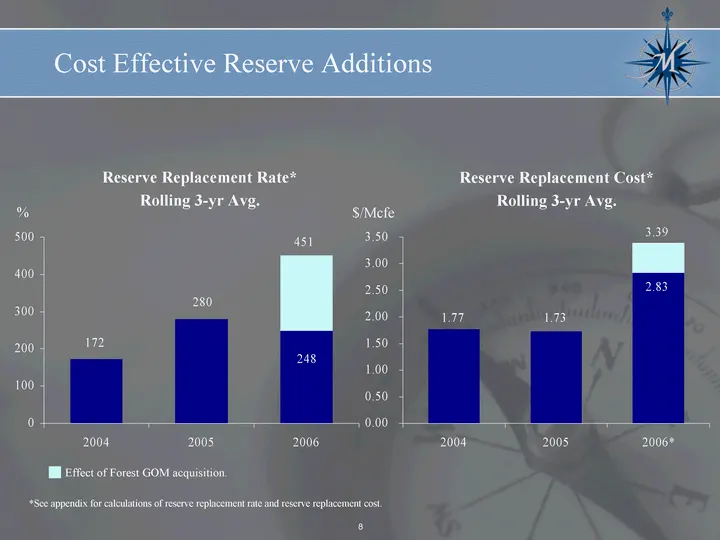
Slide 8: Reserve Replacement Rate and Cost
Reserve Replacement Rate* Rolling 3-yr Avg. Cost Effective Reserve Additions 2004 2005 2006 Reserve Replacement Rate 172 280 248 RRR Forest Incremental 203 2004 2005 2006* Rolling 3-yr avg RRC 1.77 1.73 2.83 0.56 $/Mcfe Reserve Replacement Cost* Rolling 3-yr Avg. % Effect of Forest GOM acquisition.
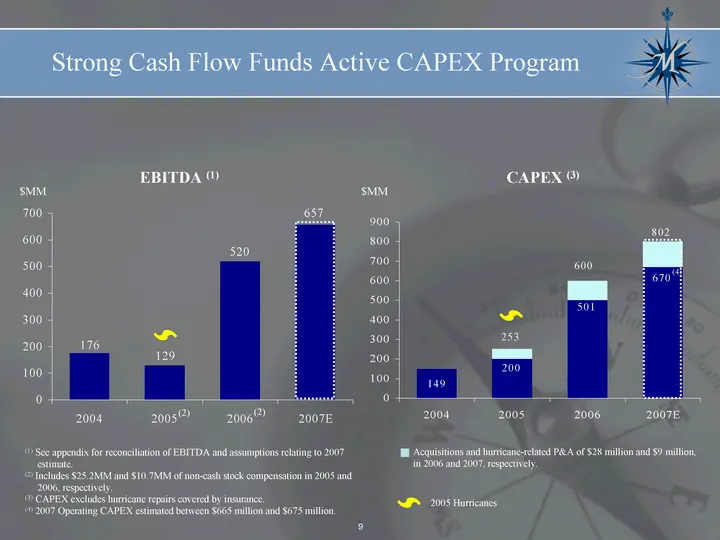
Slide 9: Strong Cash Flow Funds Active CAPEX Program
$MM CAPEX (3) $MM EBITDA (1) (1) See appendix for reconciliation of EBITDA and assumptions relating to 2007 estimate. (2) Includes $25.2MM and $10.7MM of non-cash stock compensation in 2005 and 2006, respectively. (3) CAPEX excludes hurricane repairs covered by insurance. (4) 2007 Operating CAPEX es
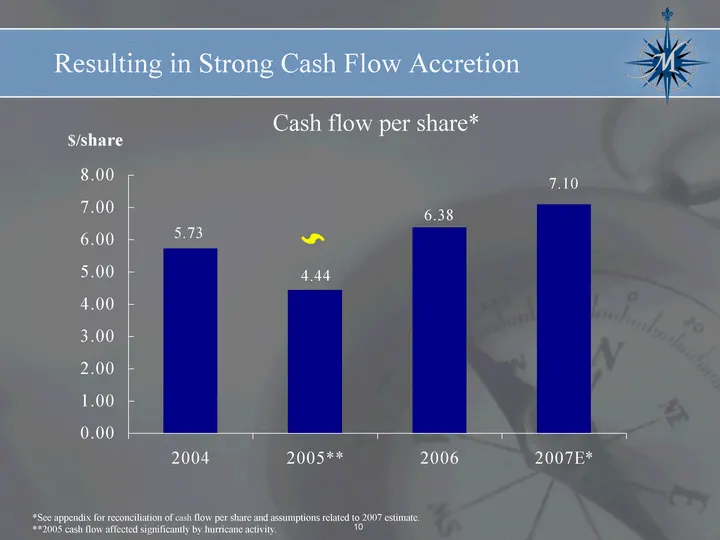
Slide 10: Strong Cash Flow Accretion
2004 2005** 2006 2007E* Ave Daily Prod 5.73 4.44 6.38 7.1 Resulting in Strong Cash Flow Accretion *See appendix for reconciliation of cash flow per share and assumptions related to 2007 estimate. **2005 cash flow affected significantly by hurricane activity. $/share Cash flow per share* ' '
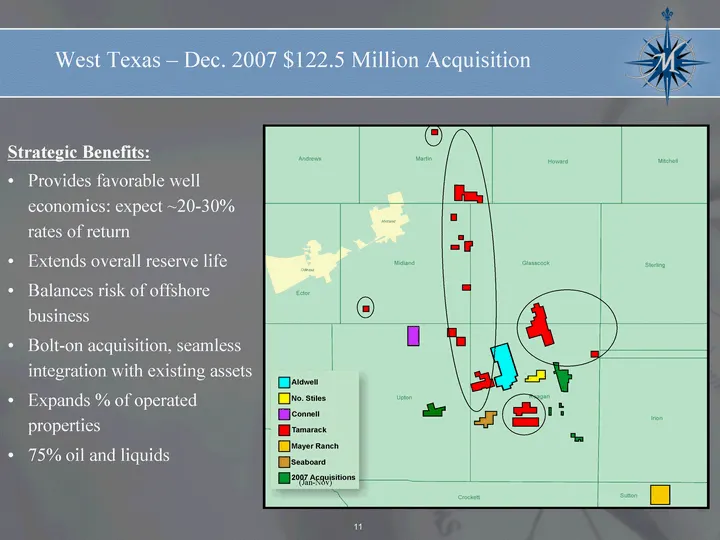
Slide 11: West Texas - Dec. 2007 $122.5 Million Acquisition
West Texas - Dec. 2007 $122.5 Million Acquisition Strategic Benefits: Provides favorable well economics: expect ~20-30% rates of return Extends overall reserve life Balances risk of offshore business Bolt-on acquisition, seamless integration with existing assets Expands % of operated properties 75%
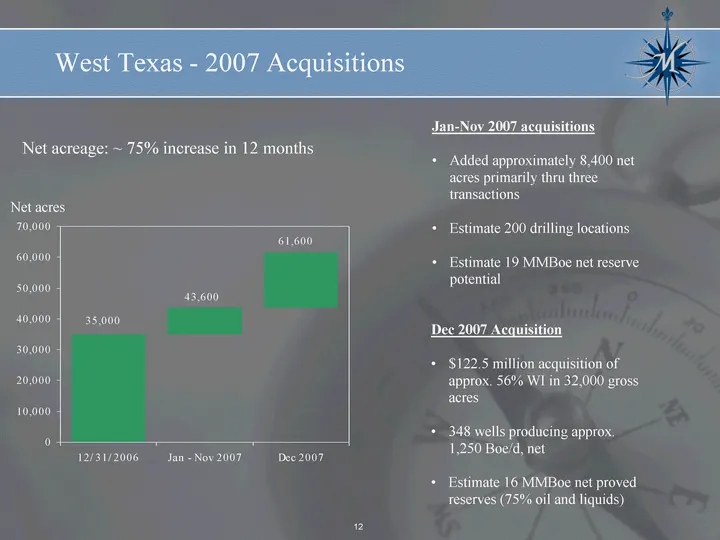
Slide 12: West Texas - 2007 Acquisitions
West Texas - 2007 Acquisitions 12/31/2006 Jan - Nov 2007 Dec 2007 Base 35000 35000 35000 Add 0 8644 8644 Add2 0 0 17920 Net acreage: ~ 75% increase in 12 months Jan-Nov 2007 acquisitions Added approximately 8,400 net acres primarily thru three transactions Estimate 200 drilling locations Estimate 19
Slide 13: Gulf of Mexico Shelf: 2008 Pending Acquisition from StatoilHydro
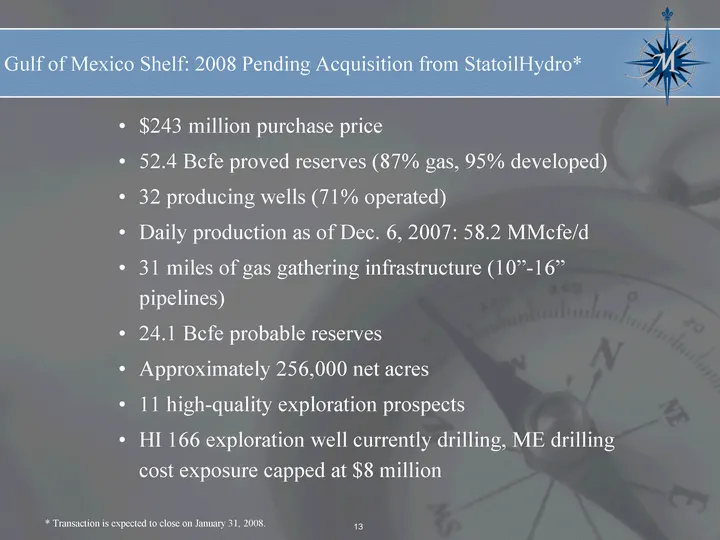
$243 million purchase price 52.4 Bcfe proved reserves (87% gas, 95% developed) 32 producing wells (71% operated) Daily production as of Dec. 6, 2007: 58.2 MMcfe/d 31 miles of gas gathering infrastructure (10"-16" pipelines) 24.1 Bcfe probable reserves Approximately 256,000 net acres 11 high-quality
Slide 14: Expanding the Shelf Footprint
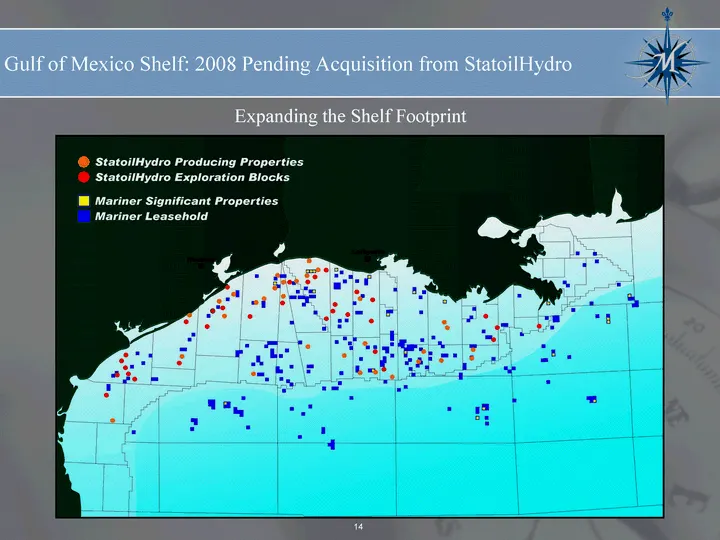
Expanding the Shelf Footprint Gulf of Mexico Shelf: 2008 Pending Acquisition from StatoilHydro
Slide 15: Rich Opportunity Set
Rich Opportunity Set Gulf of Mexico Over 1 million net acres, after close of StatoilHydro transaction Large multi-year prospect inventory Access to over 7,000 blocks recent vintage 3-D seismic data Large scale GOM lease sales Underexploited shelf assets and numerous prospects to be acquired Signific
Slide 16: Regional Seismic Coverage
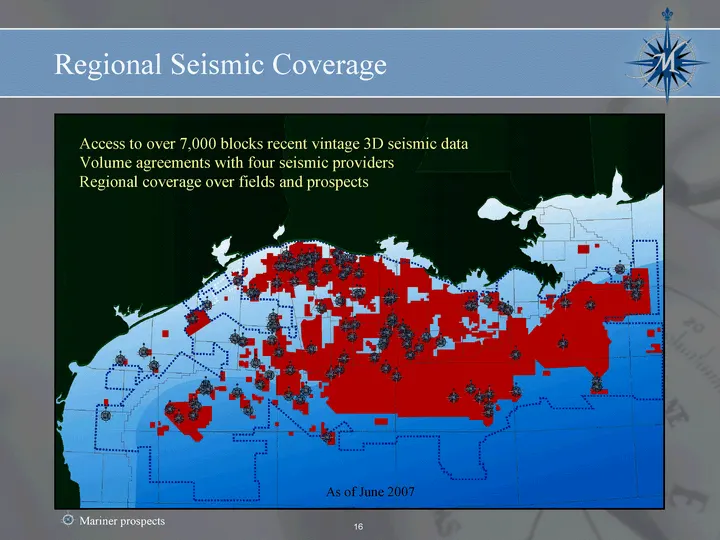
Access to over 7,000 blocks recent vintage 3D seismic data Volume agreements with four seismic providers Regional coverage over fields and prospects Mariner prospects Mariner prospects Regional Seismic Coverage As of June 2007
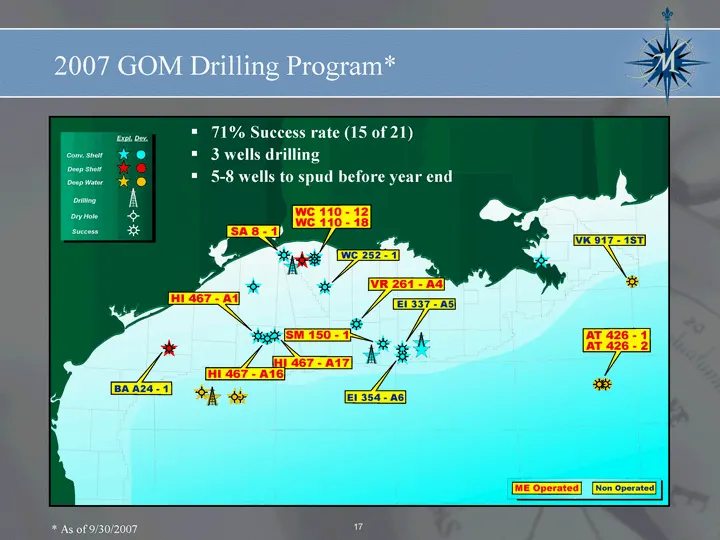
Slide 17: 2007 GOM Drilling Program
2007 GOM Drilling Program* * As of 9/30/2007 71% Success rate (15 of 21) 3 wells drilling 5-8 wells to spud before year end
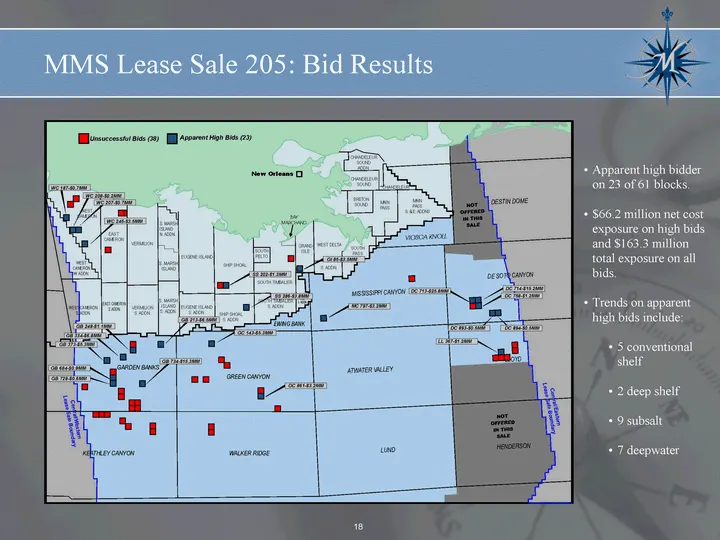
Slide 18: MMS Lease Sale 205: Bid Results
MMS Lease Sale 205: Bid Results Apparent high bidder on 23 of 61 blocks. $66.2 million net cost exposure on high bids and $163.3 million total exposure on all bids. Trends on apparent high bids include: 5 conventional shelf 2 deep shelf 9 subsalt 7 deepwater
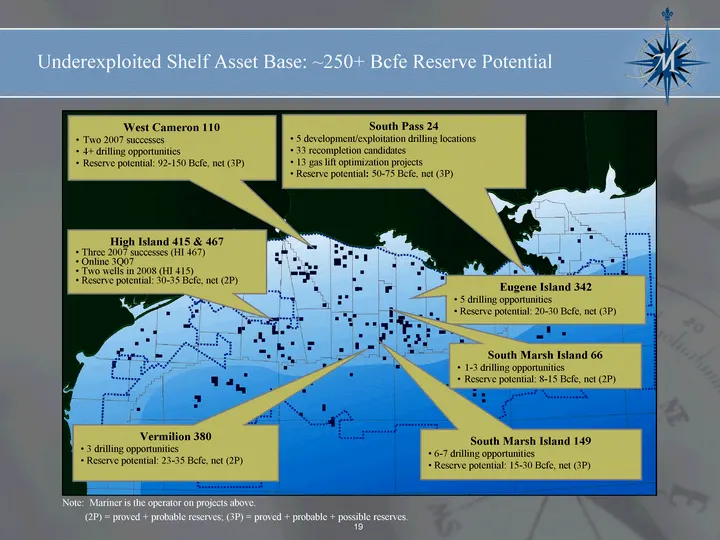
Slide 19: Underexploited Shelf Asset Base: ~250+ Bcfe Reserve Potential
Vermilion 380 • 3 drilling opportunities • Reserve potential: 23-35 Bcfe, net (2P) South Marsh Island 149 • 6-7 drilling opportunities • Reserve potential: 15-30 Bcfe, net (3P) High Island 415 & 467 • Three 2007 successes (HI 467) • Online 3Q07 • Two wells in 2008 (HI 415) • Reserve potential: 30-35
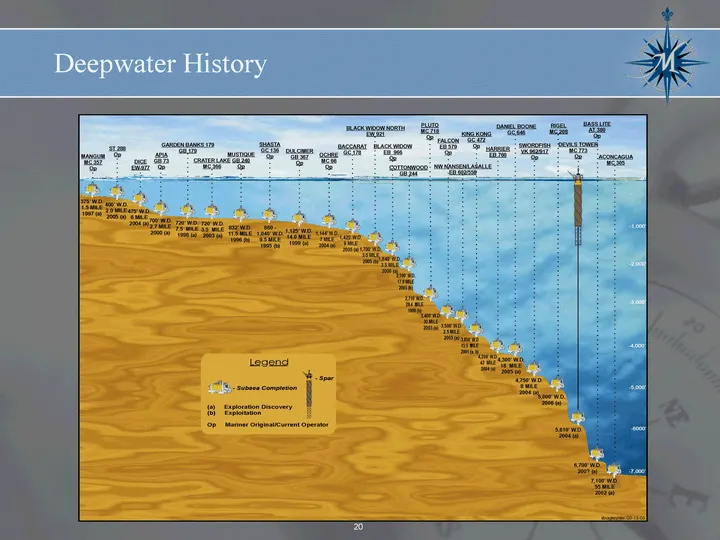
Slide 20: Deepwater History
Deepwater History Deepwater History
Slide 21: Devil's Tower Bass Lite Project
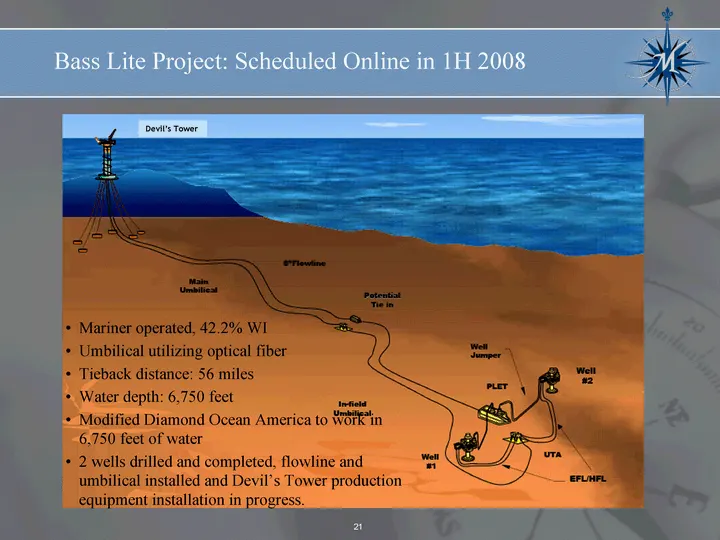
Mariner operated, 42.2% WI Umbilical utilizing optical fiber Tieback distance: 56 miles Water depth: 6,750 feet Modified Diamond Ocean America to work in 6,750 feet of water 2 wells drilled and completed, flowline and umbilical installed and Devil's Tower production equipment installation in progres
Slide 22: Bass Lite Project: Update
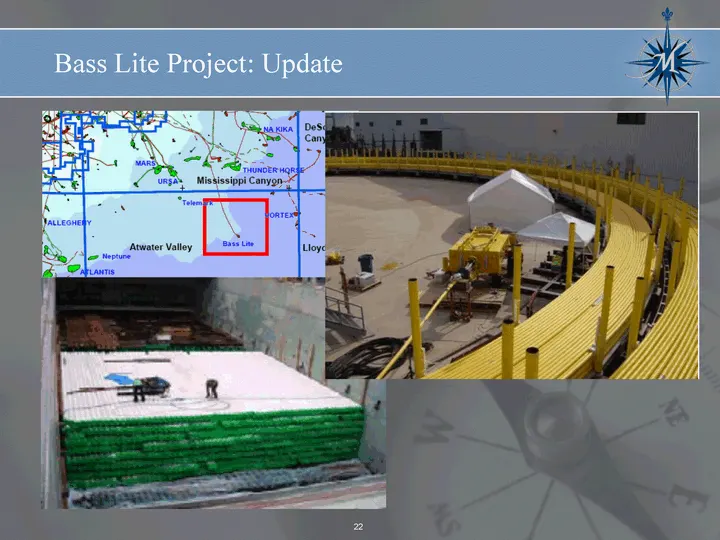
Bass Lite Project: Update eM =
Slide 23: Northwest Nansen - East Breaks 558/602
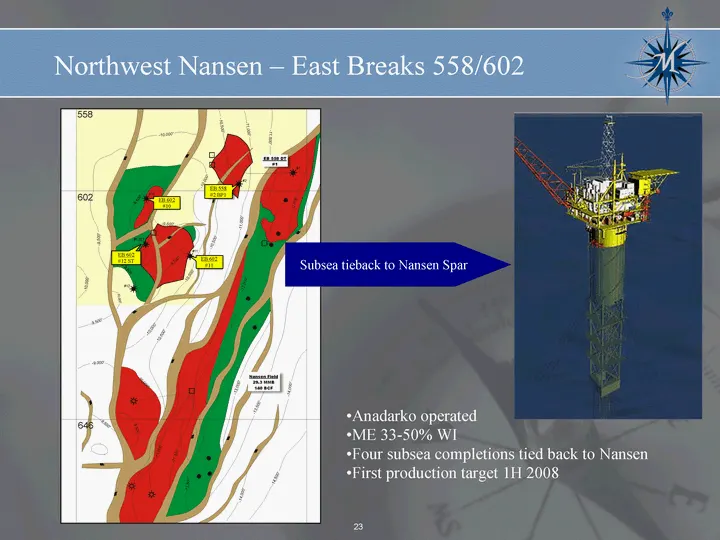
Northwest Nansen - East Breaks 558/602 Anadarko operated ME 33-50% WI Four subsea completions tied back to Nansen First production target 1H 2008 EB 602 #10 EB 558 #2 BP1 EB 602 #12 ST EB 602 #11 Subsea tieback to Nansen Spar
Slide 24: Risk Management
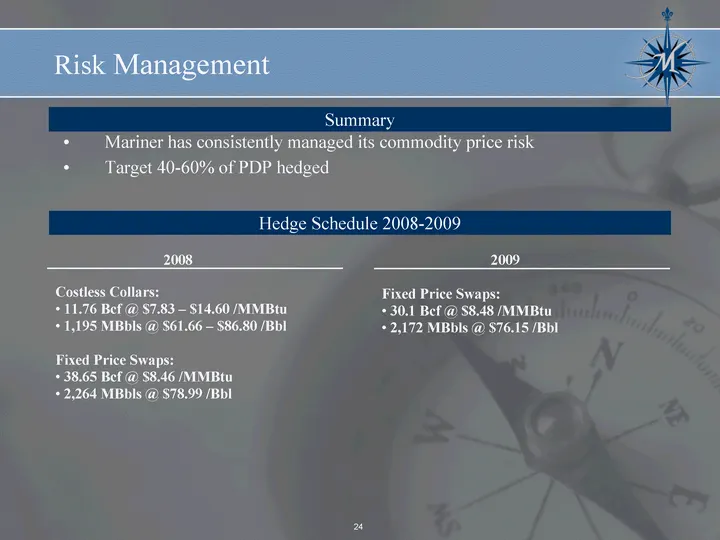
Risk Management Mariner has consistently managed its commodity price risk Target 40-60% of PDP hedged Summary Hedge Schedule 2008-2009 2008 Costless Collars: 11.76 Bcf @ $7.83 - $14.60 /MMBtu 1,195 MBbls @ $61.66 - $86.80 /Bbl Fixed Price Swaps: 38.65 Bcf @ $8.46 /MMBtu 2,264 MBbls @ $78.99 /Bbl Fix
Slide 25: Peer Comparison: Production Growth and Cost
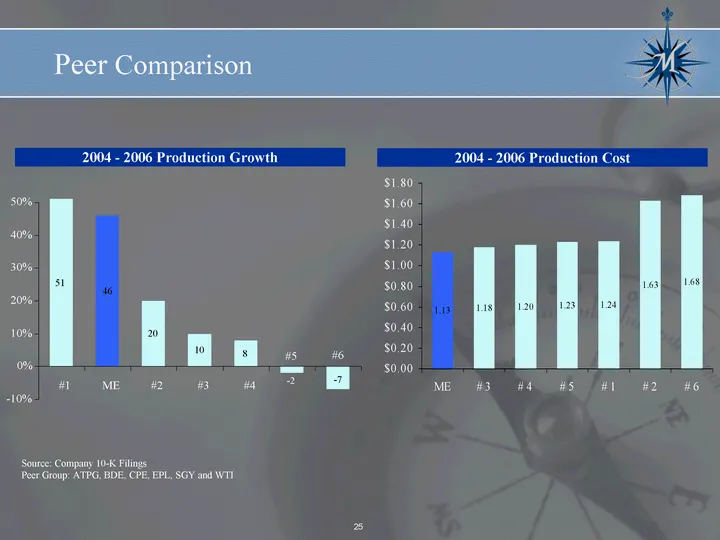
Peer Comparison 2004 - 2006 Production Growth Source: Company 10-K Filings Peer Group: ATPG, BDE, CPE, EPL, SGY and WTI 2004 - 2006 Production Cost ME #3 #4 #5 #1 #2 #6 LOE + Prod. Tax + Transport 1.13 1.18 1.2 1.23 1.24 1.63 1.68 51 20 10 8 - -2 46 - -7 - -10% 0% 10% 20% 30% 40% 50% #1 ME #2 #3 #4
Slide 26: Peer Comparison (Cont.)
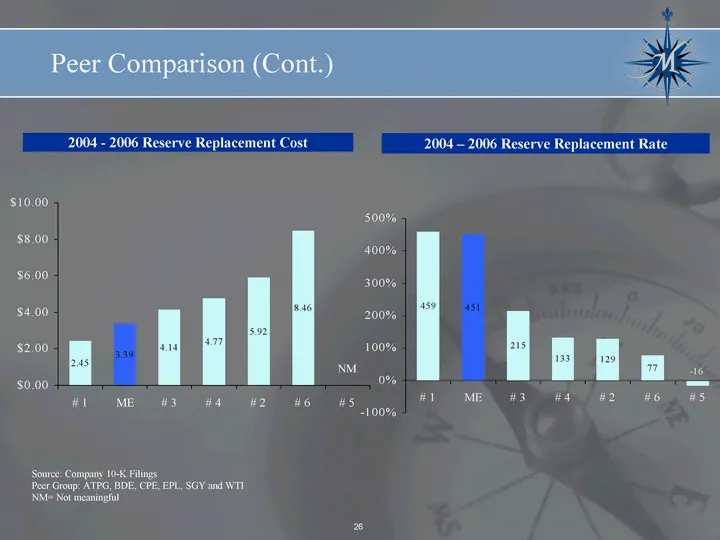
#1 ME #3 #4 #2 #6 #5 Reserve Growth 2.45 3.39 4.14 4.77 5.92 8.46 Source: Company 10-K Filings Peer Group: ATPG, BDE, CPE, EPL, SGY and WTI NM= Not meaningful NM Peer Comparison (Cont.) 2004 - 2006 Reserve Replacement Cost 2004 - 2006 Reserve Replacement Rate #1 ME #3 #4 #2 #6 #5 Reserve Replacement

Slide 27: Appendix
Appendix
Slide 28: Reconciliation of Non-GAAP Measure: EBITDA
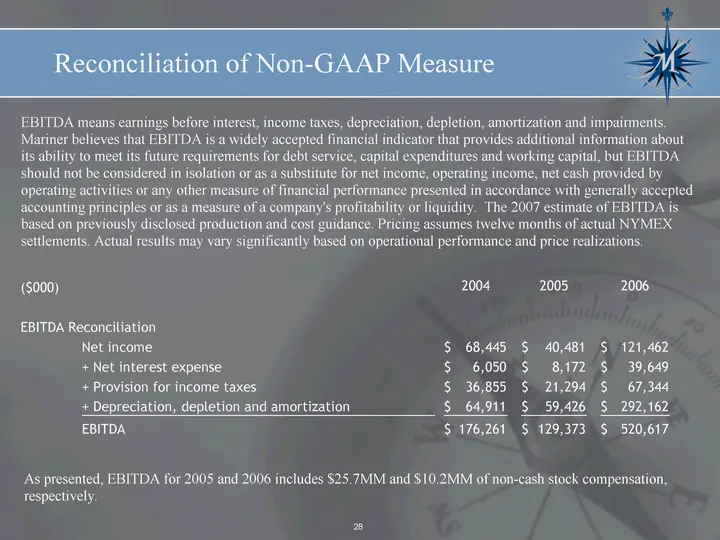
Reconciliation of Non-GAAP Measure EBITDA means earnings before interest, income taxes, depreciation, depletion, amortization and impairments. Mariner believes that EBITDA is a widely accepted financial indicator that provides additional information about its ability to meet its future requirements
Slide 29: Operating Cash Flow Reconciliation
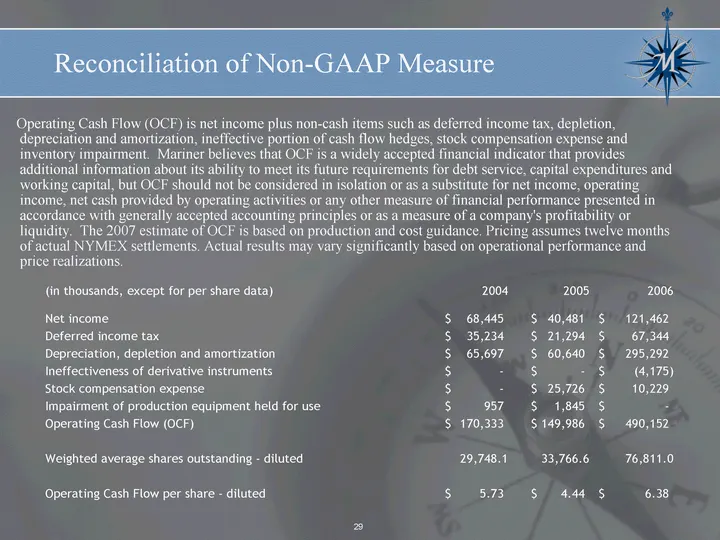
Operating Cash Flow (OCF) is net income plus non-cash items such as deferred income tax, depletion, depreciation and amortization, ineffective portion of cash flow hedges, stock compensation expense and inventory impairment. Mariner believes that OCF is a widely accepted financial indicator that pro
Slide 30: Reserve Replacement Rate
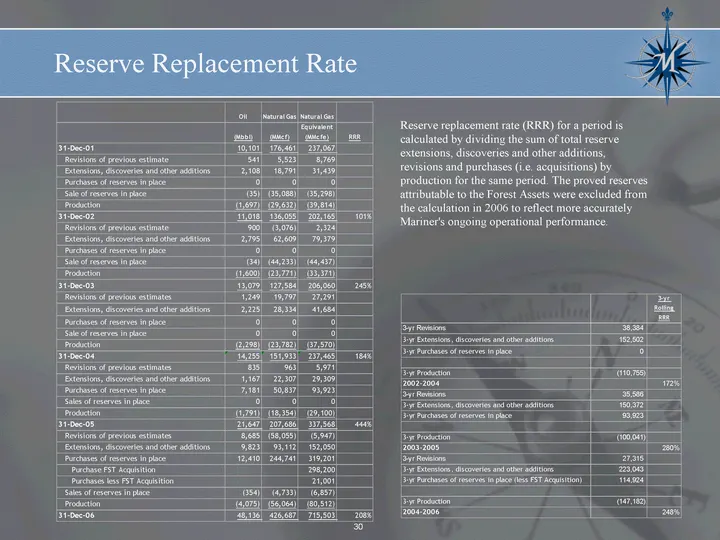
Reserve Replacement Rate Reserve replacement rate (RRR) for a period is calculated by dividing the sum of total reserve extensions, discoveries and other additions, revisions and purchases (i.e. acquisitions) by production for the same period. The proved reserves attributable to the Forest Assets we
Source: SEC EDGAR · 8-K filed Jan 8, 2008
More decks from Mariner Energy Inc
 Merger or Acquisition (July 2010)27 slides · Jul 27, 2010
 Merger or Acquisition (April 2010)23 slides · Apr 27, 2010
 IPAA Oil & Gas Investment Symposium April 8, 200852 slides · Apr 7, 2008
 Raymond James 29th Annual Institutional Investors Conference (March 2008)34 slides · Mar 5, 2008
 Investor Presentation (November 2007)30 slides · Nov 14, 2007
 IPAA Oil & Gas Investment Symposium 200737 slides · Apr 23, 2007