HD Supply — Raymond James Institutional Investors Conference 2015
16 slides from HD Supply's conference presentation, Mar 4, 2015

Slide 1: Raymond James Institutional Investors Conference March 4, 2015
Raymond James Institutional Investors Conference March 4, 2015
Slide 2: Disclaimers
Disclaimers Forward-Looking Statements This presentation includes “forward-looking statements” within the meaning of Section 27A of the Securities Act and Section 21E of the Exchange Act. Forward-looking statements are subject to known and unknown risks and uncertainties, many of which may be beyond
Slide 3: Company Overview
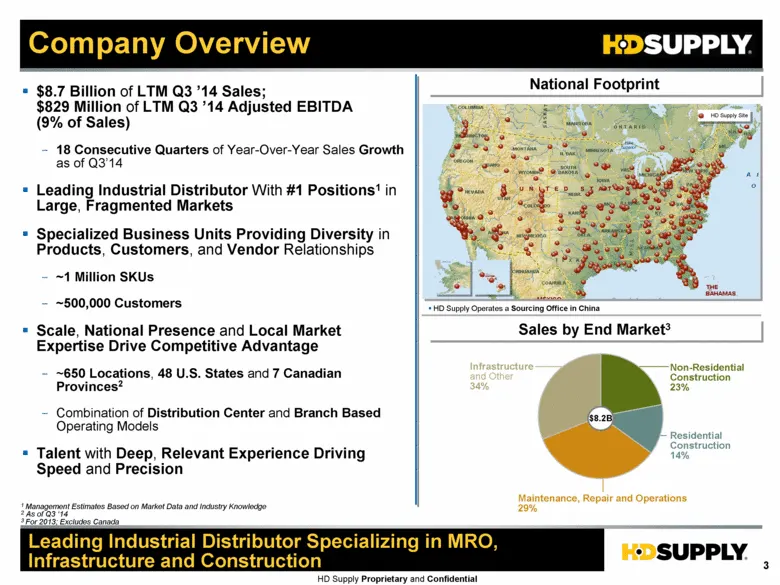
HD Supply Proprietary and Confidential Company Overview $8.7 Billion of LTM Q3 ’14 Sales; $829 Million of LTM Q3 ’14 Adjusted EBITDA (9% of Sales) 18 Consecutive Quarters of Year-Over-Year Sales Growth as of Q3’14 Leading Industrial Distributor With #1 Positions1 in Large, Fragmented Markets Special
Slide 4: Leading Industrial Distributor Specializing in MRO, Infrastructure and Construction
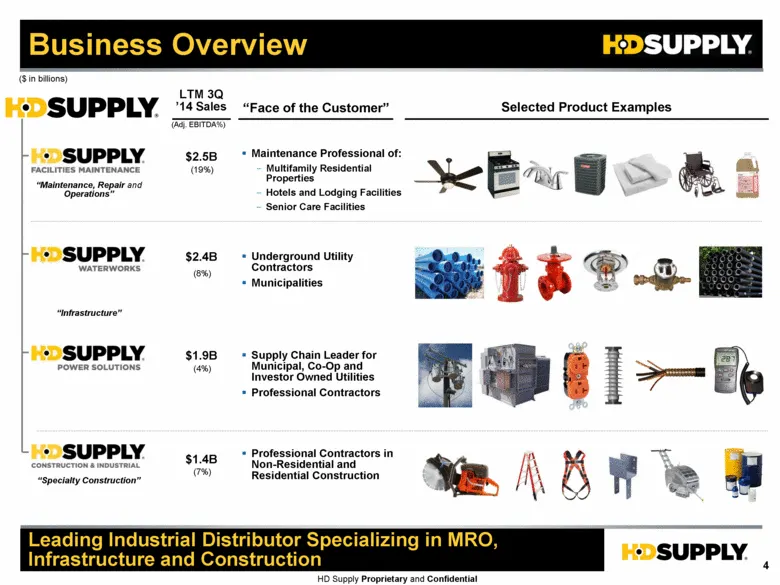
HD Supply Proprietary and Confidential Leading Industrial Distributor Specializing in MRO, Infrastructure and Construction Business Overview “Maintenance, Repair and Operations” “Infrastructure” “Specialty Construction” Selected Product Examples Maintenance Professional of: Multifamily Residential P
Slide 5: Controllable Execution +300 Basis Points Above Market Estimate
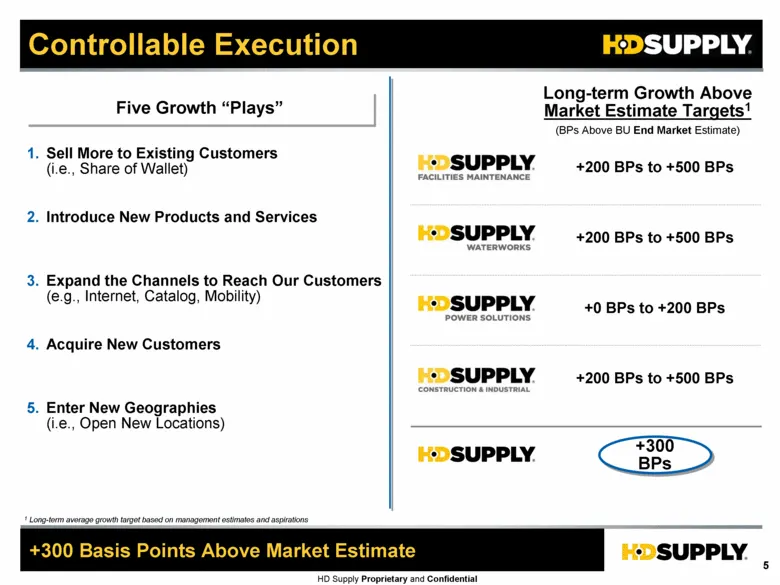
HD Supply Proprietary and Confidential Controllable Execution +300 Basis Points Above Market Estimate 1 Long-term average growth target based on management estimates and aspirations +200 BPs to +500 BPs +300 BPs Long-term Growth Above Market Estimate Targets1 +200 BPs to +500 BPs +200 BPs to +500 BP
Slide 6: Topics of Investor Interest
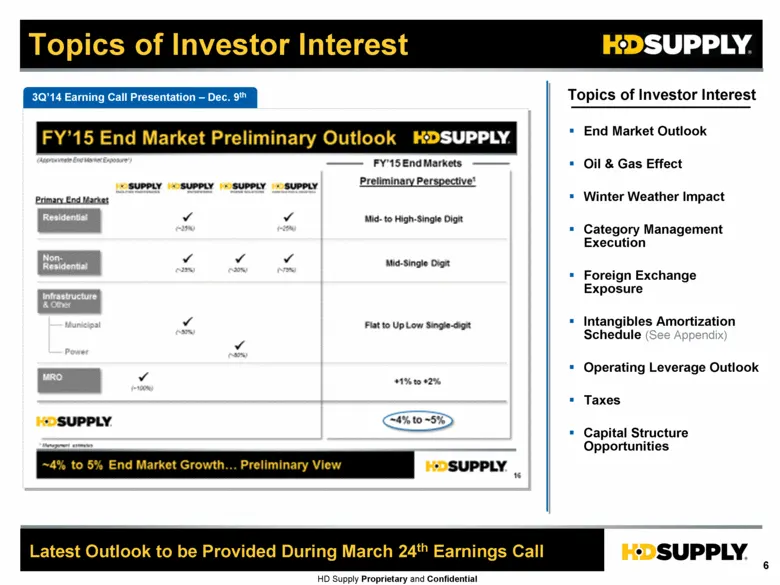
HD Supply Proprietary and Confidential 3Q’14 Earning Call Presentation – Dec. 9th Topics of Investor Interest Latest Outlook to be Provided During March 24th Earnings Call End Market Outlook Oil & Gas Effect Winter Weather Impact Category Management Execution Foreign Exchange Exposure Intangibles Am
Slide 7: Liquidity and Capital Structure
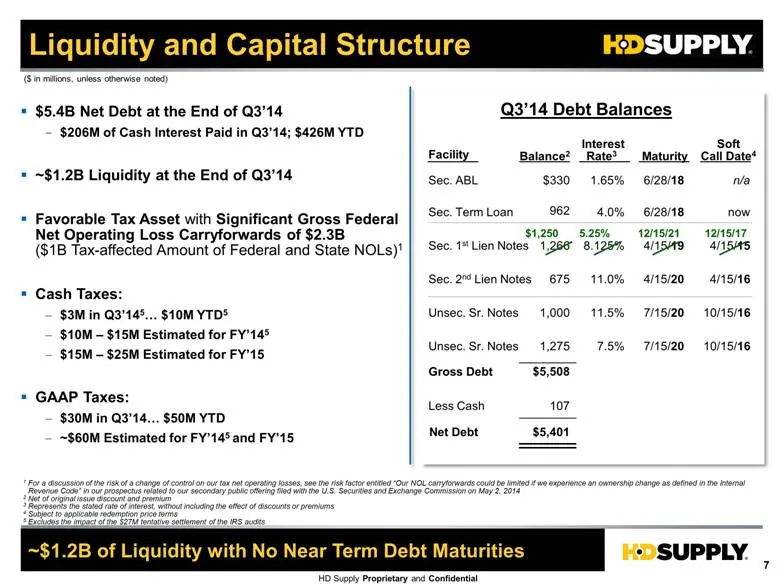
HD Supply Proprietary and Confidential Liquidity and Capital Structure Q3’14 Debt Balances Sec. ABL Sec. Term Loan Sec. 1st Lien Notes Sec. 2nd Lien Notes Unsec. Sr. Notes Unsec. Sr. Notes $330 1,266 675 1,000 1,275 6/28/18 6/28/18 4/15/19 4/15/20 7/15/20 7/15/20 Gross Debt Less Cash Net Debt $5,401
Slide 8: Historical Financial Performance
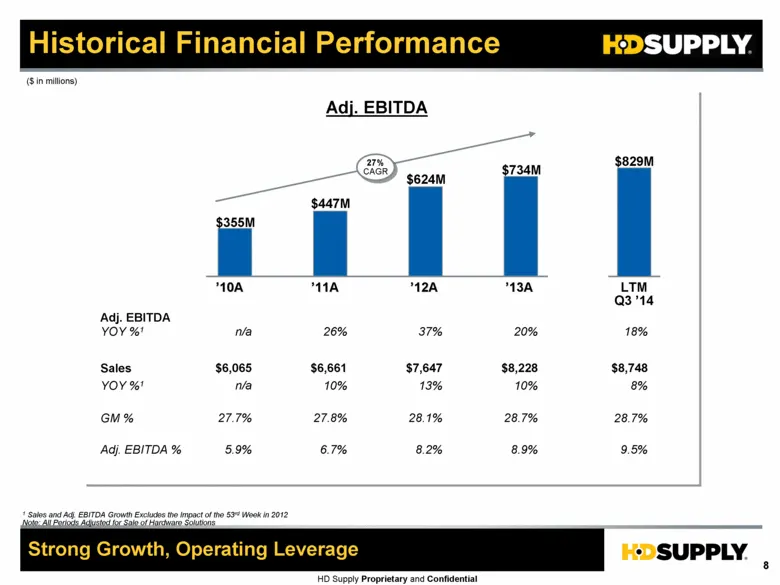
HD Supply Proprietary and Confidential Historical Financial Performance Strong Growth, Operating Leverage ($ in millions) 1 Sales and Adj. EBITDA Growth Excludes the Impact of the 53rd Week in 2012 Note: All Periods Adjusted for Sale of Hardware Solutions Adj. EBITDA Sales GM % Adj. EBITDA % YOY %1
Slide 9: Investment Themes
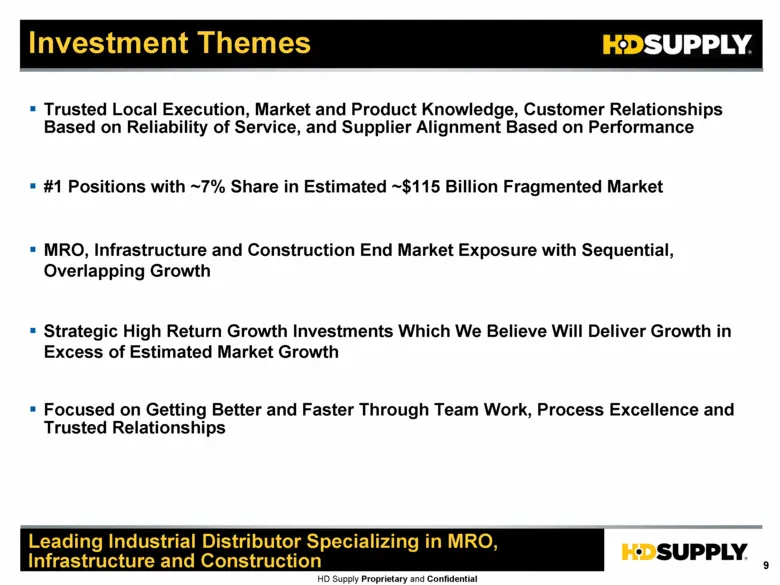
HD Supply Proprietary and Confidential Investment Themes Trusted Local Execution, Market and Product Knowledge, Customer Relationships Based on Reliability of Service, and Supplier Alignment Based on Performance #1 Positions with ~7% Share in Estimated ~$115 Billion Fragmented Market MRO, Infrastruc
Slide 10: Appendix
Appendix HD Supply Proprietary and Confidential
Slide 11: Illustrative Adjusted EPS Calculation
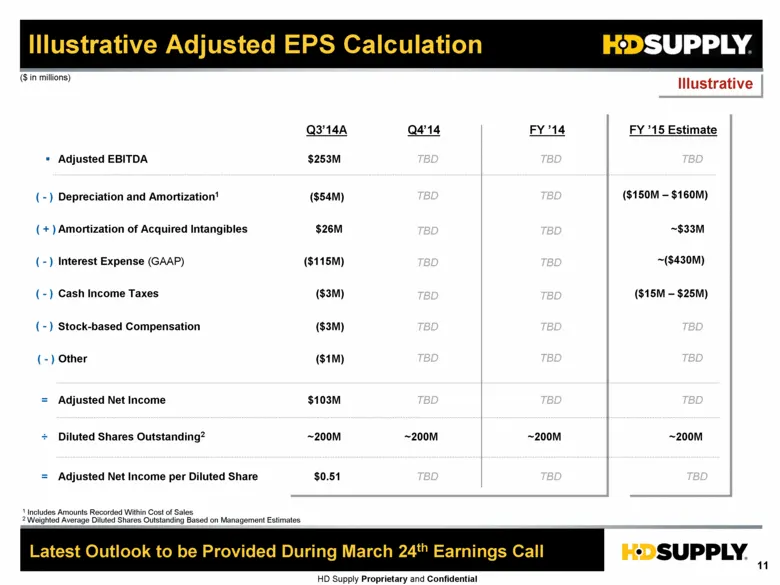
HD Supply Proprietary and Confidential Illustrative Adjusted EPS Calculation Adjusted EBITDA 1 Includes Amounts Recorded Within Cost of Sales 2 Weighted Average Diluted Shares Outstanding Based on Management Estimates Adjusted Net Income per Diluted Share Adjusted Net Income = = Diluted Shares Outst
Slide 12: Amortization of Acquired Intangibles (Other than Software)
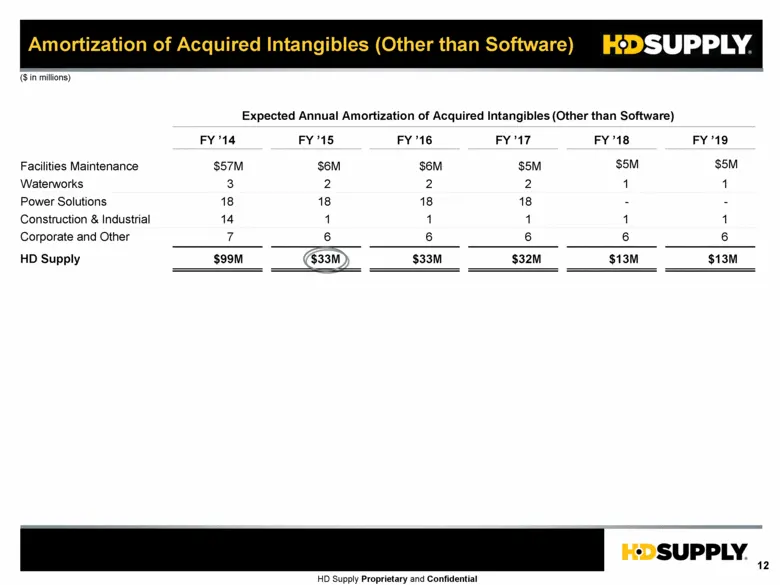
HD Supply Proprietary and Confidential Amortization of Acquired Intangibles (Other than Software) ($ in millions) FY ’14 FY ’15 FY ’16 FY ’17 FY ’18 FY ’19 Facilities Maintenance $57M $6M $6M $5M $5M $5M Waterworks 3 2 2 2 1 1 Power Solutions 18 18 18 18 - - Construction & Industrial 14 1 1 1 1 1 Co
Slide 13: Operating Leverage
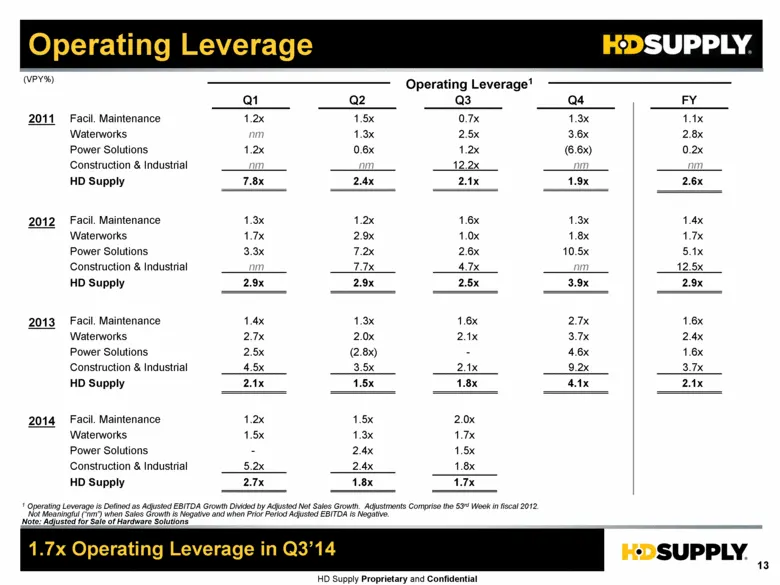
HD Supply Proprietary and Confidential Operating Leverage 1.7x Operating Leverage in Q3’14 Q1 Operating Leverage1 (VPY%) Q2 Q3 Q4 1.2x 1.5x 0.7x 1.3x nm 1.3x 2.5x 3.6x 1.2x 0.6x 1.2x (6.6x) nm nm 12.2x nm 7.8x 2.4x 2.1x 1.9x 1.1x 2.8x 0.2x nm 2.6x 1.3x 1.2x 1.6x 1.3x 1.7x 2.9x 1.0x 1.8x 3.3x 7.2x 2.
Slide 14: FY'14 YTD Results Adjusted for Hardware Solutions
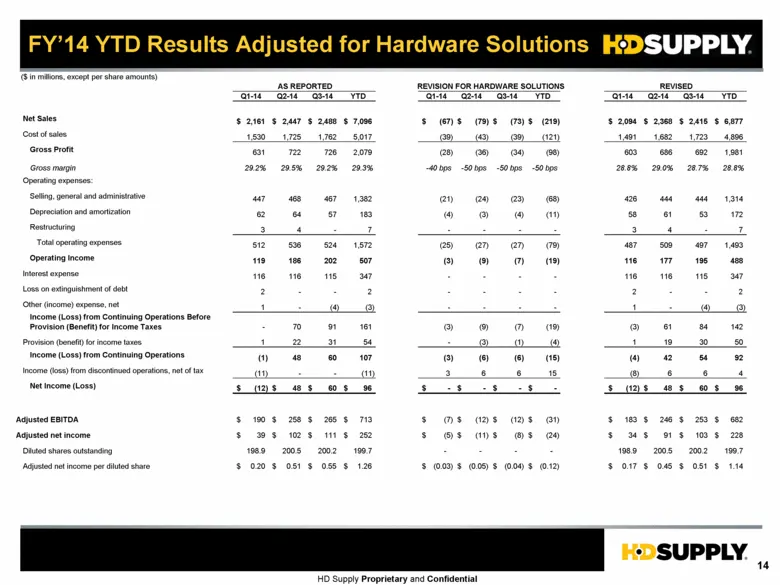
HD Supply Proprietary and Confidential FY’14 YTD Results Adjusted for Hardware Solutions ($ in millions, except per share amounts) Q1-14 Q2-14 Q3-14 YTD Q1-14 Q2-14 Q3-14 YTD Q1-14 Q2-14 Q3-14 YTD Net Sales 2,161 $ 2,447 $ 2,488 $ 7,096 $ (67) $ (79) $ (73) $ (219) $ 2,094 $ 2,368 $ 2,415 $ 6,877 $
Slide 15: FY'13 Results Adjusted for Hardware Solutions
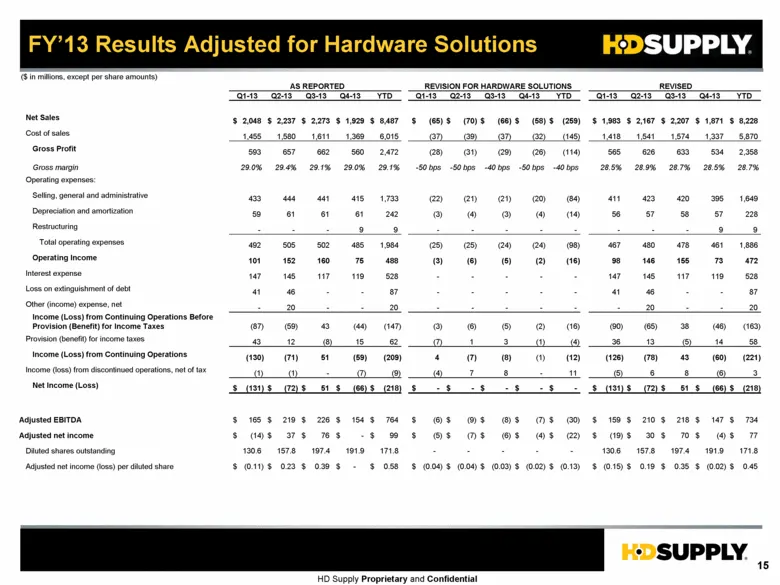
HD Supply Proprietary and Confidential FY’13 Results Adjusted for Hardware Solutions ($ in millions, except per share amounts) AS REPORTED REVISION FOR HARDWARE SOLUTIONS REVISED Q1-13 Q2-13 Q3-13 Q4-13 YTD Q1-13 Q2-13 Q3-13 Q4-13 YTD Q1-13 Q2-13 Q3-13 Q4-13 YTD Net Sales 2,048 $ 2,237 $ 2,273 $ 1,9
Slide 16: Reconciliation of Non-GAAP Measures: Net Income to Adj EBITDA
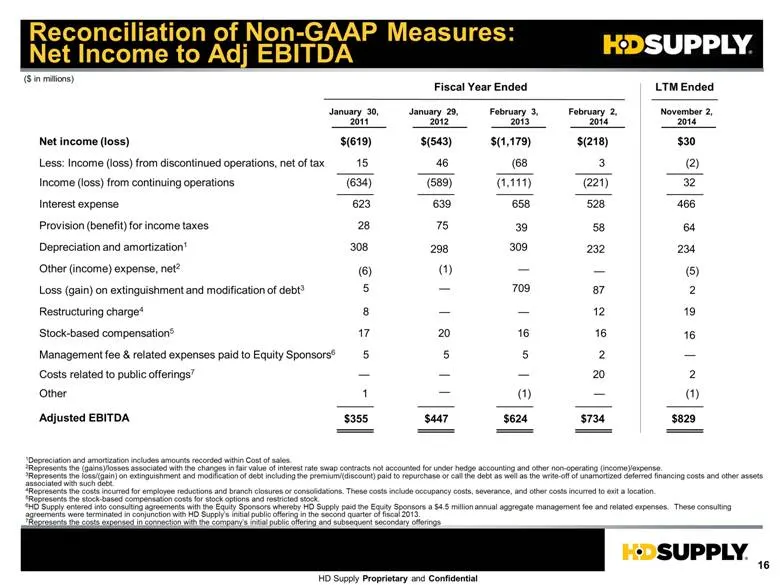
HD Supply Proprietary and Confidential Reconciliation of Non-GAAP Measures: Net Income to Adj EBITDA 1 Depreciation and amortization includes amounts recorded within Cost of sales. 2 Represents the (gains)/losses associated with the changes in fair value of interest rate swap contracts not accounted
Source: SEC EDGAR · 8-K filed Mar 4, 2015
More decks from HD Supply Holdings Inc
 Q2 2020 Earnings Presentation18 slides · Sep 9, 2020
 Q1 2020 Earnings Presentation21 slides · Jun 9, 2020
 Q4 2019 Earnings Presentation20 slides · Mar 17, 2020
 Q3 2019 Earnings Presentation21 slides · Dec 10, 2019
 Robert W. Baird & Co. 2019 Industrial Conference9 slides · Nov 6, 2019
 Merger or Acquisition (September 2019)21 slides · Sep 25, 2019