Transatlantic — Merger or Acquisition (September 2011)
24 slides from Transatlantic's merger presentation, Sep 7, 2011
Slide 1: Allied World's Merger with Transatlantic
ALLIED WORLD'S MERGER WITH TRANSATLANTIC September 2011
Slide 2: Forward-looking statements
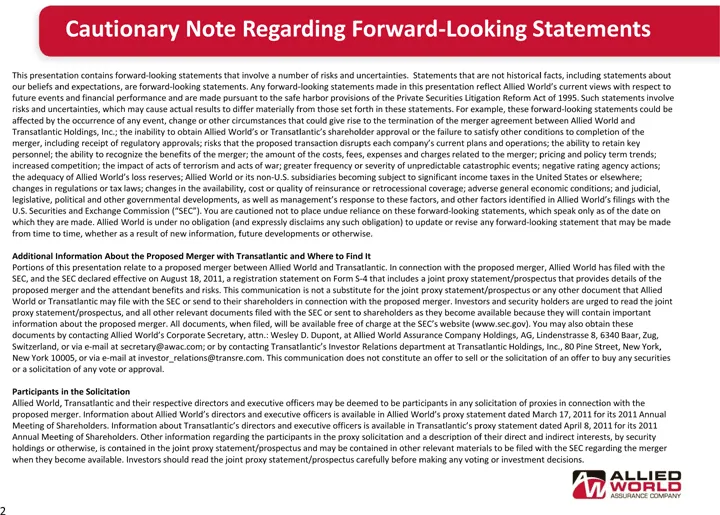
This presentation contains forward-looking statements that involve a number of risks and uncertainties. Statements that are not historical facts, including statements about our beliefs and expectations, are forward-looking statements. Any forward-looking statements made in this presentation reflect
Slide 3: Agenda
Agenda TransAllied Combination Peer Comparisons Conclusion Appendix 3
Slide 4: The TransAllied Merger is the Superior Combination
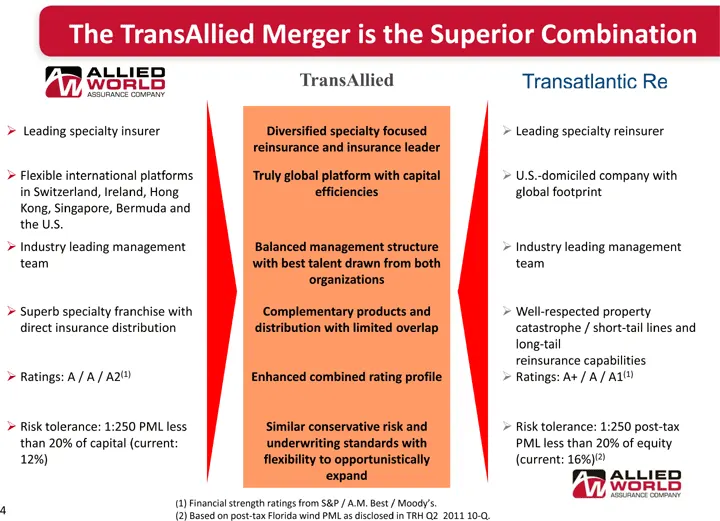
The TransAllied Merger is the Superior Combination Industry leading management team Industry leading management team Superb specialty franchise with direct insurance distribution Well-respected property catastrophe / short-tail lines and long-tail reinsurance capabilities Ratings: A / A / A2(1) Rati
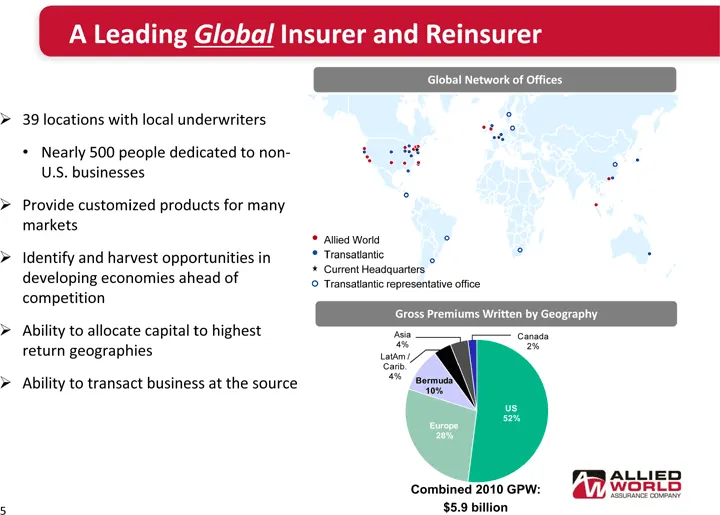
Slide 5: A Leading Global Insurer and Reinsurer
A Leading Global Insurer and Reinsurer 5 Global Network of Offices 39 locations with local underwriters Nearly 500 people dedicated to non- U.S. businesses Provide customized products for many markets Identify and harvest opportunities in developing economies ahead of competition Ability to allocate
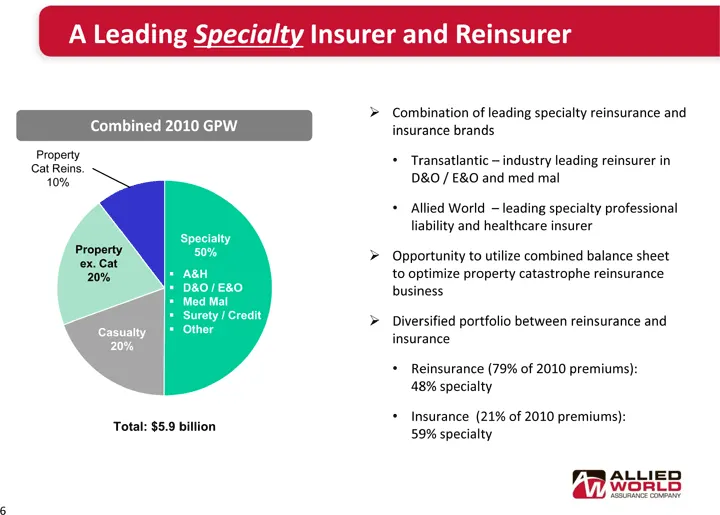
Slide 6: A Leading Specialty Insurer and Reinsurer
6 (CHART) Combined 2010 GPW Total: $5.9 billion Specialty 50% Casualty 20% Property Cat Reins. 10% Property ex. Cat 20% Combination of leading specialty reinsurance and insurance brands Transatlantic - industry leading reinsurer in D&O / E&O and med mal Allied World - leading specialty professional
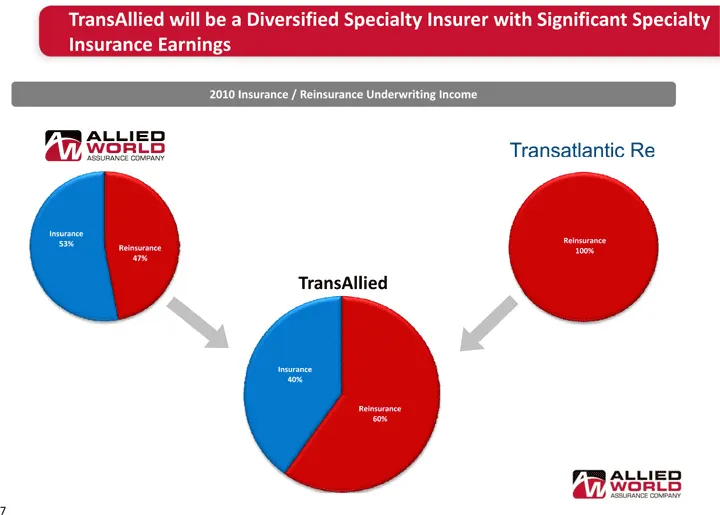
Slide 7: TransAllied will be a Diversified Specialty Insurer
(CHART) TransAllied will be a Diversified Specialty Insurer with Significant Specialty Insurance Earnings (CHART) (CHART) 7 TransAllied 2010 Insurance / Reinsurance Underwriting Income
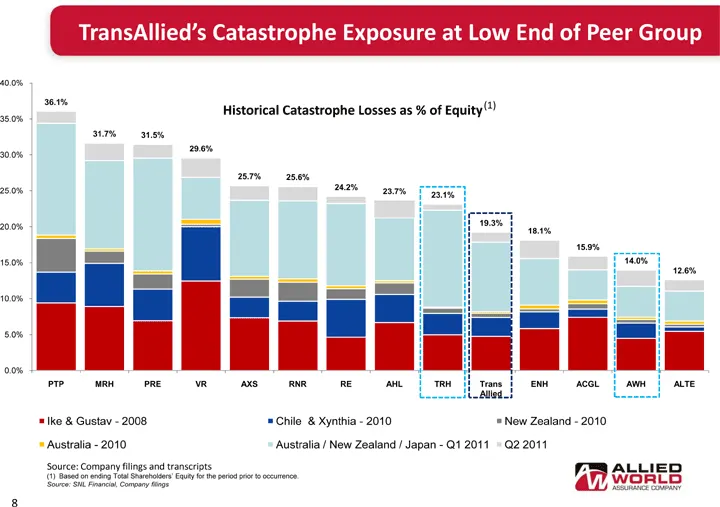
Slide 8: TransAllied's Catastrophe Exposure at Low End of Peer Group
(CHART) Source: Company filings and transcripts (1) Based on ending Total Shareholders' Equity for the period prior to occurrence. Source: SNL Financial, Company filings Historical Catastrophe Losses as % of Equity (1) 8 TransAllied's Catastrophe Exposure at Low End of Peer Group
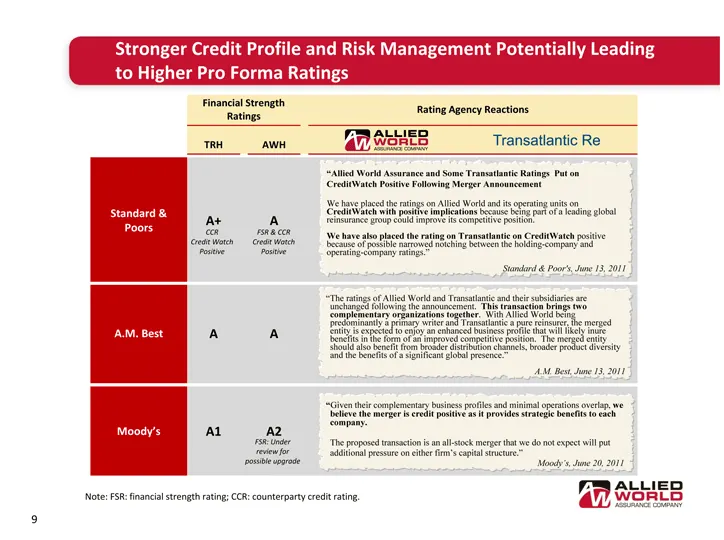
Slide 9: Stronger Credit Profile and Risk Management
Stronger Credit Profile and Risk Management Potentially Leading to Higher Pro Forma Ratings Financial Strength Ratings Financial Strength Ratings Financial Strength Ratings Rating Agency Reactions TRH AWH Standard & Poors A+ A A.M. Best A A Moody's A1 A2 "Allied World Assurance and Some Transatlanti
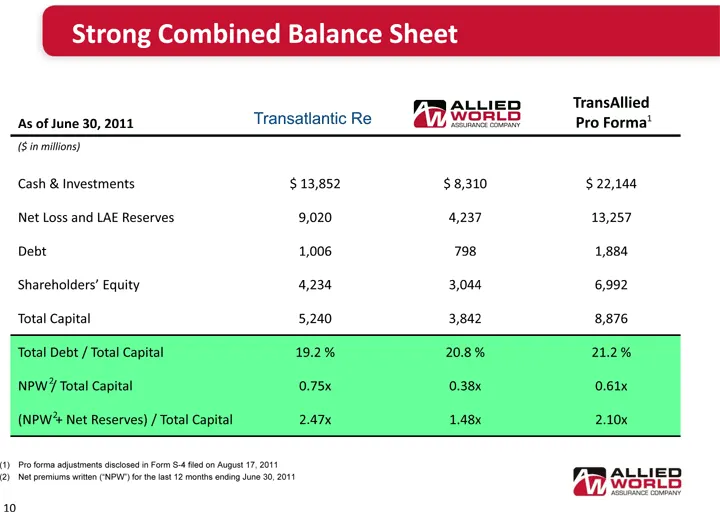
Slide 10: Strong Combined Balance Sheet
As of June 30, 2011 TransAllied Pro Forma ($ in millions) Cash & Investments $ 13,852 $ 8,310 $ 22,144 Net Loss and LAE Reserves 9,020 4,237 13,257 Debt 1,006 798 1,884 Shareholders' Equity 4,234 3,044 6,992 Total Capital 5,240 3,842 8,876 Total Debt / Total Capital 19.2 % 20.8 % 21.2 % NPW / Total
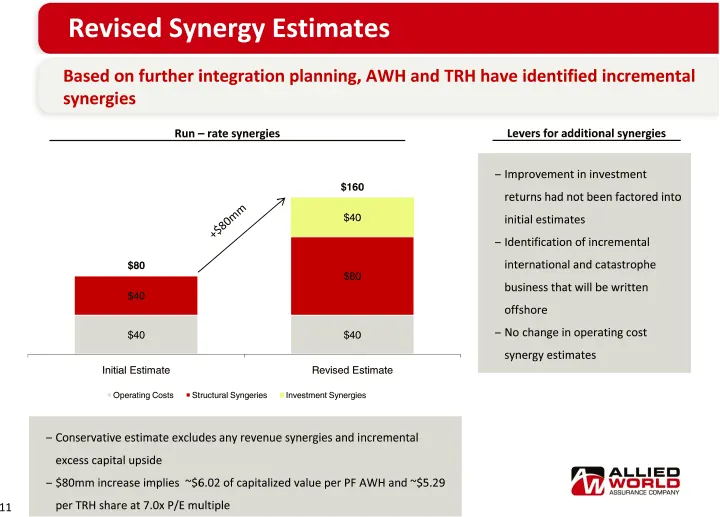
Slide 11: Revised Synergy Estimates
5 Run - rate synergies Levers for additional synergies Improvement in investment returns had not been factored into initial estimates Identification of incremental international and catastrophe business that will be written offshore No change in operating cost synergy estimates Conservative estimate
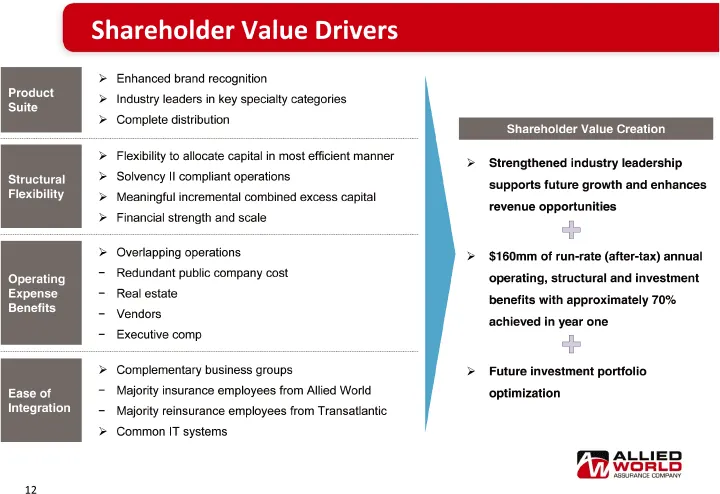
Slide 12: Shareholder Value Creation
12 Shareholder Value Drivers Product Suite Enhanced brand recognitionIndustry leaders in key specialty categoriesComplete distribution Structural Flexibility Flexibility to allocate capital in most efficient mannerSolvency II compliant operationsMeaningful incremental combined excess capitalFinancia
Slide 13: Peer comparison footnotes
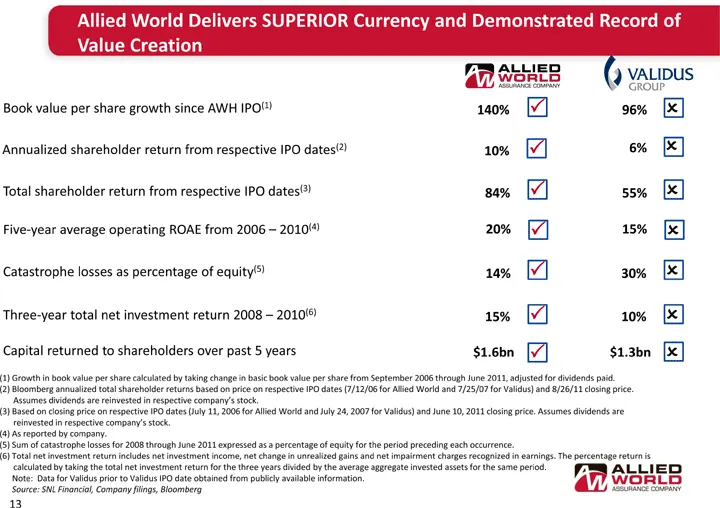
(1) Growth in book value per share calculated by taking change in basic book value per share from September 2006 through June 2011, adjusted for dividends paid. (2) Bloomberg annualized total shareholder returns based on price on respective IPO dates (7/12/06 for Allied World and 7/25/07 for Validus
Slide 14: Agenda
Agenda TransAllied Combination Peer Comparisons Conclusion Appendix 14
Slide 15: Expense Ratio Consistently Below Peer Average
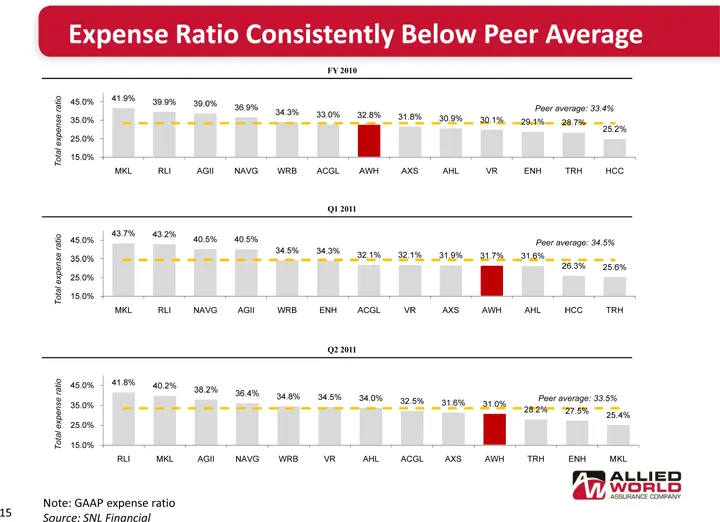
15 Note: GAAP expense ratio Source: SNL Financial (CHART) FY 2010 Q1 2011 Q2 2011 (CHART) (CHART) Expense Ratio Consistently Below Peer Average
Slide 16: Peer Comparisons - Operating Income ROE
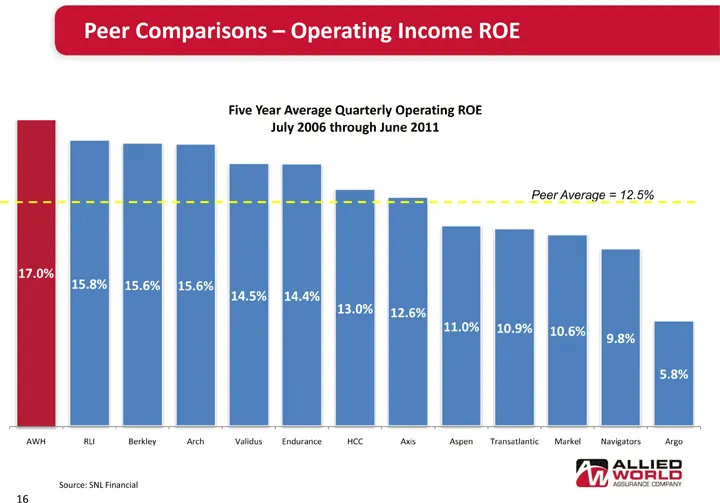
(CHART) Peer Comparisons - Operating Income ROE Source: SNL Financial 16 Five Year Average Quarterly Operating ROE July 2006 through June 2011 Peer Average = 12.5%
Slide 17: Allied World's Value Proposition
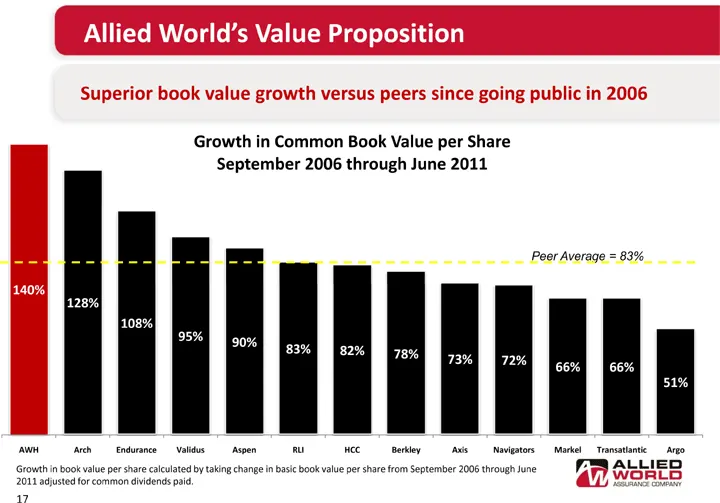
(CHART) Allied World's Value Proposition Superior book value growth versus peers since going public in 2006 Growth in book value per share calculated by taking change in basic book value per share from September 2006 through June 2011 adjusted for common dividends paid. 17 Peer Average = 83%
Slide 18: Agenda
Agenda TransAllied Combination Peer Comparisons Conclusion Appendix 18
Slide 19: Conclusion
Conclusion Strategic Combination Creates an Industry Leader Capable of Generating Significant Shareholder Value A leading diversified insurance and reinsurance company with a specialty focus Scale and market position in the top quartile of industry A global franchise with local presence in key marke
Slide 20: Agenda
Agenda TransAllied Combination Peer Comparisons Conclusion Appendix 20
Slide 21: Non-GAAP Financial Measures
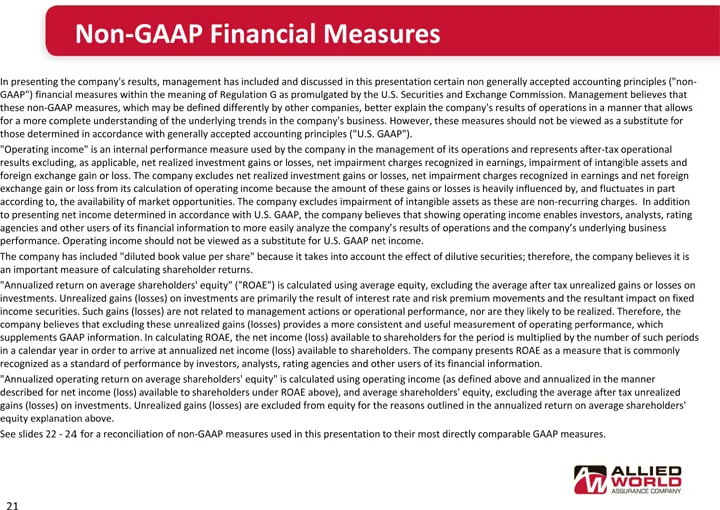
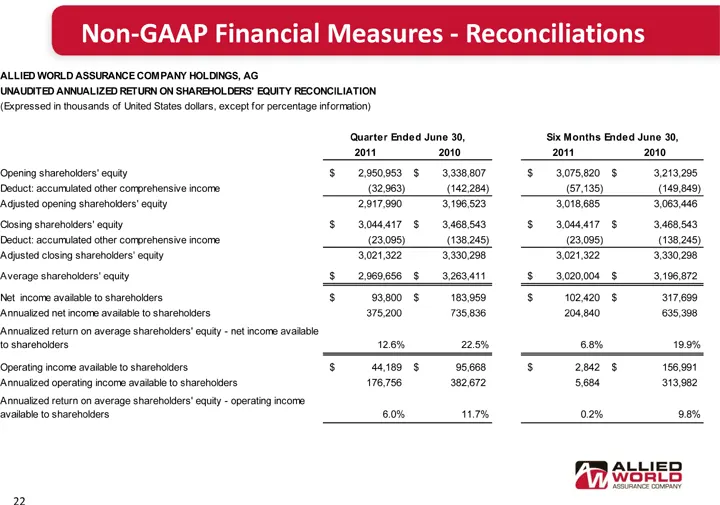
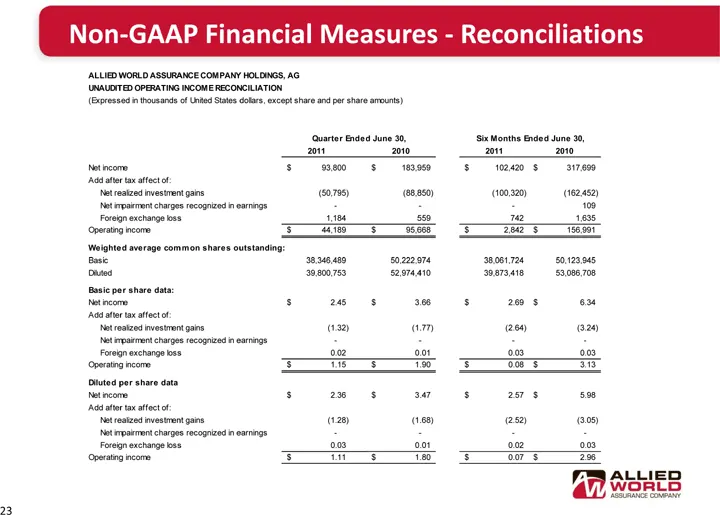
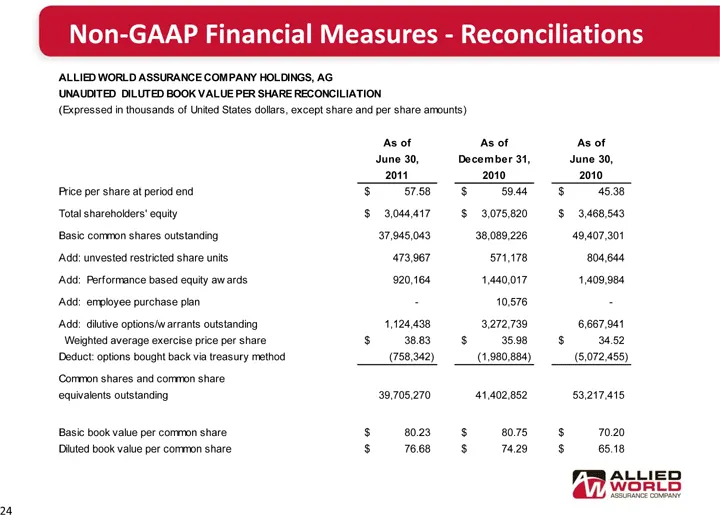
Non-GAAP Financial Measures In presenting the company's results, management has included and discussed in this presentation certain non generally accepted accounting principles ("non- GAAP") financial measures within the meaning of Regulation G as promulgated by the U.S. Securities and Exchange Comm
Slide 22: Non-GAAP Financial Measures - Reconciliations
Non-GAAP Financial Measures - Reconciliations 22
Slide 23: Non-GAAP Financial Measures - Reconciliations
Non-GAAP Financial Measures - Reconciliations 23
Slide 24: Non-GAAP Financial Measures - Reconciliations
Non-GAAP Financial Measures - Reconciliations 24
Source: SEC EDGAR · 425 filed Sep 7, 2011
More decks from Transatlantic Holdings Inc
 Q3 2012 Earnings Presentation10 slides · Nov 2, 2012
 Merger or Acquisition (December 2011)40 slides · Dec 1, 2011
 Merger or Acquisition (December 2011)39 slides · Dec 1, 2011
 Merger or Acquisition (November 2011)11 slides · Nov 29, 2011
 Merger or Acquisition (November 2011)28 slides · Nov 10, 2011
 Merger or Acquisition (November 2011)41 slides · Nov 4, 2011