Dun & Bradstreet Holdings Inc.
Dun & Bradstreet — Q2 2021 Earnings Presentation
15 slides from Dun & Bradstreet's earnings presentation, Aug 3, 2021

Slide 1: Second Quarter 2021 Financial Results
Dun & Bradstreet SECOND QUARTER 2021 FINANCIAL RESULTS August 3, 2021
Slide 2: Forward-looking statements
This presentation contains statements that are not purely historical are forward-looking statements, including statements regarding expectations, hopes, intentions or strategies regarding the future. Forward-looking statements are based on Dun & Bradstreet’s management’s beliefs, as well as assumpti
Slide 3: Financial Highlights (GAAP) Metrics Second Quarter 2021
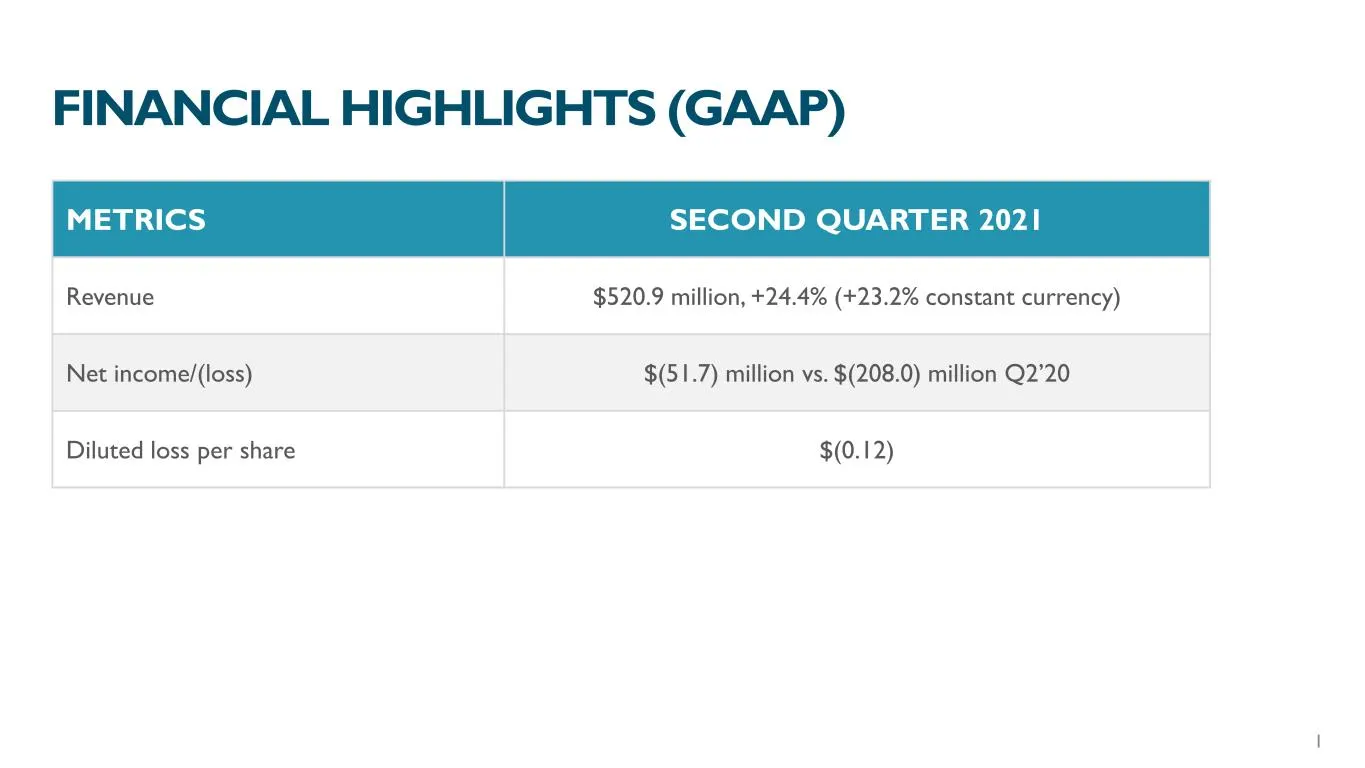
FINANCIAL HIGHLIGHTS (GAAP) METRICS SECOND QUARTER 2021 Revenue $520.9 million, +24.4% (+23.2% constant currency) Net income/(loss) $(51.7) million vs. $(208.0) million Q2’20 Diluted loss per share $(0.12) 1
Slide 4: Financial Highlights (Non-GAAP) Metrics Second Quarter 2021
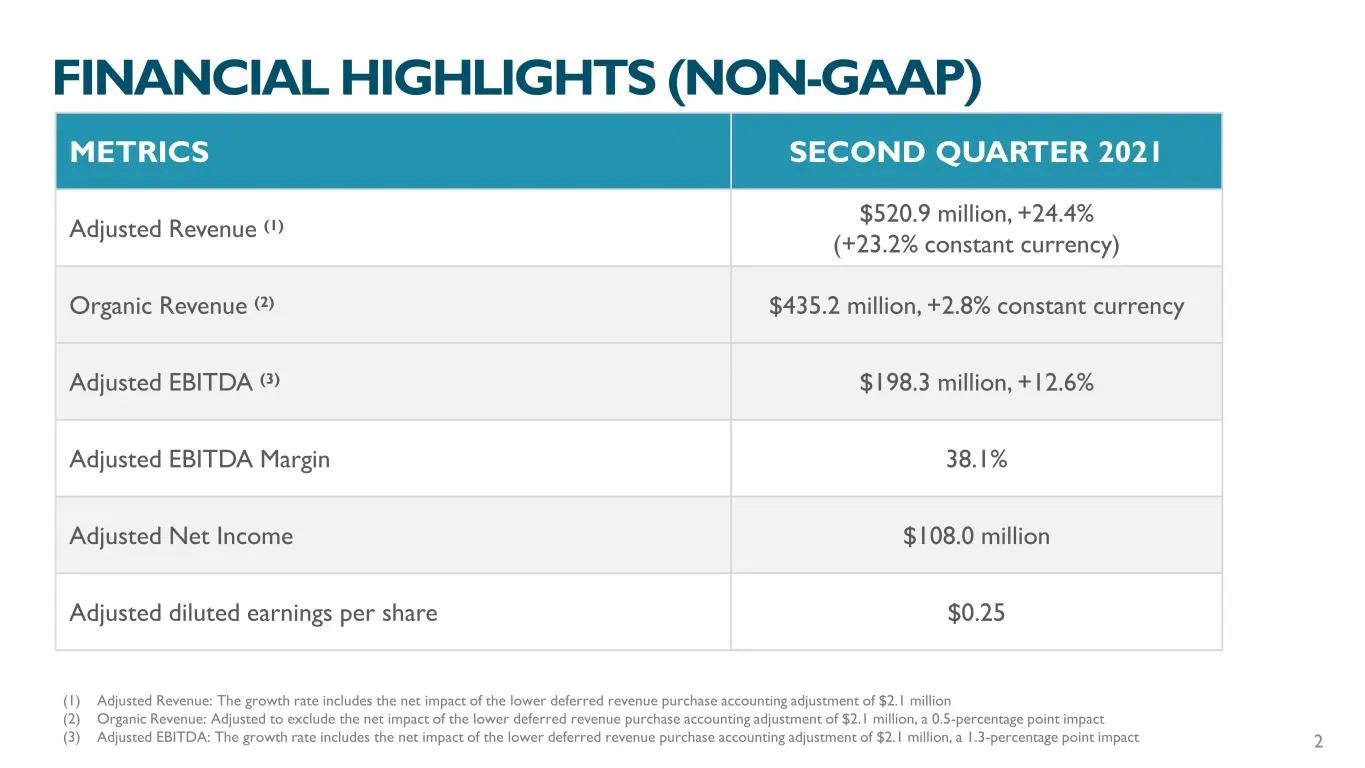
FINANCIAL HIGHLIGHTS (NON-GAAP) METRICS SECOND QUARTER 2021 Adjusted Revenue (1) $520.9 million, +24.4% (+23.2% constant currency) Organic Revenue (2) $435.2 million, +2.8% constant currency Adjusted EBITDA (3) $198.3 million, +12.6% Adjusted EBITDA Margin 38.1% Adjusted Net Income $108.0 million Ad
Slide 5: Second Quarter Highlights: North America
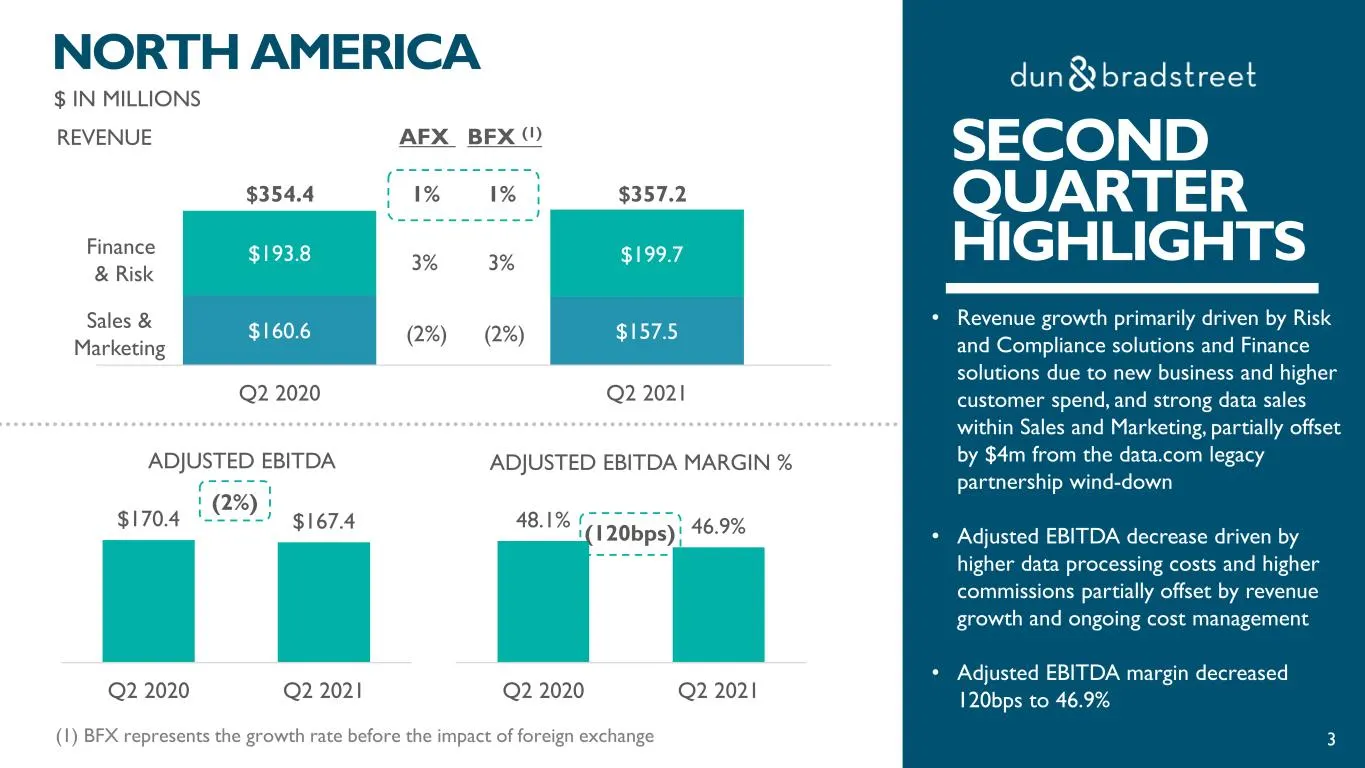
SECOND QUARTER HIGHLIGHTS • Revenue growth primarily driven by Risk and Compliance solutions and Finance solutions due to new business and higher customer spend, and strong data sales within Sales and Marketing, partially offset by $4m from the data.com legacy partnership wind-down • Adjusted EBITDA
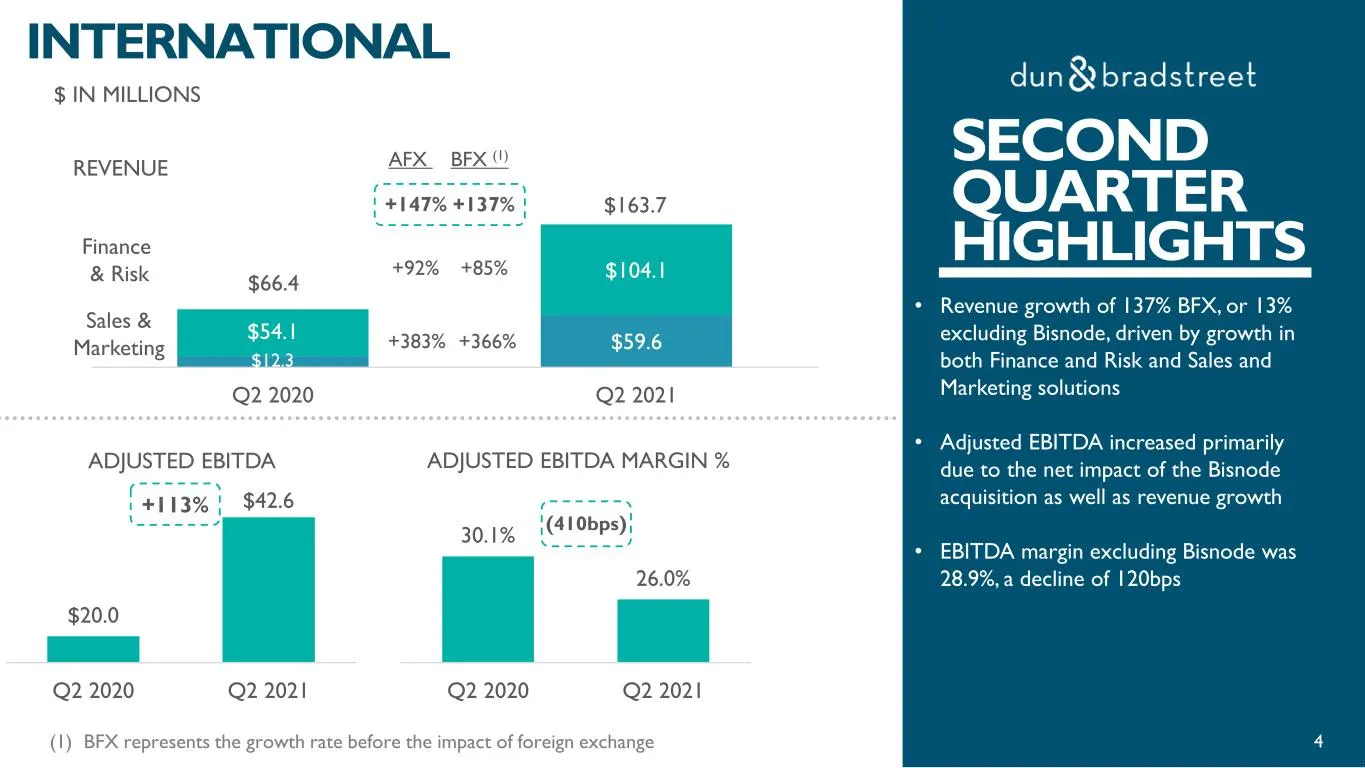
Slide 6: Second Quarter Highlights: International
30.1% 26.0% Q2 2020 Q2 2021 FOURTH QUARTER HIGHLIGHTS • Revenue growth of 137% BFX, or 13% excluding Bisnode, driven by growth in both Finance and Risk and Sales and Marketing solutions • Adjusted EBITDA increased primarily due to the net impact of the Bisnode acquisition as well as revenue growth •
Slide 7: Debt Summary
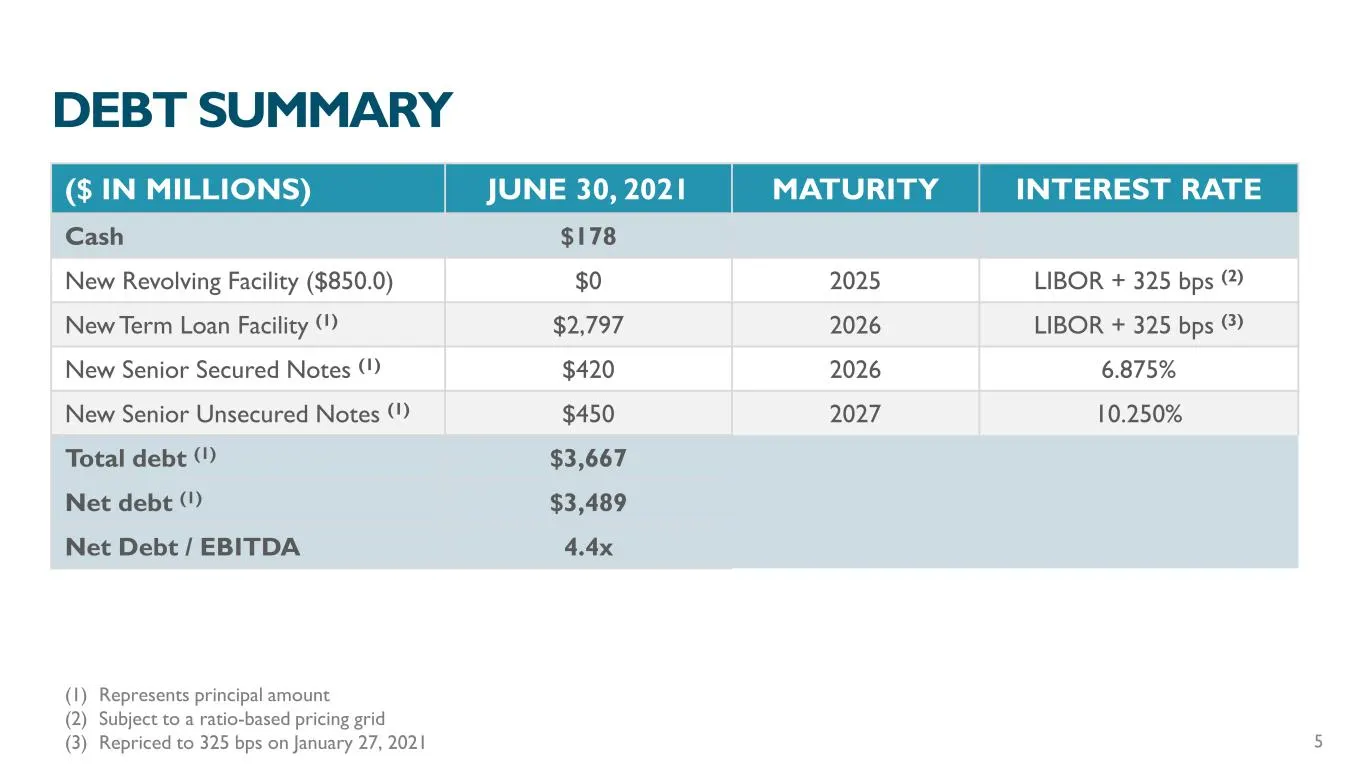
($ IN MILLIONS) JUNE 30, 2021 MATURITY INTEREST RATE Cash $178 New Revolving Facility ($850.0) $0 2025 LIBOR + 325 bps (2) New Term Loan Facility (1) $2,797 2026 LIBOR + 325 bps (3) New Senior Secured Notes (1) $420 2026 6.875% New Senior Unsecured Notes (1) $450 2027 10.250% Total debt (1) $3,667 N
Slide 8: Full Year 2021 Financial Guidance
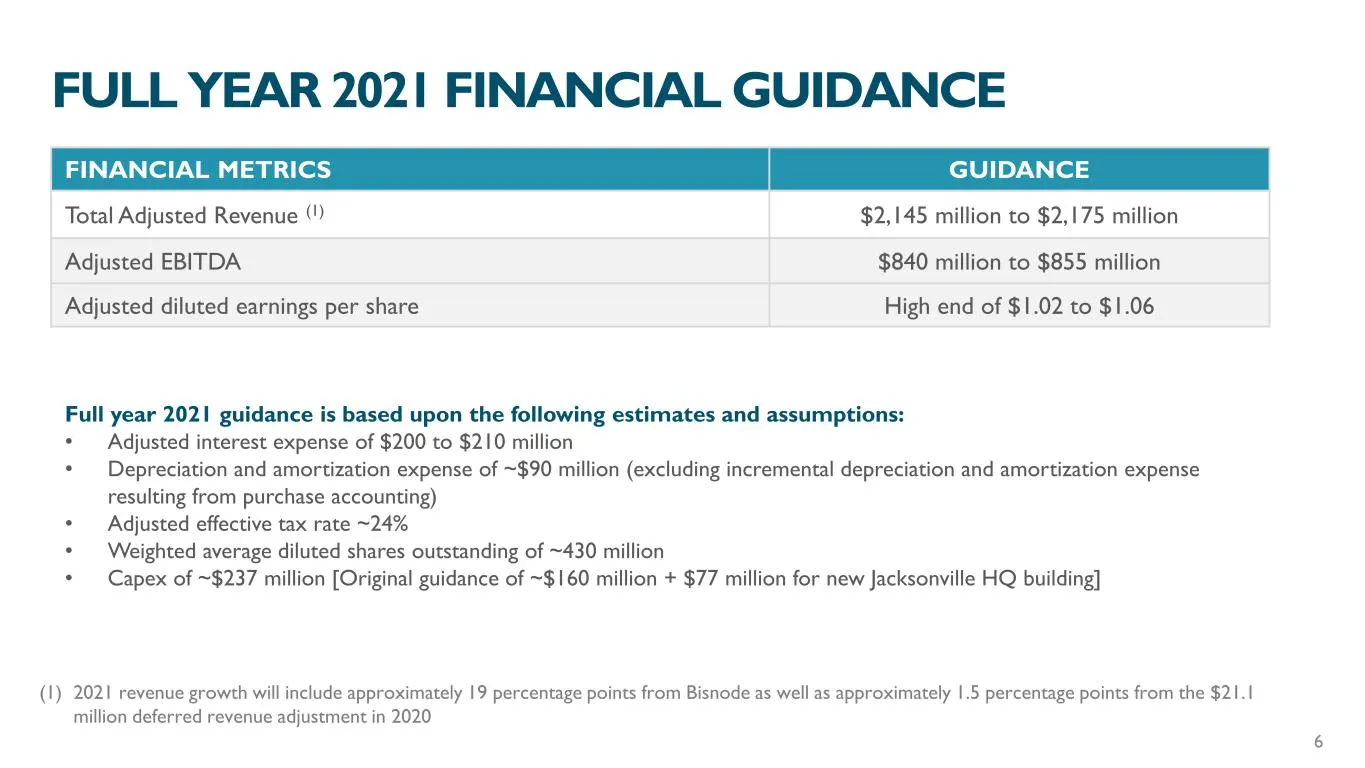
FINANCIAL METRICS GUIDANCE Total Adjusted Revenue (1) $2,145 million to $2,175 million Adjusted EBITDA $840 million to $855 million Adjusted diluted earnings per share High end of $1.02 to $1.06 Full year 2021 guidance is based upon the following estimates and assumptions: • Adjusted interest expens

Slide 9: Appendix
dun &bradstreet APPENDIX .— ..
Slide 10: Organic Revenue Growth Walk
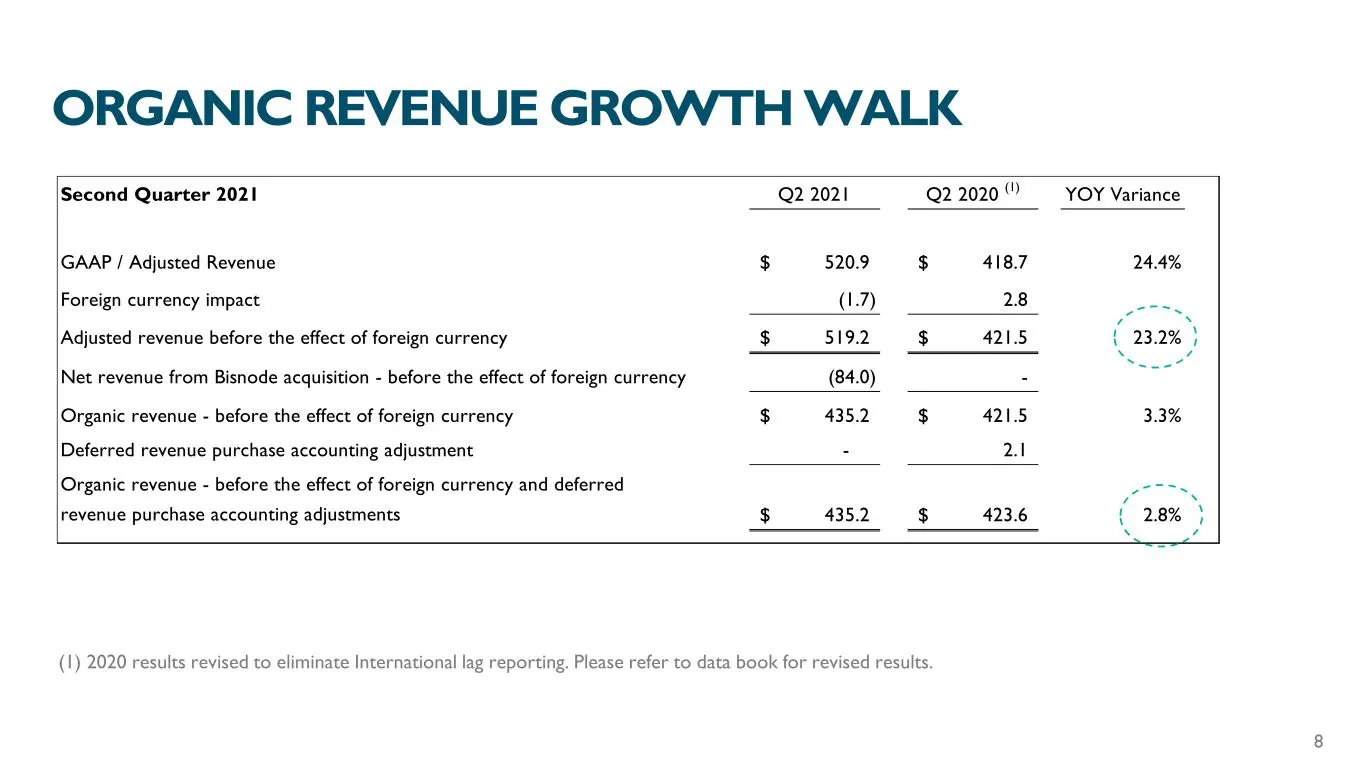
Second Quarter 2021 Q2 2021 Q2 2020 (1) YOY Variance GAAP / Adjusted Revenue 520.9$ 418.7$ 24.4% Foreign currency impact (1.7) 2.8 Adjusted revenue before the effect of foreign currency 519.2$ 421.5$ 23.2% Net revenue from Bisnode acquisition - before the effect of foreign currency (84.0) - Organic
Slide 11: Non-GAAP financial measures
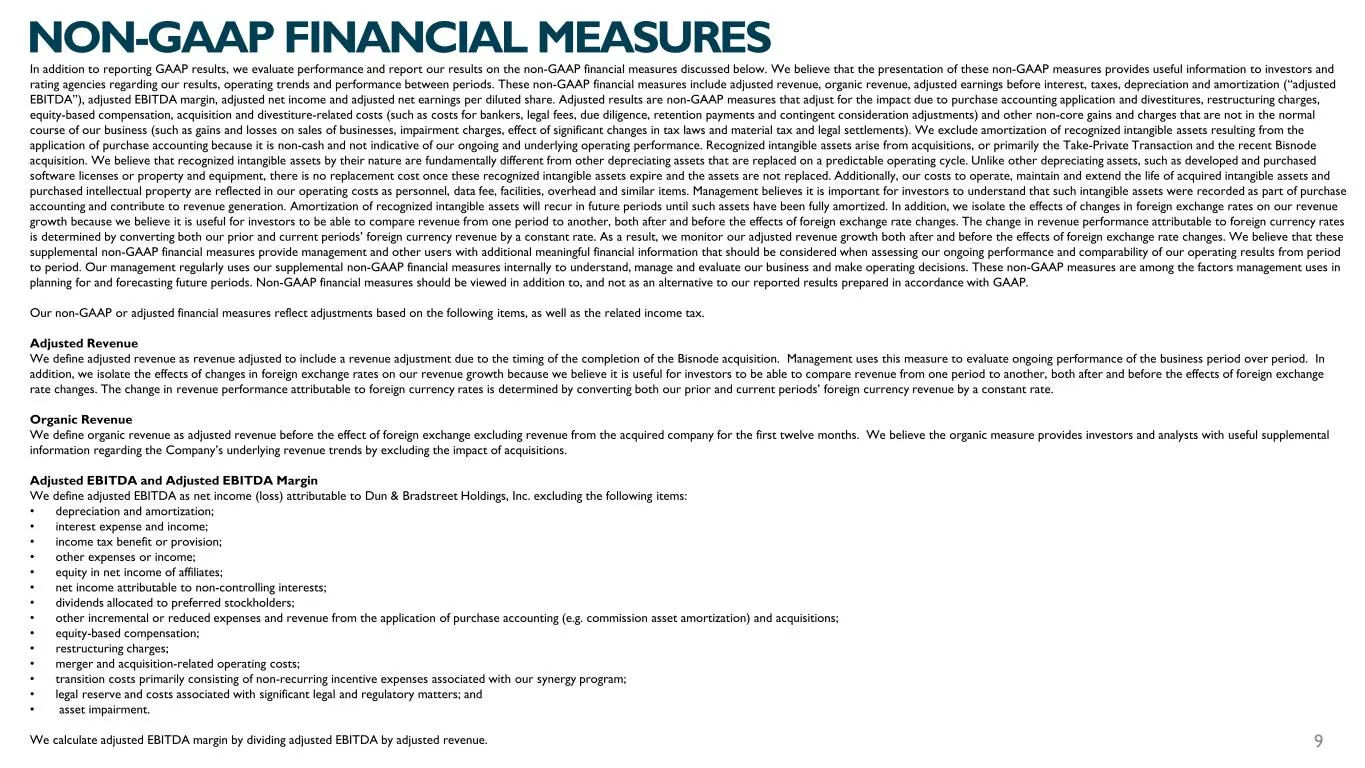
In addition to reporting GAAP results, we evaluate performance and report our results on the non-GAAP financial measures discussed below. We believe that the presentation of these non-GAAP measures provides useful information to investors and rating agencies regarding our results, operating trends a
Slide 12: Adjusted Net Income definition
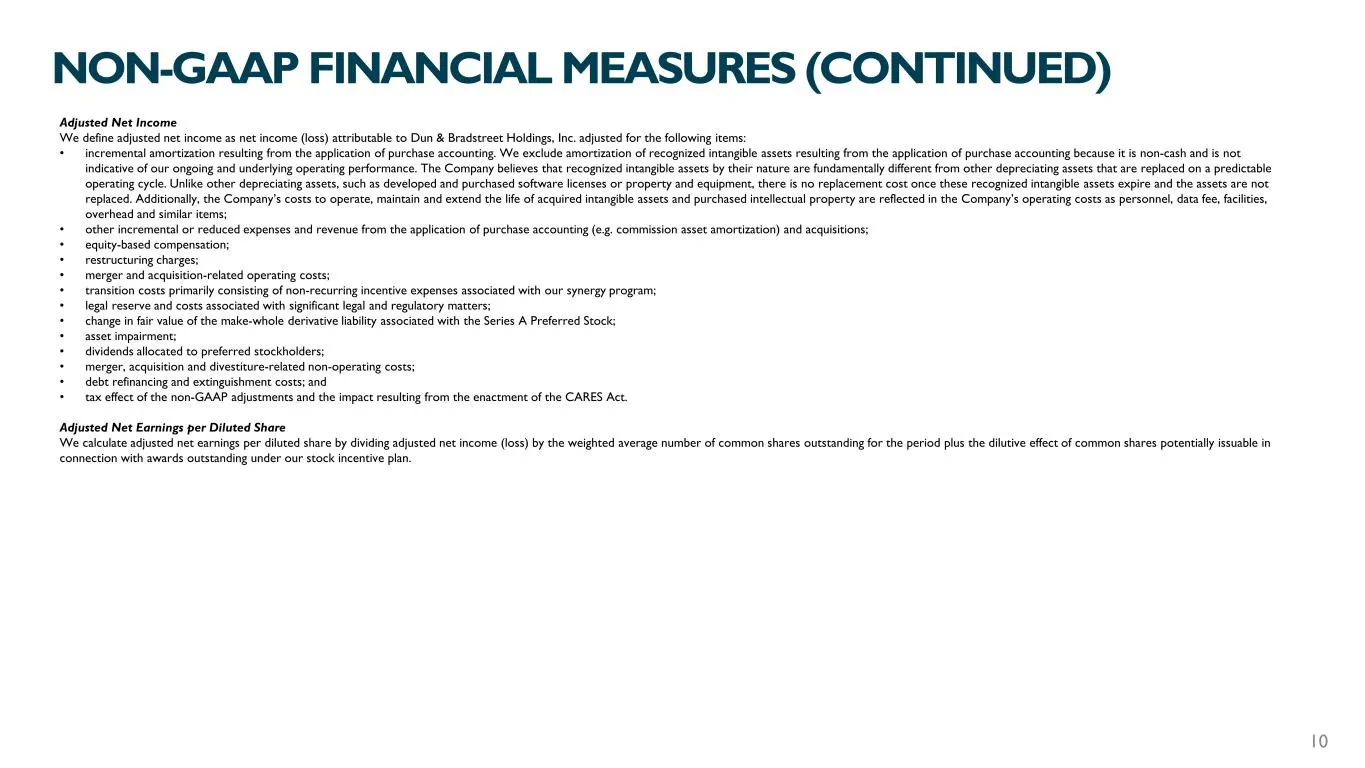
Adjusted Net Income We define adjusted net income as net income (loss) attributable to Dun & Bradstreet Holdings, Inc. adjusted for the following items: • incremental amortization resulting from the application of purchase accounting. We exclude amortization of recognized intangible assets resulting
Slide 13: Non-GAAP Reconciliation: Adjusted Revenue
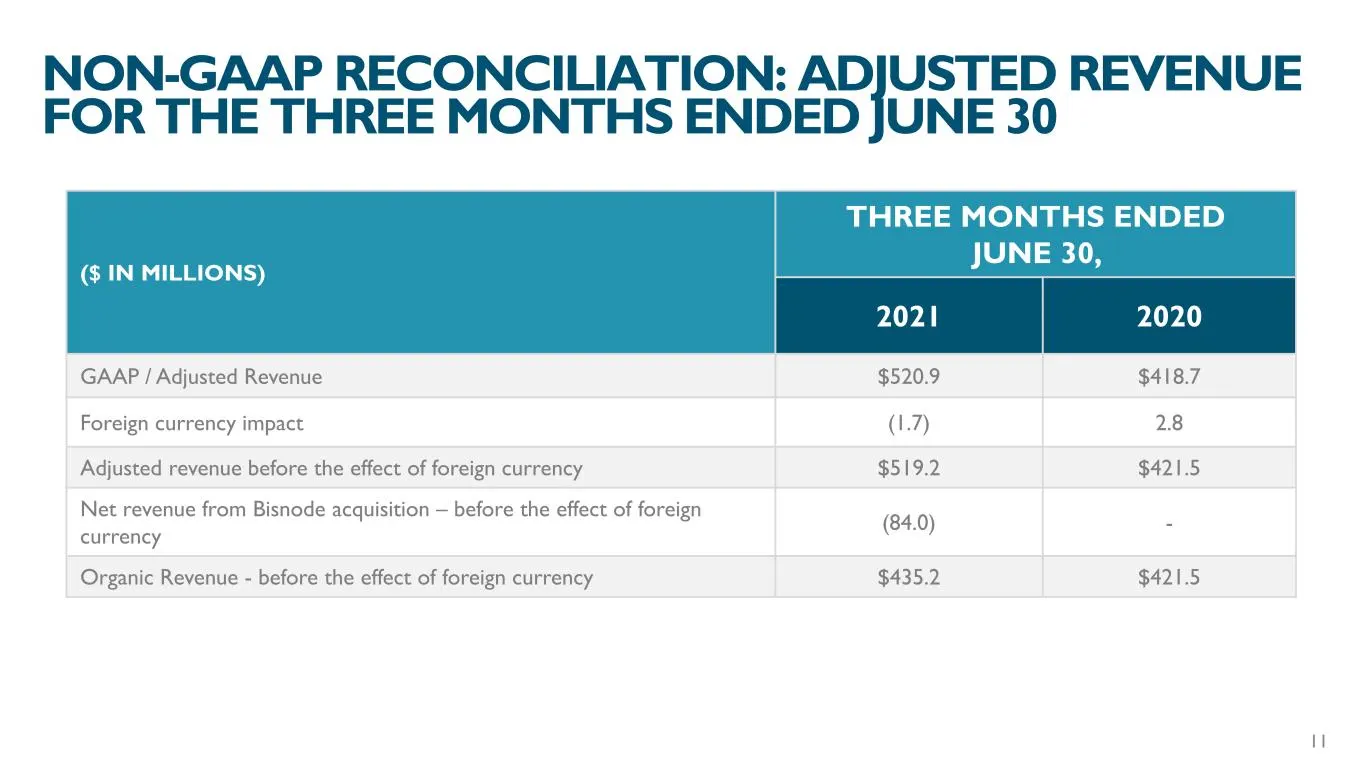
($ IN MILLIONS) THREE MONTHS ENDED JUNE 30, 2021 2020 GAAP / Adjusted Revenue $520.9 $418.7 Foreign currency impact (1.7) 2.8 Adjusted revenue before the effect of foreign currency $519.2 $421.5 Net revenue from Bisnode acquisition – before the effect of foreign currency (84.0) - Organic Revenue - b
Slide 14: Non-GAAP Reconciliation: Adjusted EBITDA
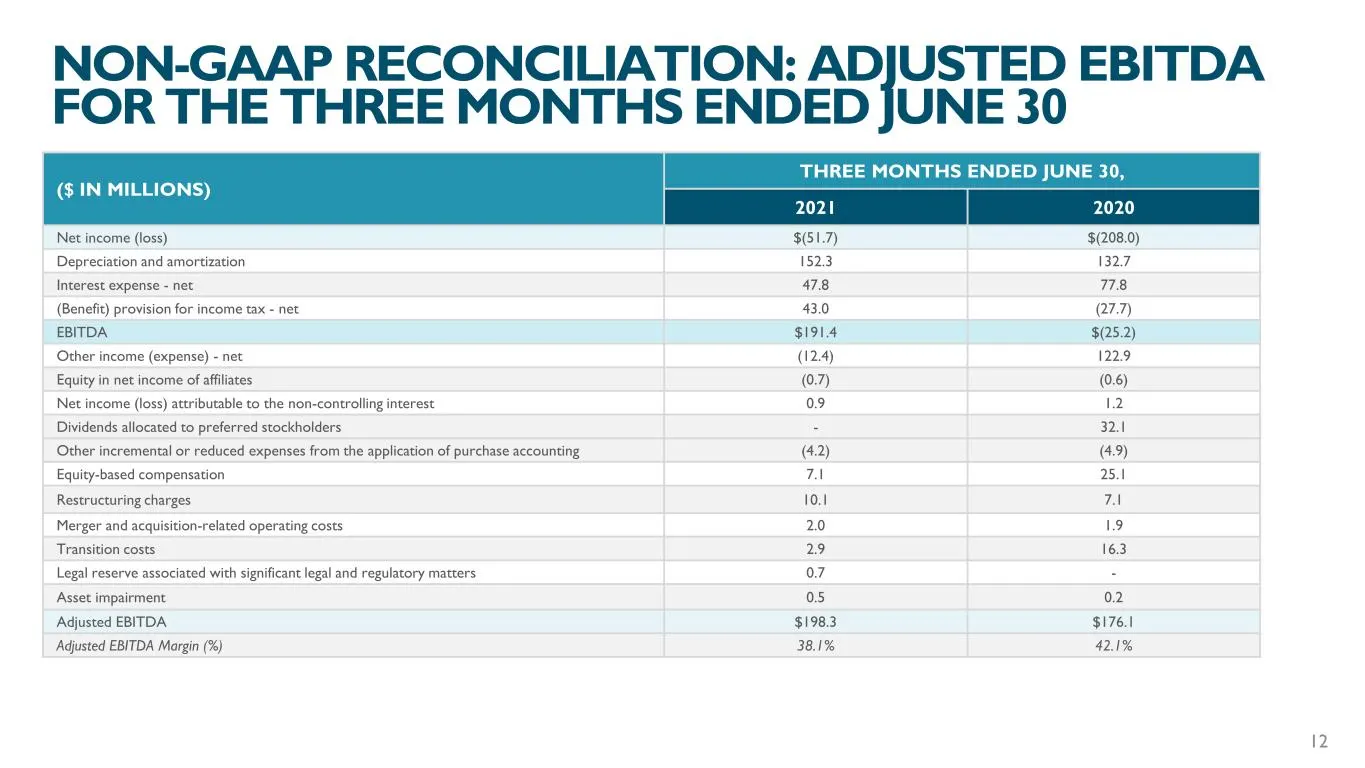
($ IN MILLIONS) THREE MONTHS ENDED JUNE 30, 2021 2020 Net income (loss) $(51.7) $(208.0) Depreciation and amortization 152.3 132.7 Interest expense - net 47.8 77.8 (Benefit) provision for income tax - net 43.0 (27.7) EBITDA $191.4 $(25.2) Other income (expense) - net (12.4) 122.9 Equity in net incom
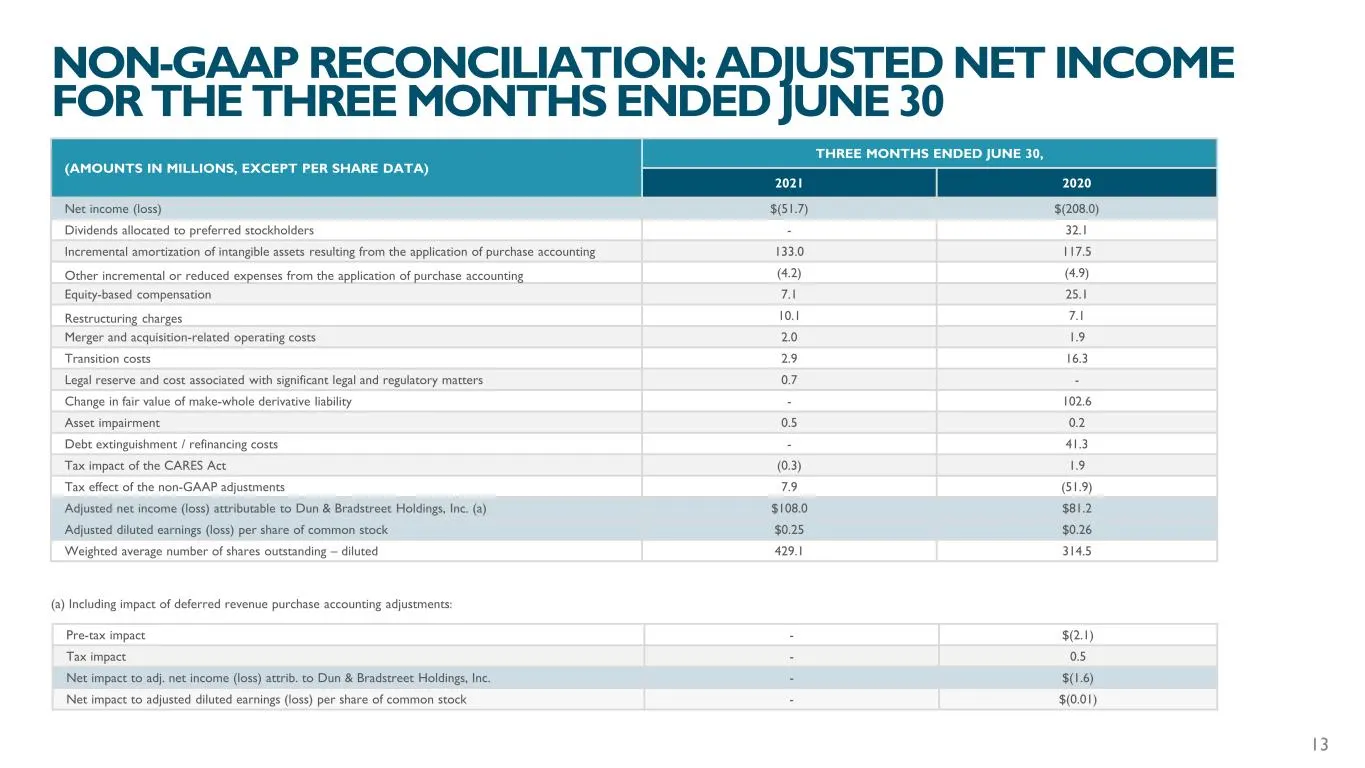
Slide 15: Non-GAAP Reconciliation: Adjusted Net Income
(AMOUNTS IN MILLIONS, EXCEPT PER SHARE DATA) THREE MONTHS ENDED JUNE 30, 2021 2020 Net income (loss) $(51.7) $(208.0) Dividends allocated to preferred stockholders - 32.1 Incremental amortization of intangible assets resulting from the application of purchase accounting 133.0 117.5 Other incremental
Source: SEC EDGAR · 8-K filed Aug 3, 2021
More decks from Dun & Bradstreet Holdings Inc.
 Q1 2025 Earnings Presentation12 slides · May 1, 2025
 Q4 2024 Earnings Presentation15 slides · Feb 20, 2025
 Q3 2024 Earnings Presentation13 slides · Oct 31, 2024
 Q2 2024 Earnings Presentation13 slides · Aug 1, 2024
 Q1 2024 Earnings Presentation13 slides · May 2, 2024
 FY2023 Earnings Presentation16 slides · Feb 15, 2024