CenterState Bank — Investor Presentation (February 2018)
29 slides from CenterState Bank's investor presentation, Feb 8, 2018
Slide 1: 4th Quarter 2017 Investor Presentation
4th Quarter 2017 Investor Presentation Exhibit 99.1
Slide 2: Forward Looking Statement
Forward Looking Statement This presentation contains forward-looking statements, within the meaning of the Securities Act of 1933 and the Securities Exchange Act of 1934. These statements related to future events, other future financial and operating performance, costs, revenues, economic conditions
Slide 3: Overview of Franchise
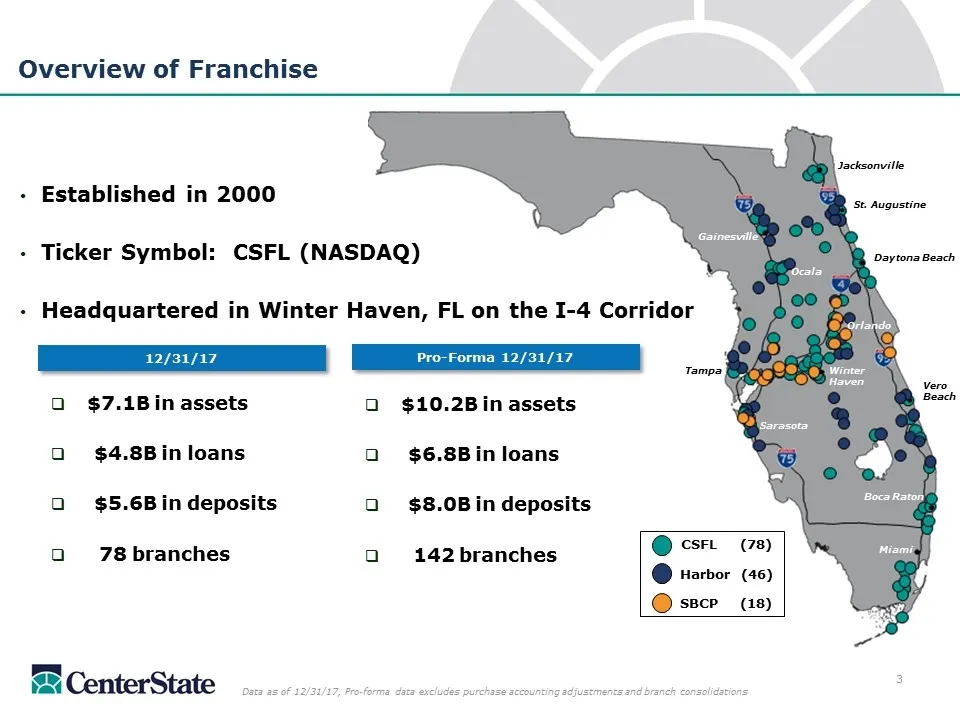
Overview of Franchise Established in 2000 Ticker Symbol: CSFL (NASDAQ) Headquartered in Winter Haven, FL on the I-4 Corridor Data as of 12/31/17, Pro-forma data excludes purchase accounting adjustments and branch consolidations Tampa Jacksonville Winter Haven Miami Ocala Gainesville Sarasota Daytona
Slide 4: Stock Price Performance Over 1, 3 & 5 Year Periods
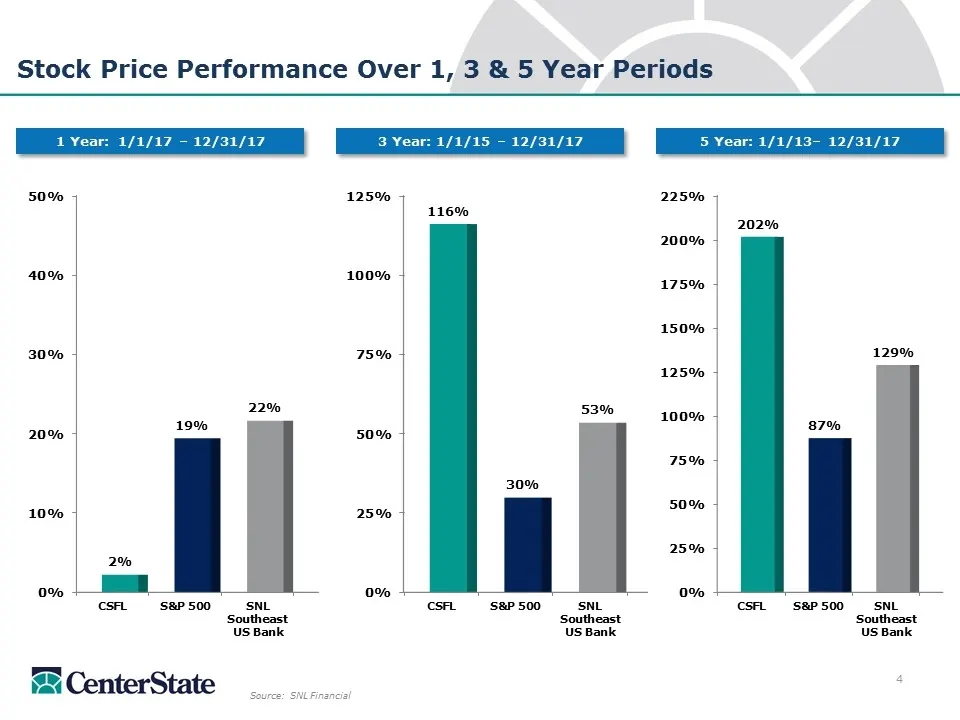
Stock Price Performance Over 1, 3 & 5 Year Periods Source: SNL Financial 1 Year: 1/1/17 – 12/31/17 3 Year: 1/1/15 – 12/31/17 5 Year: 1/1/13– 12/31/17
Slide 5: Banking the Sunshine State
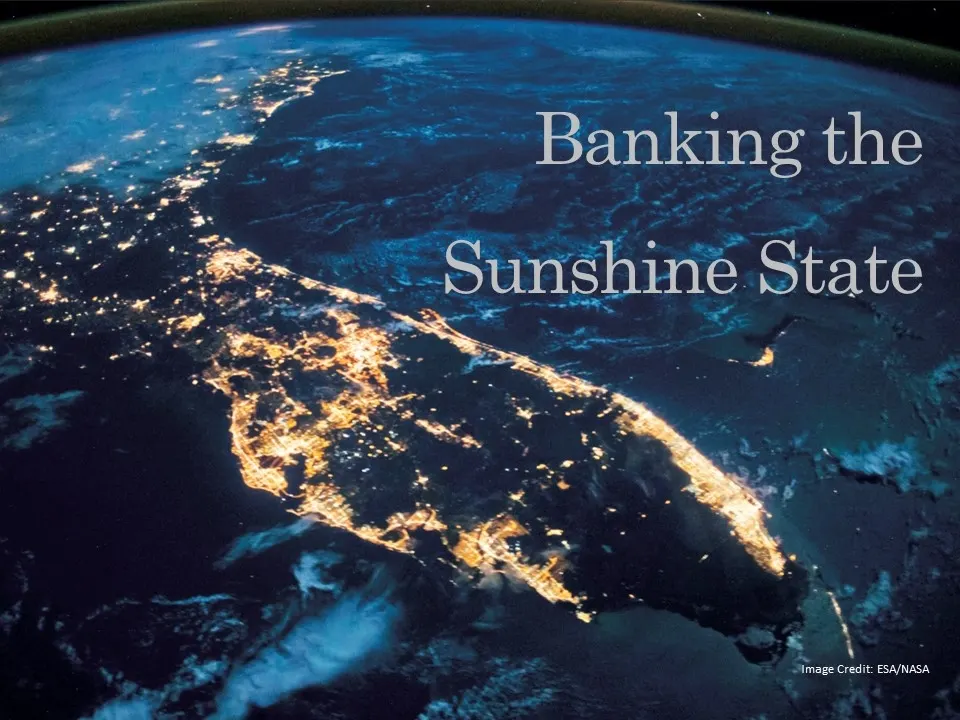
Banking the Sunshine State Image Credit: ESA/NASA
Slide 6: Why Invest in Florida?
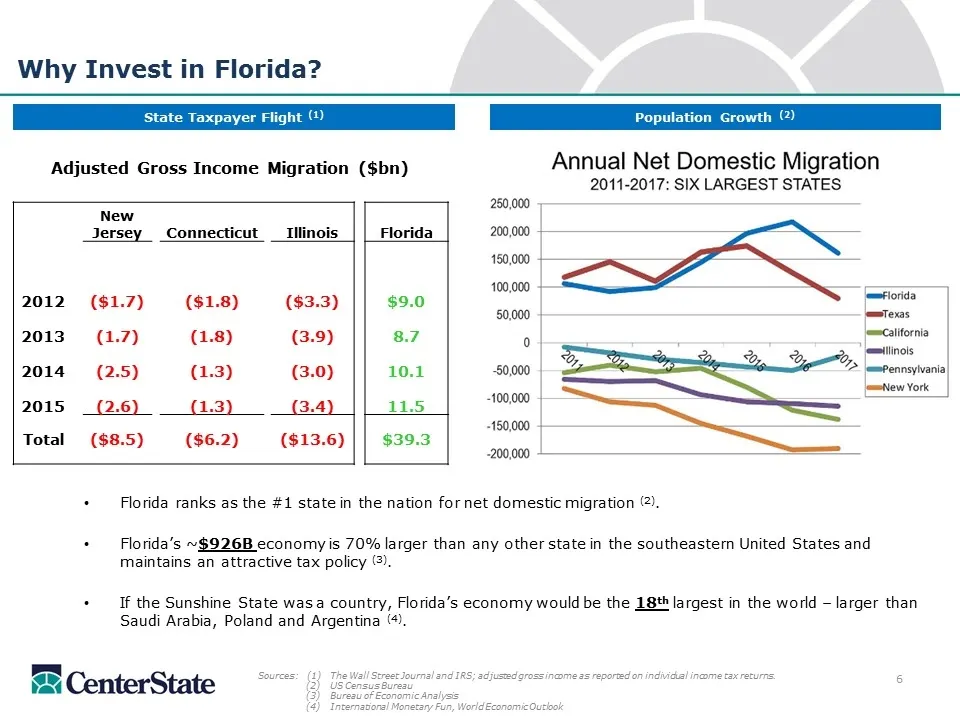
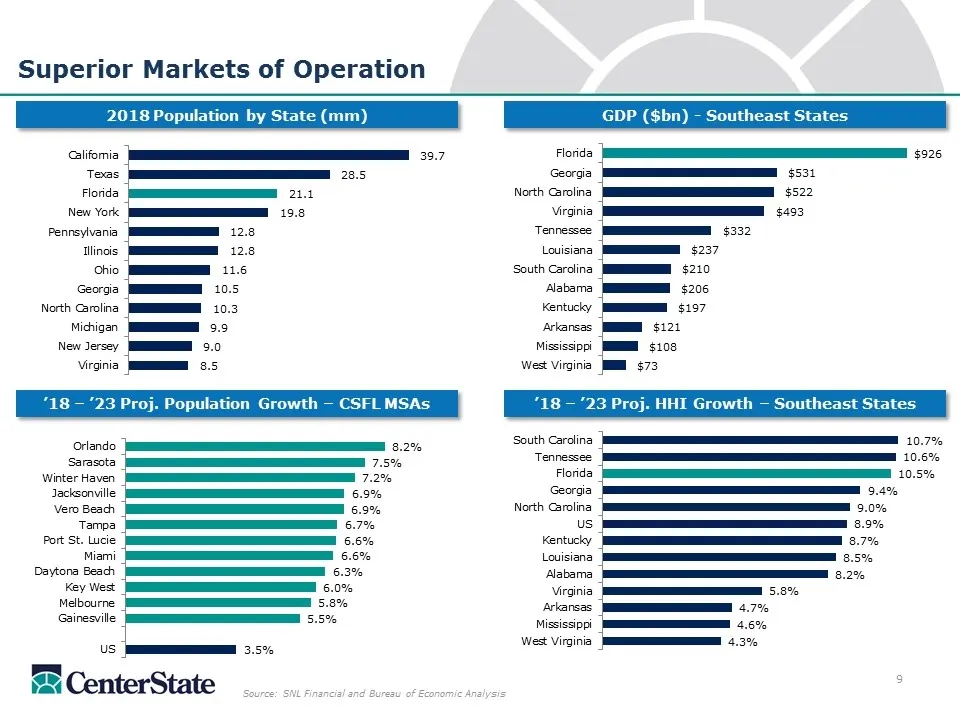
Florida ranks as the #1 state in the nation for net domestic migration (2). Florida’s ~$926B economy is 70% larger than any other state in the southeastern United States and maintains an attractive tax policy (3). If the Sunshine State was a country, Florida’s economy would be the 18th largest in th
Slide 7: Tourism is on the Rise
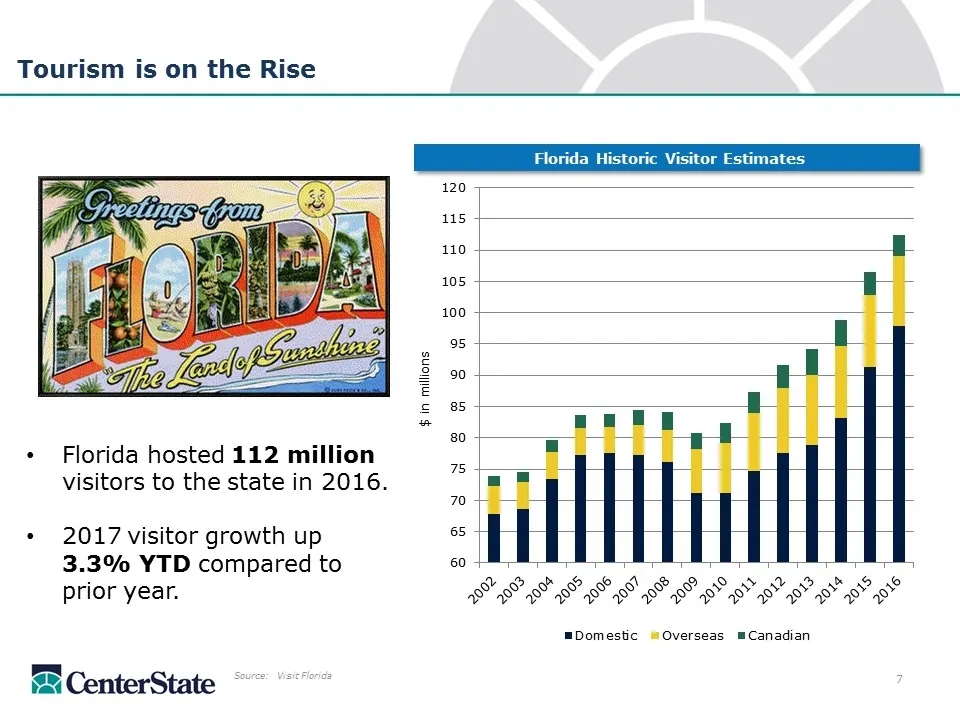
Florida hosted 112 million visitors to the state in 2016. 2017 visitor growth up 3.3% YTD compared to prior year. Tourism is on the Rise Source: Visit Florida Florida Historic Visitor Estimates
Slide 8: Single Family Housing is a Tailwind
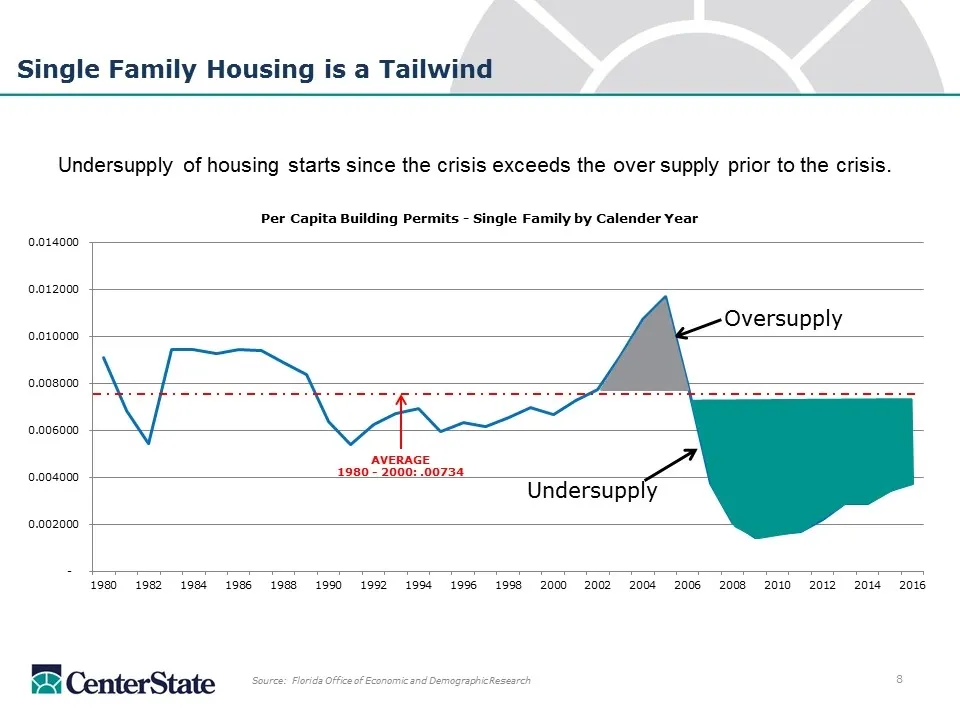
AVERAGE 1980 - 2000: .00734 Single Family Housing is a Tailwind Undersupply of housing starts since the crisis exceeds the over supply prior to the crisis. Source: Florida Office of Economic and Demographic Research Oversupply Undersupply
Slide 9: Superior Markets of Operation
Source: SNL Financial and Bureau of Economic Analysis Superior Markets of Operation 2018 Population by State (mm) GDP ($bn) - Southeast States ’18 – ’23 Proj. HHI Growth – Southeast States ’18 – ’23 Proj. Population Growth – CSFL MSAs
Slide 10: Capital Management
Capital Management
Slide 11: CSFL – Best Positioned Florida Consolidator
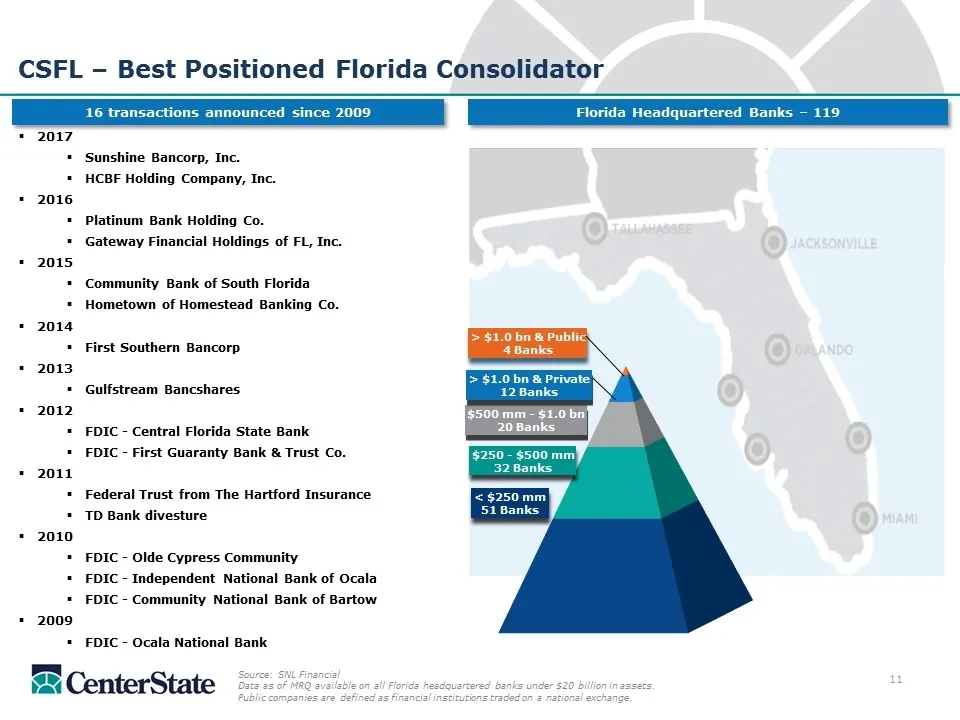
CSFL – Best Positioned Florida Consolidator Source: SNL Financial Data as of MRQ available on all Florida headquartered banks under $20 billion in assets. Public companies are defined as financial institutions traded on a national exchange. 2017 Sunshine Bancorp, Inc. HCBF Holding Company, Inc. 2016
Slide 12: Combined Transactions: Financials and Pricing Multiples
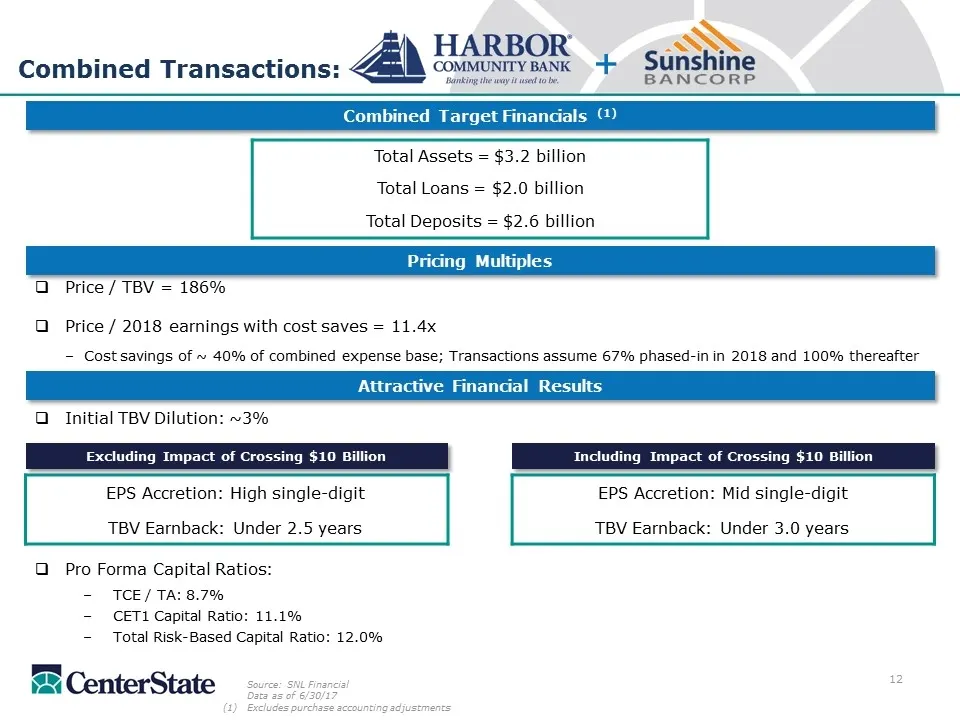
Combined Transactions: Total Assets = $3.2 billion Total Loans = $2.0 billion Total Deposits = $2.6 billion Combined Target Financials (1) + Pricing Multiples Source: SNL Financial Data as of 6/30/17 Excludes purchase accounting adjustments Price / TBV = 186% Price / 2018 earnings with cost saves =
Slide 13: Pro Forma Consolidation Opportunities
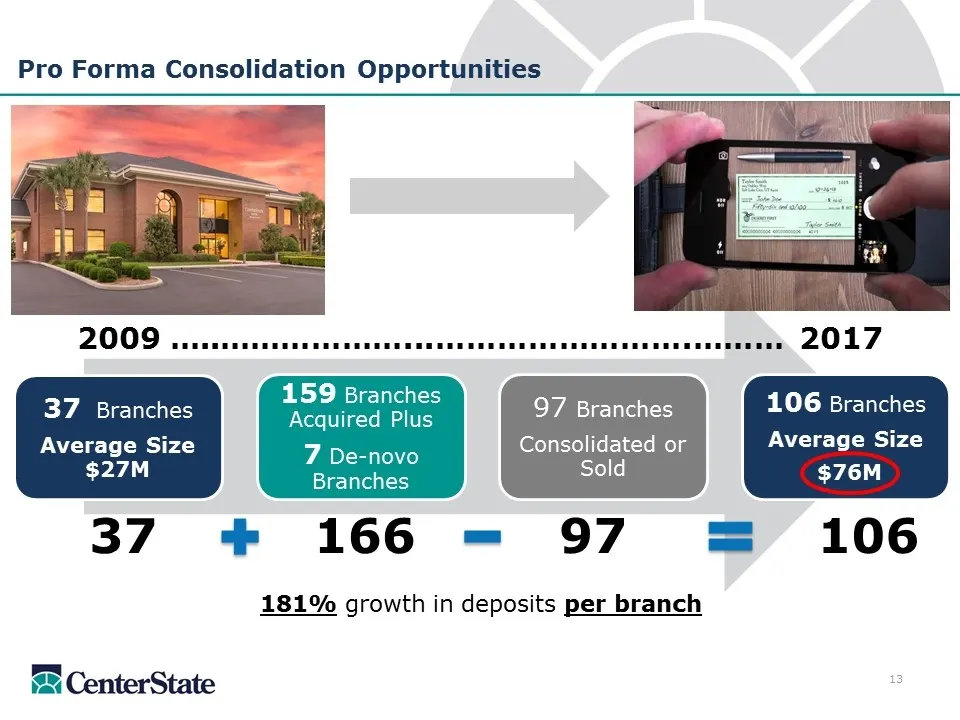
Pro Forma Consolidation Opportunities 181% growth in deposits per branch 37 166 97 106 2009 …..………………...…………………….……… 2017 37 Branches Average Size $27M 159 Branches Acquired Plus 7 De-novo Branches 97 Branches Consolidated or Sold 106 Branches Average Size $76M
Slide 14: Deposit Market Share in Key Markets
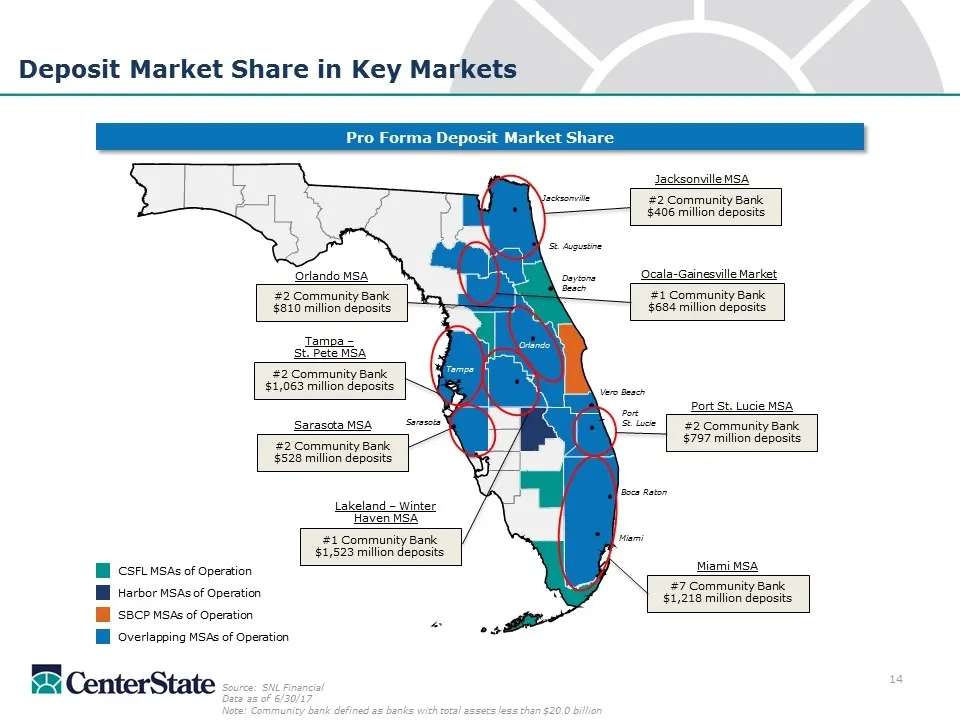
CSFL MSAs of Operation Harbor MSAs of Operation SBCP MSAs of Operation Overlapping MSAs of Operation #7 Community Bank $1,218 million deposits #2 Community Bank $797 million deposits #1 Community Bank $684 million deposits #1 Community Bank $1,523 million deposits #2 Community Bank $528 million depo
Slide 15: Operating Performance
Operating Performance
Slide 16: TBVPS and Adjusted EPS: Historical and Consensus Forecast
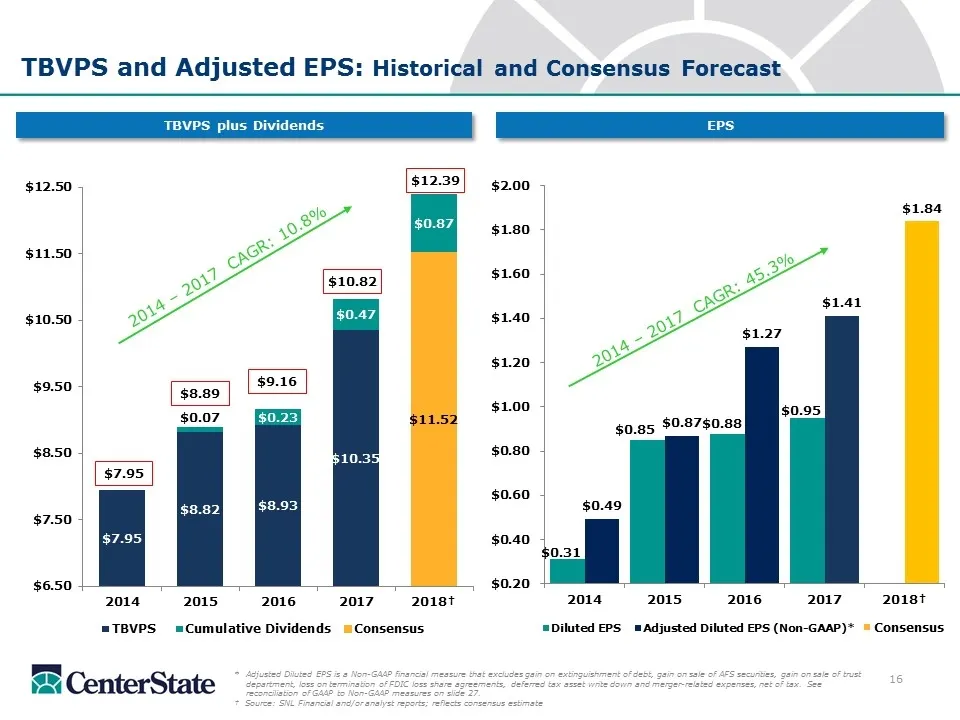
TBVPS and Adjusted EPS: Historical and Consensus Forecast *Adjusted Diluted EPS is a Non-GAAP financial measure that excludes gain on extinguishment of debt, gain on sale of AFS securities, gain on sale of trust department, loss on termination of FDIC loss share agreements, deferred tax asset write
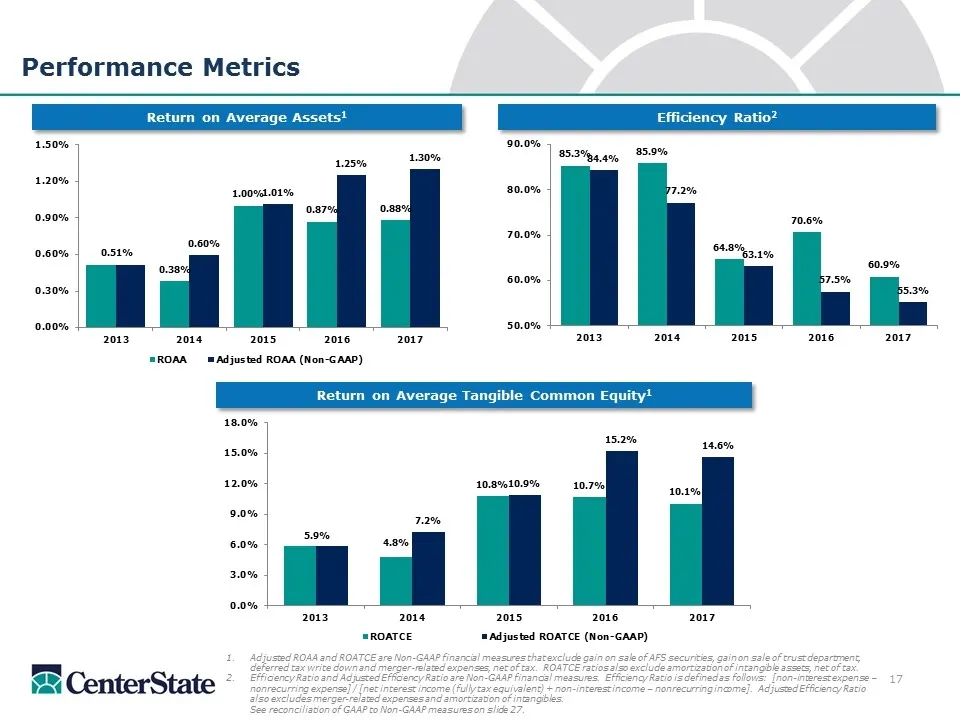
Slide 17: Performance Metrics: ROAA, ROATCE and Efficiency Ratio
Efficiency Ratio2 Performance Metrics Adjusted ROAA and ROATCE are Non-GAAP financial measures that exclude gain on sale of AFS securities, gain on sale of trust department, deferred tax write down and merger-related expenses, net of tax. ROATCE ratios also exclude amortization of intangible assets,
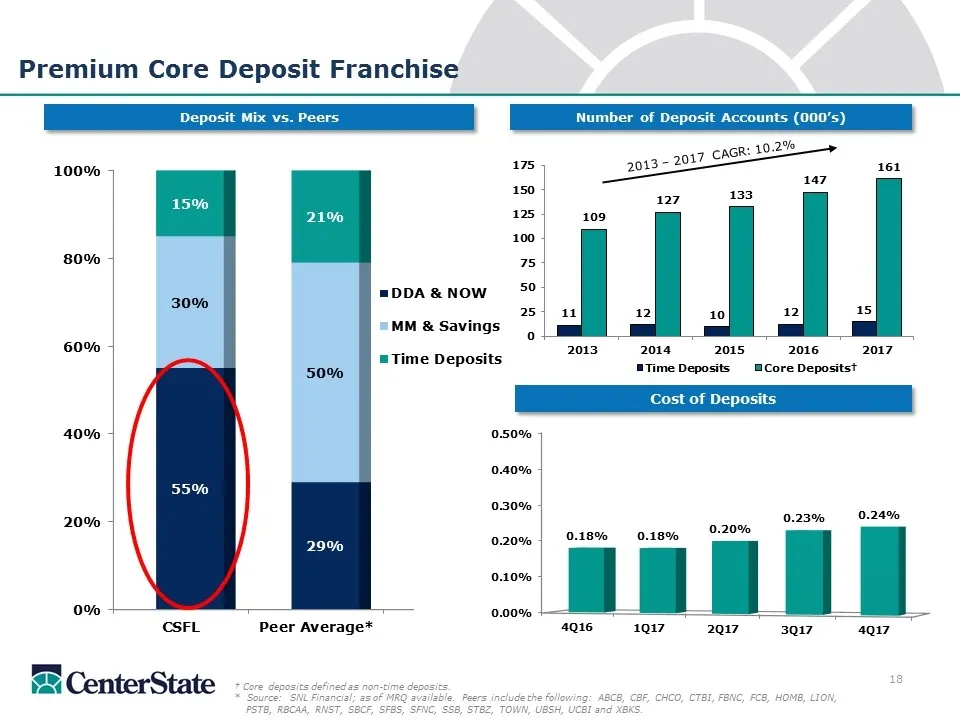
Slide 18: Premium Core Deposit Franchise
Number of Deposit Accounts (000’s) Premium Core Deposit Franchise Cost of Deposits 2013 – 2017 CAGR: 10.2% Deposit Mix vs. Peers † Core deposits defined as non-time deposits. * Source: SNL Financial; as of MRQ available. Peers include the following: ABCB, CBF, CHCO, CTBI, FBNC, FCB, HOMB, LION, PSTB
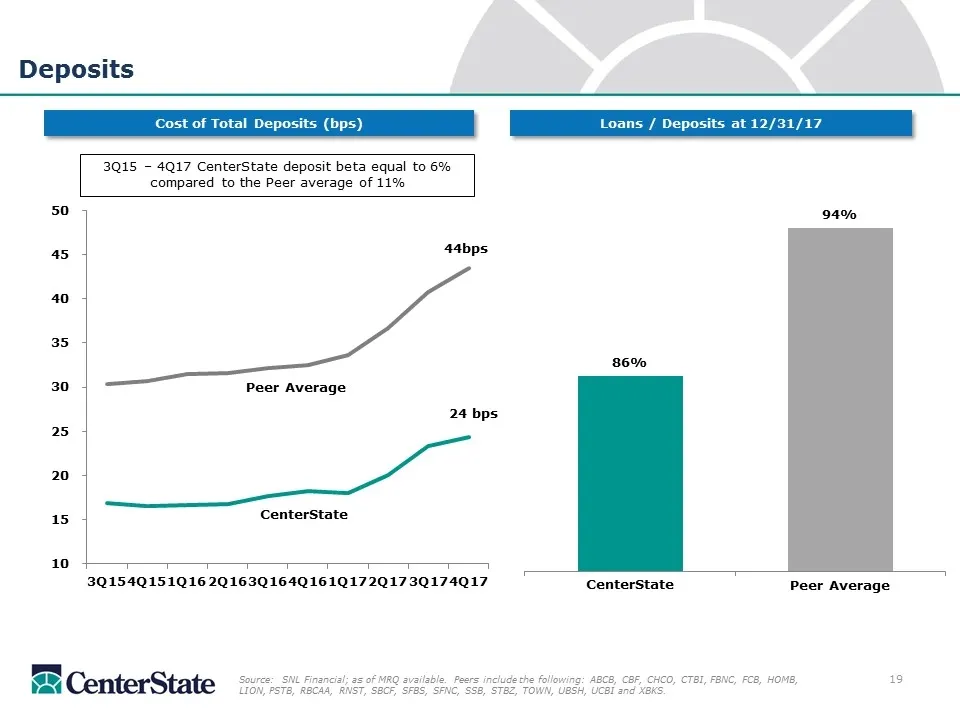
Slide 19: Deposits: Cost of Total Deposits vs Peers
Deposits Loans / Deposits at 12/31/17 Cost of Total Deposits (bps) Peer Average CenterState 44bps 24 bps 3Q15 – 4Q17 CenterState deposit beta equal to 6% compared to the Peer average of 11% CenterState Peer Average Source: SNL Financial; as of MRQ available. Peers include the following: ABCB, CBF, C
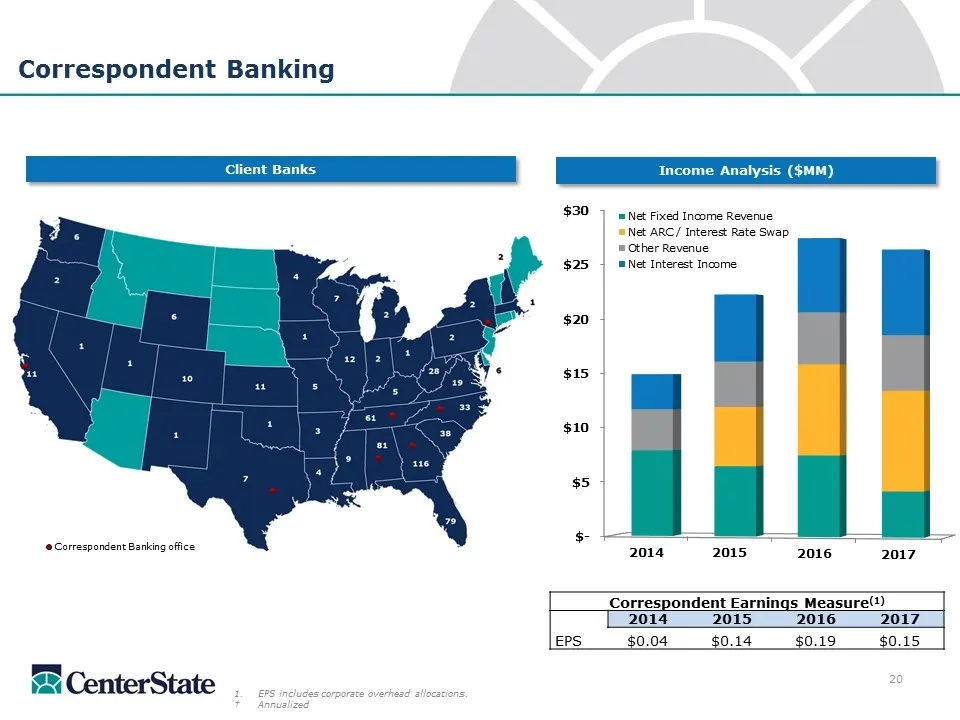
Slide 20: Correspondent Banking Income Analysis
EPS includes corporate overhead allocations. †Annualized Correspondent Banking Income Analysis ($MM) Client Banks Correspondent Banking office Correspondent Earnings Measure(1) 2014 2015 2016 2017 EPS $0.04 $0.14 $0.19 $0.15
Slide 21: Investment Thesis
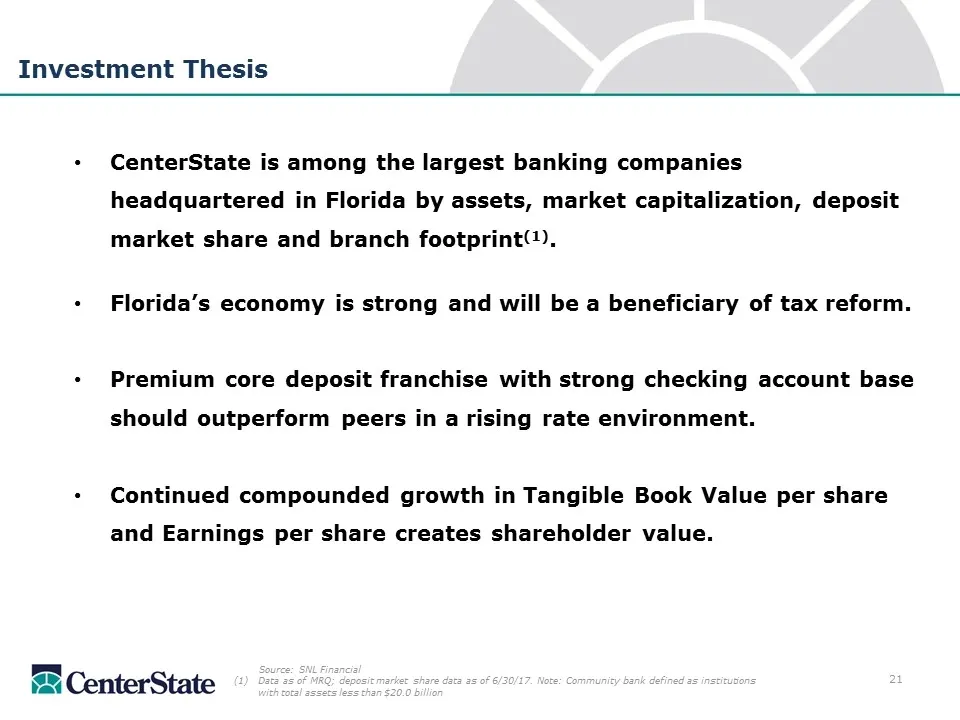
Investment Thesis CenterState is among the largest banking companies headquartered in Florida by assets, market capitalization, deposit market share and branch footprint(1). Florida’s economy is strong and will be a beneficiary of tax reform. Premium core deposit franchise with strong checking accou

Slide 22: Supplemental
Supplemental
Slide 23: Total Loan Portfolio as of December 31, 2017
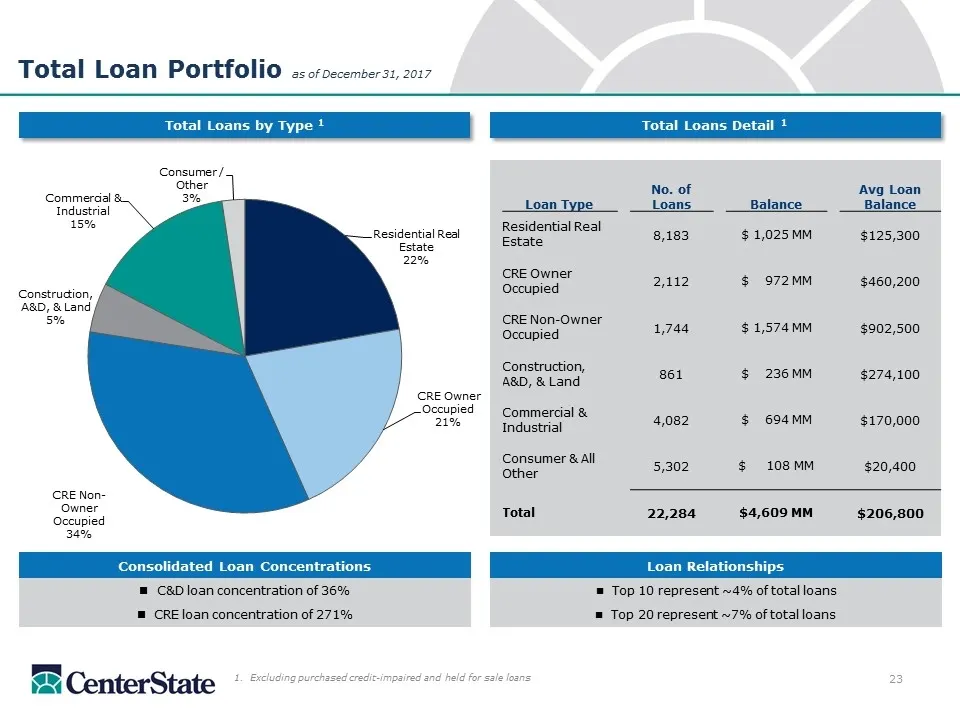
Loan Type No. of Loans Balance Avg Loan Balance Residential Real Estate 8,183 $ 1,025 MM $125,300 CRE Owner Occupied 2,112 $ 972 MM $460,200 CRE Non-Owner Occupied 1,744 $ 1,574 MM $902,500 Construction, A&D, & Land 861 $ 236 MM $274,100 Commercial & Industrial 4,082 $ 694 MM $170,000 Consumer & All
Slide 24: Loan Yields and Asset Quality
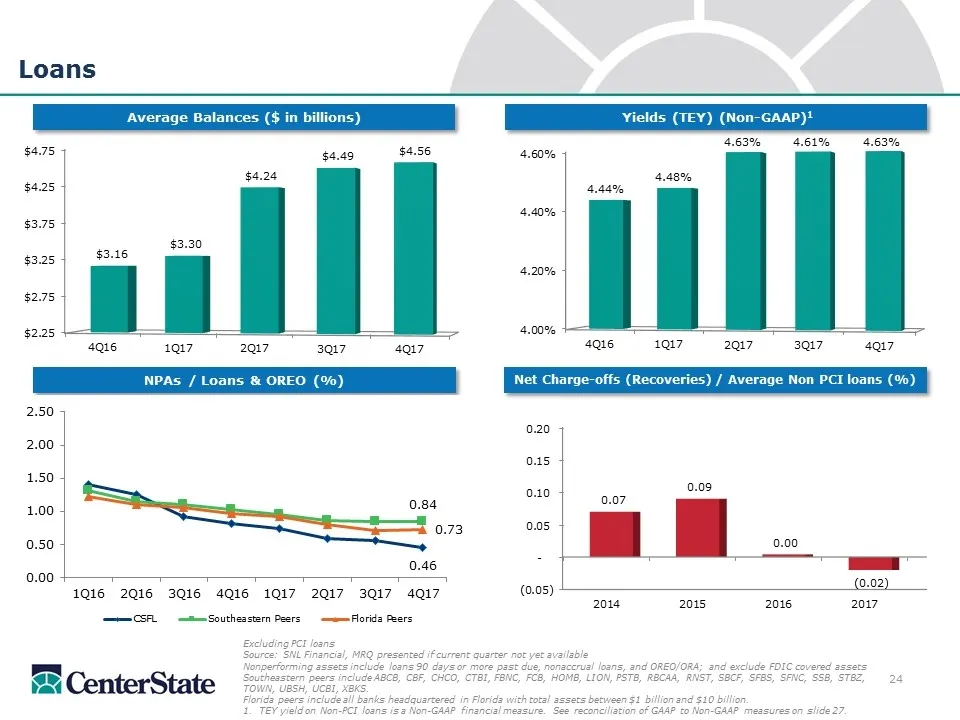
Loans Yields (TEY) (Non-GAAP)1 Average Balances ($ in billions) Excluding PCI loans Source: SNL Financial, MRQ presented if current quarter not yet available Nonperforming assets include loans 90 days or more past due, nonaccrual loans, and OREO/ORA; and exclude FDIC covered assets Southeastern peer
Slide 25: Total Deposit Portfolio as of December 31, 2017
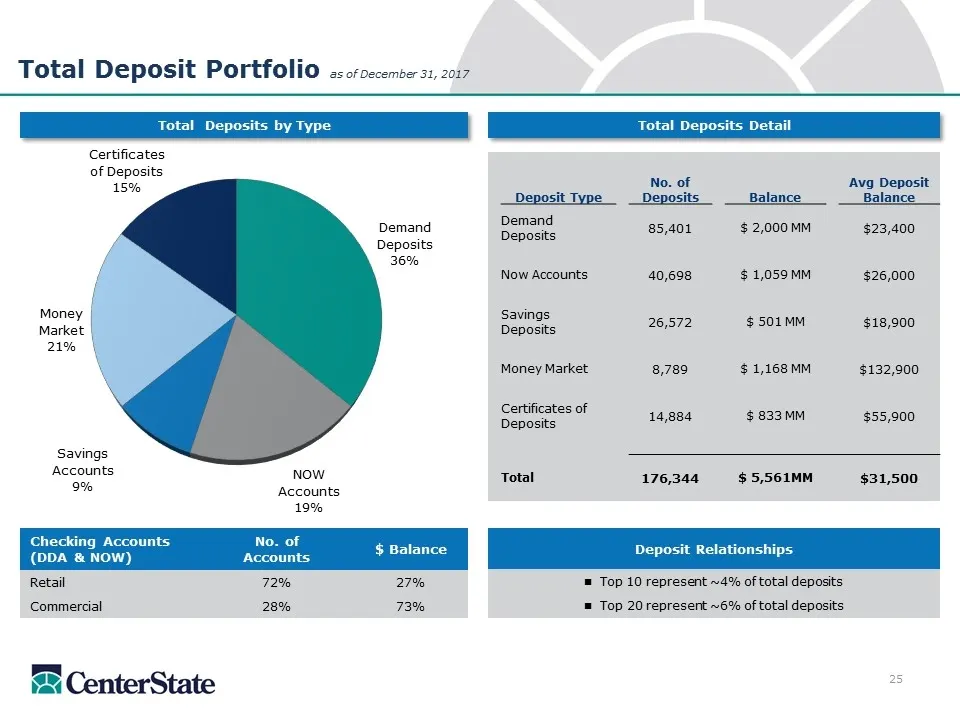
Deposit Relationships n Top 10 represent ~4% of total deposits n Top 20 represent ~6% of total deposits Total Deposits by Type Total Deposits Detail 23 Total Deposit Portfolio as of December 31, 2017 Deposit Type No. of Deposits Balance Avg Deposit Balance Demand Deposits 85,401 $ 2,000 MM $23,400 N
Slide 26: Analyst Coverage
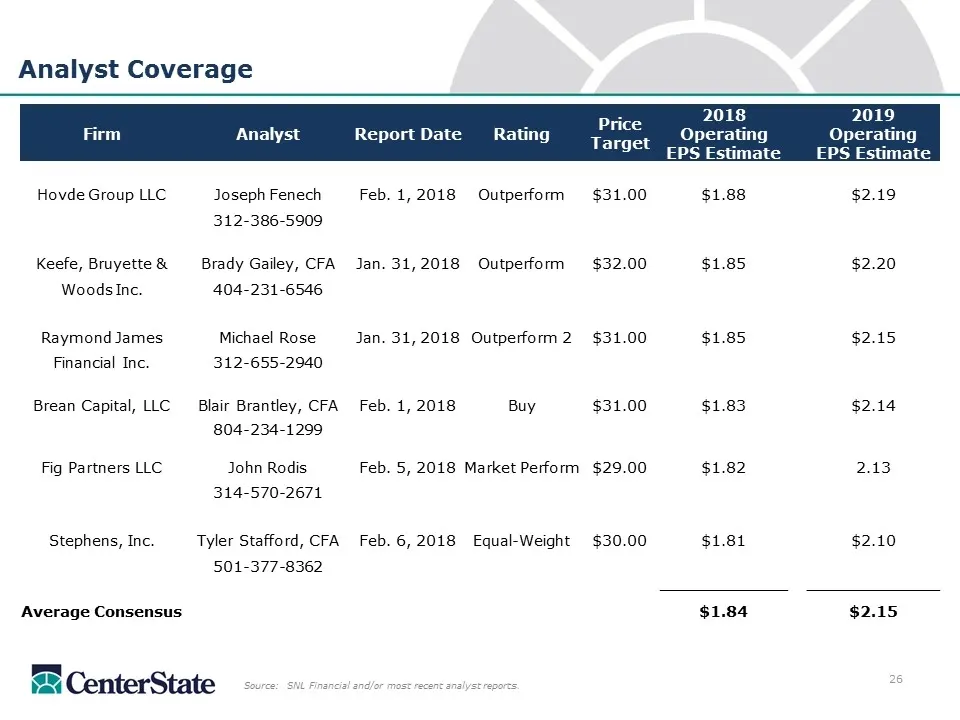
Analyst Coverage Source: SNL Financial and/or most recent analyst reports. Firm Analyst Report Date Rating Price Target 2018 Operating EPS Estimate 2019 Operating EPS Estimate Hovde Group LLC Joseph Fenech Feb. 1, 2018 Outperform $31.00 $1.88 $2.19 312-386-5909 Keefe, Bruyette & Brady Gailey, CFA Ja
Slide 27: Reconciliation of GAAP to Non-GAAP Measures
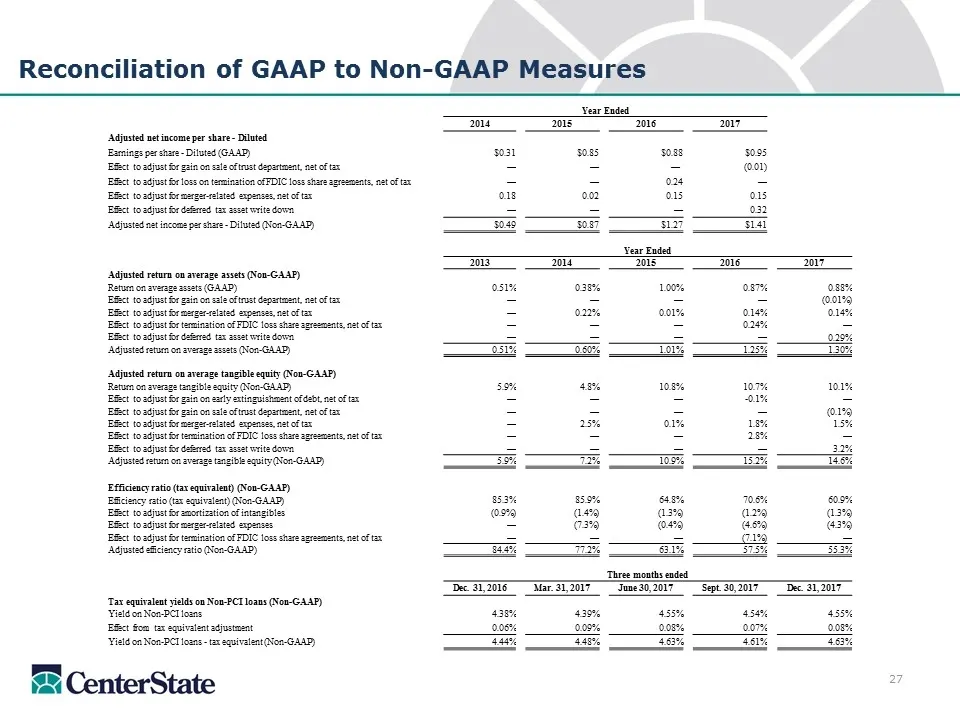
Reconciliation of GAAP to Non-GAAP Measures Year Ended 2014 2015 2016 2017 Adjusted net income per share - Diluted Earnings per share - Diluted (GAAP) $0.31 $0.85 $0.88 $0.95 Effect to adjust for gain on sale of trust department, net of tax — — — (0.01) Effect to adjust for loss on termination of FD
Slide 28: Investor Contacts
Investor Contacts Ernie Pinner John Corbett Executive Chairman President & Chief Executive Officer [email protected] [email protected] Steve Young Jennifer Idell Chief Operating Officer Chief Financial Officer [email protected] [email protected]
Slide 29: CenterState
ms CenterState
Source: SEC EDGAR · 8-K filed Feb 8, 2018
More decks from CenterState Bank Corporation
 IPO Roadshow (May 2020)42 slides · May 21, 2020
 D.A. Davidson 22nd Annual Financial Institution Virtual Conference (May 2020)25 slides · May 6, 2020
 Q1 2020 Earnings Presentation25 slides · Apr 23, 2020
 Merger or Acquisition (January 2020)24 slides · Jan 27, 2020
 Q3 2019 Earnings Presentation28 slides · Nov 4, 2019
 Investor Presentation (July 2019)28 slides · Jul 30, 2019