Western Asset Mortgage Capital
Western Asset Mortgage Capital — Q2 2017 Earnings Presentation
19 slides from Western Asset Mortgage Capital's earnings presentation, Aug 8, 2017
Slide 1: Second Quarter 2017 Investor Presentation
Second Quarter 2017 Investor Presentation August 8, 2017
Slide 2: Forward-looking statements
We make forward-looking statements in this presentation that are subject to risks and uncertainties. These forward-looking statements include information about possible or assumed future results of our business, financial condition, liquidity, results of operations, plans and objectives. When we use
Slide 3: Corporate Overview
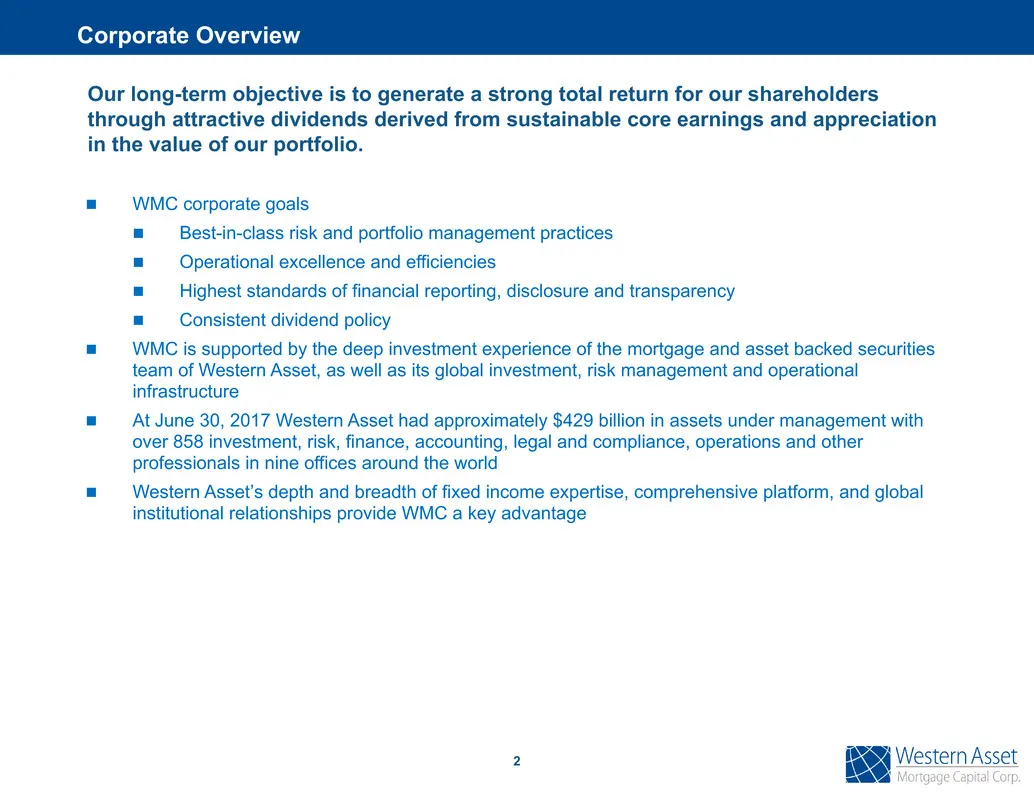
n WMC corporate goals n Best-in-class risk and portfolio management practices n Operational excellence and efficiencies n Highest standards of financial reporting, disclosure and transparency n Consistent dividend policy n WMC is supported by the deep investment experience of the mortgage and asset
Slide 4: Second Quarter Financial Highlights
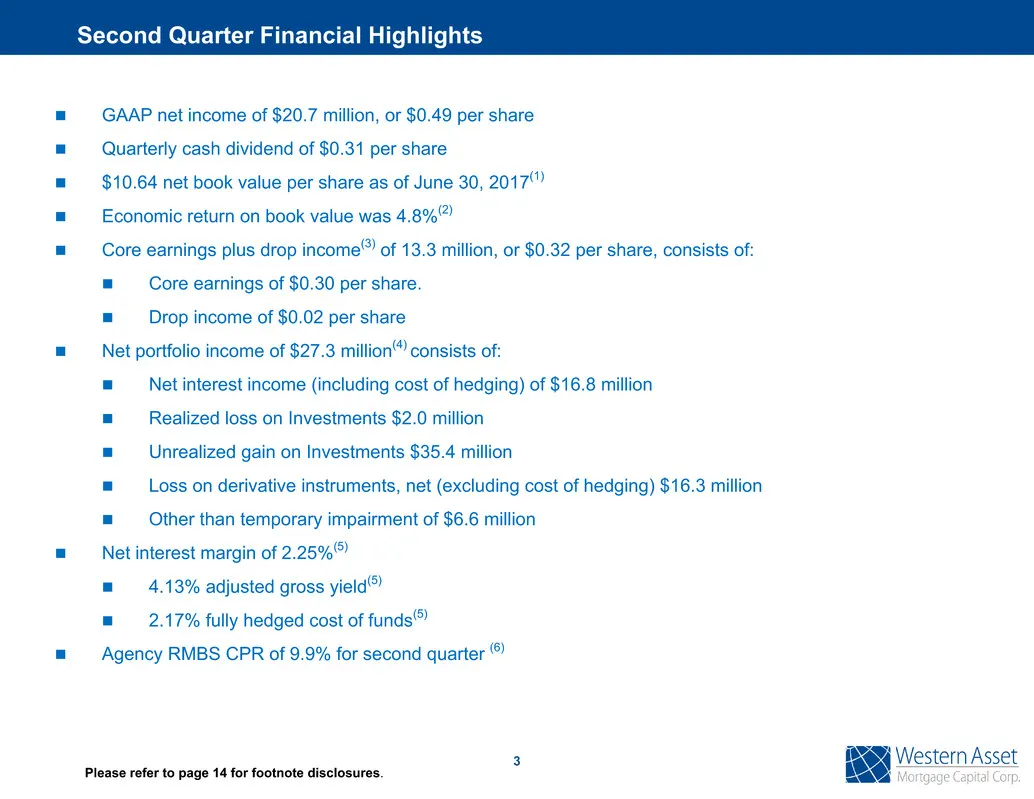
n GAAP net income of $20.7 million, or $0.49 per share n Quarterly cash dividend of $0.31 per share n $10.64 net book value per share as of June 30, 2017(1) n Economic return on book value was 4.8%(2) n Core earnings plus drop income(3) of 13.3 million, or $0.32 per share, consists of: n Core earnin
Slide 5: Recent Performance
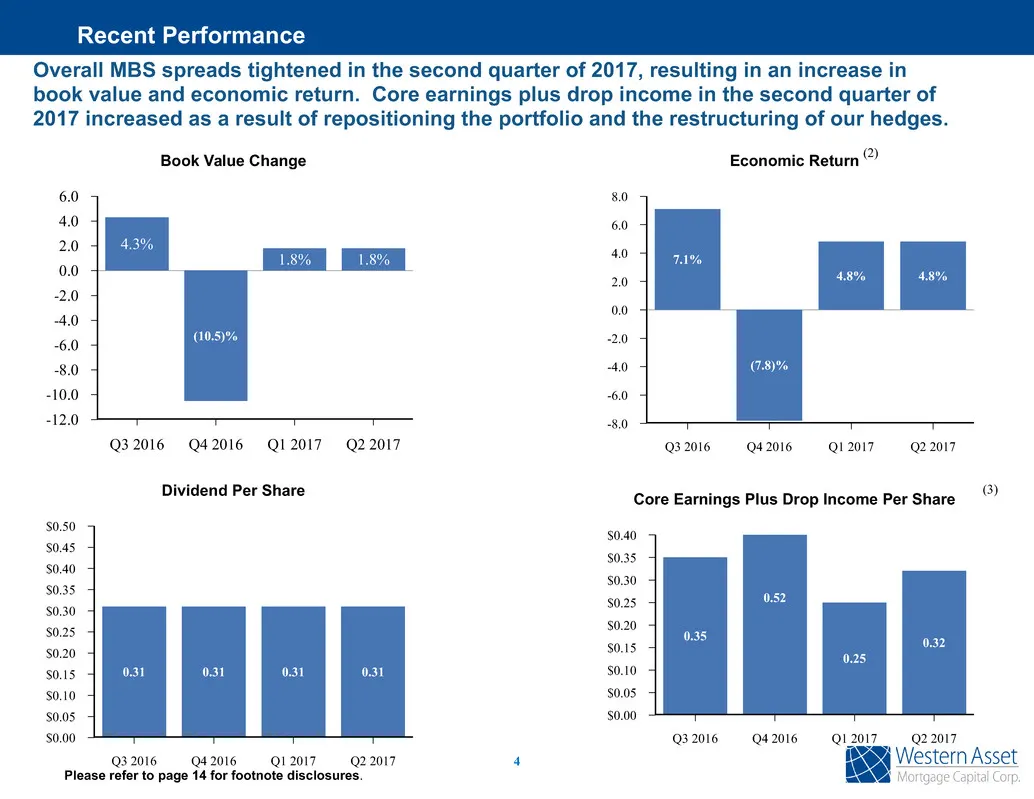
Overall MBS spreads tightened in the second quarter of 2017, resulting in an increase in book value and economic return. Core earnings plus drop income in the second quarter of 2017 increased as a result of repositioning the portfolio and the restructuring of our hedges. Dividend Per Share $0.50 $0.
Slide 6: Book Value Roll Forward
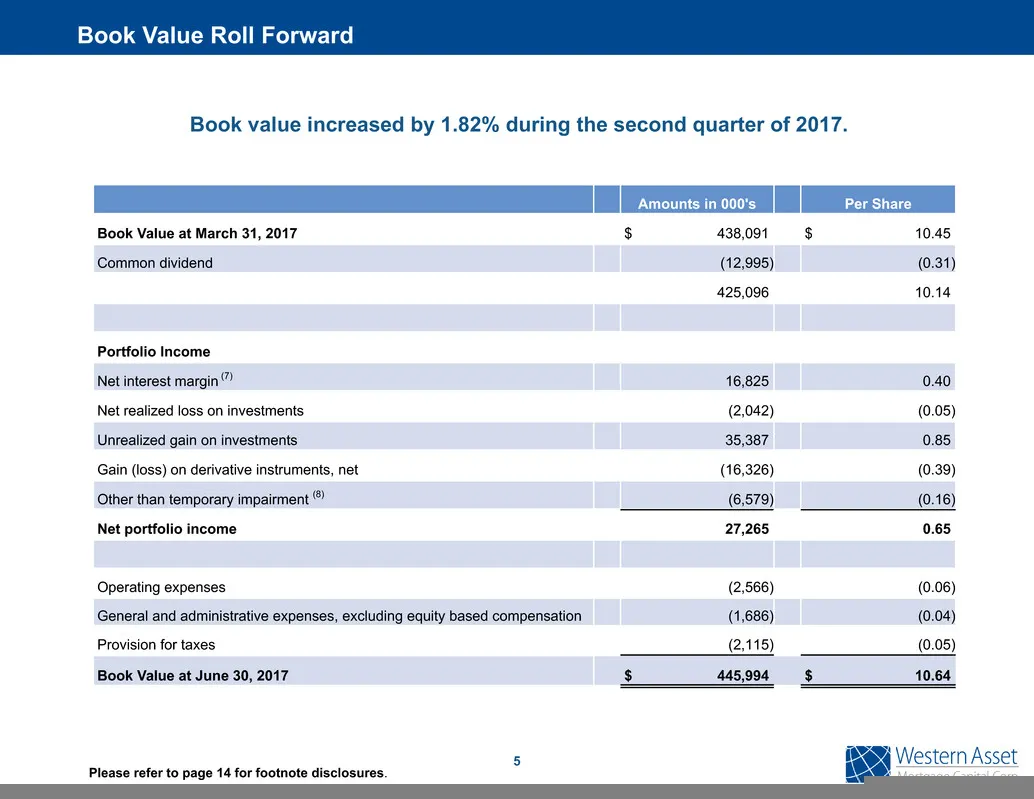
5 Book Value Roll Forward Please refer to page 14 for footnote disclosures. Book value increased by 1.82% during the second quarter of 2017. Amounts in 000's Per Share Book Value at March 31, 2017 $ 438,091 $ 10.45 Common dividend (12,995) (0.31) 425,096 10.14 Portfolio Income Net interest margin (7
Slide 7: Investment Portfolio and Portfolio Composition
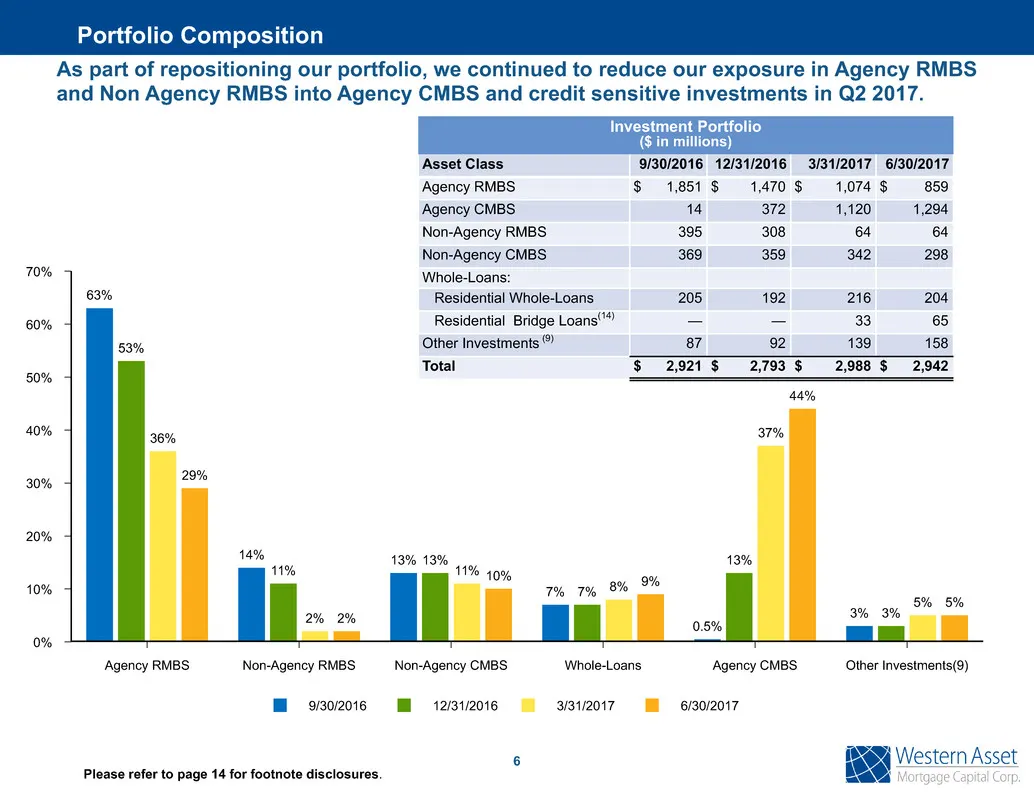
As part of repositioning our portfolio, we continued to reduce our exposure in Agency RMBS and Non Agency RMBS into Agency CMBS and credit sensitive investments in Q2 2017. 9/30/2016 12/31/2016 3/31/2017 6/30/2017 70% 60% 50% 40% 30% 20% 10% 0% Agency RMBS Non-Agency RMBS Non-Agency CMBS Whole-Loans
Slide 8: Portfolio Income Attribution
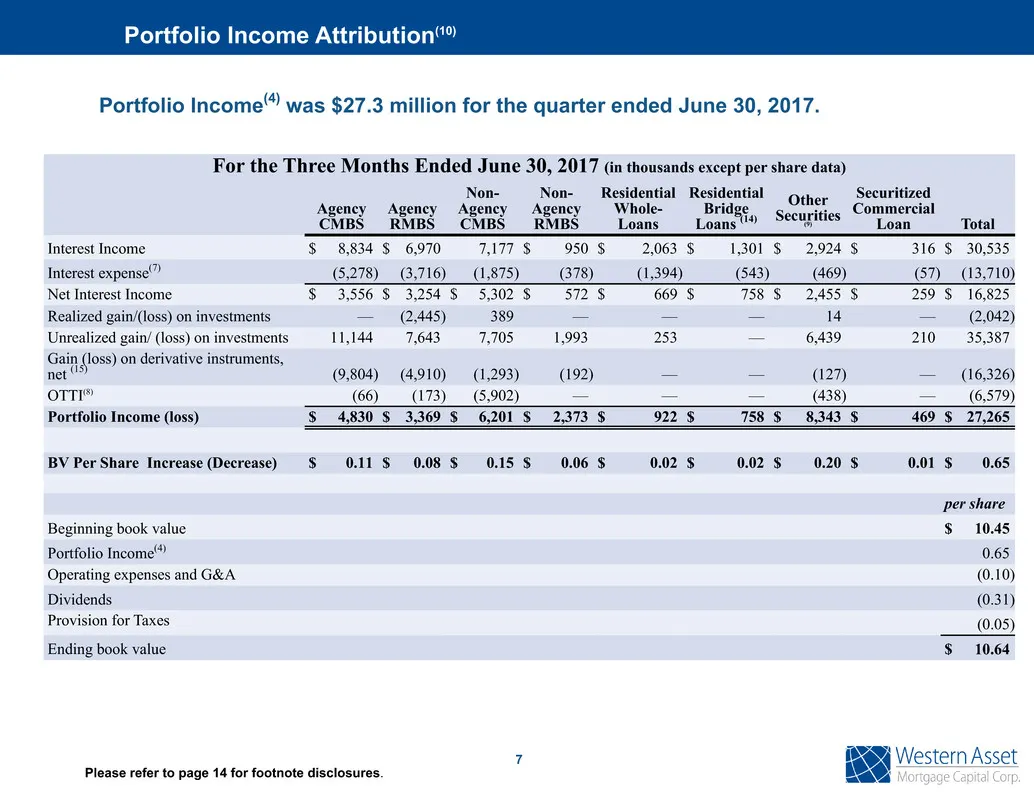
7 Portfolio Income Attribution(10) Please refer to page 14 for footnote disclosures. Portfolio Income(4) was $27.3 million for the quarter ended June 30, 2017. For the Three Months Ended June 30, 2017 (in thousands except per share data) Agency CMBS Agency RMBS Non- Agency CMBS Non- Agency RMBS Resi
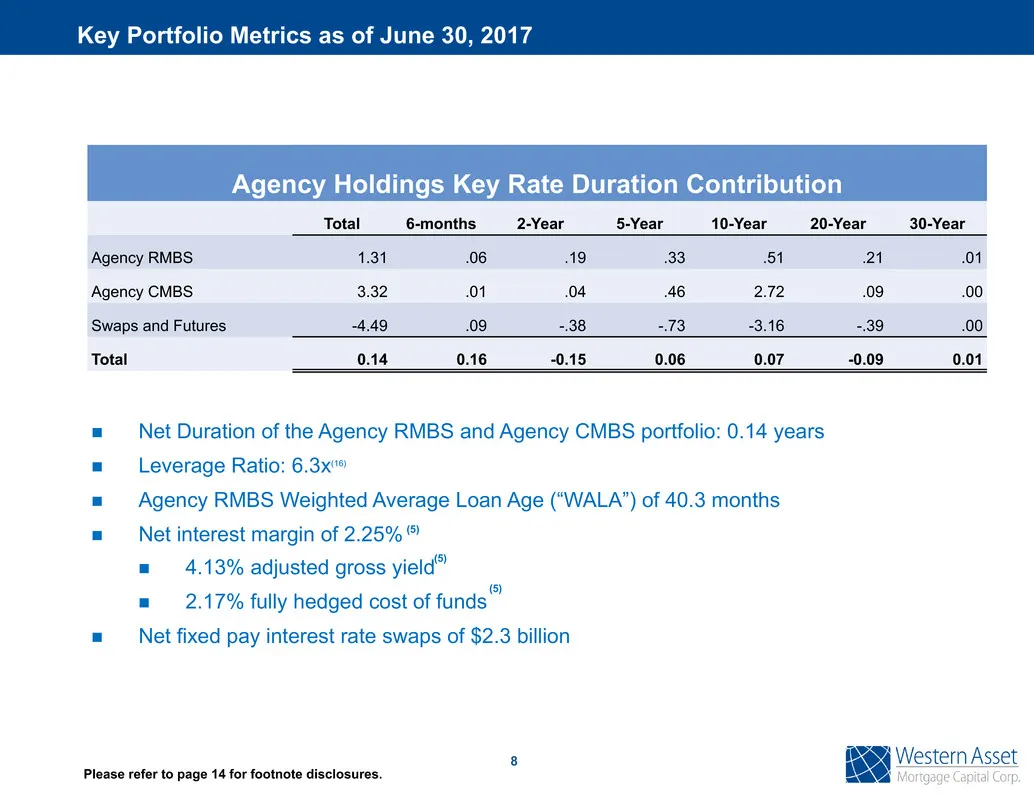
Slide 9: Key Portfolio Metrics as of June 30, 2017
n Net Duration of the Agency RMBS and Agency CMBS portfolio: 0.14 years n Leverage Ratio: 6.3x(16) n Agency RMBS Weighted Average Loan Age (“WALA”) of 40.3 months n Net interest margin of 2.25% n 4.13% adjusted gross yield n 2.17% fully hedged cost of funds n Net fixed pay interest rate swaps of $2.
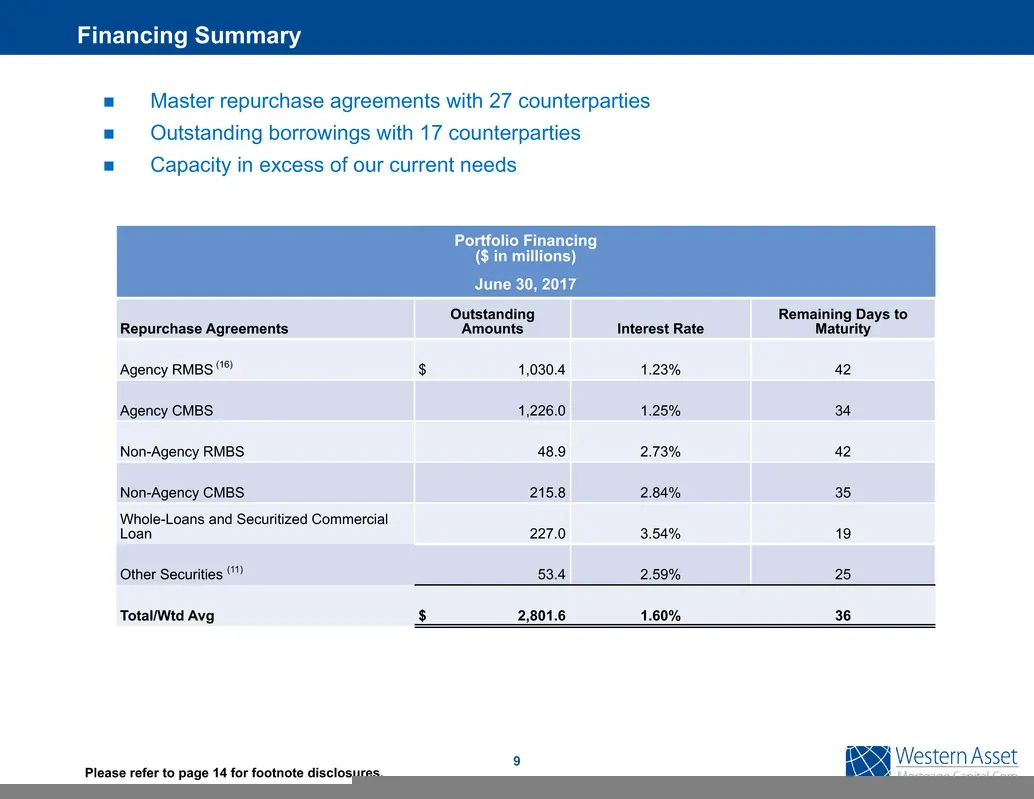
Slide 10: Portfolio Financing
Portfolio Financing ($ in millions) June 30, 2017 Repurchase Agreements Outstanding Amounts Interest Rate Remaining Days to Maturity Agency RMBS (16) $ 1,030.4 1.23% 42 Agency CMBS 1,226.0 1.25% 34 Non-Agency RMBS 48.9 2.73% 42 Non-Agency CMBS 215.8 2.84% 35 Whole-Loans and Securitized Commercial Lo
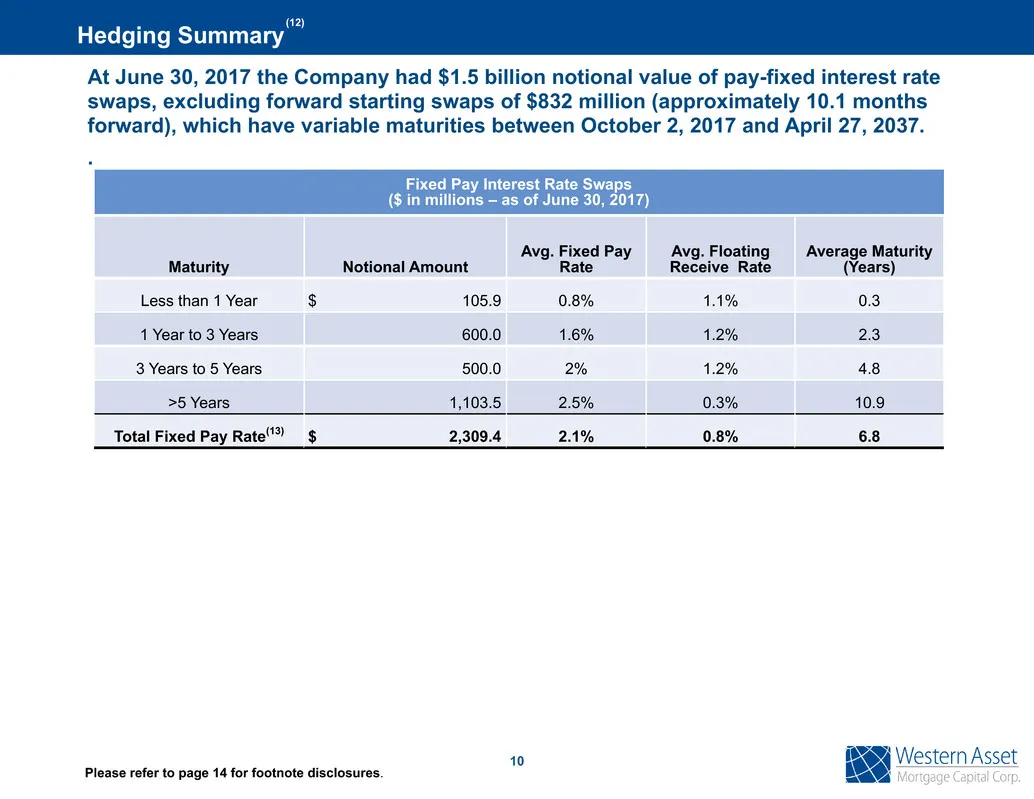
Slide 11: Hedging Summary: Fixed Pay Interest Rate Swaps
10 Fixed Pay Interest Rate Swaps ($ in millions – as of June 30, 2017) Maturity Notional Amount Avg. Fixed Pay Rate Avg. Floating Receive Rate Average Maturity (Years) Less than 1 Year $ 105.9 0.8% 1.1% 0.3 1 Year to 3 Years 600.0 1.6% 1.2% 2.3 3 Years to 5 Years 500.0 2% 1.2% 4.8 >5 Years 1,103.5 2
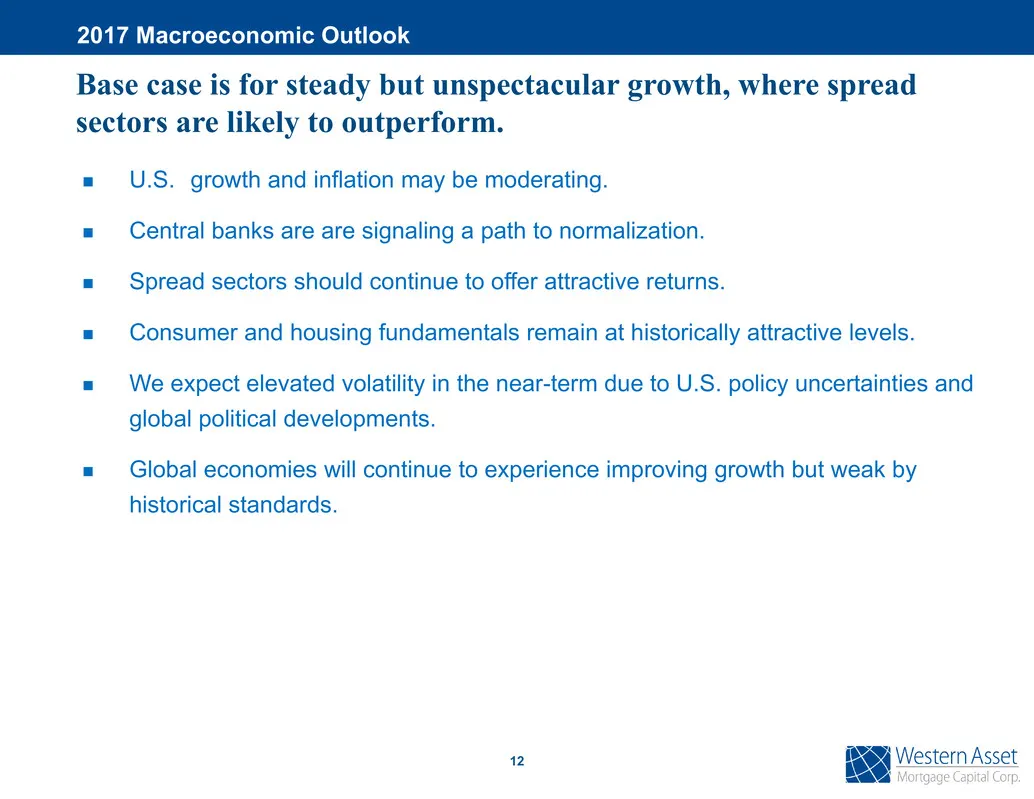
Slide 12: 2017 Macroeconomic Outlook
12 n U.S. growth and inflation may be moderating. n Central banks are are signaling a path to normalization. n Spread sectors should continue to offer attractive returns. n Consumer and housing fundamentals remain at historically attractive levels. n We expect elevated volatility in the near-term du
Slide 13: Portfolio View
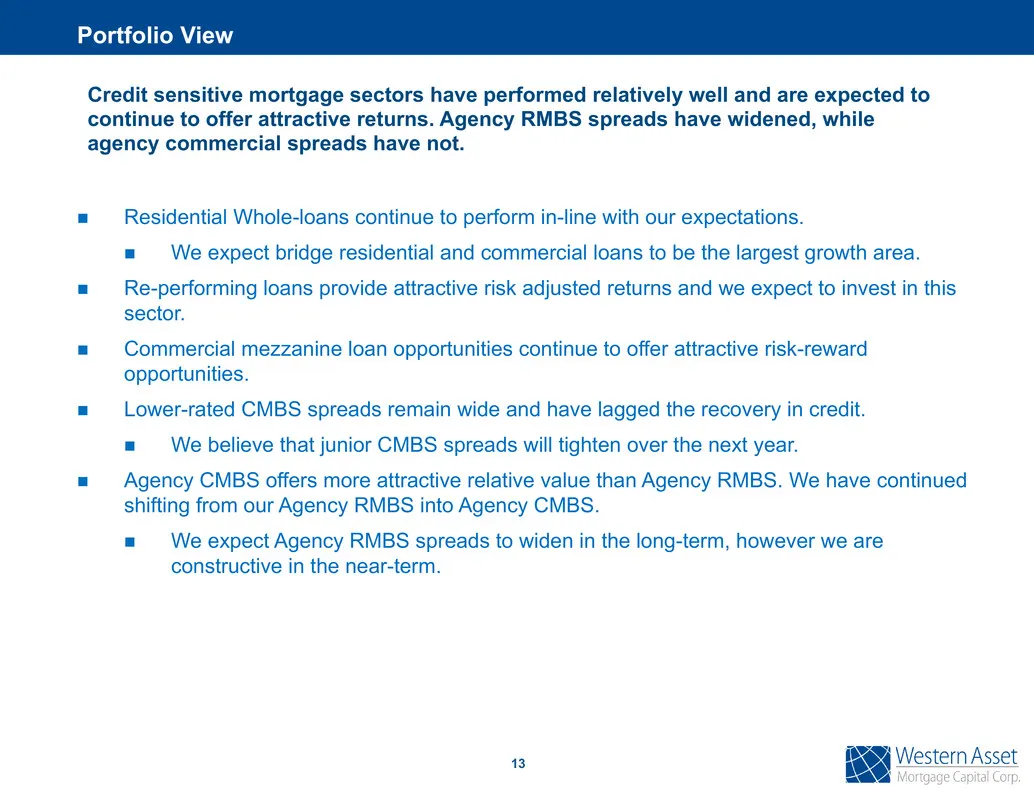
n Residential Whole-loans continue to perform in-line with our expectations. n We expect bridge residential and commercial loans to be the largest growth area. n Re-performing loans provide attractive risk adjusted returns and we expect to invest in this sector. n Commercial mezzanine loan opportuni
Slide 14: Footnotes
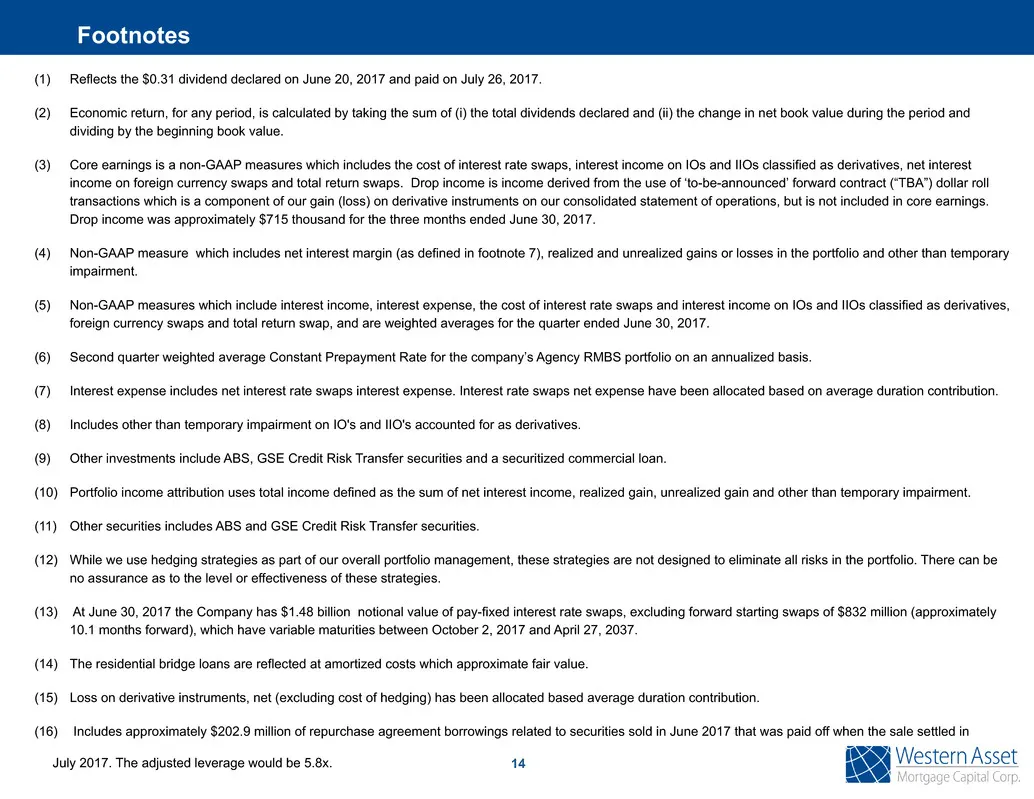
(1) Reflects the $0.31 dividend declared on June 20, 2017 and paid on July 26, 2017. (2) Economic return, for any period, is calculated by taking the sum of (i) the total dividends declared and (ii) the change in net book value during the period and dividing by the beginning book value. (3) Core ear

Slide 15: Appendix
Appendix
Slide 16: Portfolio Breakdown
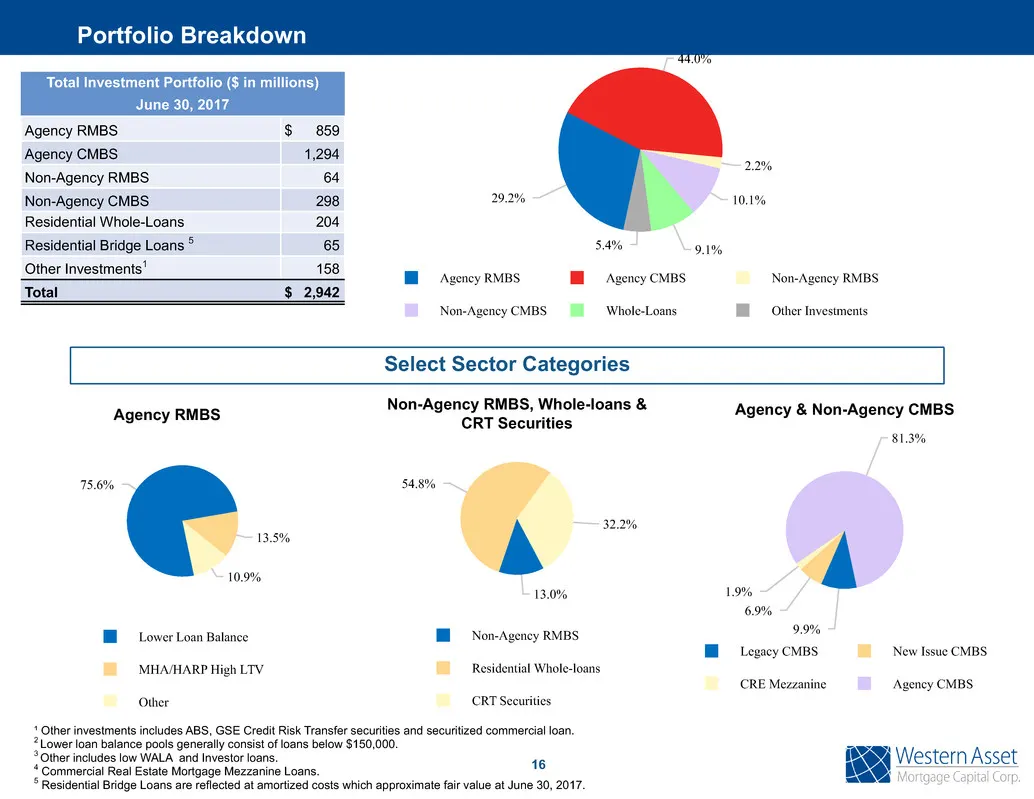
¹ Other investments includes ABS, GSE Credit Risk Transfer securities and securitized commercial loan. 2 Lower loan balance pools generally consist of loans below $150,000. 3 Other includes low WALA and Investor loans. 4 Commercial Real Estate Mortgage Mezzanine Loans. 5 Residential Bridge Loans are
Slide 17: Investment Portfolio
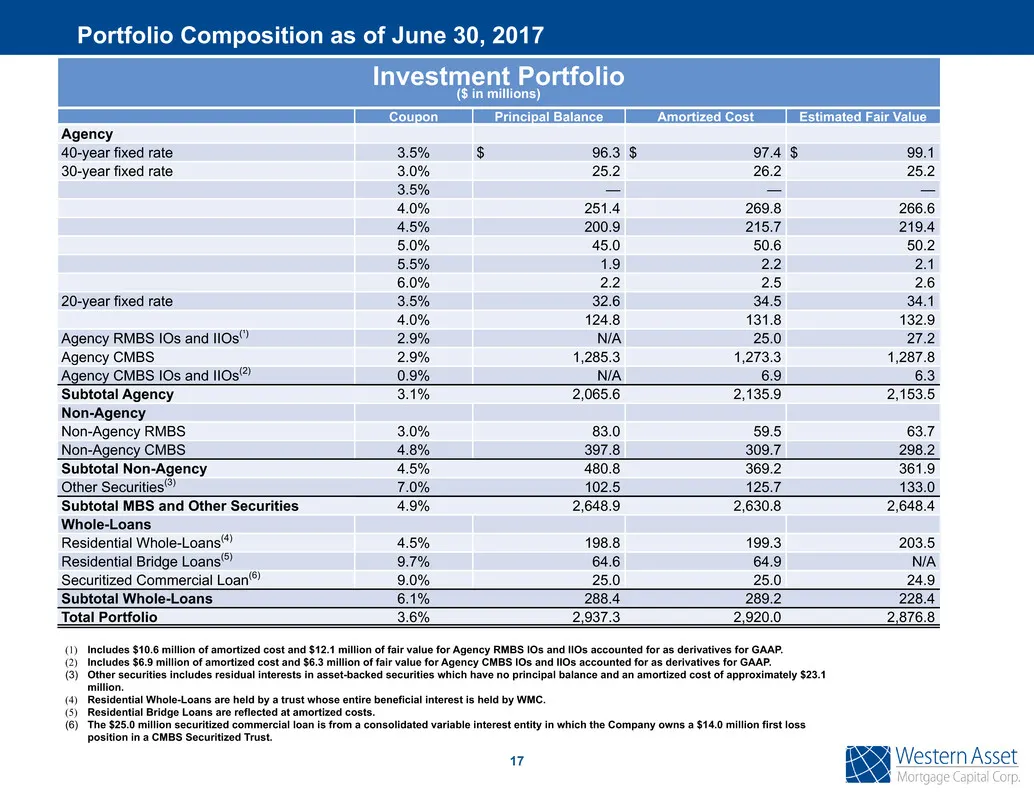
(1) Includes $10.6 million of amortized cost and $12.1 million of fair value for Agency RMBS IOs and IIOs accounted for as derivatives for GAAP. (2) Includes $6.9 million of amortized cost and $6.3 million of fair value for Agency CMBS IOs and IIOs accounted for as derivatives for GAAP. (3) Other se
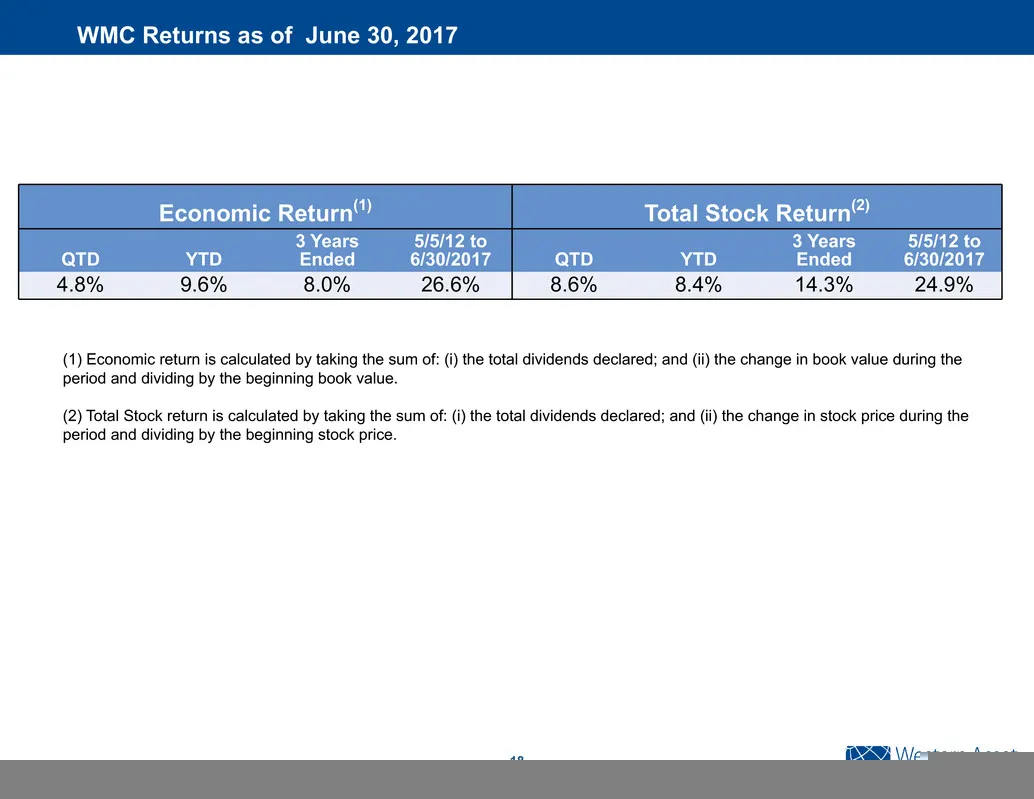
Slide 18: WMC Returns as of June 30, 2017
18 Economic Return(1) Total Stock Return(2) QTD YTD 3 Years Ended 5/5/12 to 6/30/2017 QTD YTD 3 Years Ended 5/5/12 to 6/30/2017 4.8% 9.6% 8.0% 26.6% 8.6% 8.4% 14.3% 24.9% WMC Returns as of June 30, 2017 (1) Economic return is calculated by taking the sum of: (i) the total dividends declared; and (ii
Slide 19: Contact Information
Western Asset Mortgage Capital Corporation c/o Financial Profiles, Inc. 11601 Wilshire Blvd., Suite 1920 Los Angeles, CA 90025 www.westernassetmcc.com Investor Relations Contact: Larry Clark Tel: (310) 622-8223 [email protected] Contact Information
Source: SEC EDGAR · 8-K filed Aug 8, 2017
More decks from Western Asset Mortgage Capital
 Merger or Acquisition (August 2023)9 slides · Aug 9, 2023
 Q2 2023 Earnings Presentation32 slides · Aug 8, 2023
 Merger or Acquisition (July 2023)9 slides · Jul 13, 2023
 Merger or Acquisition (June 2023)16 slides · Jun 28, 2023
 Q1 2023 Earnings Presentation33 slides · May 4, 2023
 Q4 2022 Earnings Presentation34 slides · Mar 2, 2023