Navistar International Corporation
Navistar International — Q3 2018 Earnings Presentation
22 slides from Navistar International's earnings presentation, Sep 6, 2018
Slide 1: Q3 2018 Earnings Presentation
Q3 2018 EARNINGS PRESENTATION September 6, 2018 ® International is a registered trademark of , Inc. NYSE: NAV
Slide 2: Safe Harbor Statement and Other Cautionary Notes
Safe Harbor Statement and Other Cautionary Notes Information provided and statements contained in this presentation that are not purely historical are forward-looking statements within the meaning of the federal securities laws. Such forward-looking statements only speak as of the date of this prese
Slide 3: Third Quarter 2018 Highlights
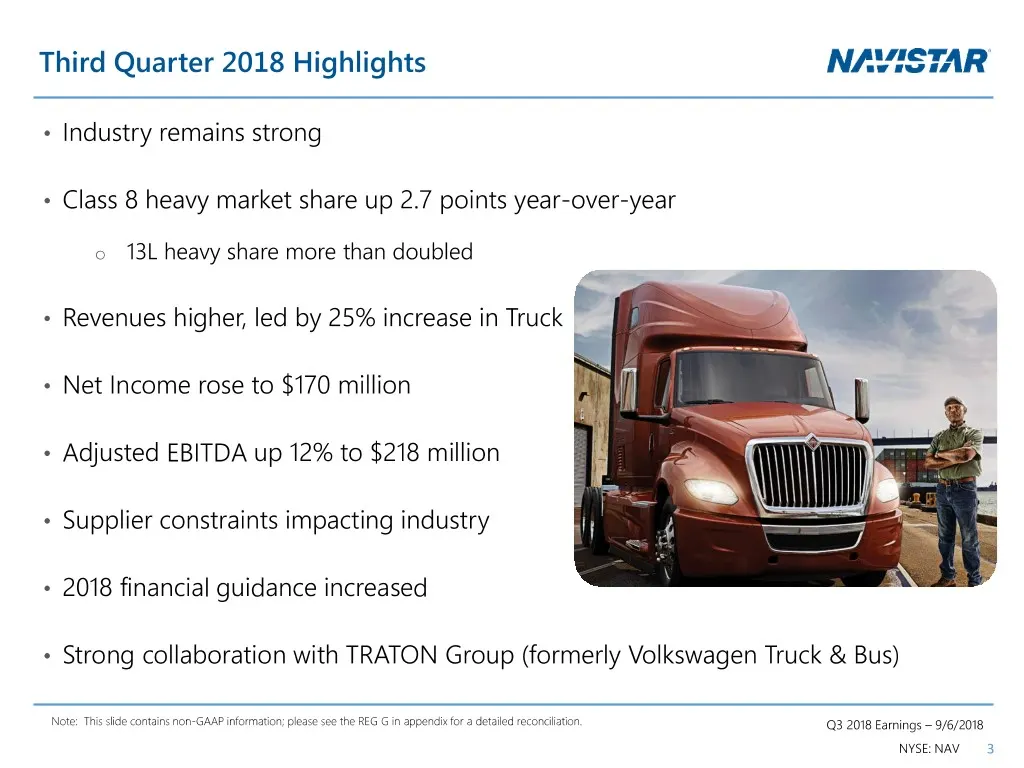
Third Quarter 2018 Highlights • Industry remains strong • Class 8 heavy market share up 2.7 points year-over-year o 13L heavy share more than doubled • Revenues higher, led by 25% increase in Truck • Net Income rose to $170 million • Adjusted EBITDA up 12% to $218 million • Supplier constraints impa
Slide 4: Capitalizing On A Strong Industry
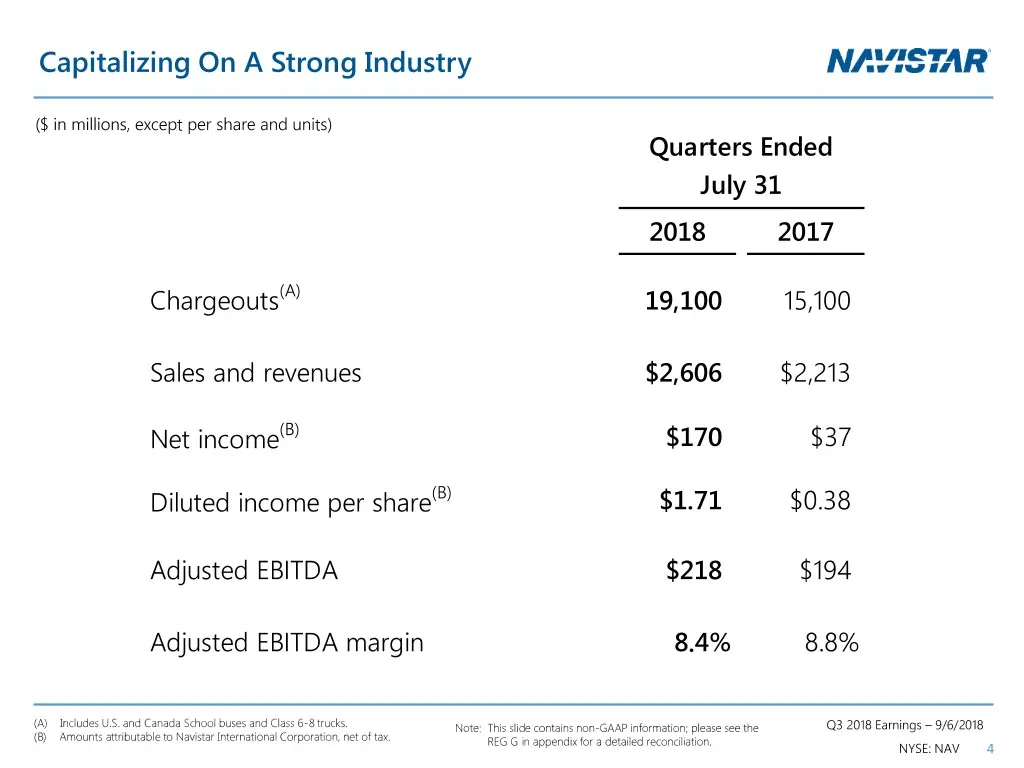
Capitalizing On A Strong Industry ($ in millions, except per share and units) Quarters Ended July 31 2018 2017 Chargeouts(A) 19,100 15,100 Sales and revenues $2,606 $2,213 Net income(B) $170 $37 Diluted income per share(B) $1.71 $0.38 Adjusted EBITDA $218 $194 Adjusted EBITDA margin 8.4% 8.8% (A) In
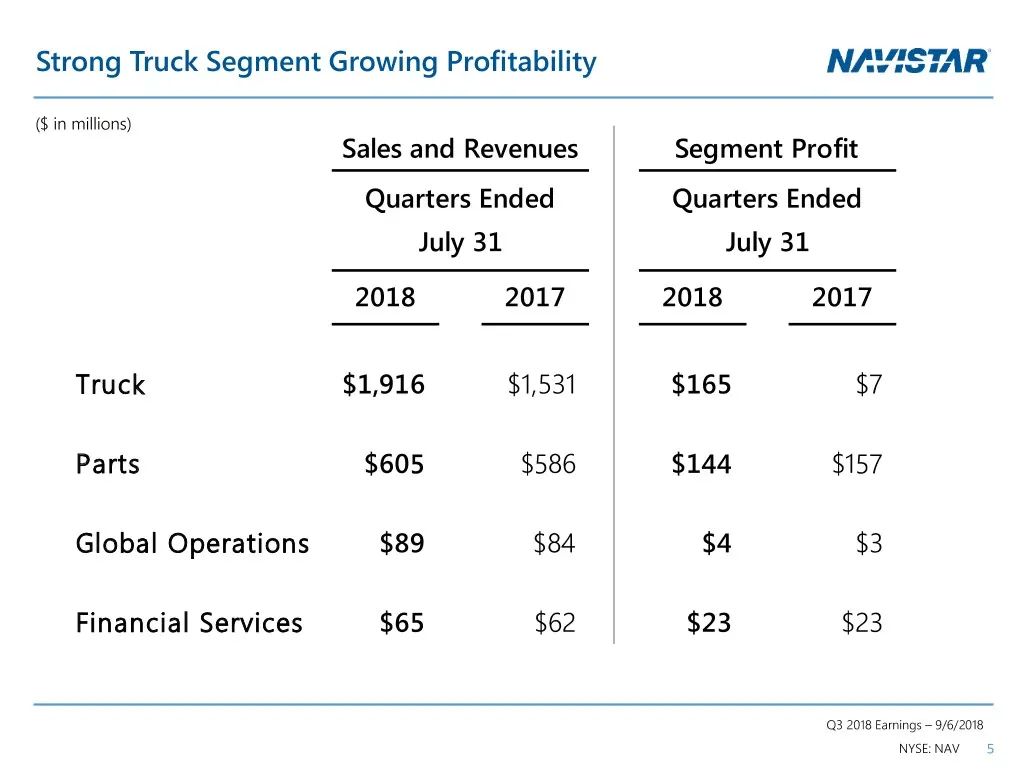
Slide 5: Strong Truck Segment Growing Profitability
Strong Truck Segment Growing Profitability ($ in millions) Sales and Revenues Segment Profit Quarters Ended Quarters Ended July 31 July 31 2018 2017 2018 2017 Truck $1,916 $1,531 $165 $7 Parts $605 $586 $144 $157 Global Operations $89 $84 $4 $3 Financial Services $65 $62 $23 $23 Q3 2018 Earnings – 9
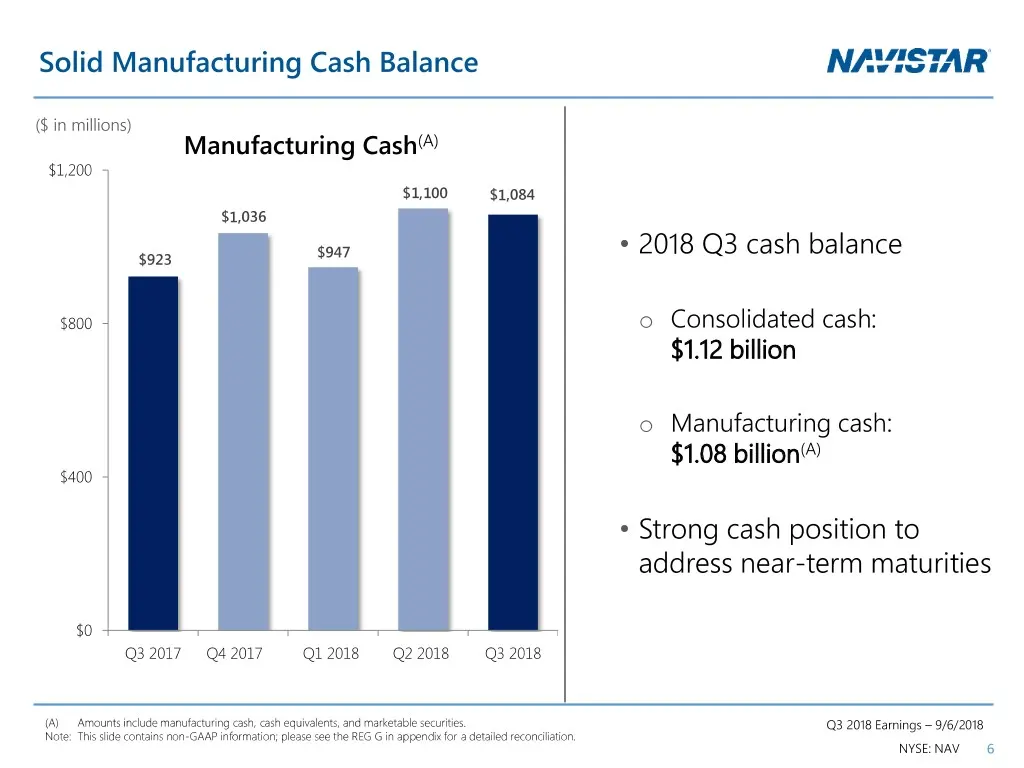
Slide 6: Solid Manufacturing Cash Balance
Solid Manufacturing Cash Balance ($ in millions) Manufacturing Cash(A) $1,200 $1,100 $1,084 $1,036 • 2018 Q3 cash balance $923 $947 $800 o Consolidated cash: $1.12 billion o Manufacturing cash: $1.08 billion(A) $400 • Strong cash position to address near-term maturities $0 Q3 2017 Q4 2017 Q1 2018 Q2
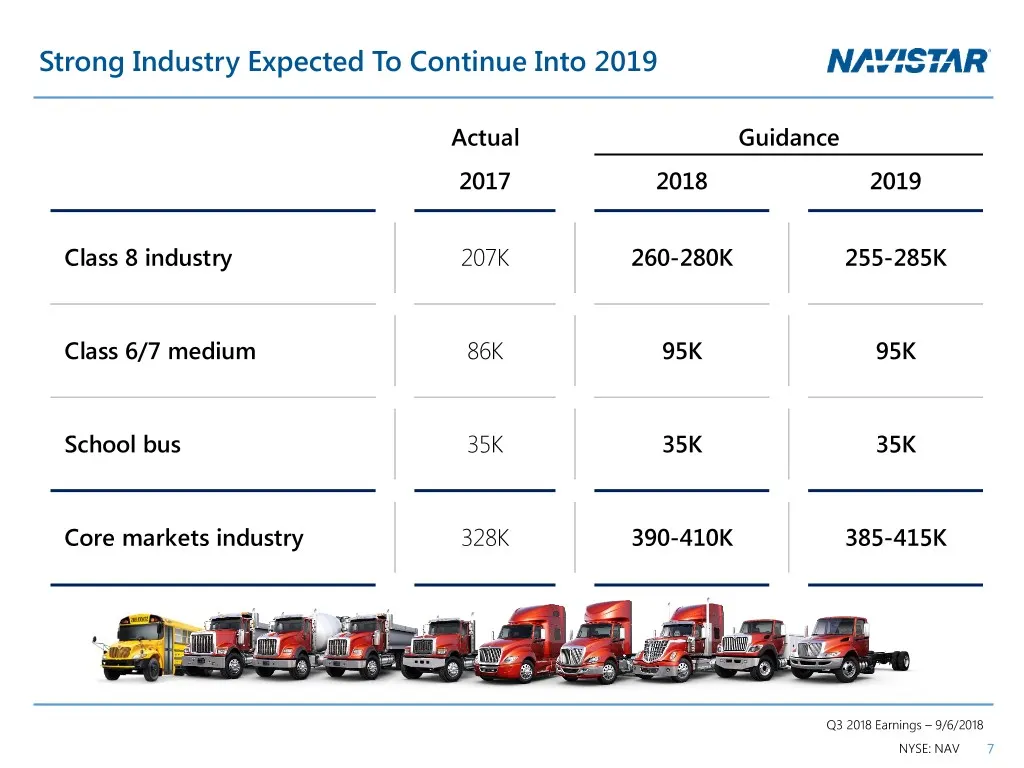
Slide 7: Strong Industry Expected To Continue Into 2019
Strong Industry Expected To Continue Into 2019 Actual Guidance 2017 2018 2019 Class 8 industry 207K 260-280K 255-285K Class 6/7 medium 86K 95K 95K School bus 35K 35K 35K Core markets industry 328K 390-410K 385-415K Q3 2018 Earnings – 9/6/2018 NYSE: NAV 7
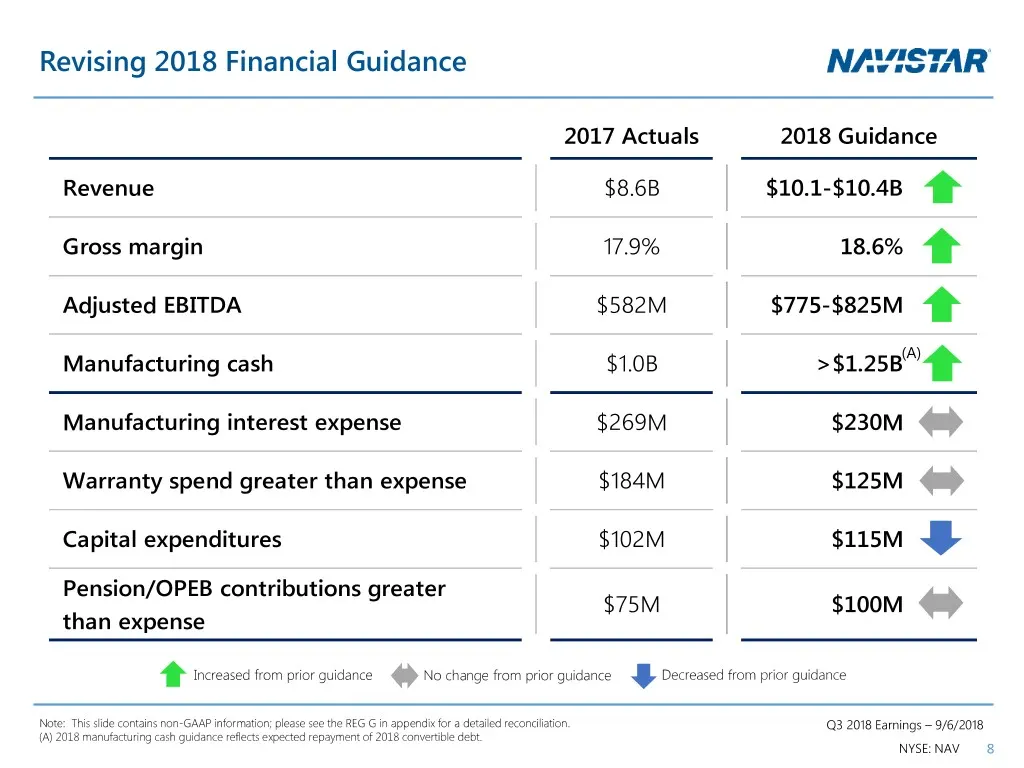
Slide 8: Revising 2018 Financial Guidance
Revising 2018 Financial Guidance 2017 Actuals 2018 Guidance Revenue $8.6B $10.1-$10.4B Gross margin 17.9% 18.6% Adjusted EBITDA $582M $775-$825M Manufacturing cash $1.0B >$1.25B(A) Manufacturing interest expense $269M $230M Warranty spend greater than expense $184M $125M Capital expenditures $102M $
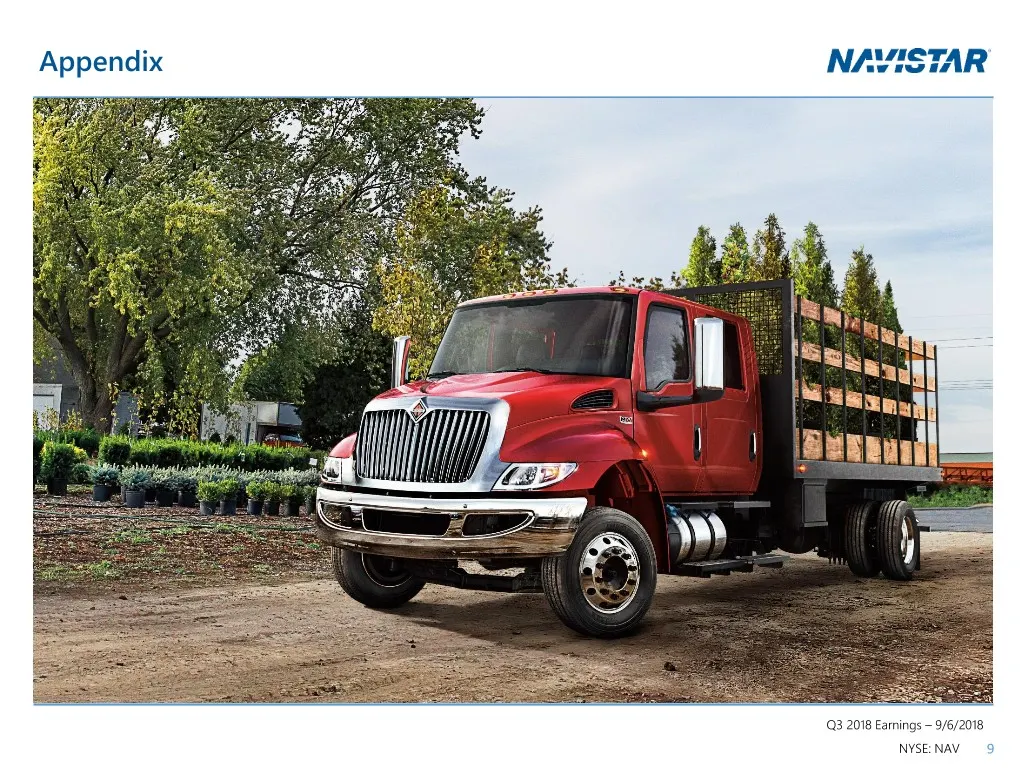
Slide 9: Appendix
Appendix Q3 2018 Earnings – 9/6/2018 NYSE: NAV 9
Slide 10: Further Progress on Legacy Issues
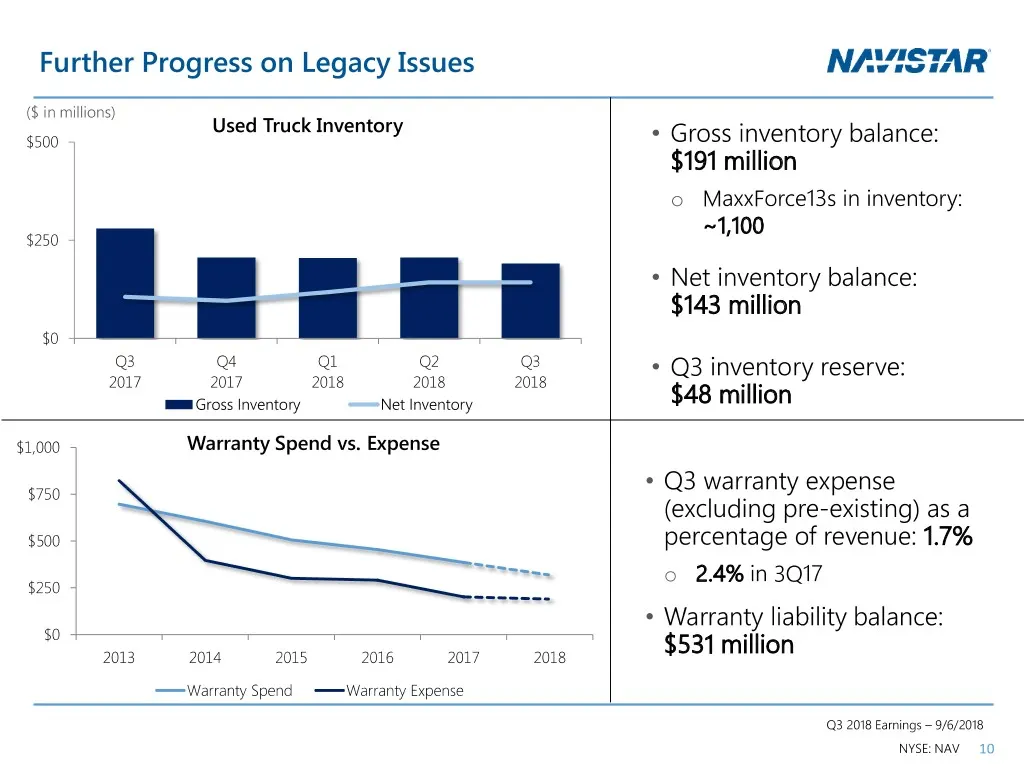
Further Progress on Legacy Issues ($ in millions) Used Truck Inventory $500 • Gross inventory balance: $191 million o MaxxForce13s in inventory: ~1,100 $250 • Net inventory balance: $143 million $0 Q3 Q4 Q1 Q2 Q3 • Q3 inventory reserve: 2017 2017 2018 2018 2018 Gross Inventory Net Inventory $48 mill
Slide 11: U.S. and Canada Dealer Stock Inventory
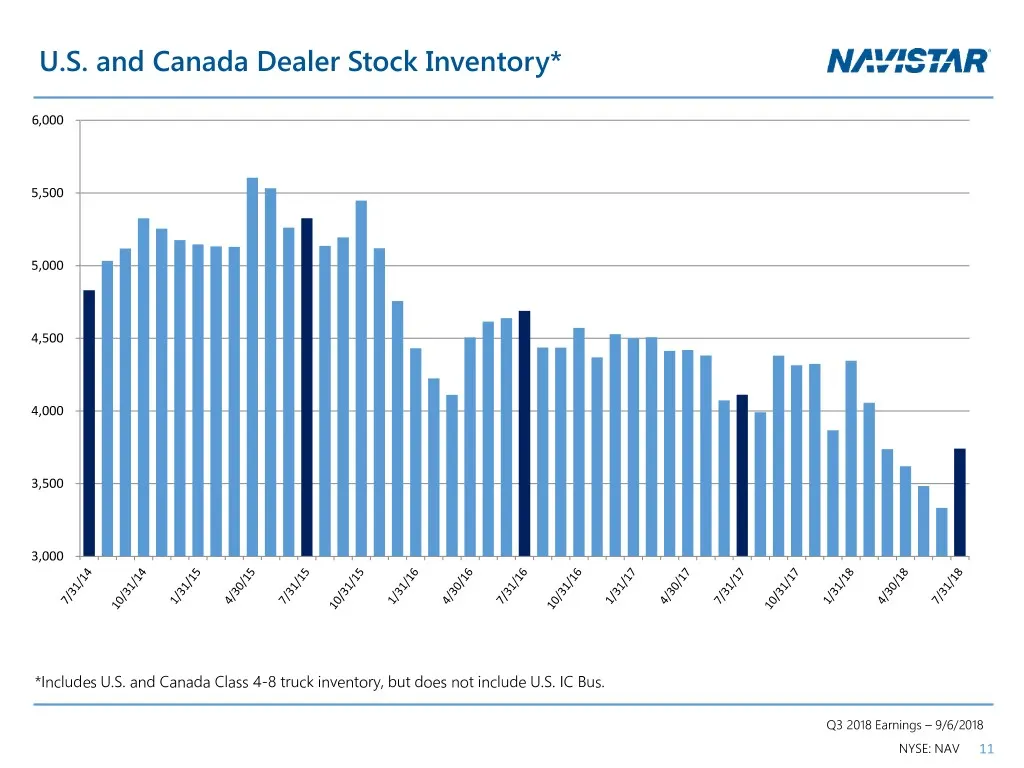
U.S. and Canada Dealer Stock Inventory* 6,000 5,500 5,000 4,500 4,000 3,500 3,000 *Includes U.S. and Canada Class 4-8 truck inventory, but does not include U.S. IC Bus. Q3 2018 Earnings – 9/6/2018 NYSE: NAV 11
Slide 12: Retail Market Share in Commercial Vehicle Segments
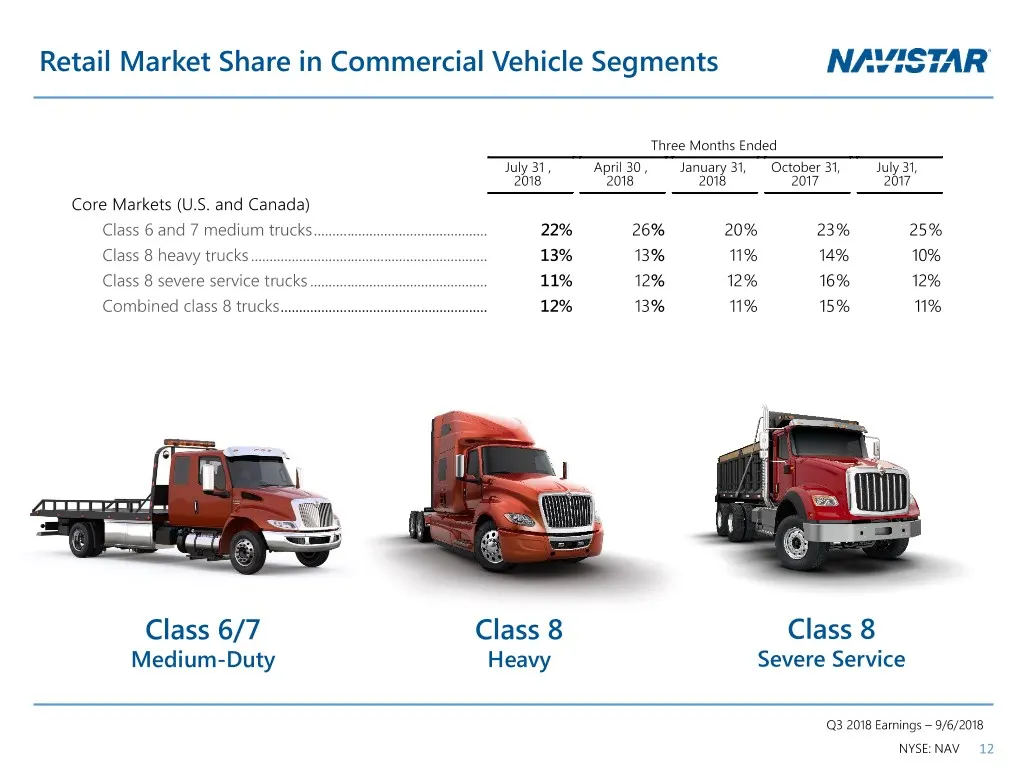
Retail Market Share in Commercial Vehicle Segments Three Months Ended July 31 , April 30 , January 31, October 31, July 31, 2018 2018 2018 2017 2017 Core Markets (U.S. and Canada) Class 6 and 7 medium trucks ........................................................ 22% 26 % 20 % 23 % 25 % Class 8 hea
Slide 13: Worldwide Truck Chargeouts
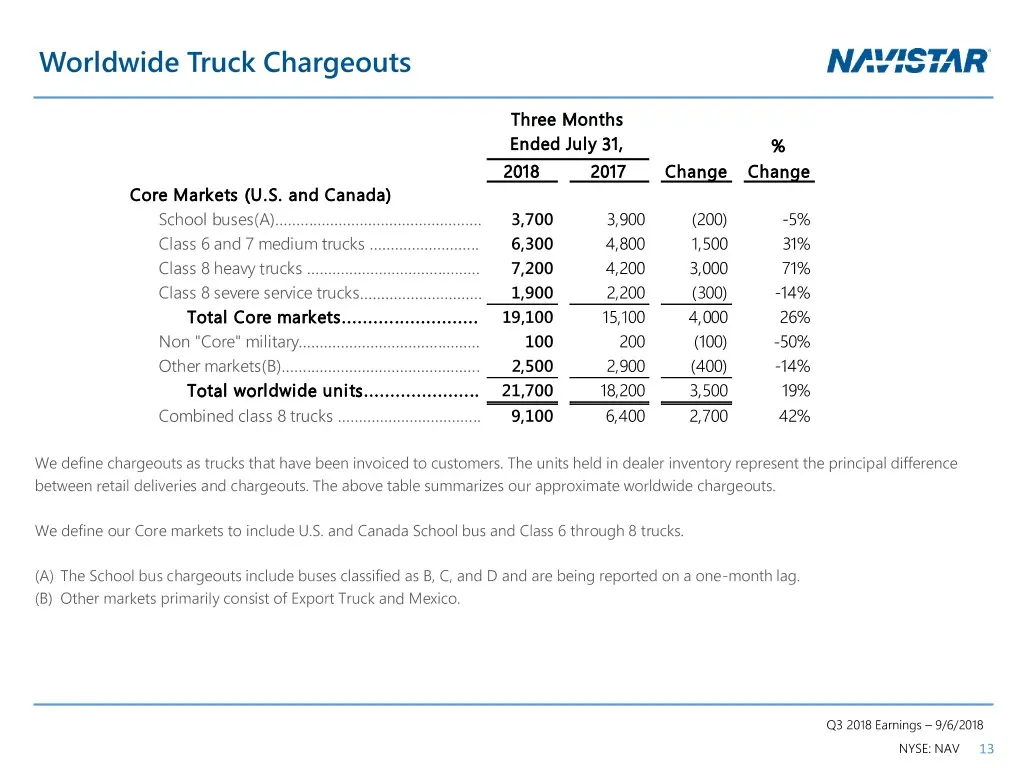
Worldwide Truck Chargeouts Three Months Ended July 31, % 2018 2017 Change Change Core Markets (U.S. and Canada) School buses(A)................................................. 3,700 3,900 (200) -5% Class 6 and 7 medium trucks .......................... 6,300 4,800 1,500 31% Class 8 heavy trucks ...
Slide 14: Financial Services Segment Highlights
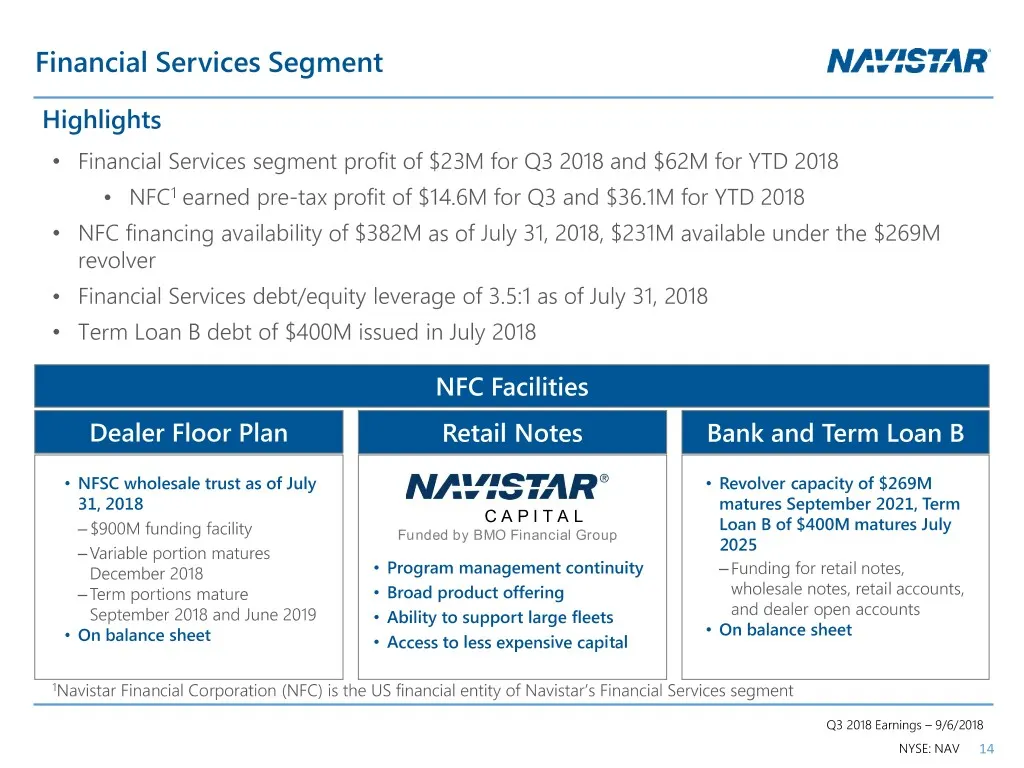
Financial Services Segment Highlights • Financial Services segment profit of $23M for Q3 2018 and $62M for YTD 2018 • NFC1 earned pre-tax profit of $14.6M for Q3 and $36.1M for YTD 2018 • NFC financing availability of $382M as of July 31, 2018, $231M available under the $269M revolver • Financial Se
Slide 15: Frequently Asked Questions
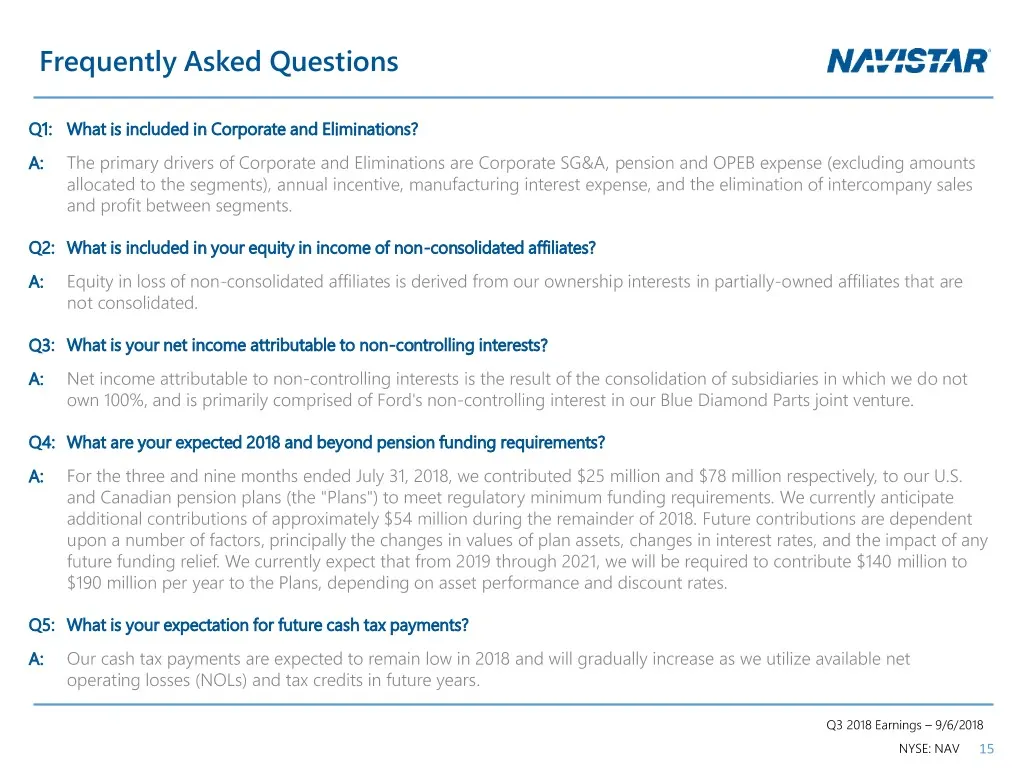
Frequently Asked Questions Q1: What is included in Corporate and Eliminations? A: The primary drivers of Corporate and Eliminations are Corporate SG&A, pension and OPEB expense (excluding amounts allocated to the segments), annual incentive, manufacturing interest expense, and the elimination of int
Slide 16: Frequently Asked Questions
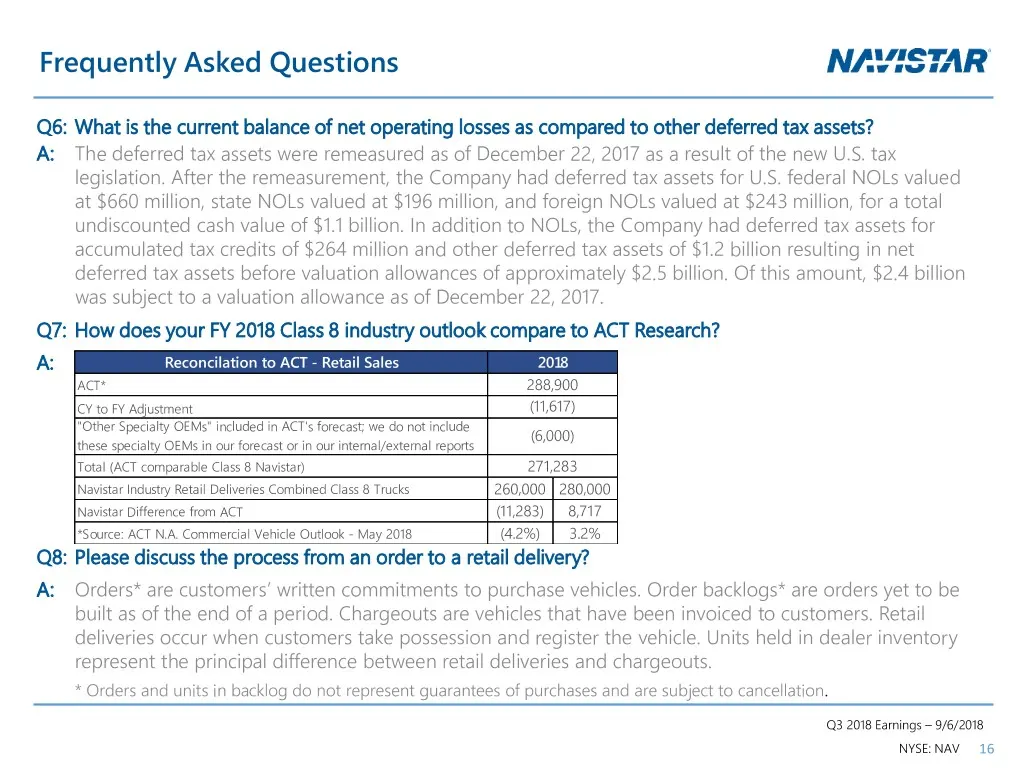
Frequently Asked Questions Q6: What is the current balance of net operating losses as compared to other deferred tax assets? A: The deferred tax assets were remeasured as of December 22, 2017 as a result of the new U.S. tax legislation. After the remeasurement, the Company had deferred tax assets fo
Slide 17: Frequently Asked Questions
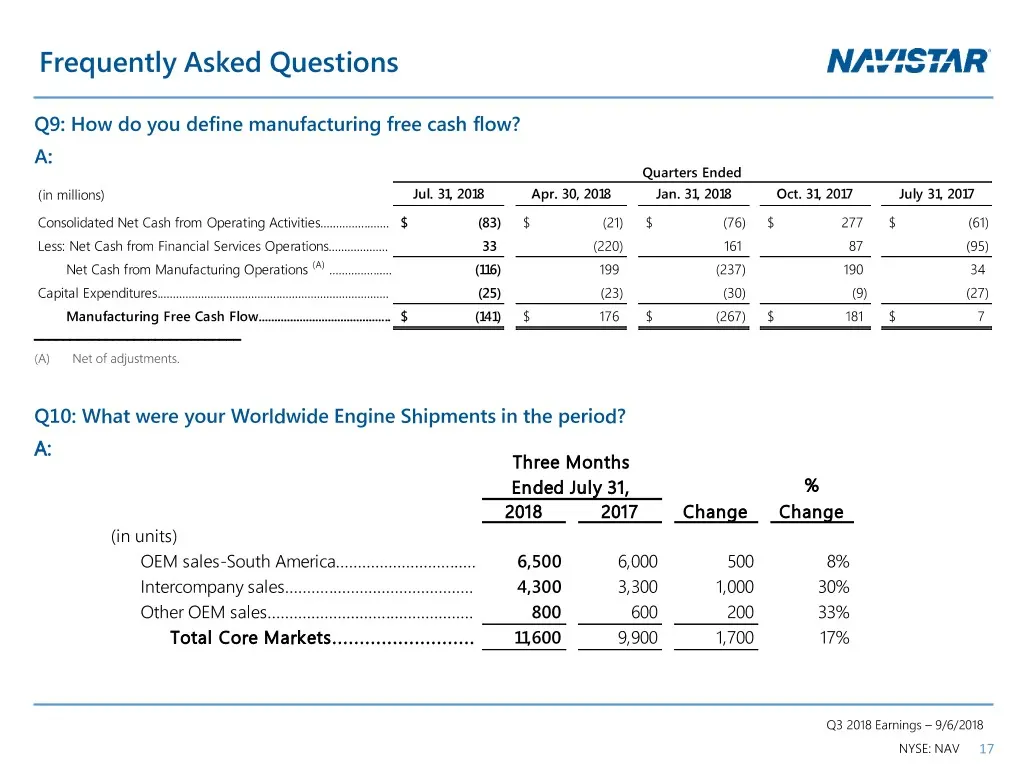
Frequently Asked Questions Q9: How do you define manufacturing free cash flow? A: Quarters Ended (in millions) Jul. 31, 2018 Apr. 30, 2018 Jan. 31, 2018 Oct. 31, 2017 July 31, 2017 Consolidated Net Cash from Operating Activities...................... $ (83) $ (21) $ (76) $ 277 $ (61) Less: Net Cash
Slide 18: Outstanding Debt Balances
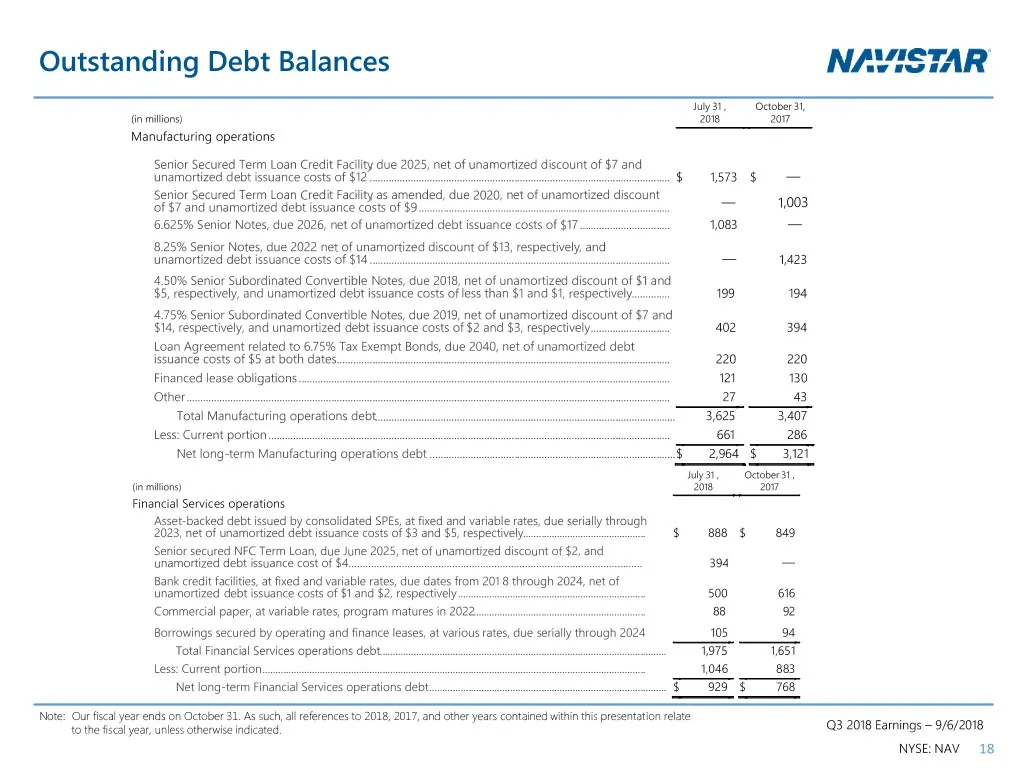
Outstanding Debt Balances July 31 , October 31, (in millions) 2018 2017 Manufacturing operations Senior Secured Term Loan Credit Facility, due 2025, net of unamortized discount of $7 and unamortized debt issuance costs of $12 ..........................................................................
Slide 19: SEC Regulation G Non-GAAP Reconciliation
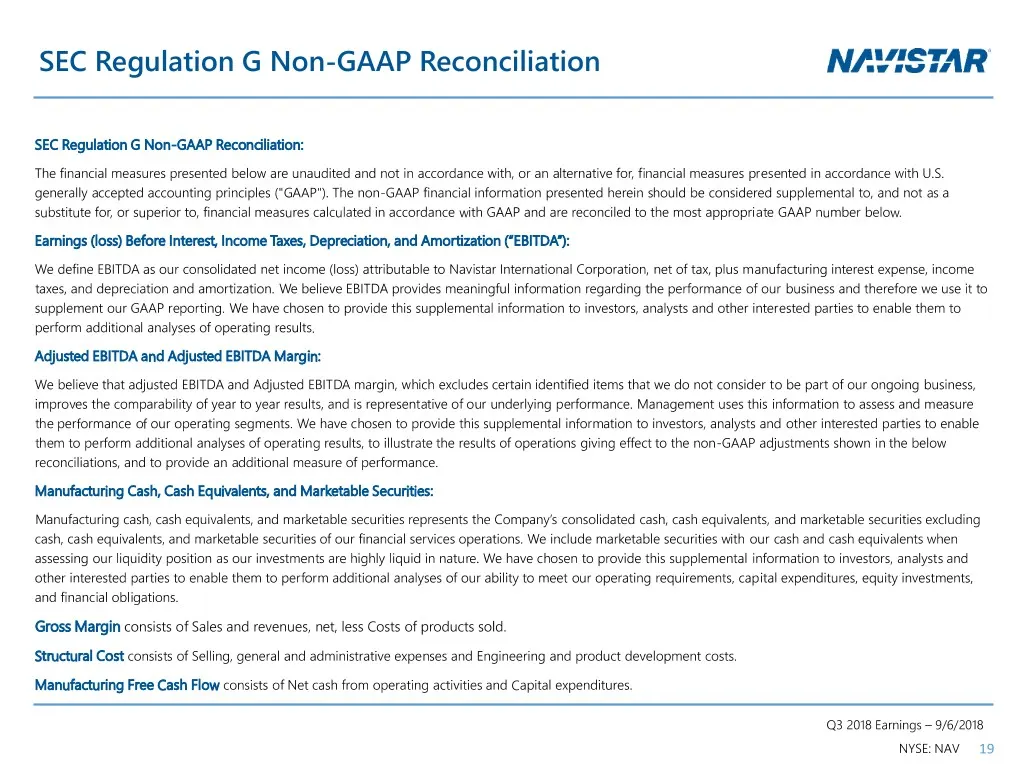
SEC Regulation G Non-GAAP Reconciliation SEC Regulation G Non-GAAP Reconciliation: The financial measures presented below are unaudited and not in accordance with, or an alternative for, financial measures presented in accordance with U.S. generally accepted accounting principles ("GAAP"). The non-G
Slide 20: SEC Regulation G Non-GAAP Reconciliation
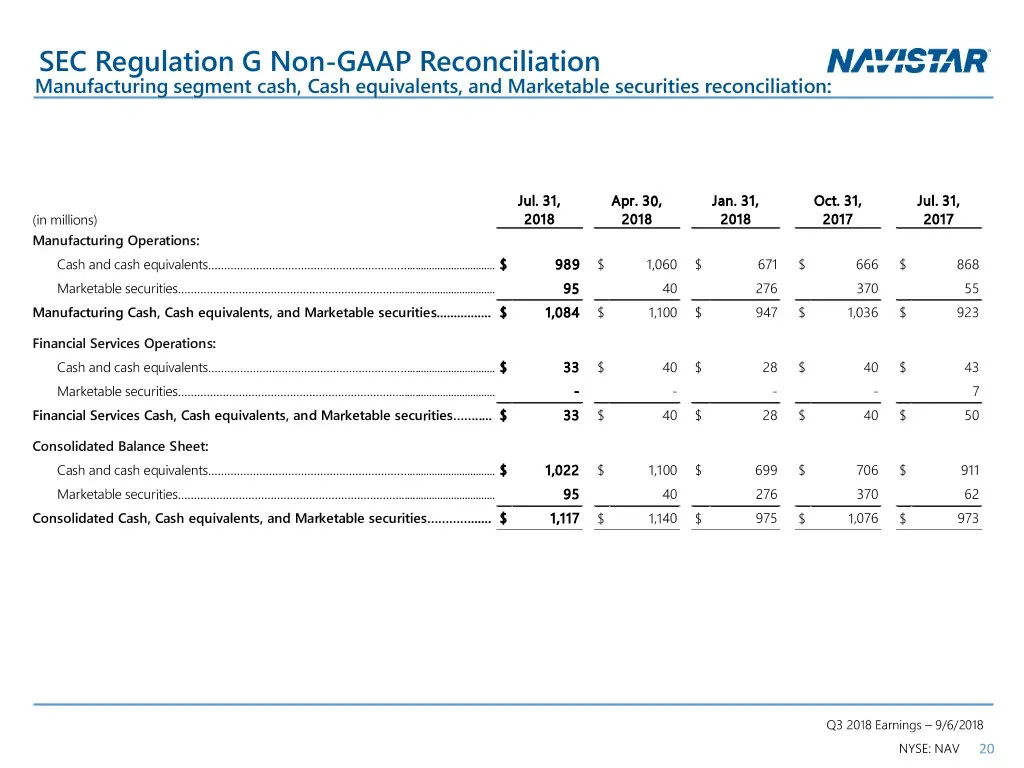
SEC Regulation G Non-GAAP Reconciliation Manufacturing segment cash, Cash equivalents, and Marketable securities reconciliation: Jul. 31, Apr. 30, Jan. 31, Oct. 31, Jul. 31, (in millions) 2018 2018 2018 2017 2017 Manufacturing Operations: Cash and cash equivalents………………………………………………………...............
Slide 21: SEC Regulation G Non-GAAP Reconciliations
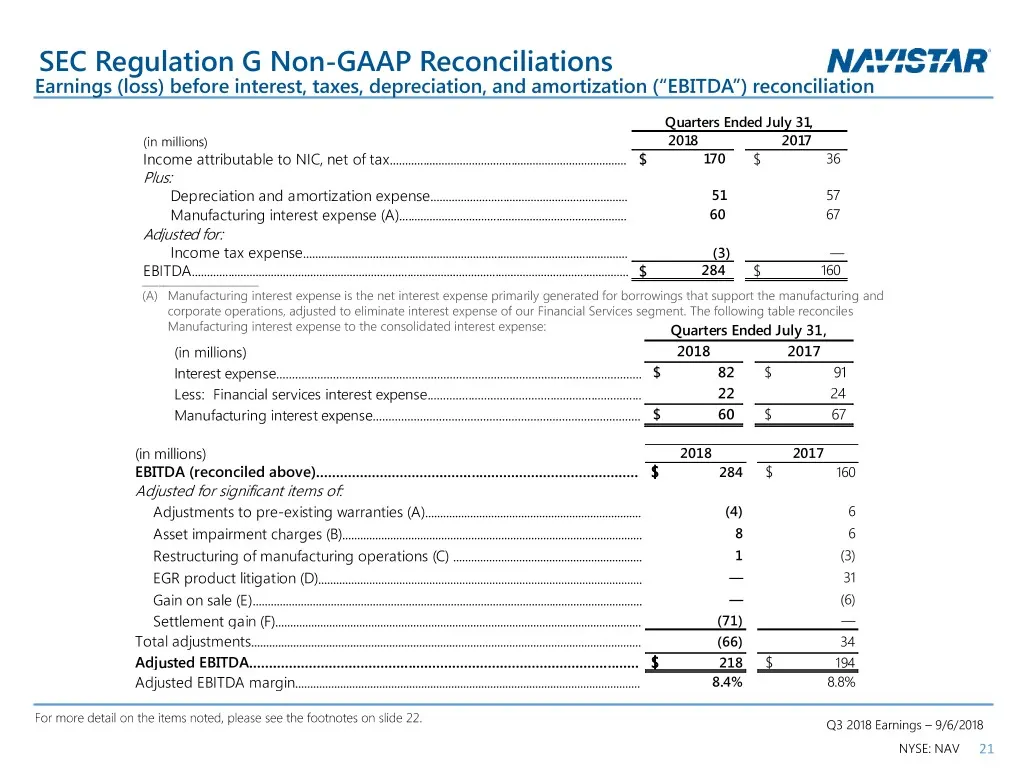
SEC Regulation G Non-GAAP Reconciliations Earnings (loss) before interest, taxes, depreciation, and amortization (“EBITDA”) reconciliation Quarters Ended July 31, (in millions) 2018 2017 Income attributable to NIC, net of tax...........................................................................
Slide 22: Significant Items Included Within Our Results
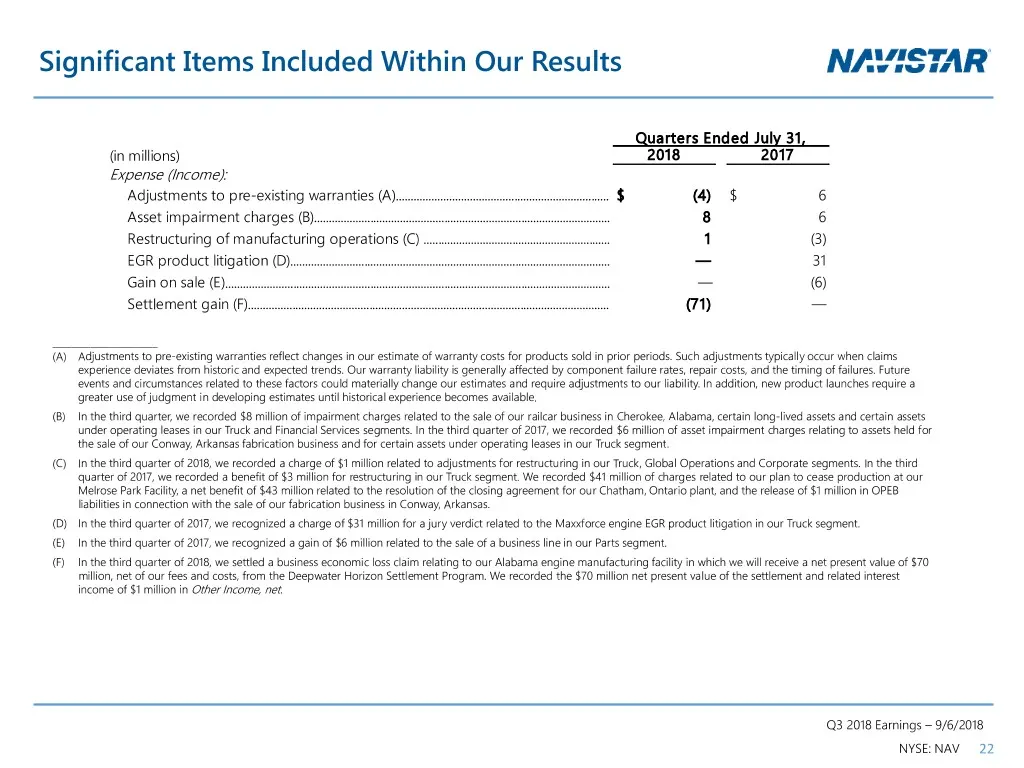
Significant Items Included Within Our Results Quarters Ended July 31, (in millions) 2018 2017 Expense (Income): Adjustments to pre-existing warranties (A)........................................................................ $ (4) $ 6 Asset impairment charges (B)...................................
Source: SEC EDGAR · 8-K filed Sep 6, 2018
More decks from Navistar International Corporation
 Q2 2021 Earnings Presentation20 slides · Jun 8, 2021
 Q1 2021 Earnings Presentation20 slides · Mar 9, 2021
 Q4 2020 Earnings Presentation22 slides · Dec 17, 2020
 Q3 2020 Earnings Presentation21 slides · Sep 9, 2020
 Q2 2020 Earnings Presentation21 slides · Jun 4, 2020
 Q1 2020 Earnings Presentation21 slides · Mar 4, 2020