Aspen Insurance Holdings Ltd · NYSE:AHL/PE
Aspen Insurance — Q1 2013 Earnings Presentation
23 slides from Aspen Insurance's earnings presentation, May 13, 2013
Slide 1: Investor Presentation First Quarter 2013
EXHIBIT 99.1 INVESTOR PRESENTATION FIRST QUARTER 2013 Aspen Insurance Holdings Limited
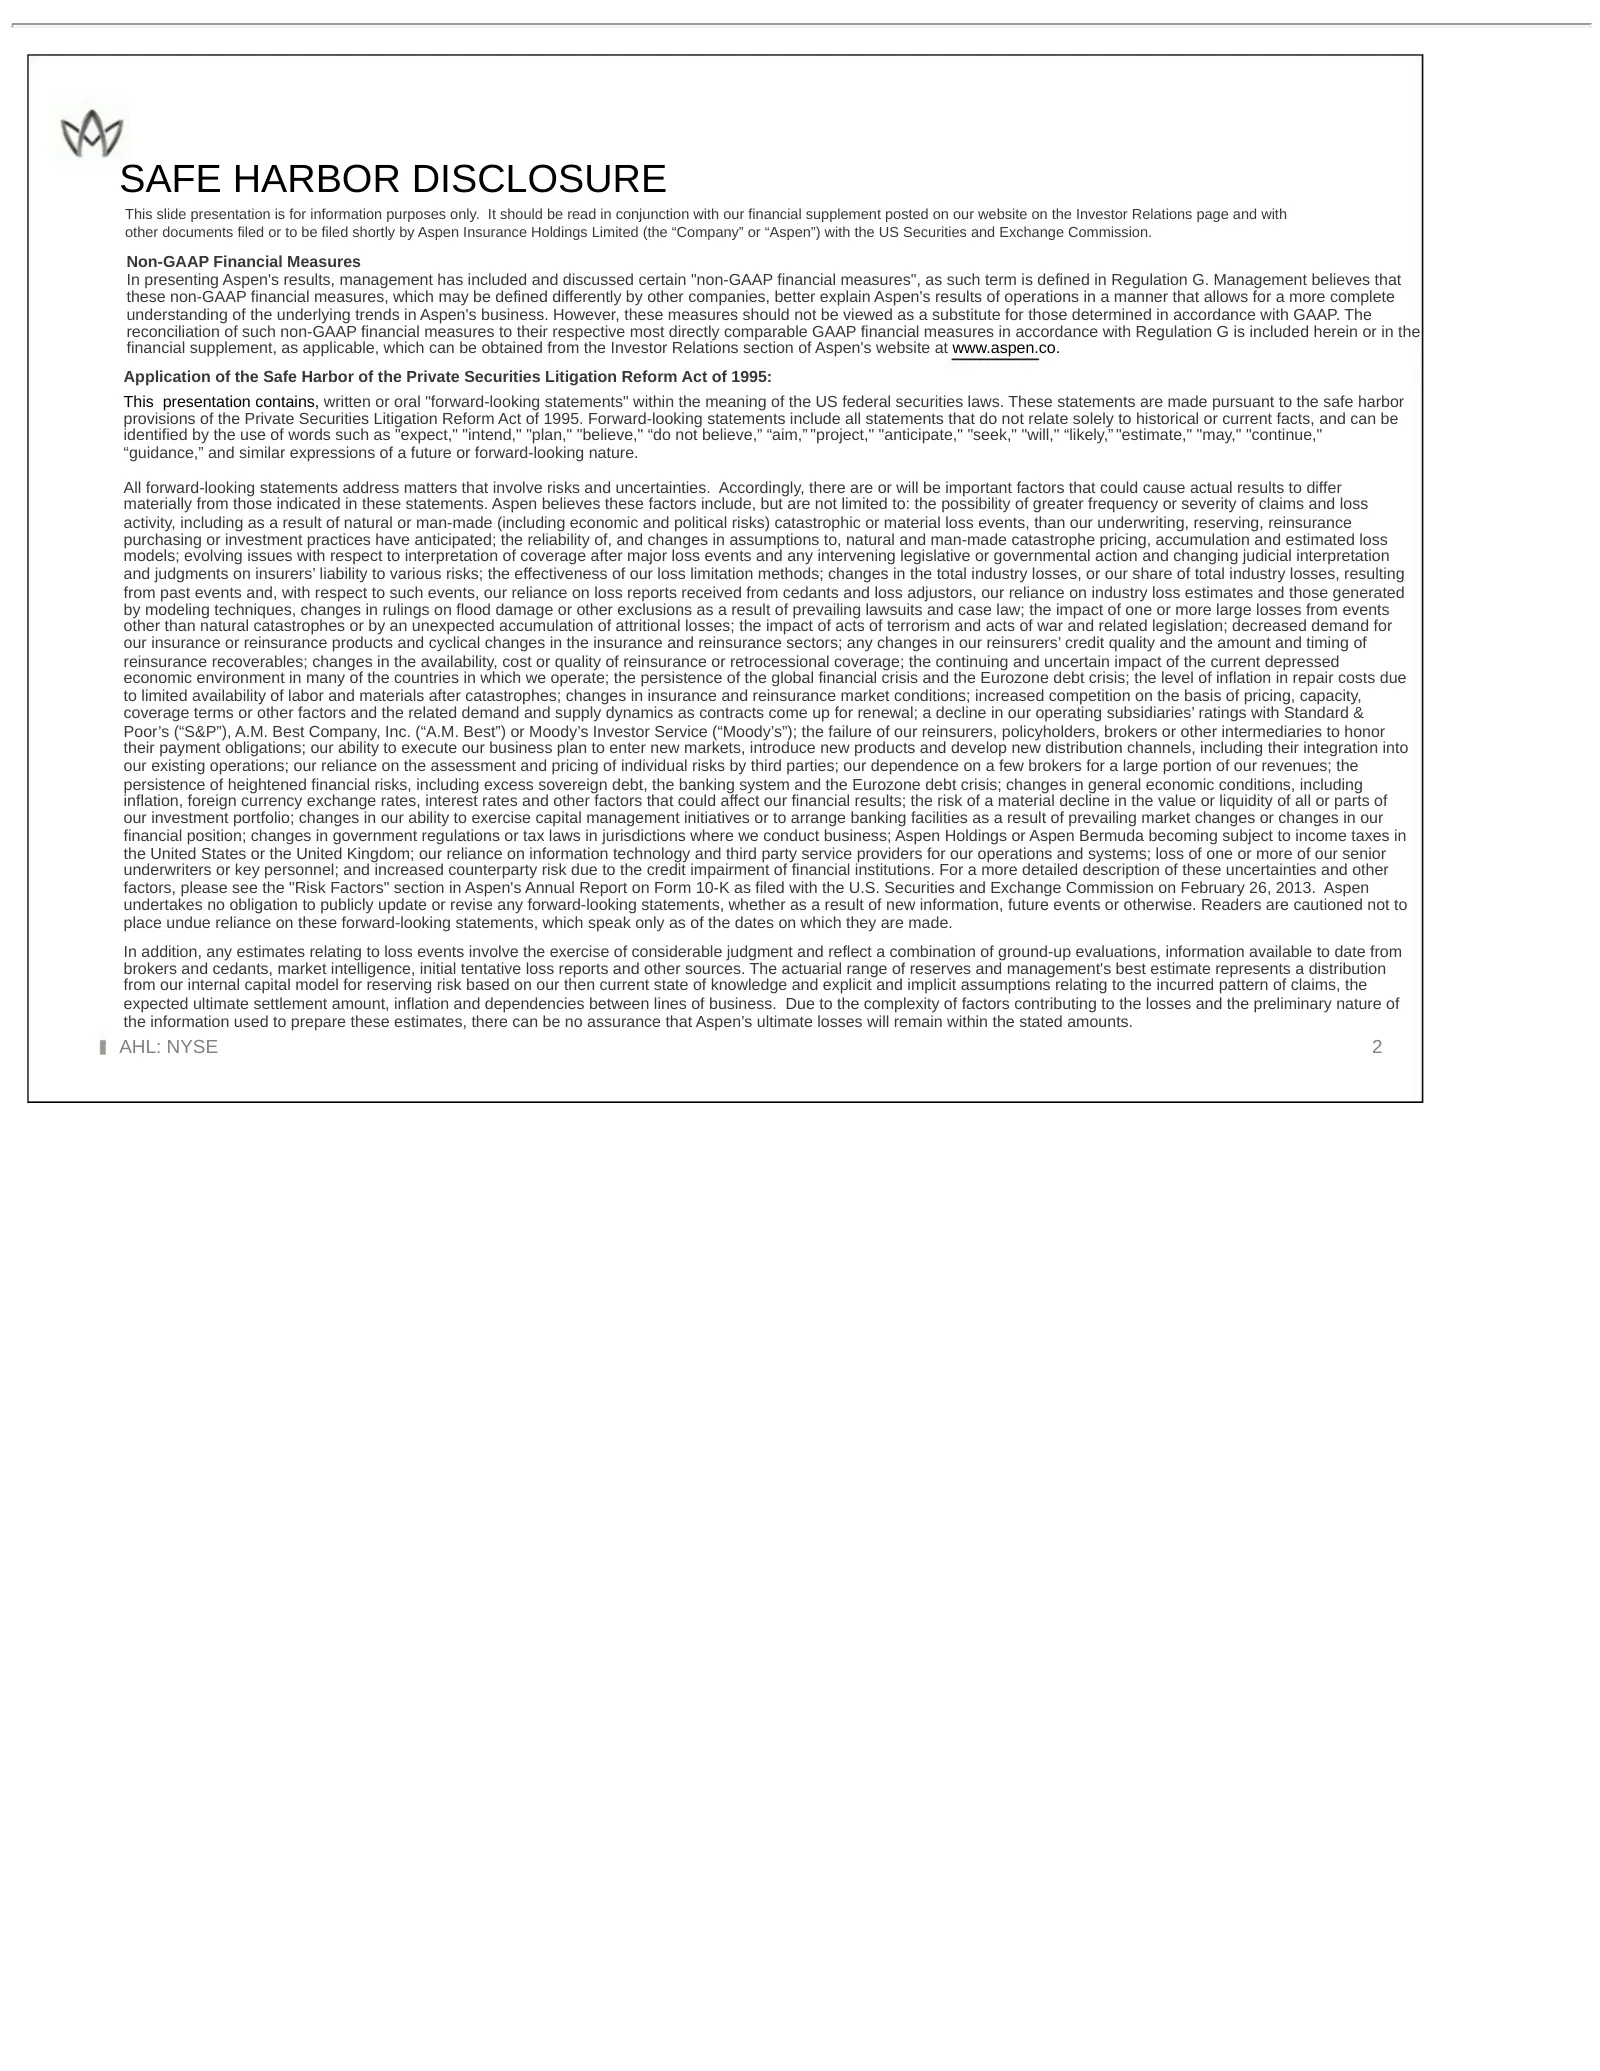
Slide 2: Safe Harbor Disclosure
SAFE HARBOR DISCLOSURE This slide presentation is for information purposes only. It should be read in conjunction with our financial supplement posted on our website on the Investor Relations page and with other documents filed or to be filed shortly by Aspen Insurance Holdings Limited (the “Company
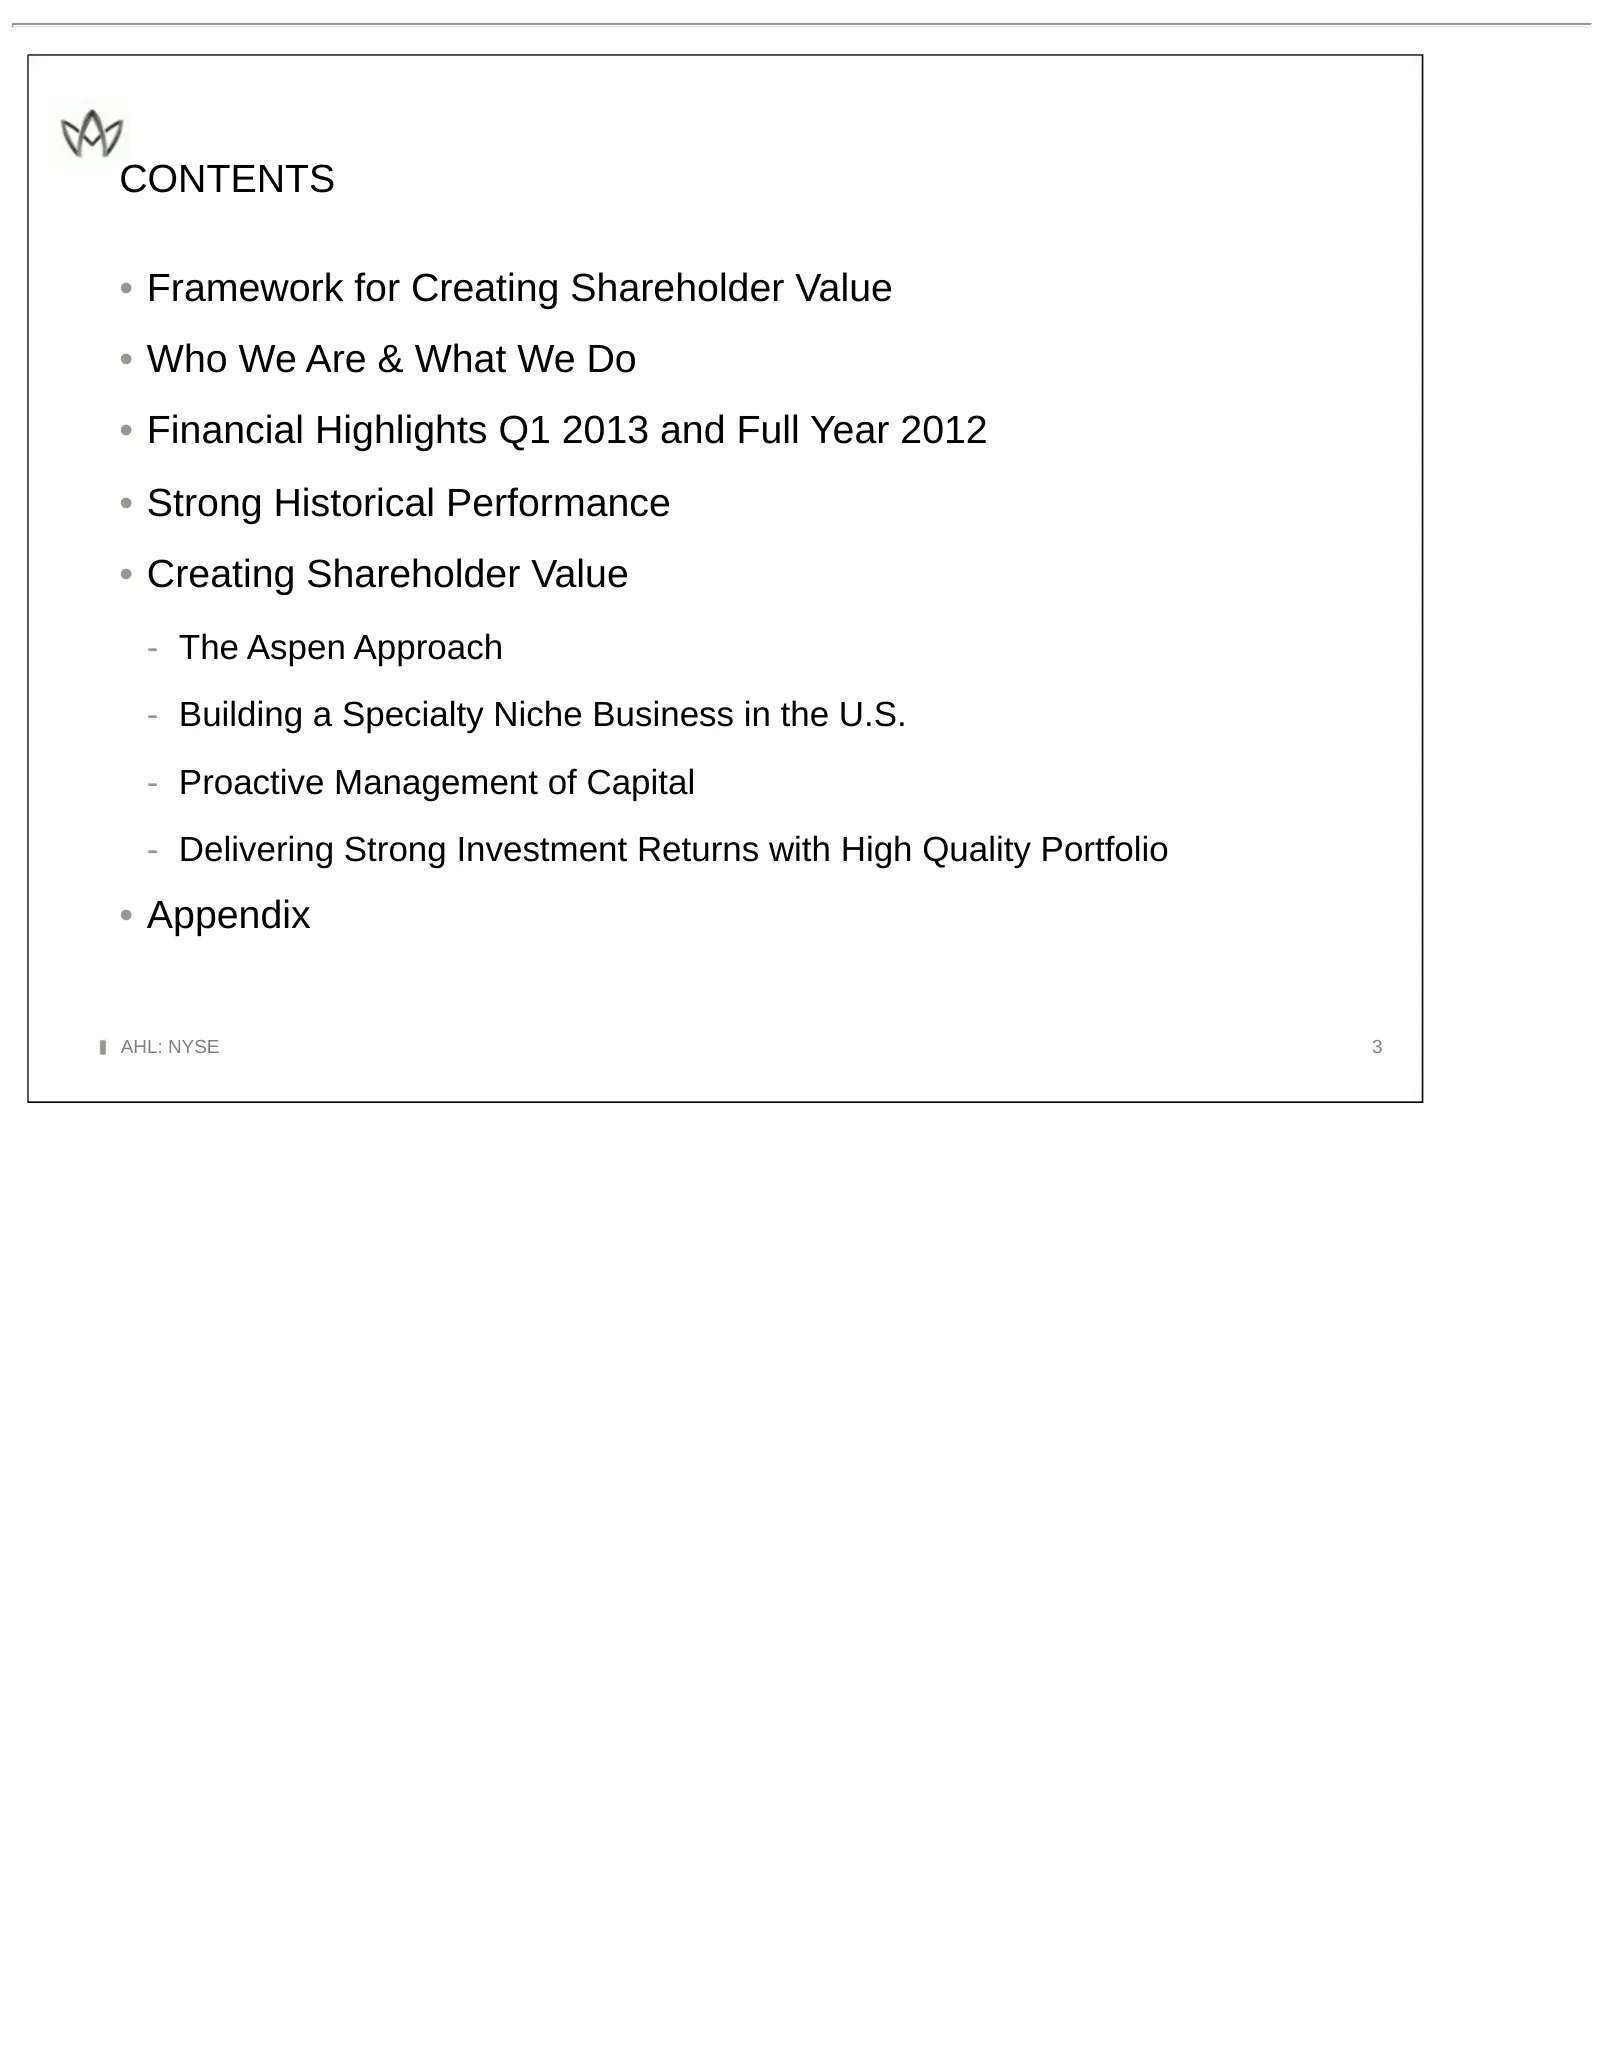
Slide 3: Contents
CONTENTS • Framework for Creating Shareholder Value • Who We Are & What We Do • Financial Highlights Q1 2013 and Full Year 2012 • Strong Historical Performance • Creating Shareholder Value - The Aspen Approach - Building a Specialty Niche Business in the U.S. - Proactive Management of Capital - Deli
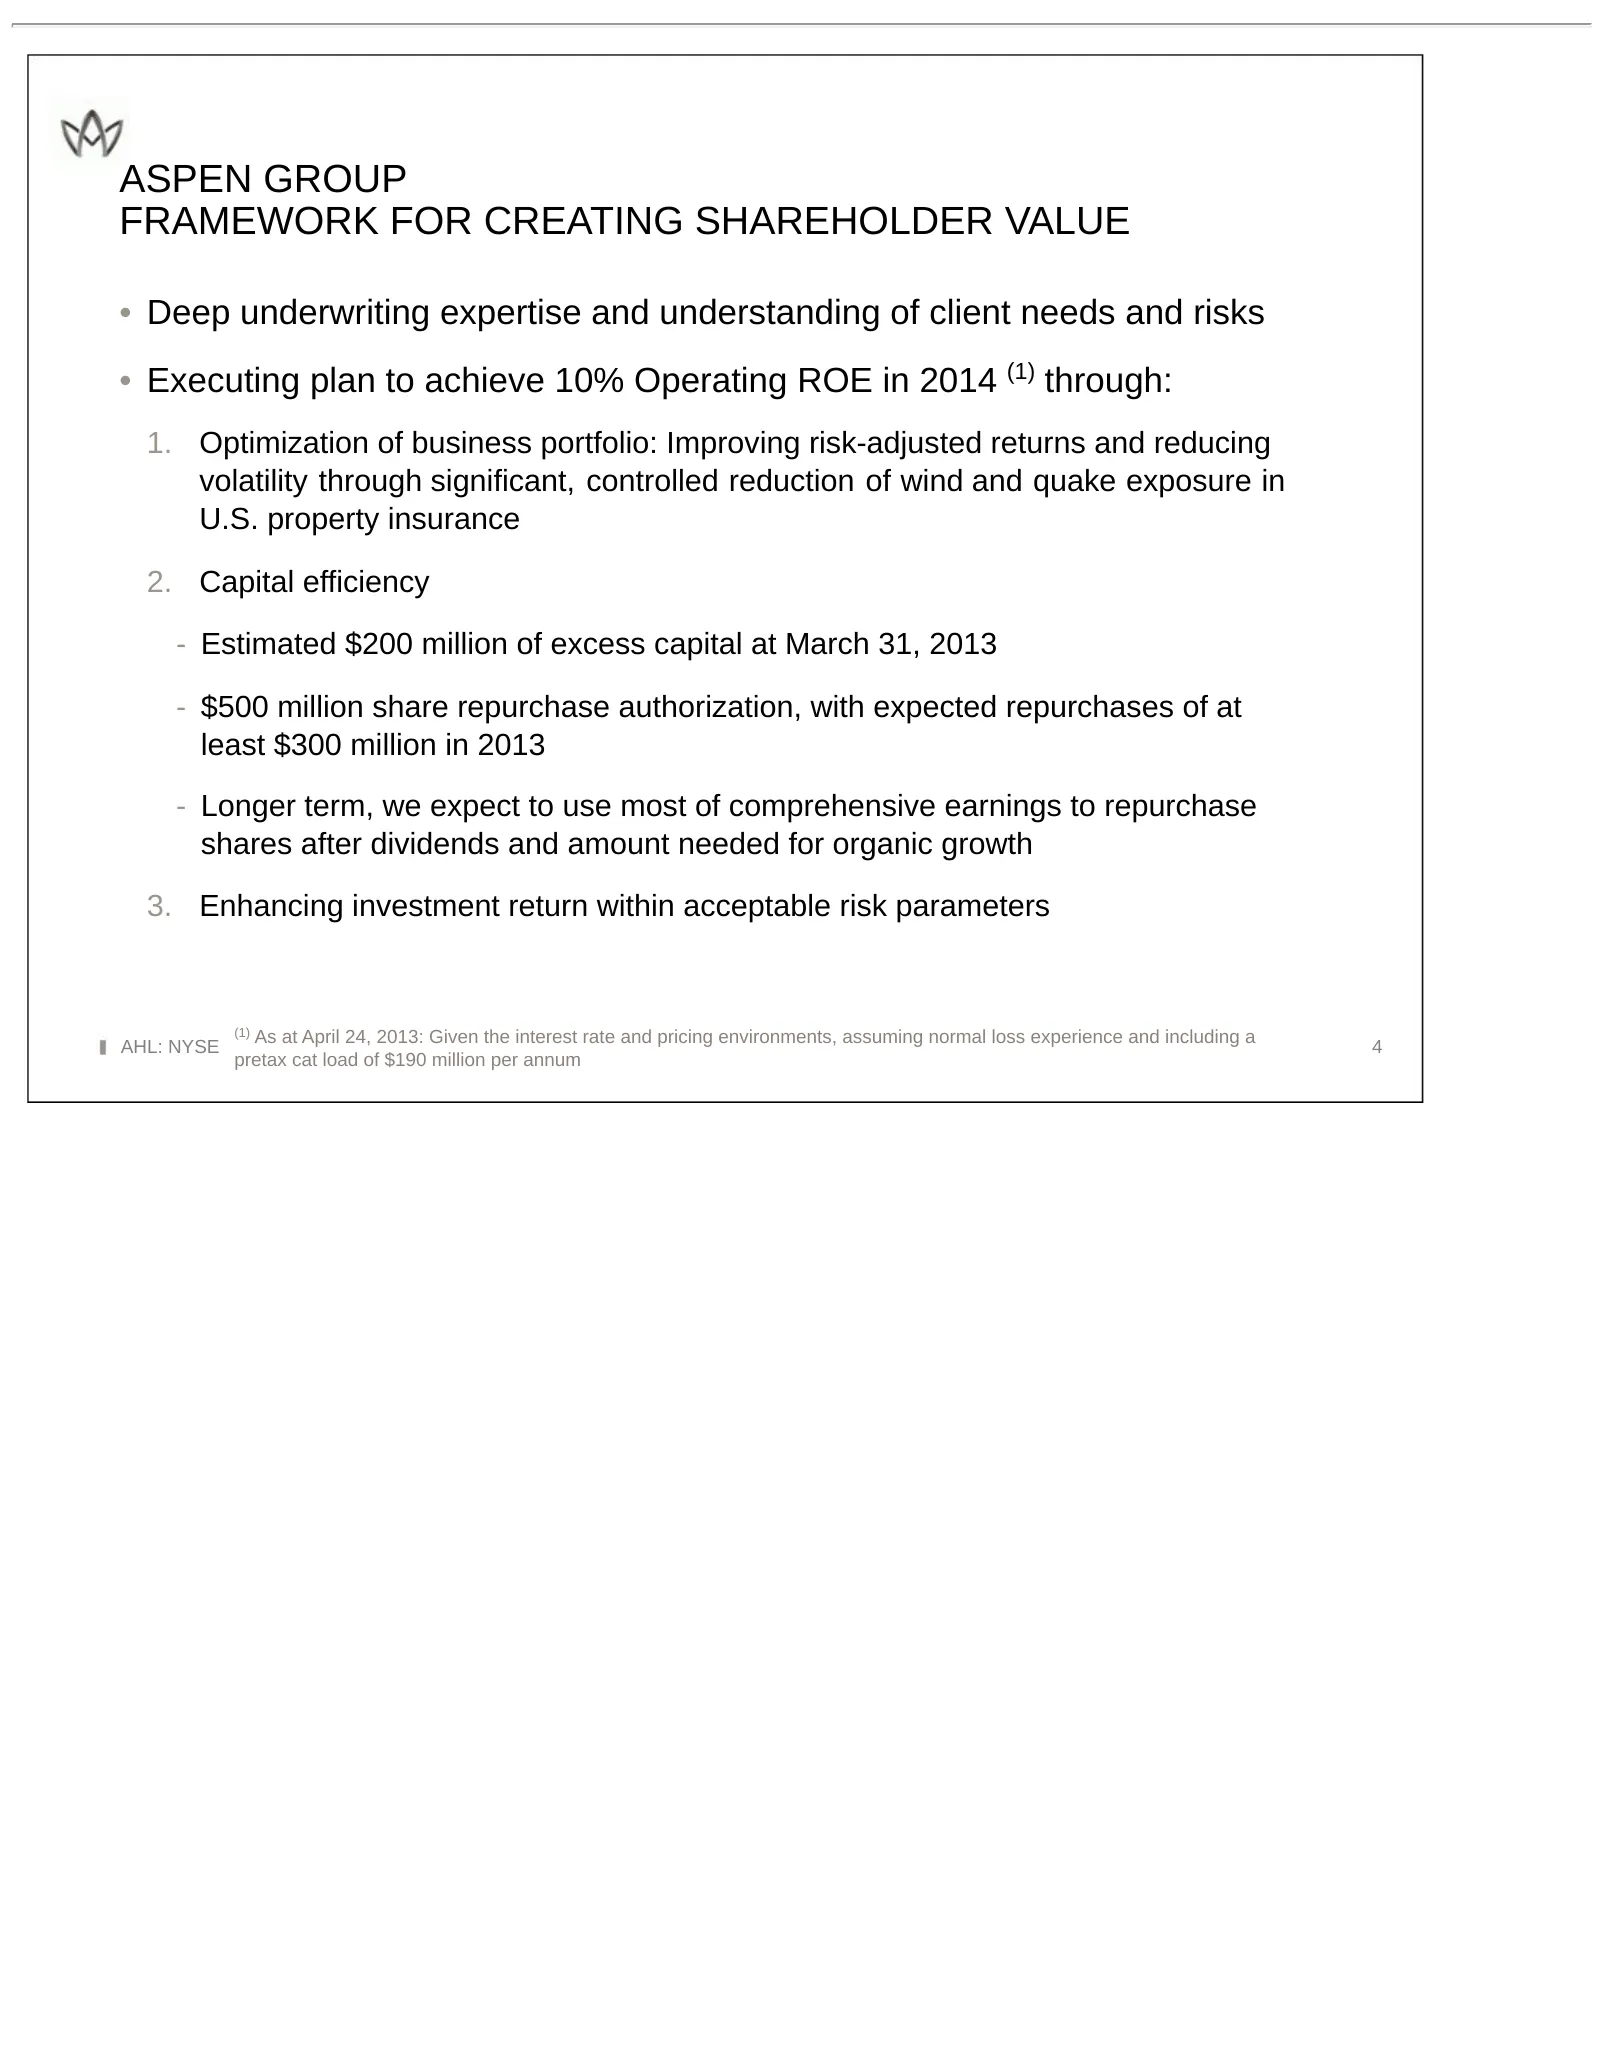
Slide 4: Aspen Group Framework for Creating Shareholder Value
ASPEN GROUP FRAMEWORK FOR CREATING SHAREHOLDER VALUE • Deep underwriting expertise and understanding of client needs and risks • Executing plan to achieve 10% Operating ROE in 2014 (1) through: 1. Optimization of business portfolio: Improving risk-adjusted returns and reducing volatility through sig
Slide 5: Who We Are
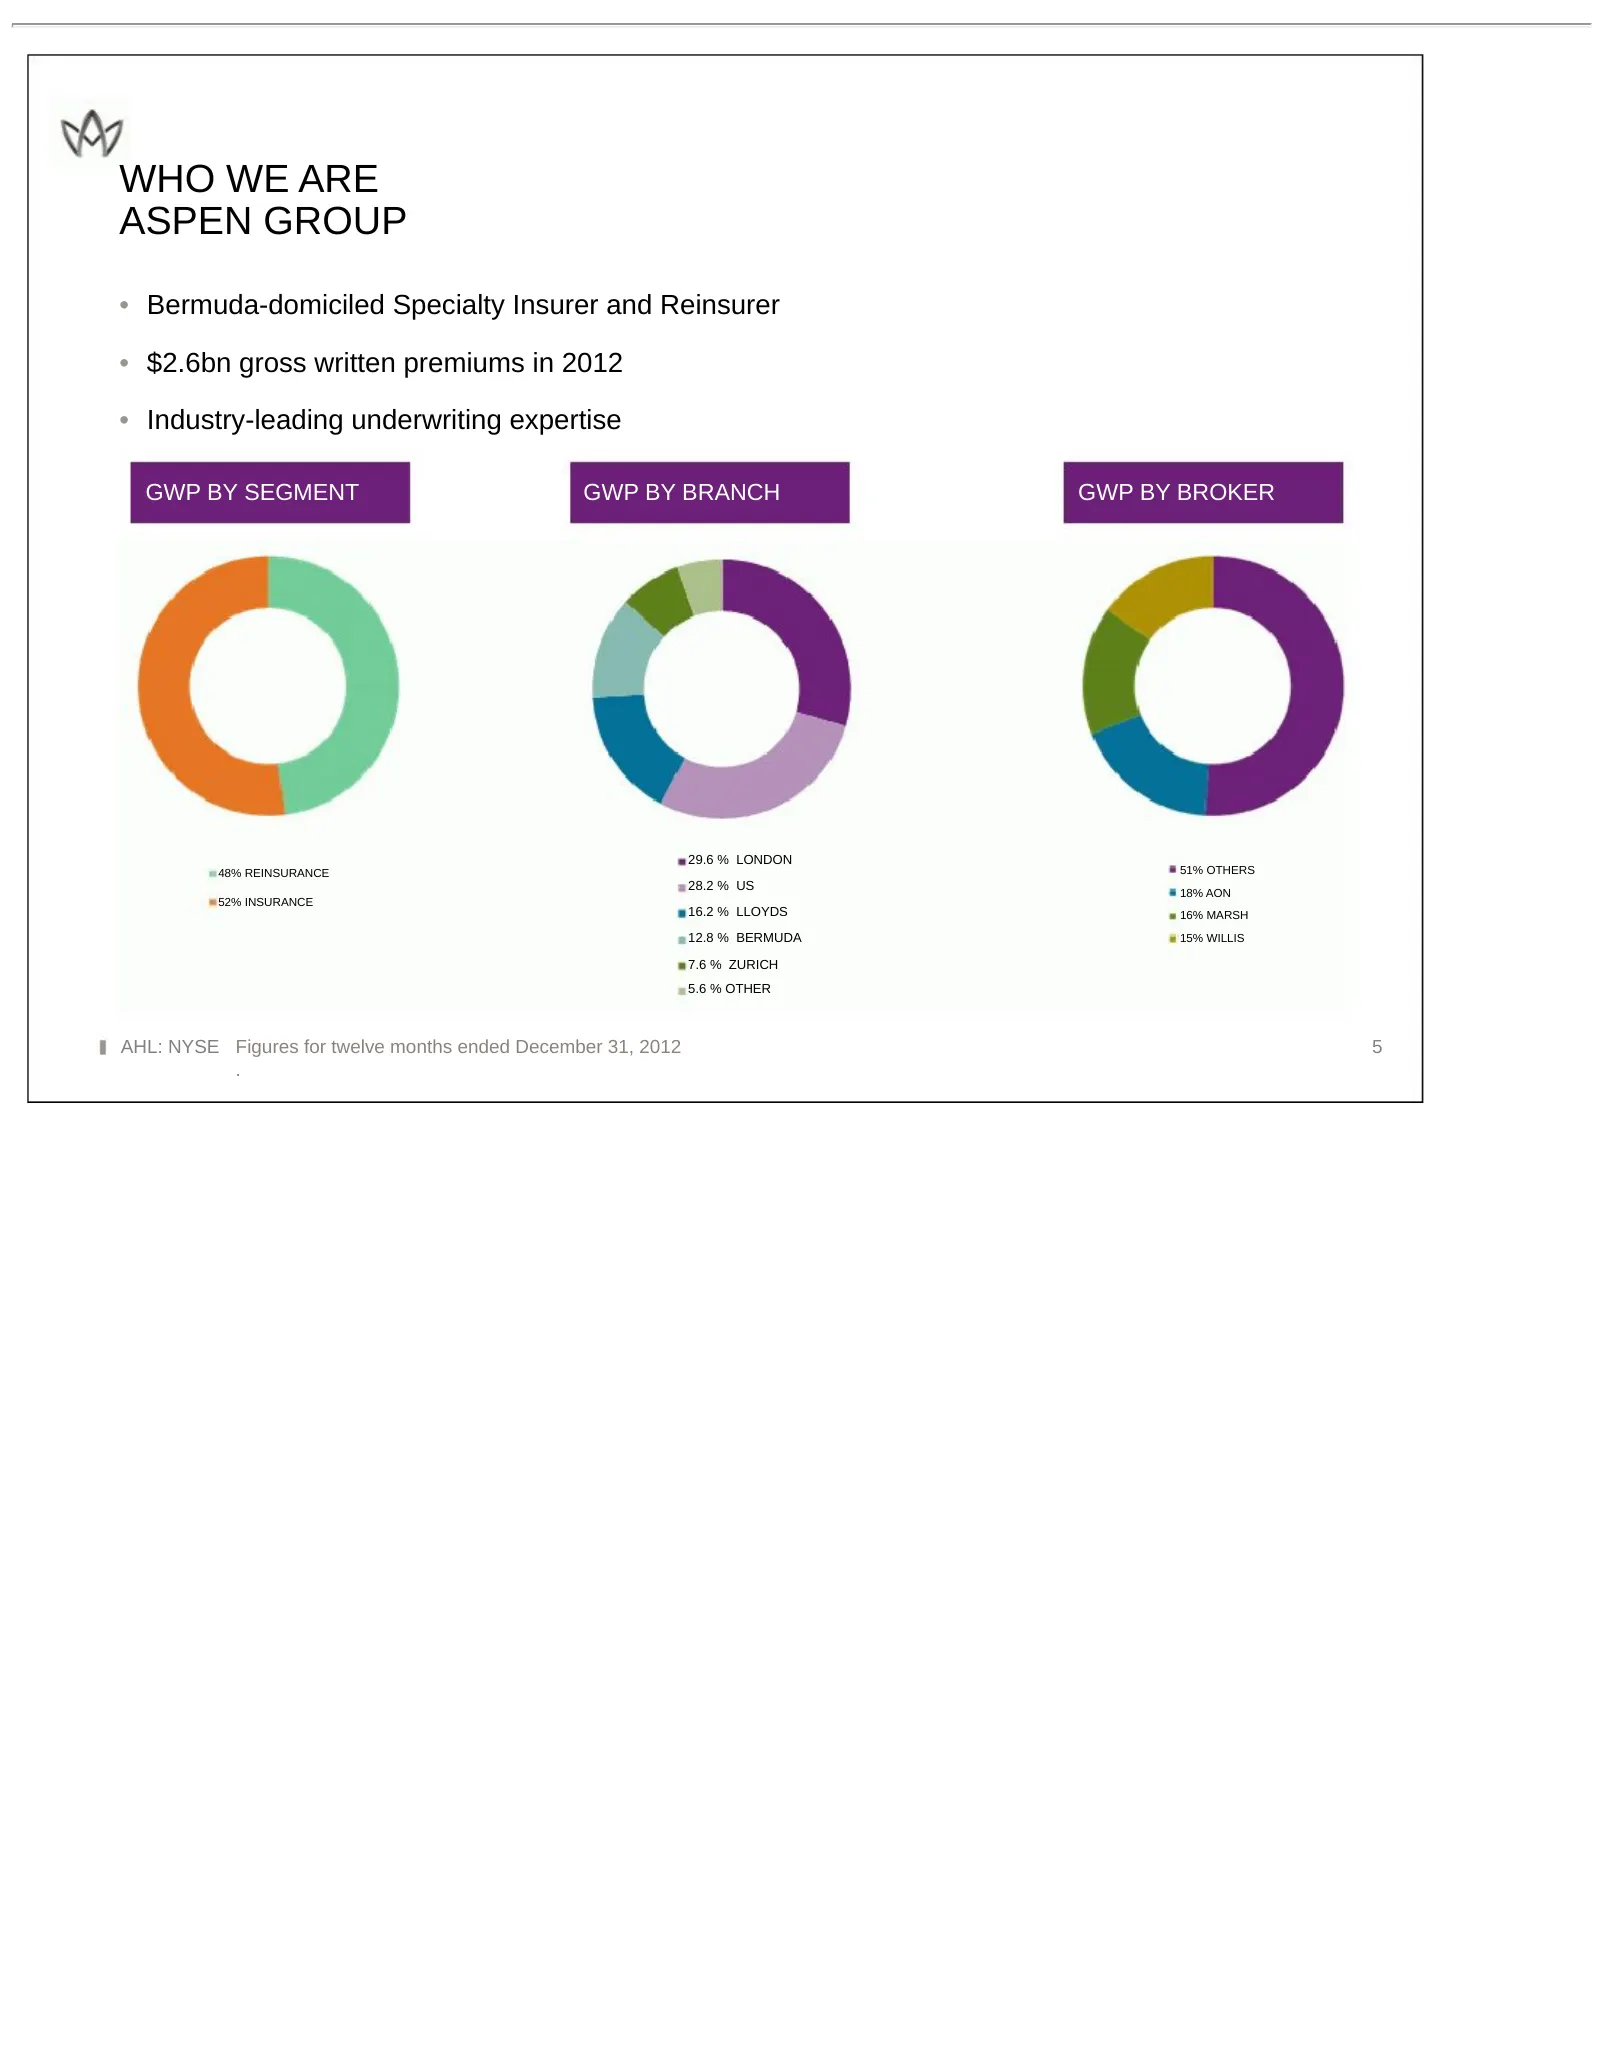
WHO WE ARE ASPEN GROUP • Bermuda-domiciled Specialty Insurer and Reinsurer • $2.6bn gross written premiums in 2012 • Industry-leading underwriting expertise GWP BY SEGMENT GWP BY BRANCH GWP BY BROKER 29.6 % LONDON 48% REINSURANCE 51% OTHERS 28.2 % US 18% AON 52% INSURANCE 16.2 % LLOYDS 16% MARSH 12.
Slide 6: What We Do: Reinsurance
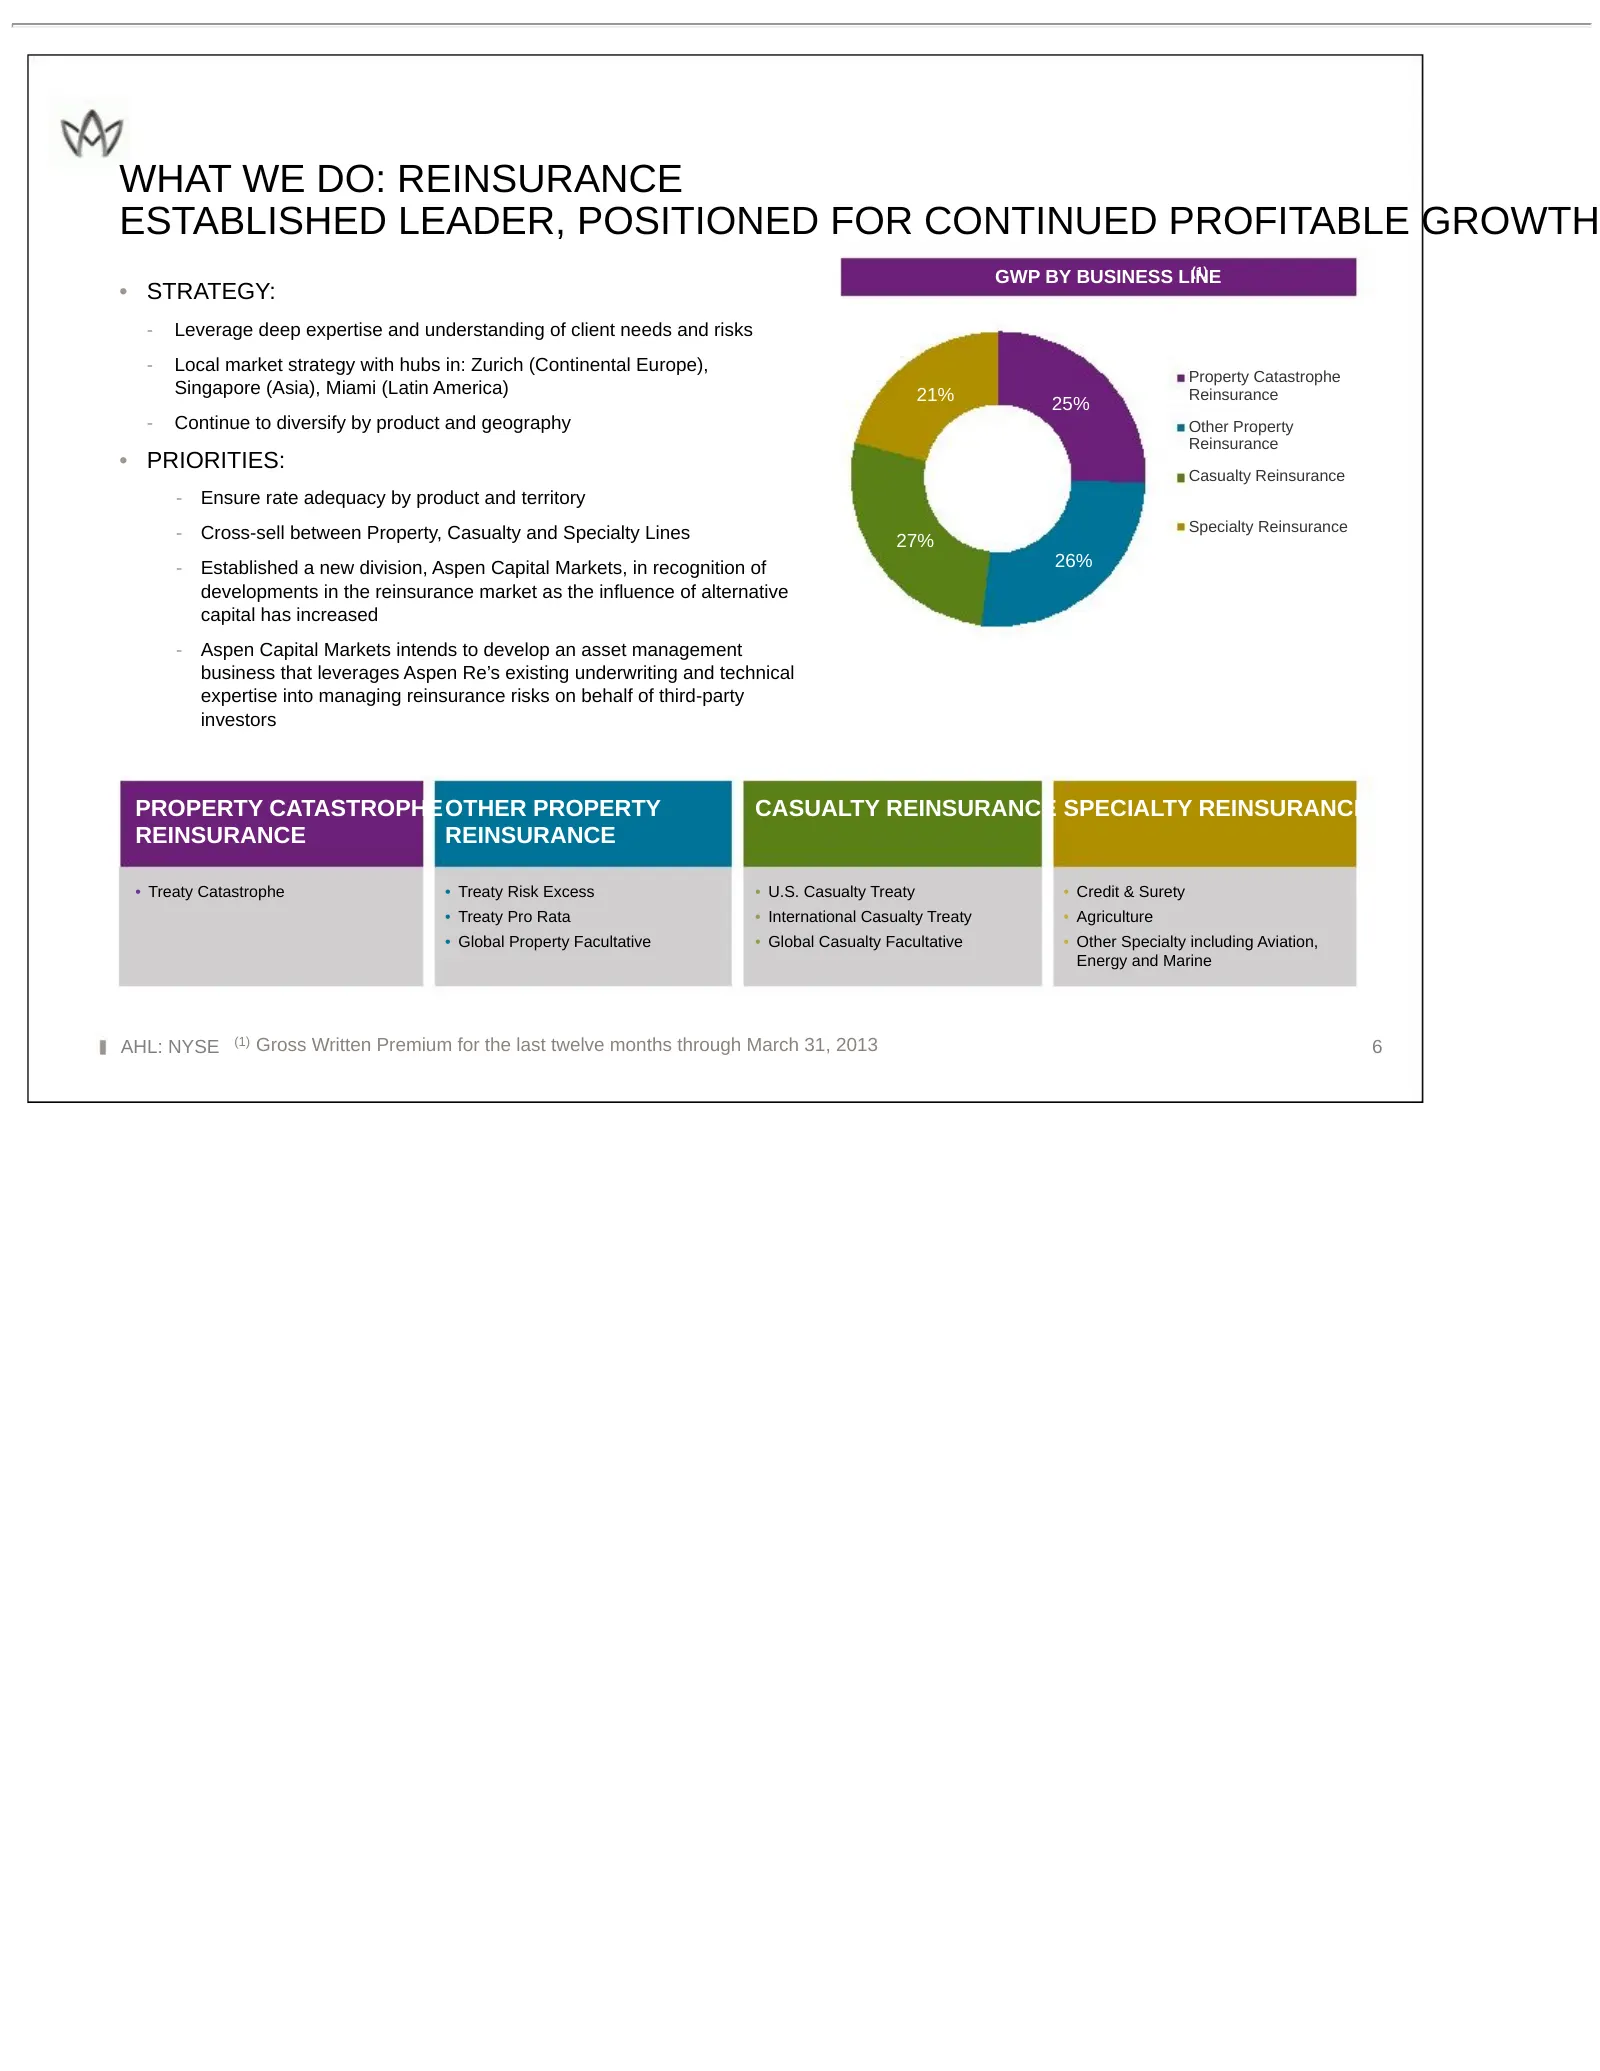
WHAT WE DO: REINSURANCE ESTABLISHED LEADER, POSITIONED FOR CONTINUED PROFITABLE GROWTH (1) GWP BY BUSINESS LINE • STRATEGY: - Leverage deep expertise and understanding of client needs and risks - Local market strategy with hubs in: Zurich (Continental Europe), Property Catastrophe Singapore (Asia),
Slide 7: What We Do: Insurance
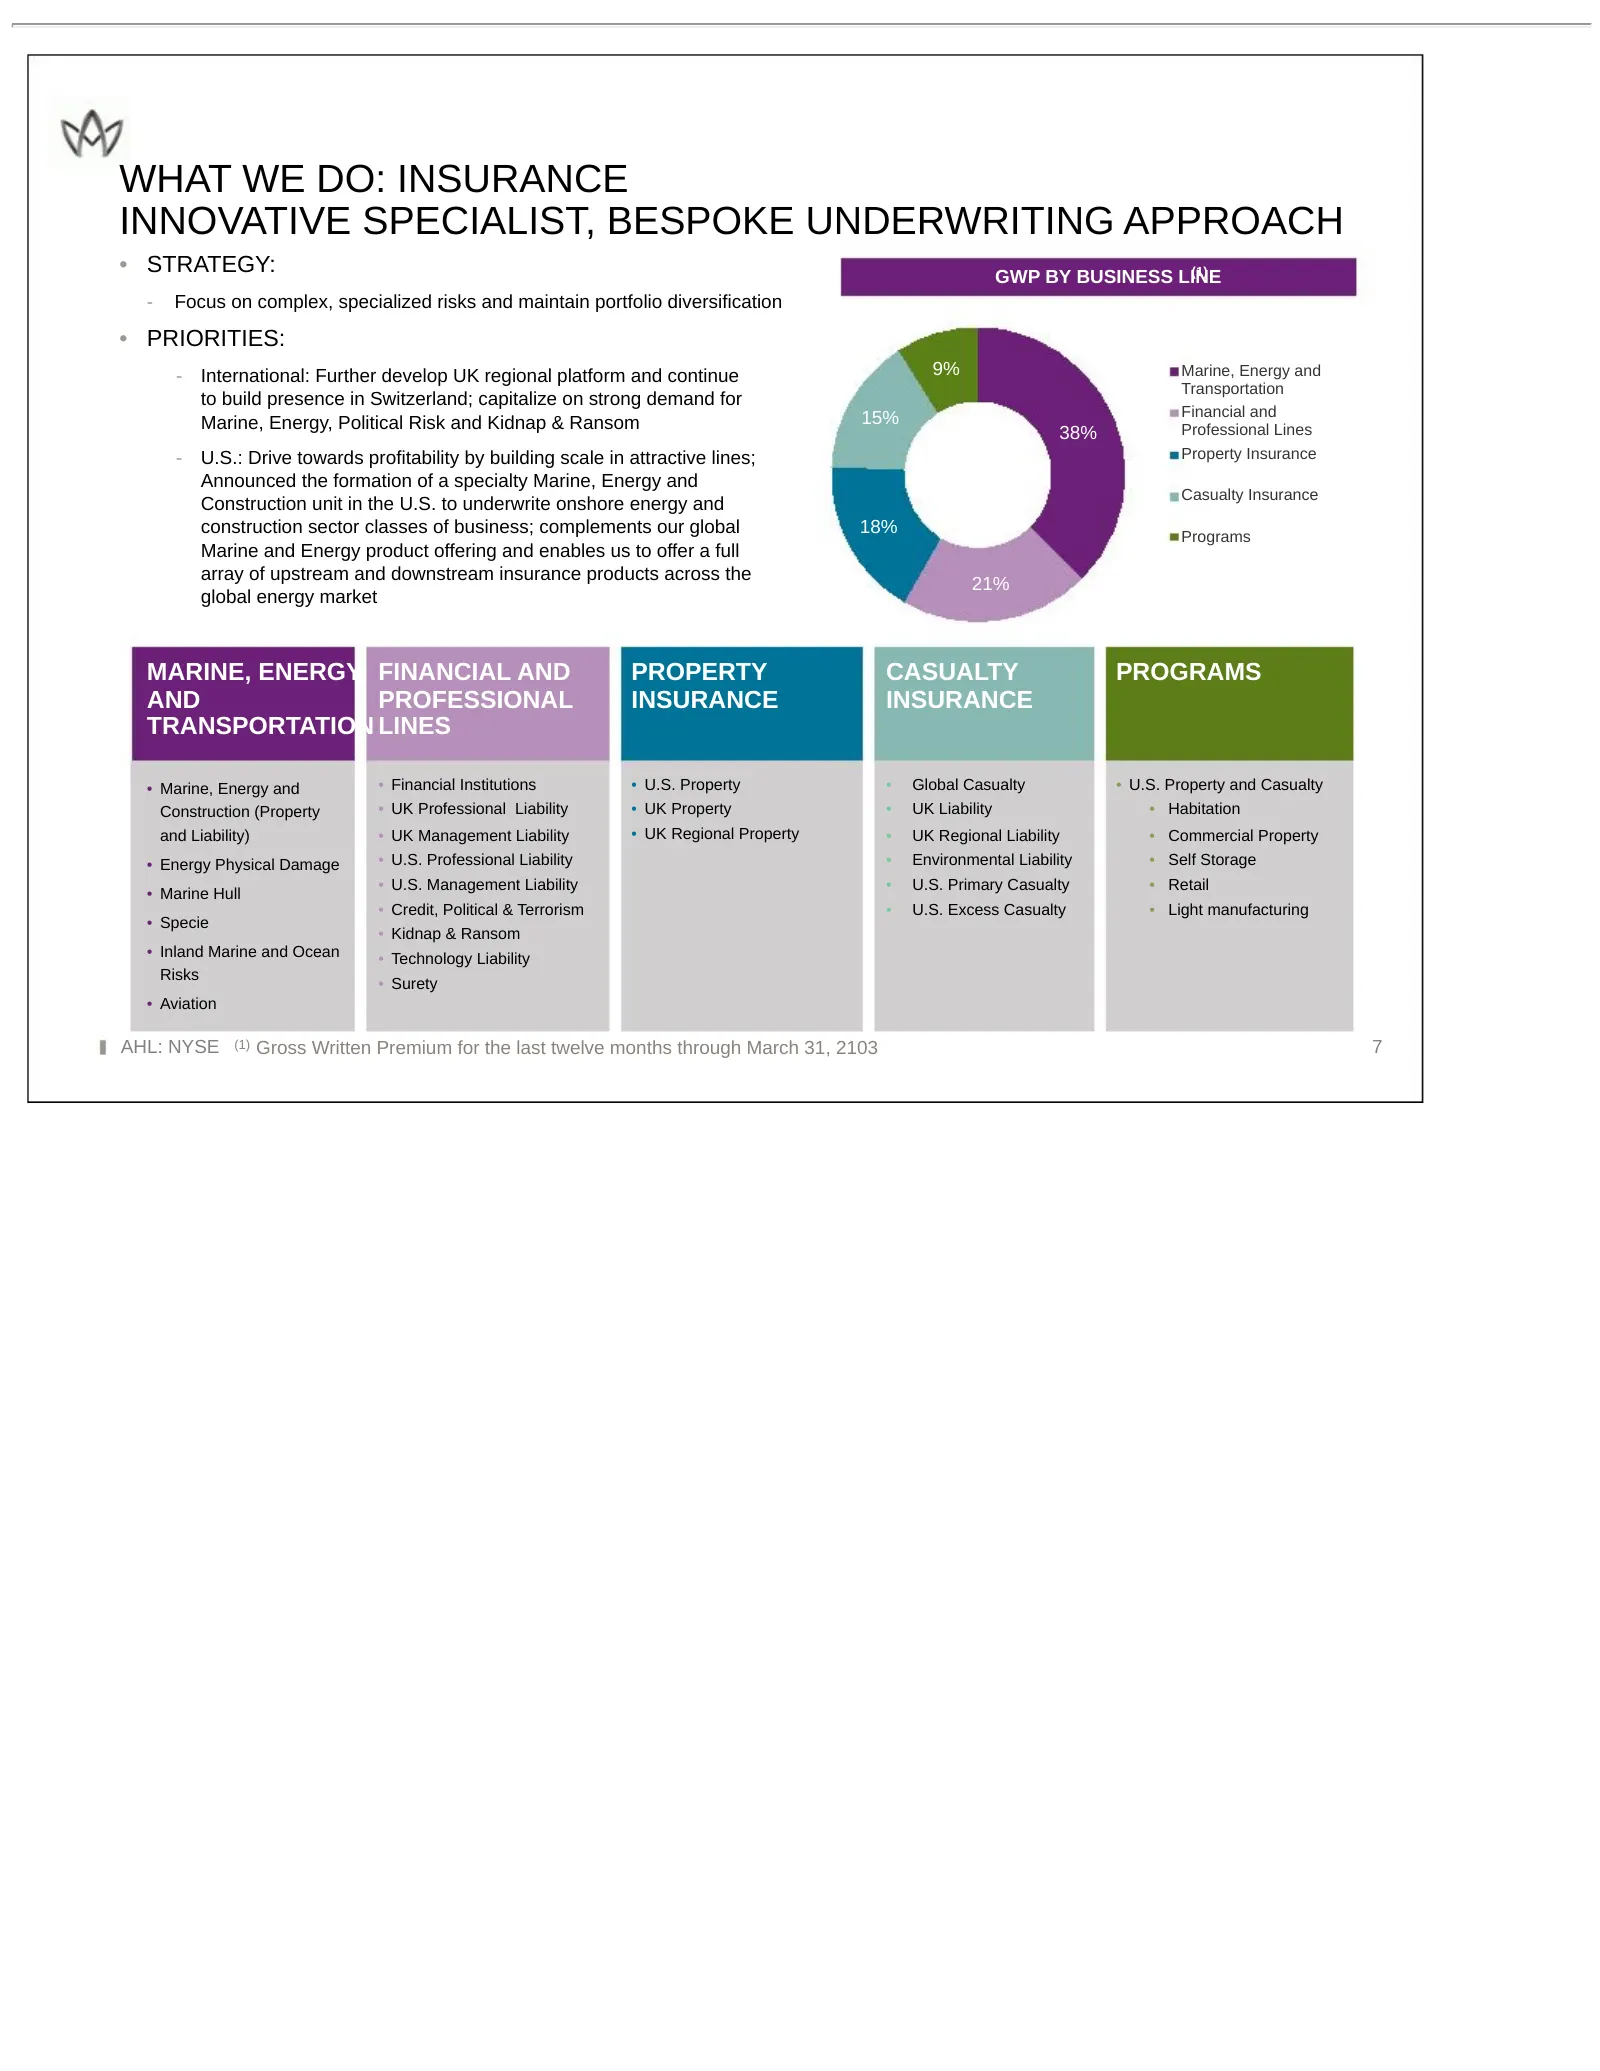
WHAT WE DO: INSURANCE INNOVATIVE SPECIALIST, BESPOKE UNDERWRITING APPROACH • STRATEGY: (1) GWP BY BUSINESS LINE - Focus on complex, specialized risks and maintain portfolio diversification • PRIORITIES: - International: Further develop UK regional platform and continue 9% Marine, Energy and Transpor
Slide 8: Financial Highlights: First Quarter 2013
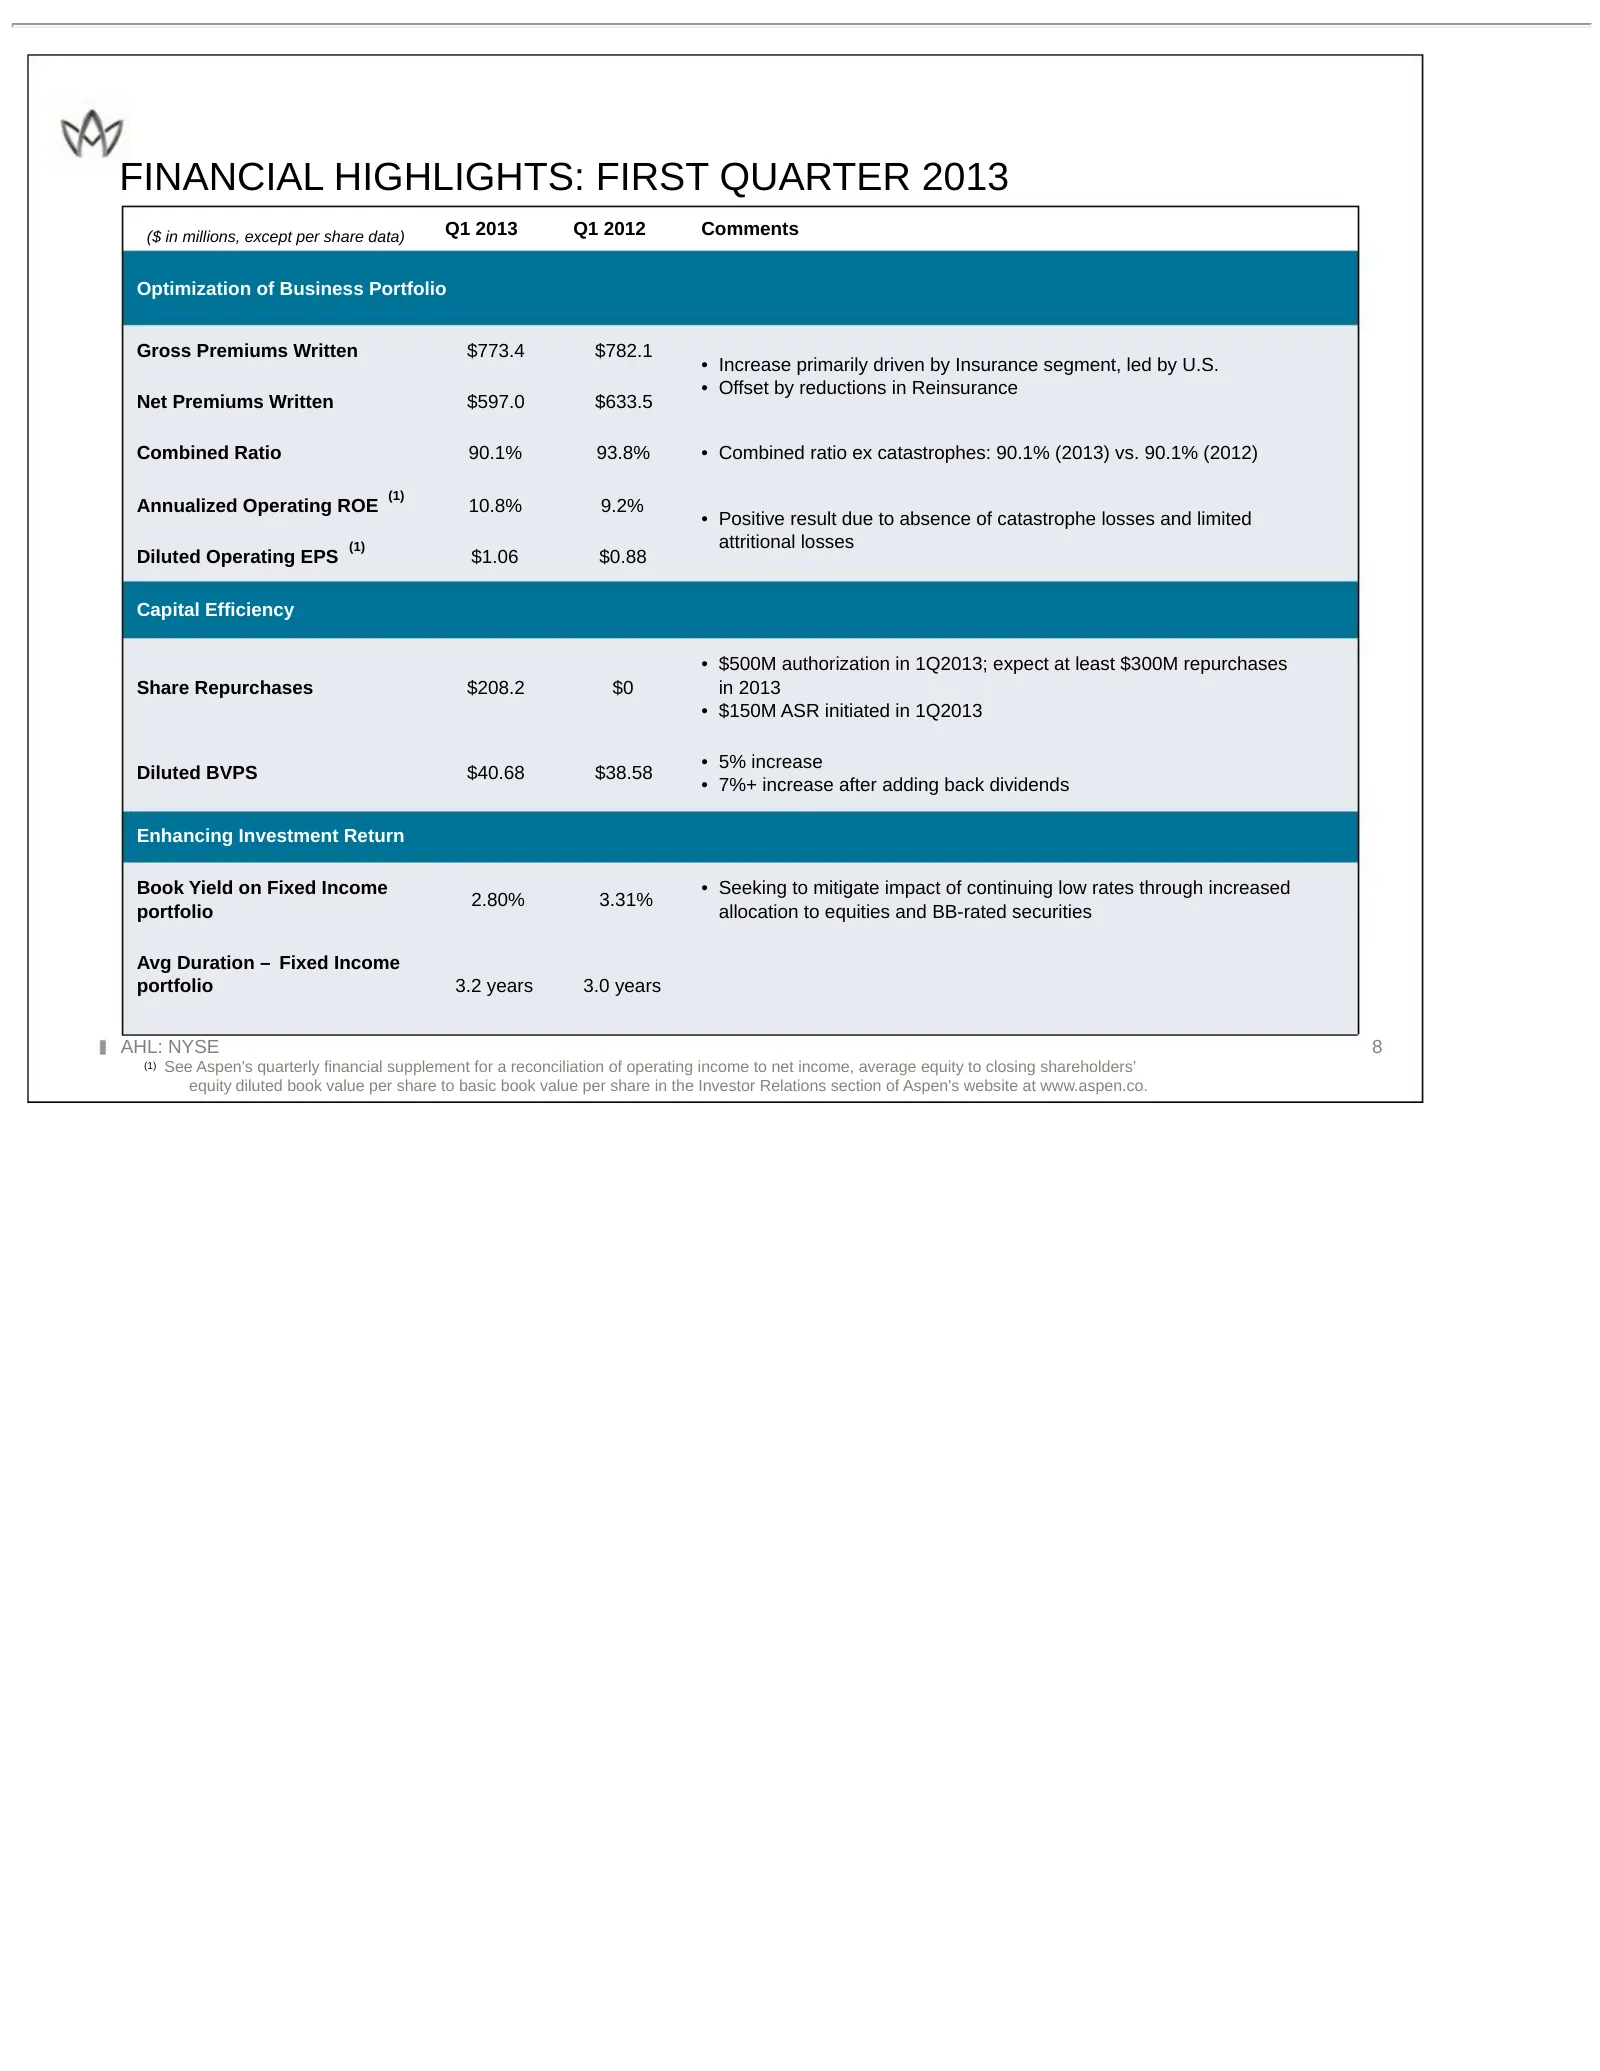
FINANCIAL HIGHLIGHTS: FIRST QUARTER 2013 ($ in millions, except per share data) Q1 2013 Q1 2012 Comments Optimization of Business Portfolio Gross Premiums Written $773.4 $782.1 • Increase primarily driven by Insurance segment, led by U.S. • Offset by reductions in Reinsurance Net Premiums Written $5
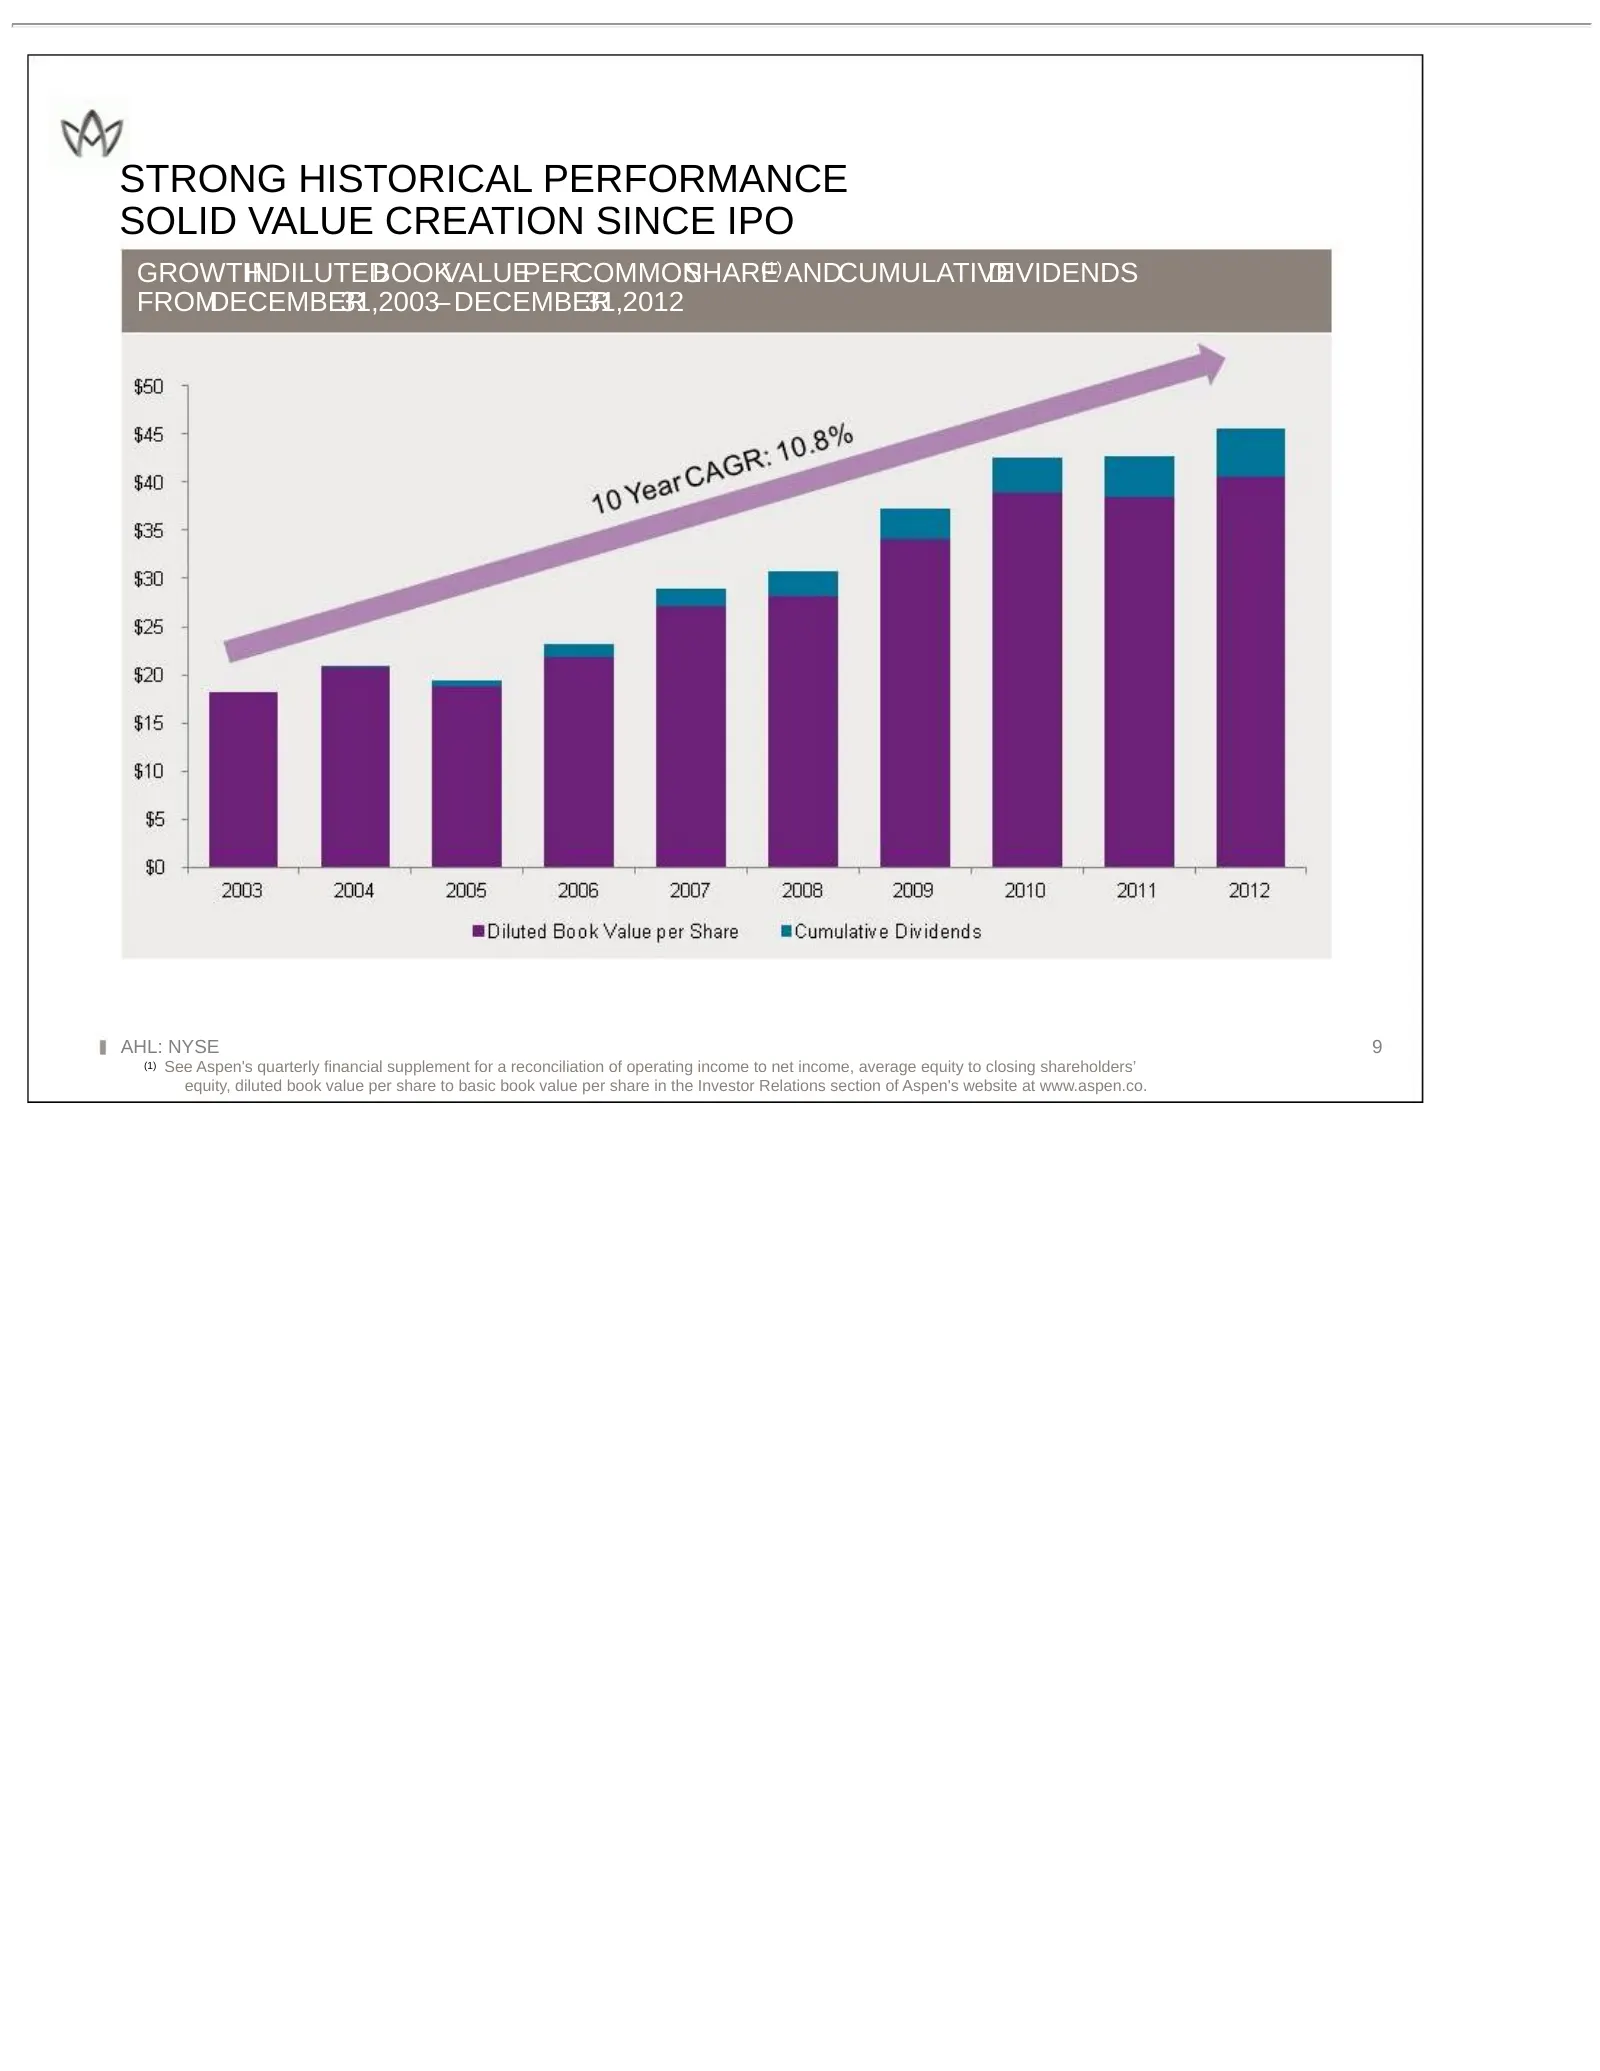
Slide 9: Strong Historical Performance: Solid Value Creation Since IPO
STRONG HISTORICAL PERFORMANCE SOLID VALUE CREATION SINCE IPO GROWTHINDILUTED BOOKVALUEPERCOMMON SHARE (1) ANDCUMULATIVE DIVIDENDS FROMDECEMBER31,2003– DECEMBER 31,2012 AHL: NYSE 9 (1) See Aspen's quarterly financial supplement for a reconciliation of operating income to net income, average equity to
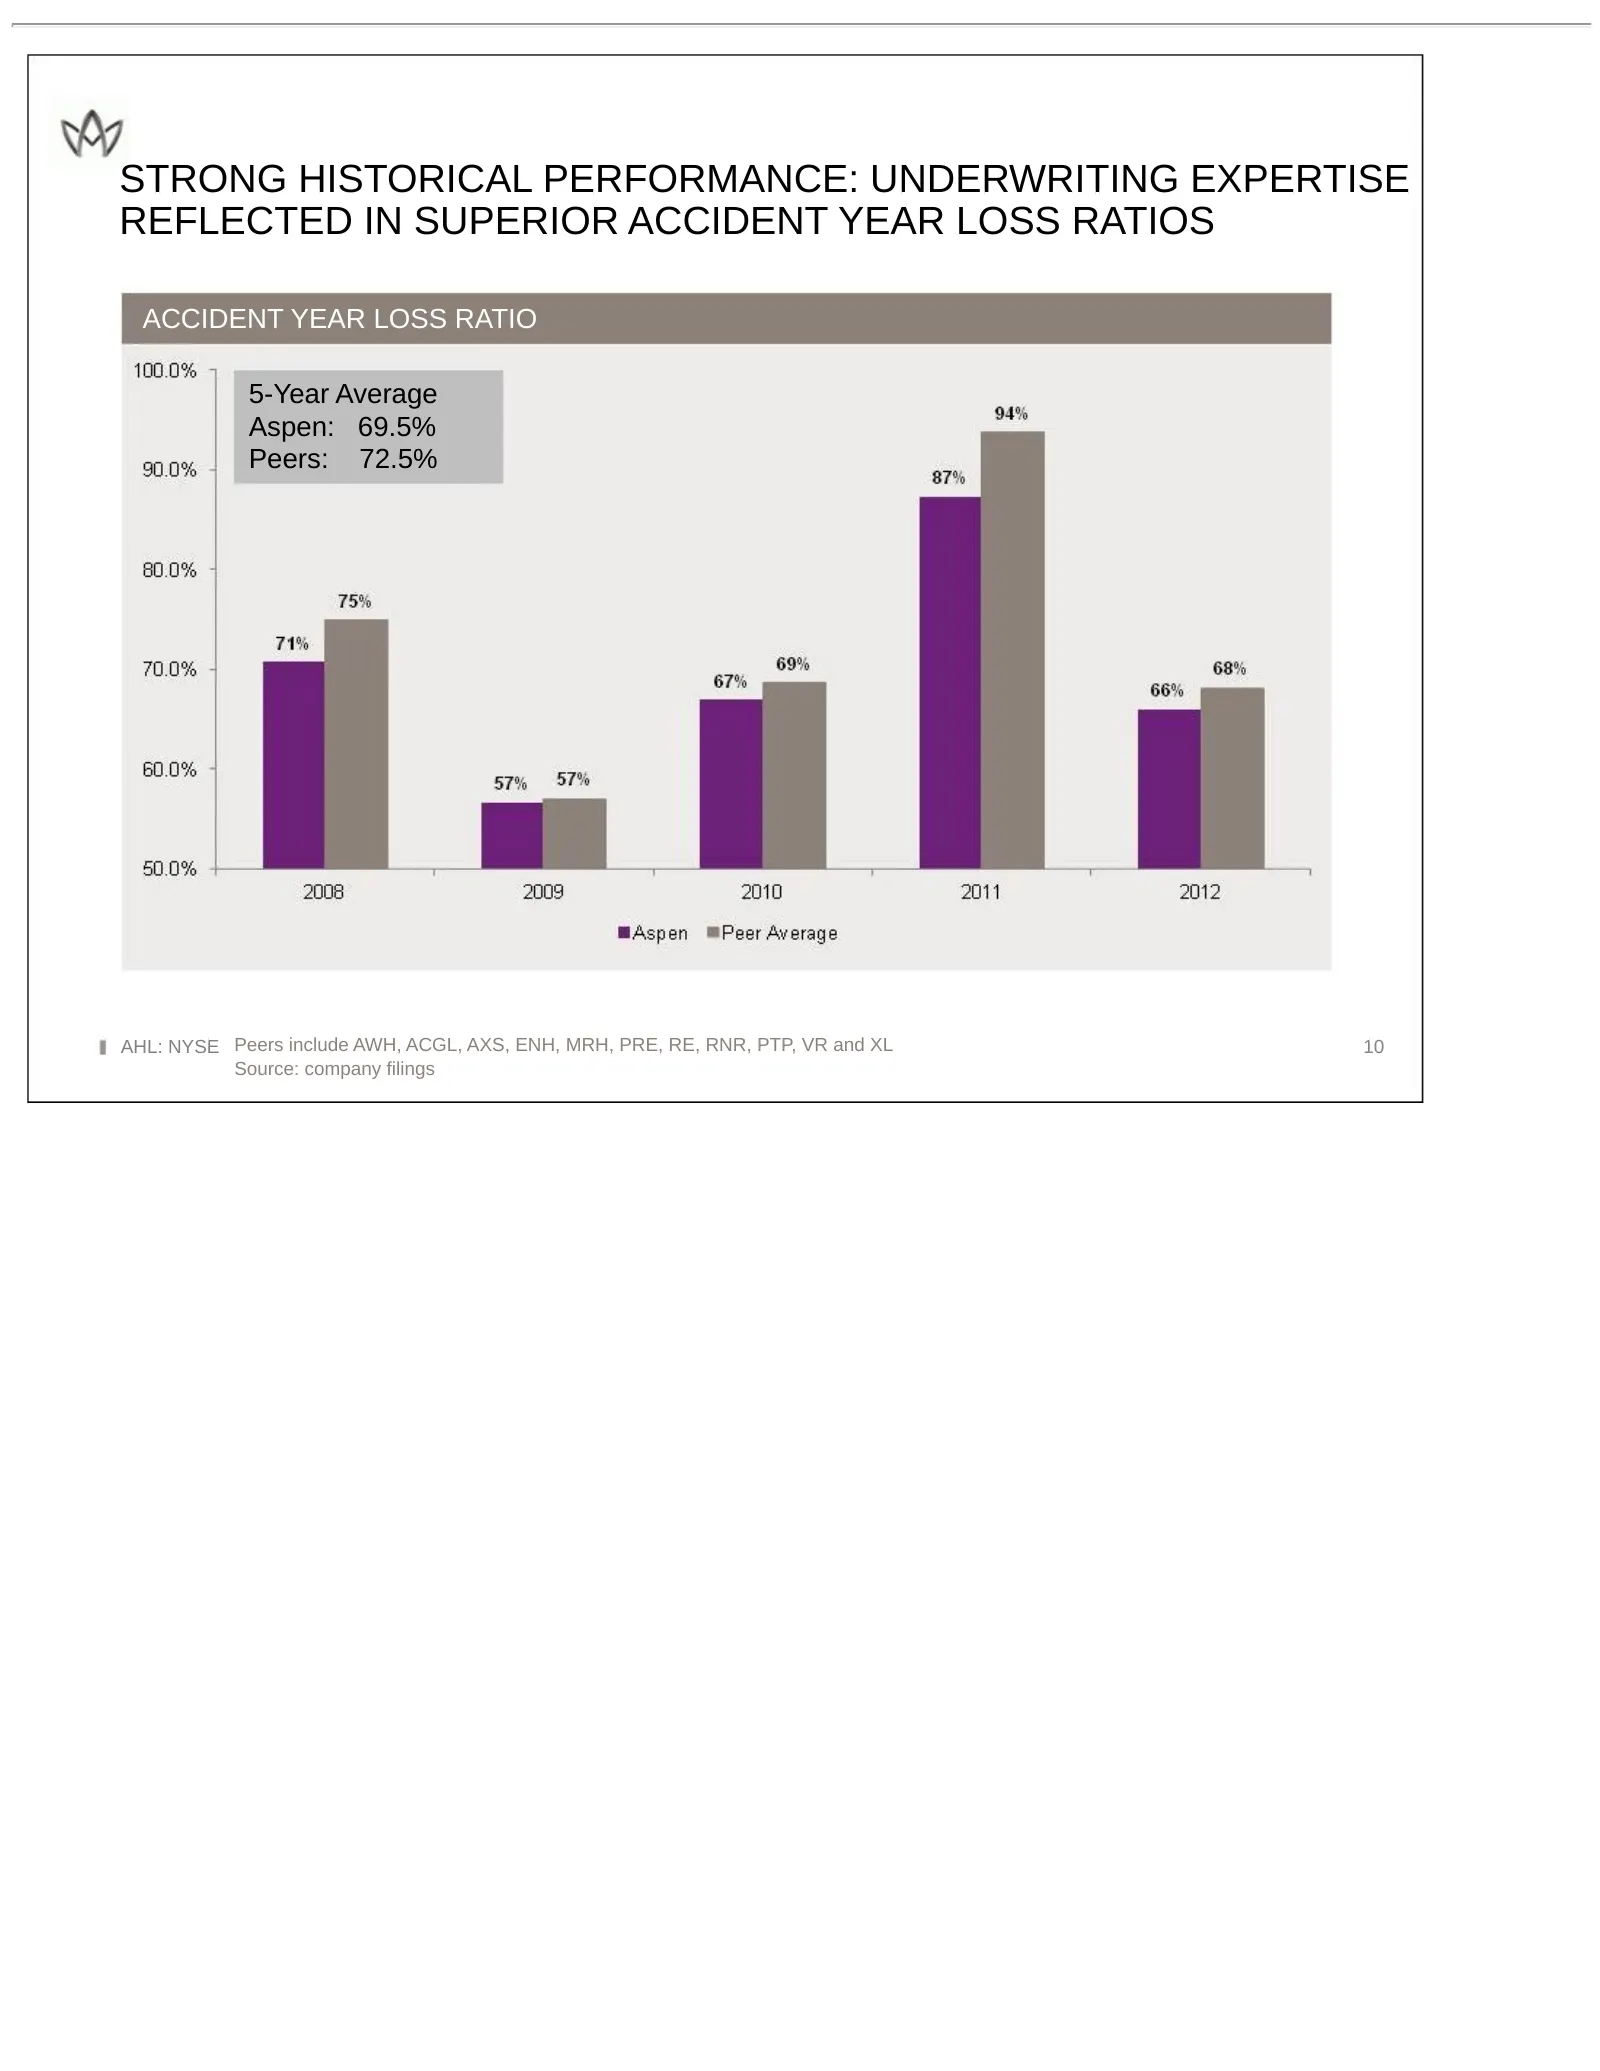
Slide 10: Strong Historical Performance: Superior Accident Year Loss Ratios
STRONG HISTORICAL PERFORMANCE: UNDERWRITING EXPERTISE REFLECTED IN SUPERIOR ACCIDENT YEAR LOSS RATIOS ACCIDENT YEAR LOSS RATIO 5-Year Average Aspen: 69.5% Peers: 72.5% AHL: NYSE Peers include AWH, ACGL, AXS, ENH, MRH, PRE, RE, RNR, PTP, VR and XL 10 Source: company filings
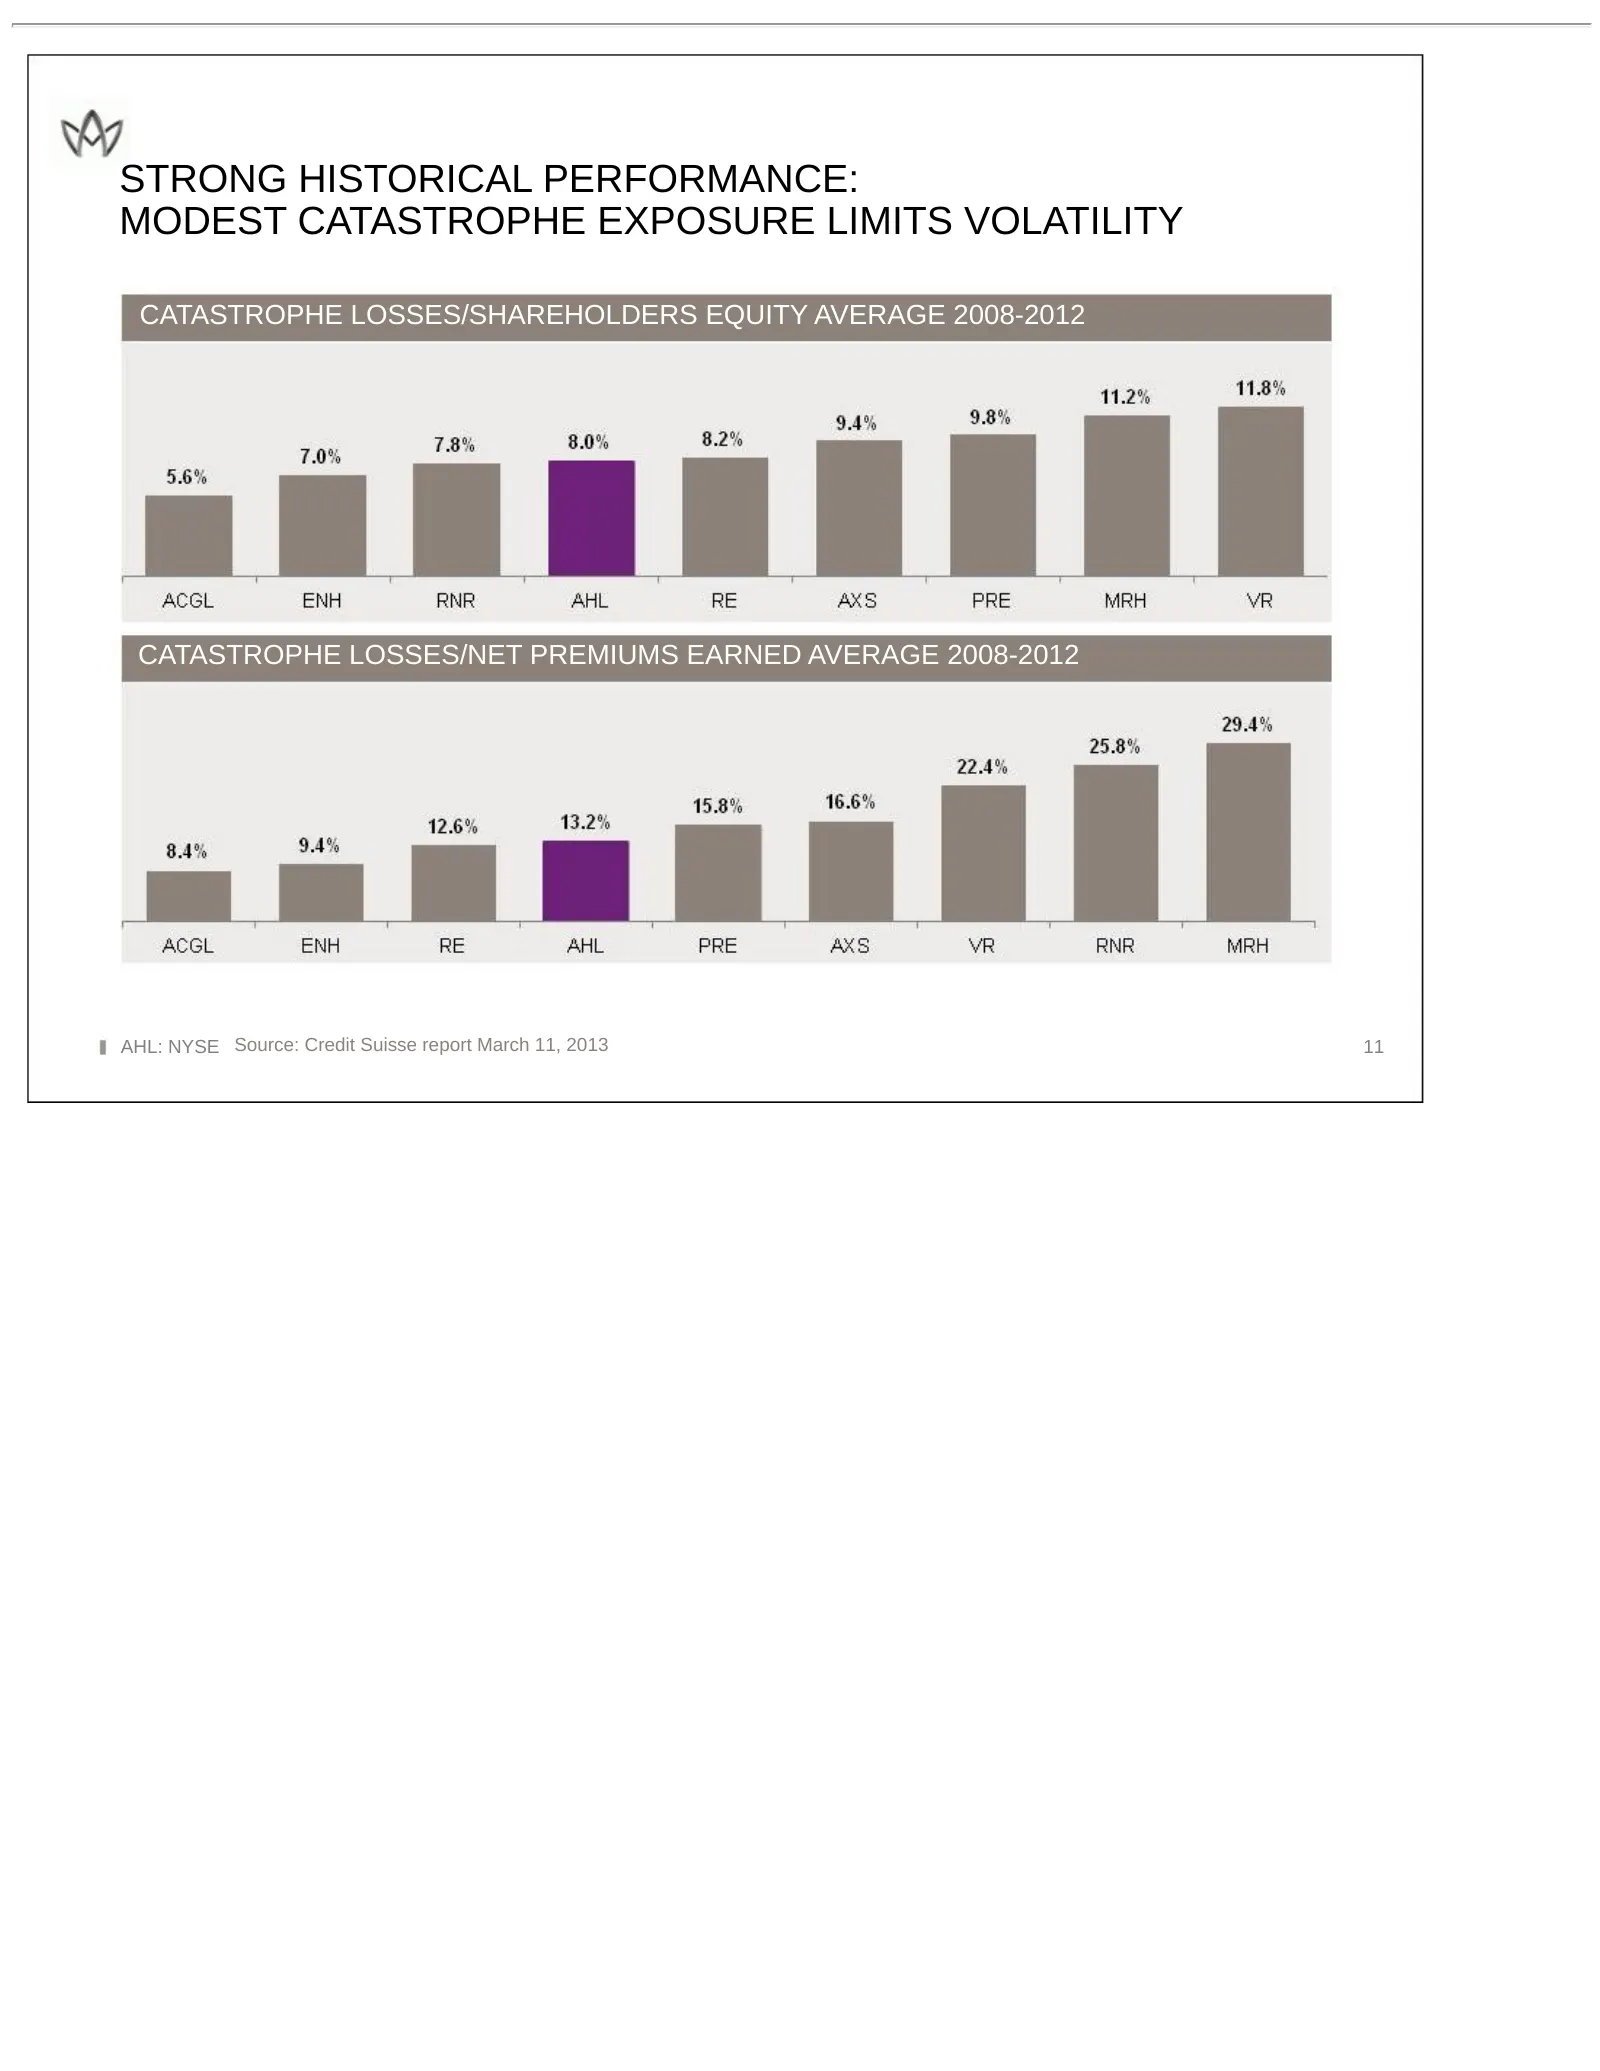
Slide 11: Strong Historical Performance: Modest Catastrophe Exposure Limits Volatility
STRONG HISTORICAL PERFORMANCE: MODEST CATASTROPHE EXPOSURE LIMITS VOLATILITY CATASTROPHE LOSSES/SHAREHOLDERS EQUITY AVERAGE 2008-2012 CATASTROPHE LOSSES/NET PREMIUMS EARNED AVERAGE 2008-2012 AHL: NYSE Source: Credit Suisse report March 11, 2013 11
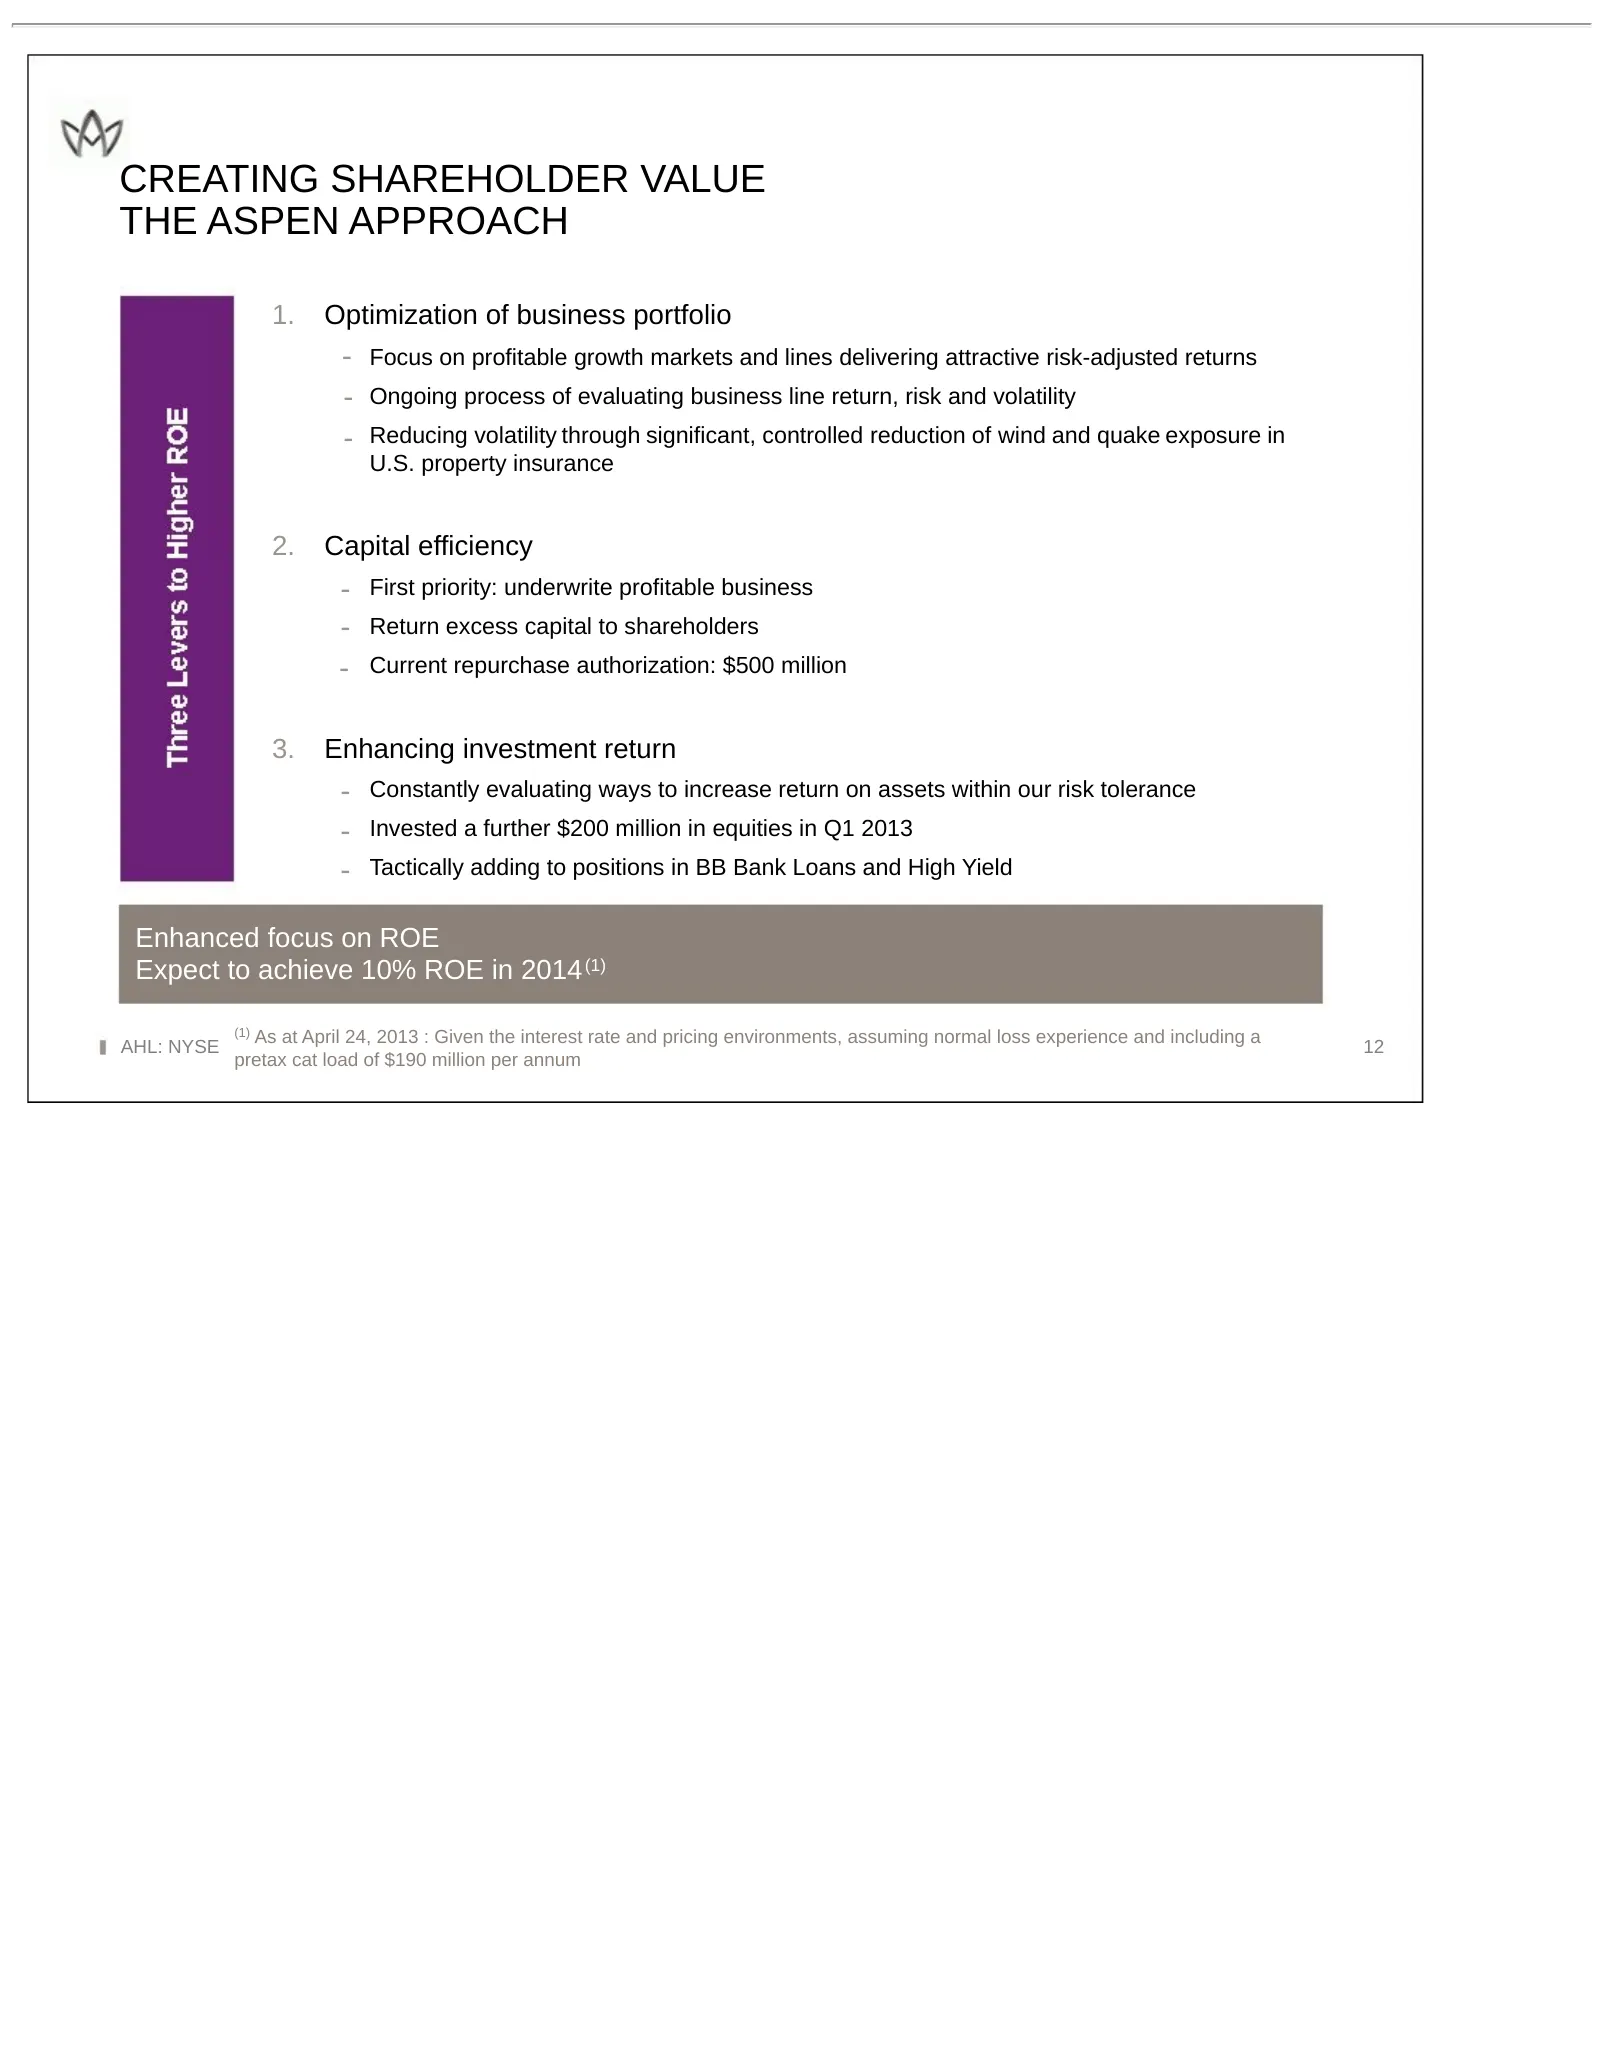
Slide 12: Creating Shareholder Value: The Aspen Approach
CREATING SHAREHOLDER VALUE THE ASPEN APPROACH 1. Optimization of business portfolio - Focus on profitable growth markets and lines delivering attractive risk-adjusted returns - Ongoing process of evaluating business line return, risk and volatility - Reducing volatility through significant, controll
Slide 13: Creating Shareholder Value: Optimization of Business Portfolio
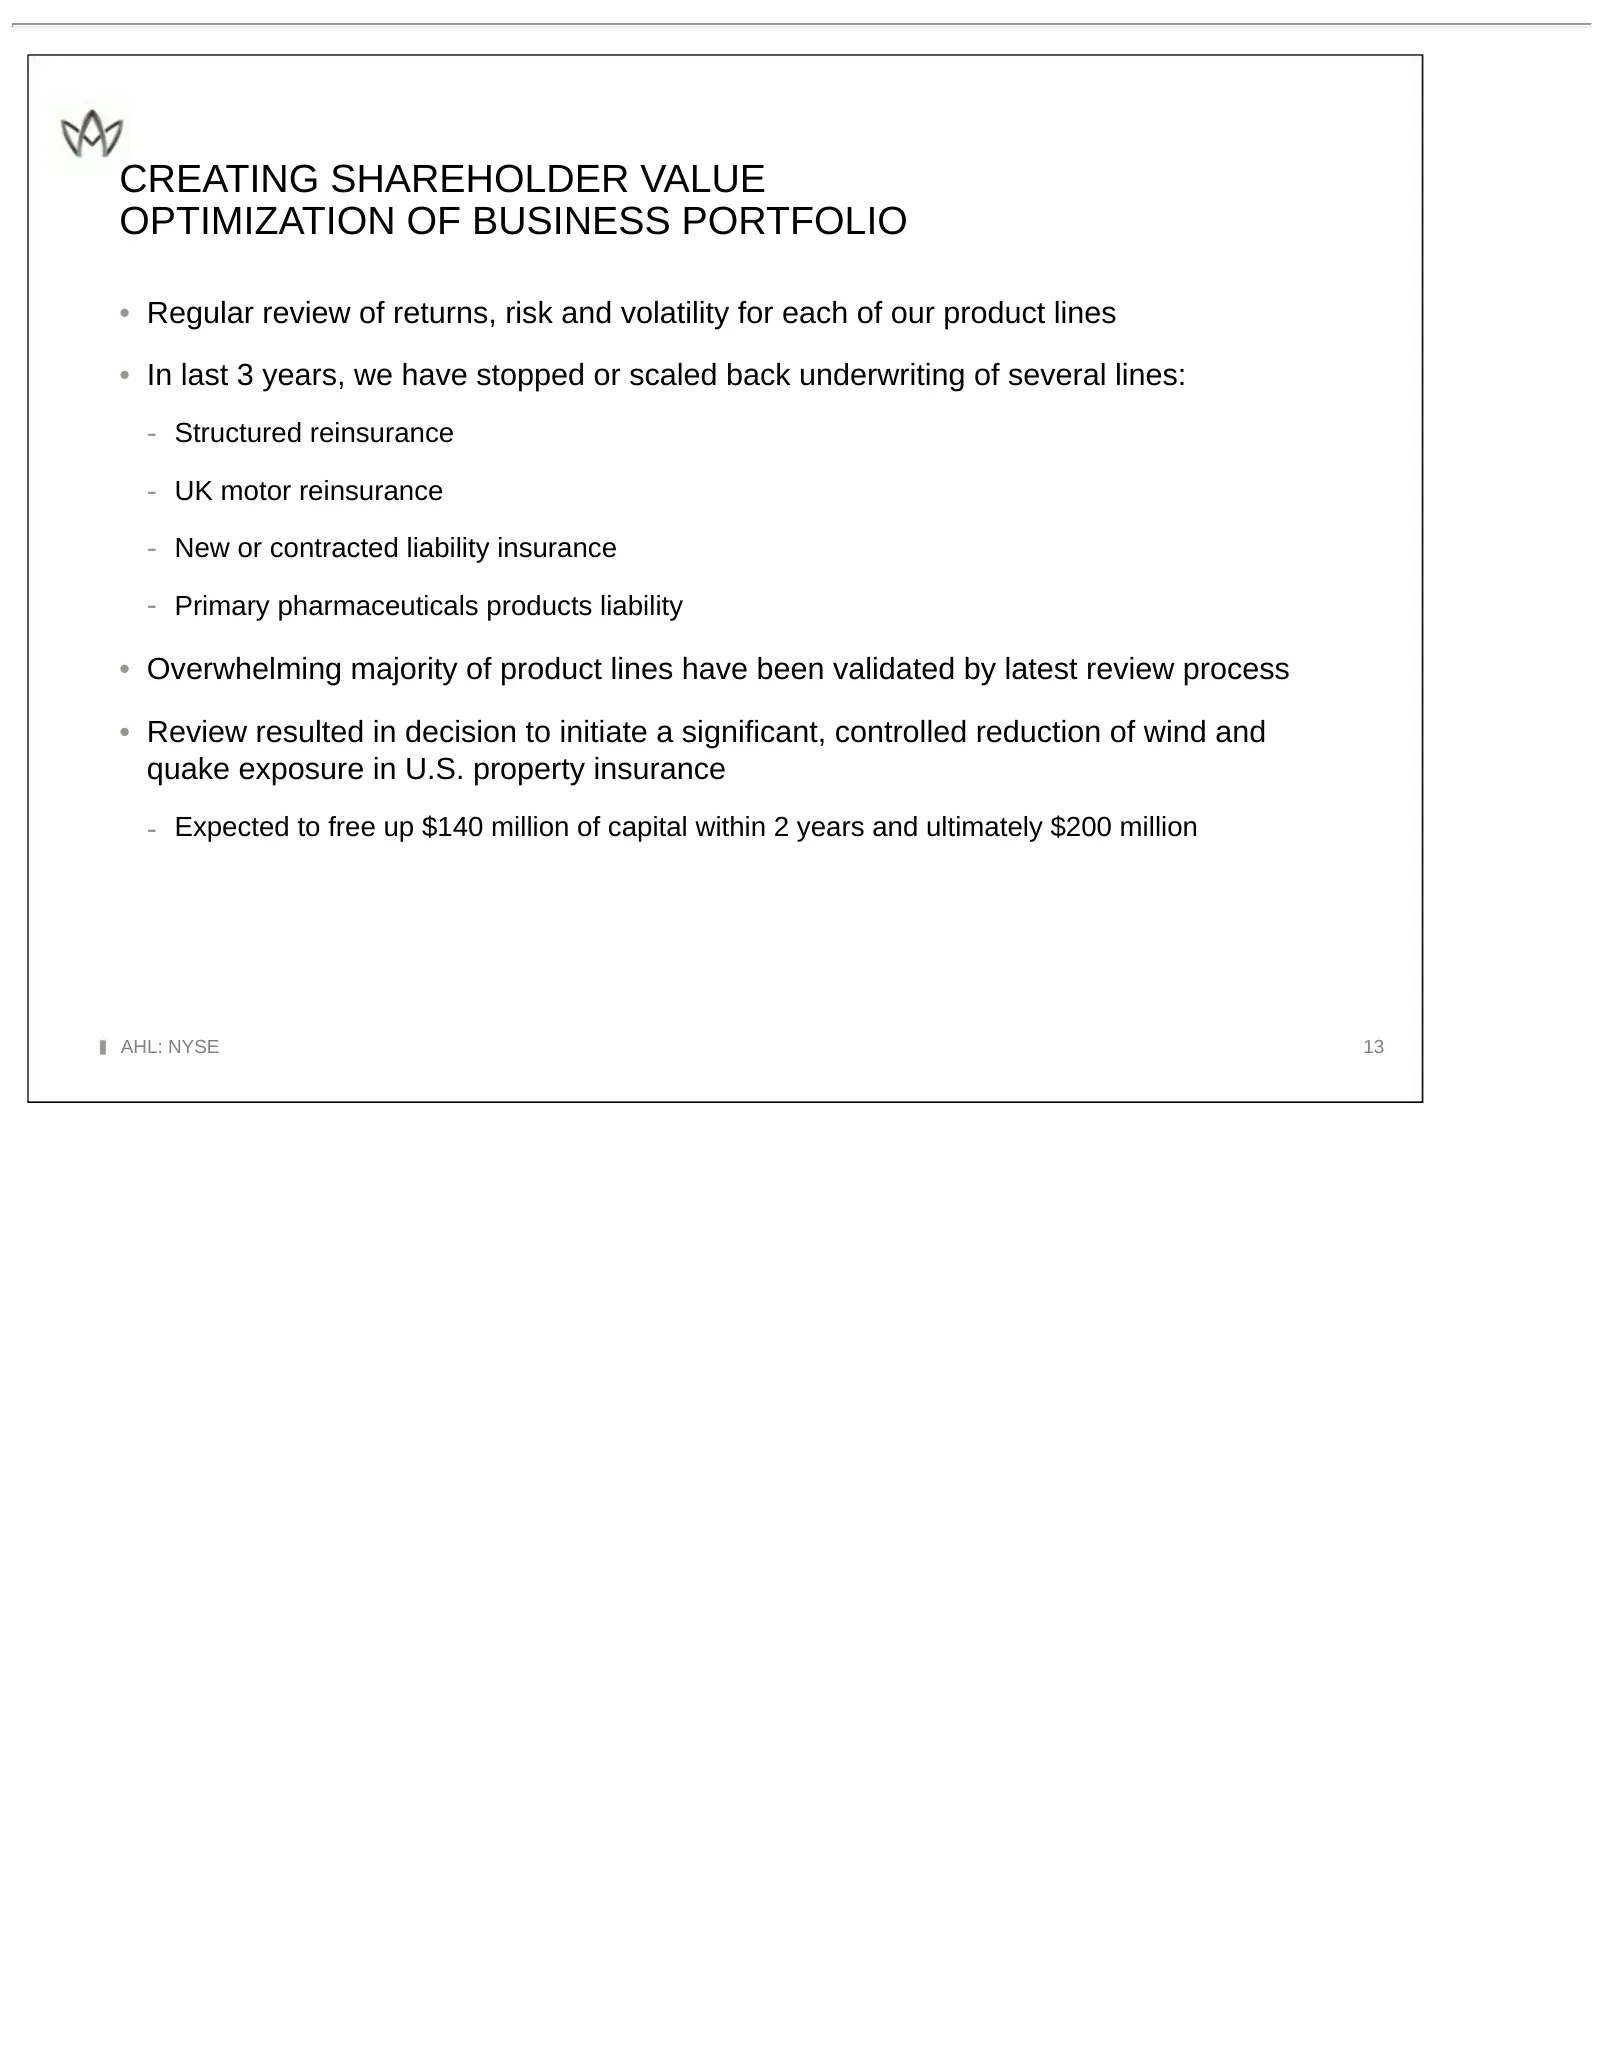
CREATING SHAREHOLDER VALUE OPTIMIZATION OF BUSINESS PORTFOLIO • Regular review of returns, risk and volatility for each of our product lines • In last 3 years, we have stopped or scaled back underwriting of several lines: - Structured reinsurance - UK motor reinsurance - New or contracted liability
Slide 14: Building a Specialty Niche Business in the U.S.
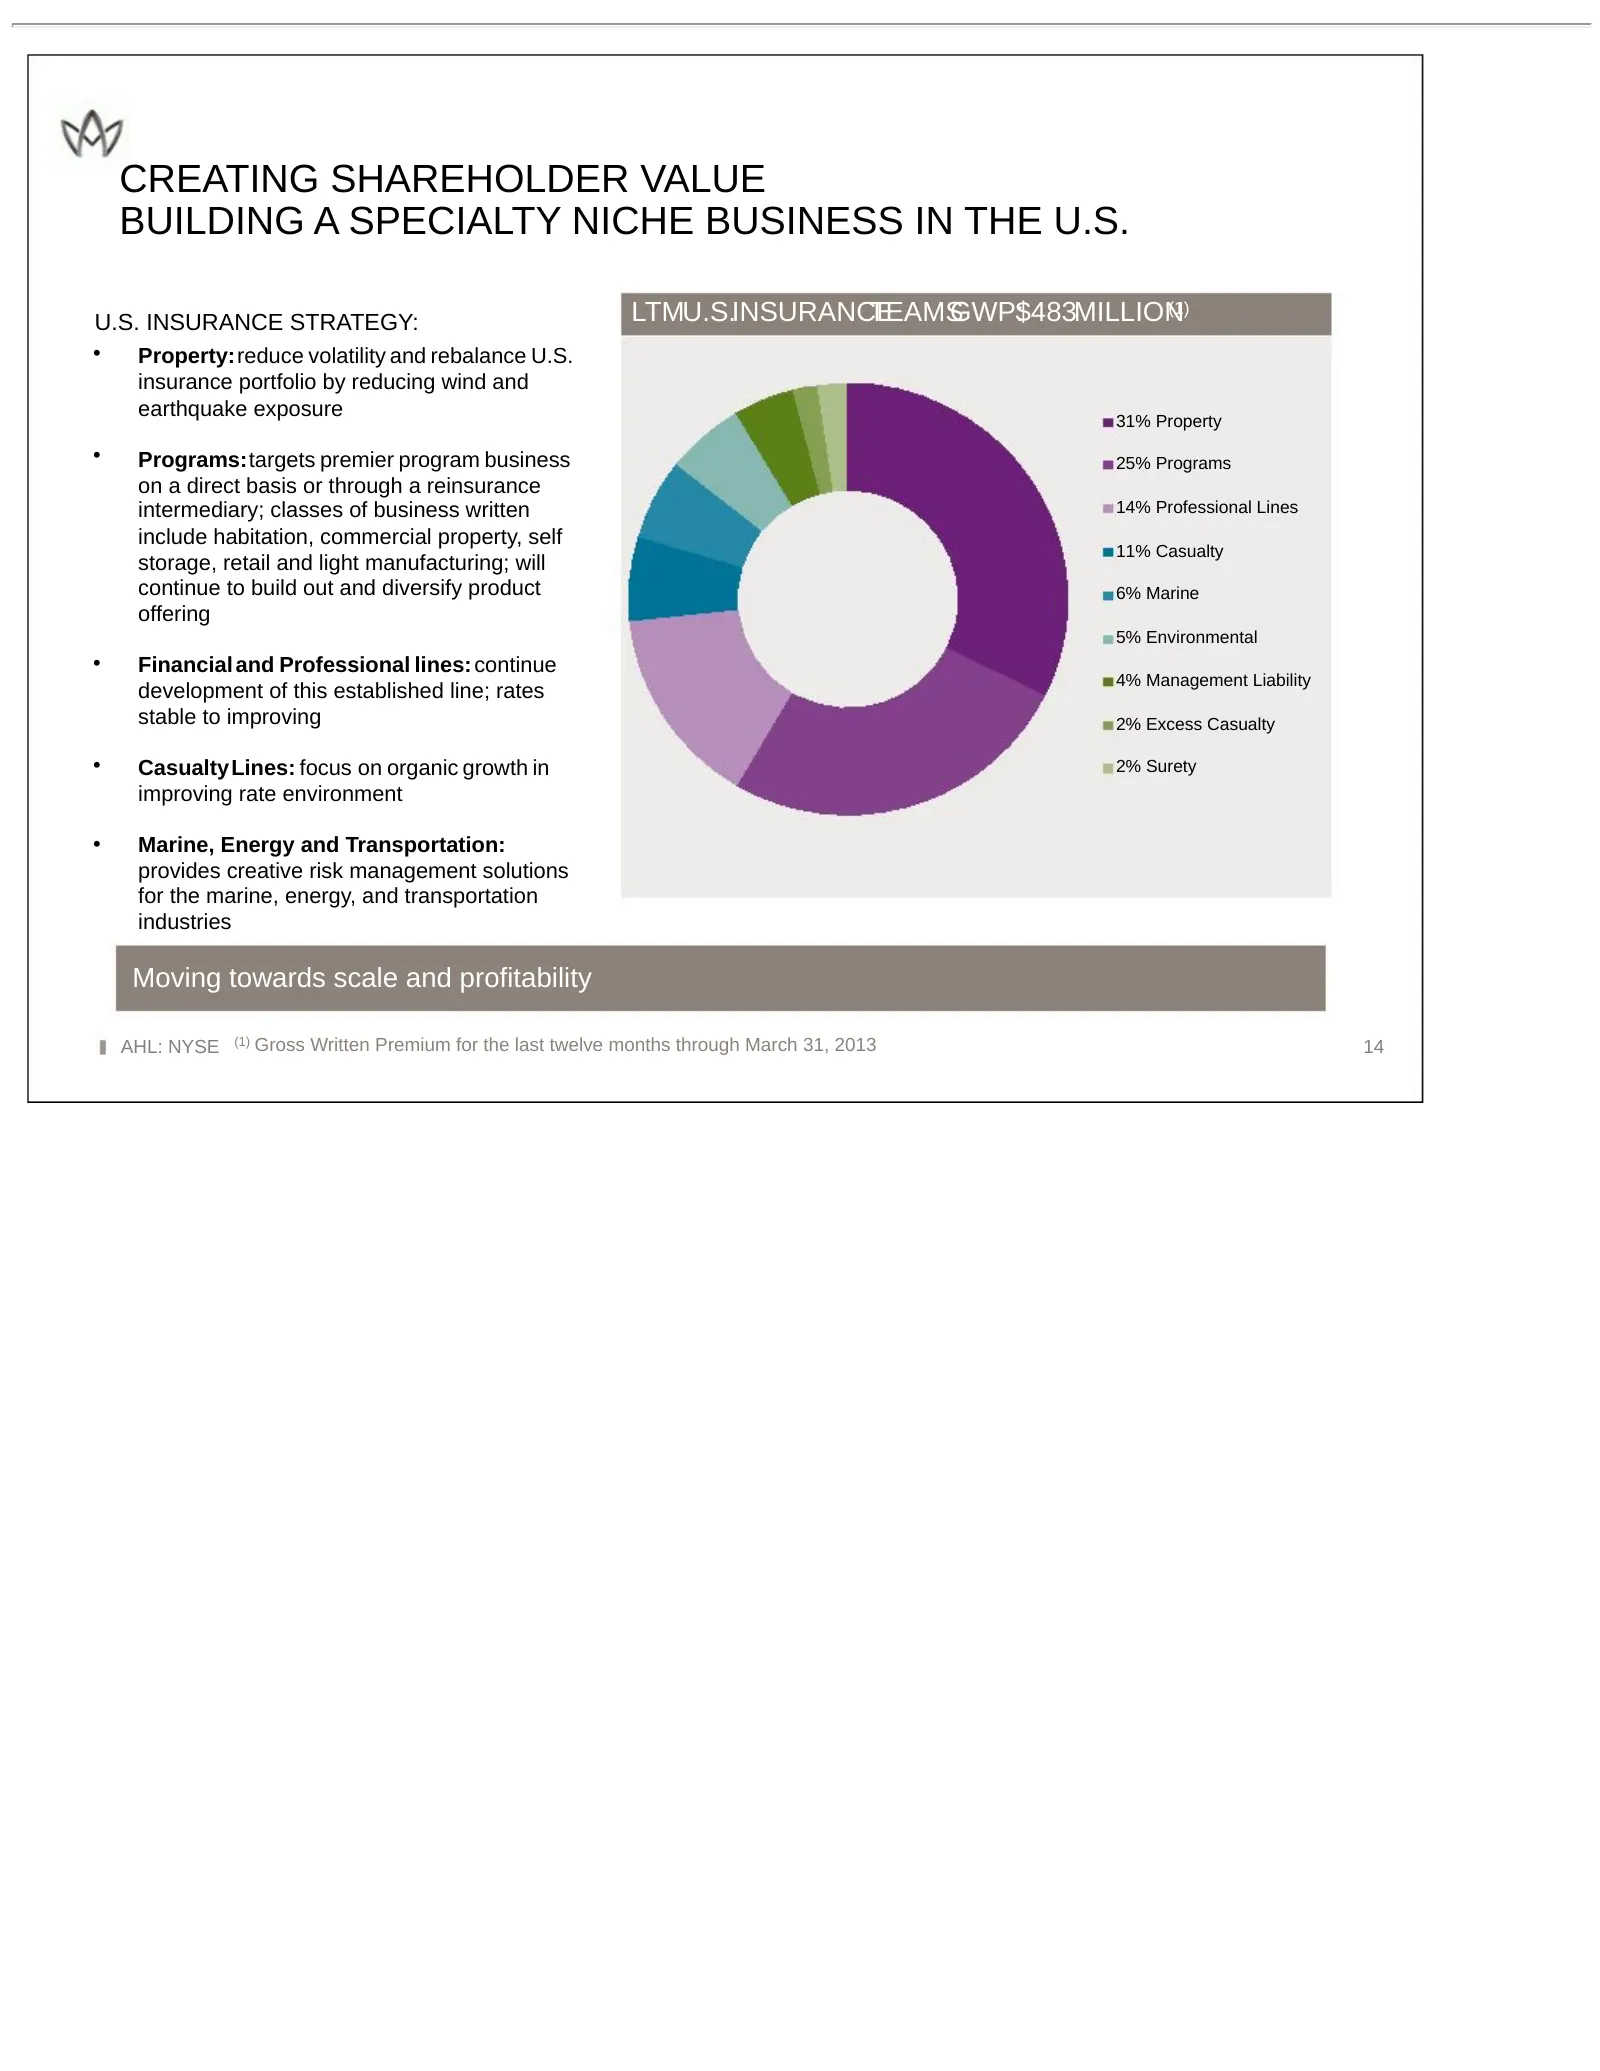
CREATING SHAREHOLDER VALUE BUILDING A SPECIALTY NICHE BUSINESS IN THE U.S. U.S. INSURANCE STRATEGY: LTMU.S.INSURANCE TEAMSGWP:$483MILLION (1) • Property:reduce volatility and rebalance U.S. insurance portfolio by reducing wind and earthquake exposure 31% Property • Programs:targets premier program b
Slide 15: Proactive Management of Capital
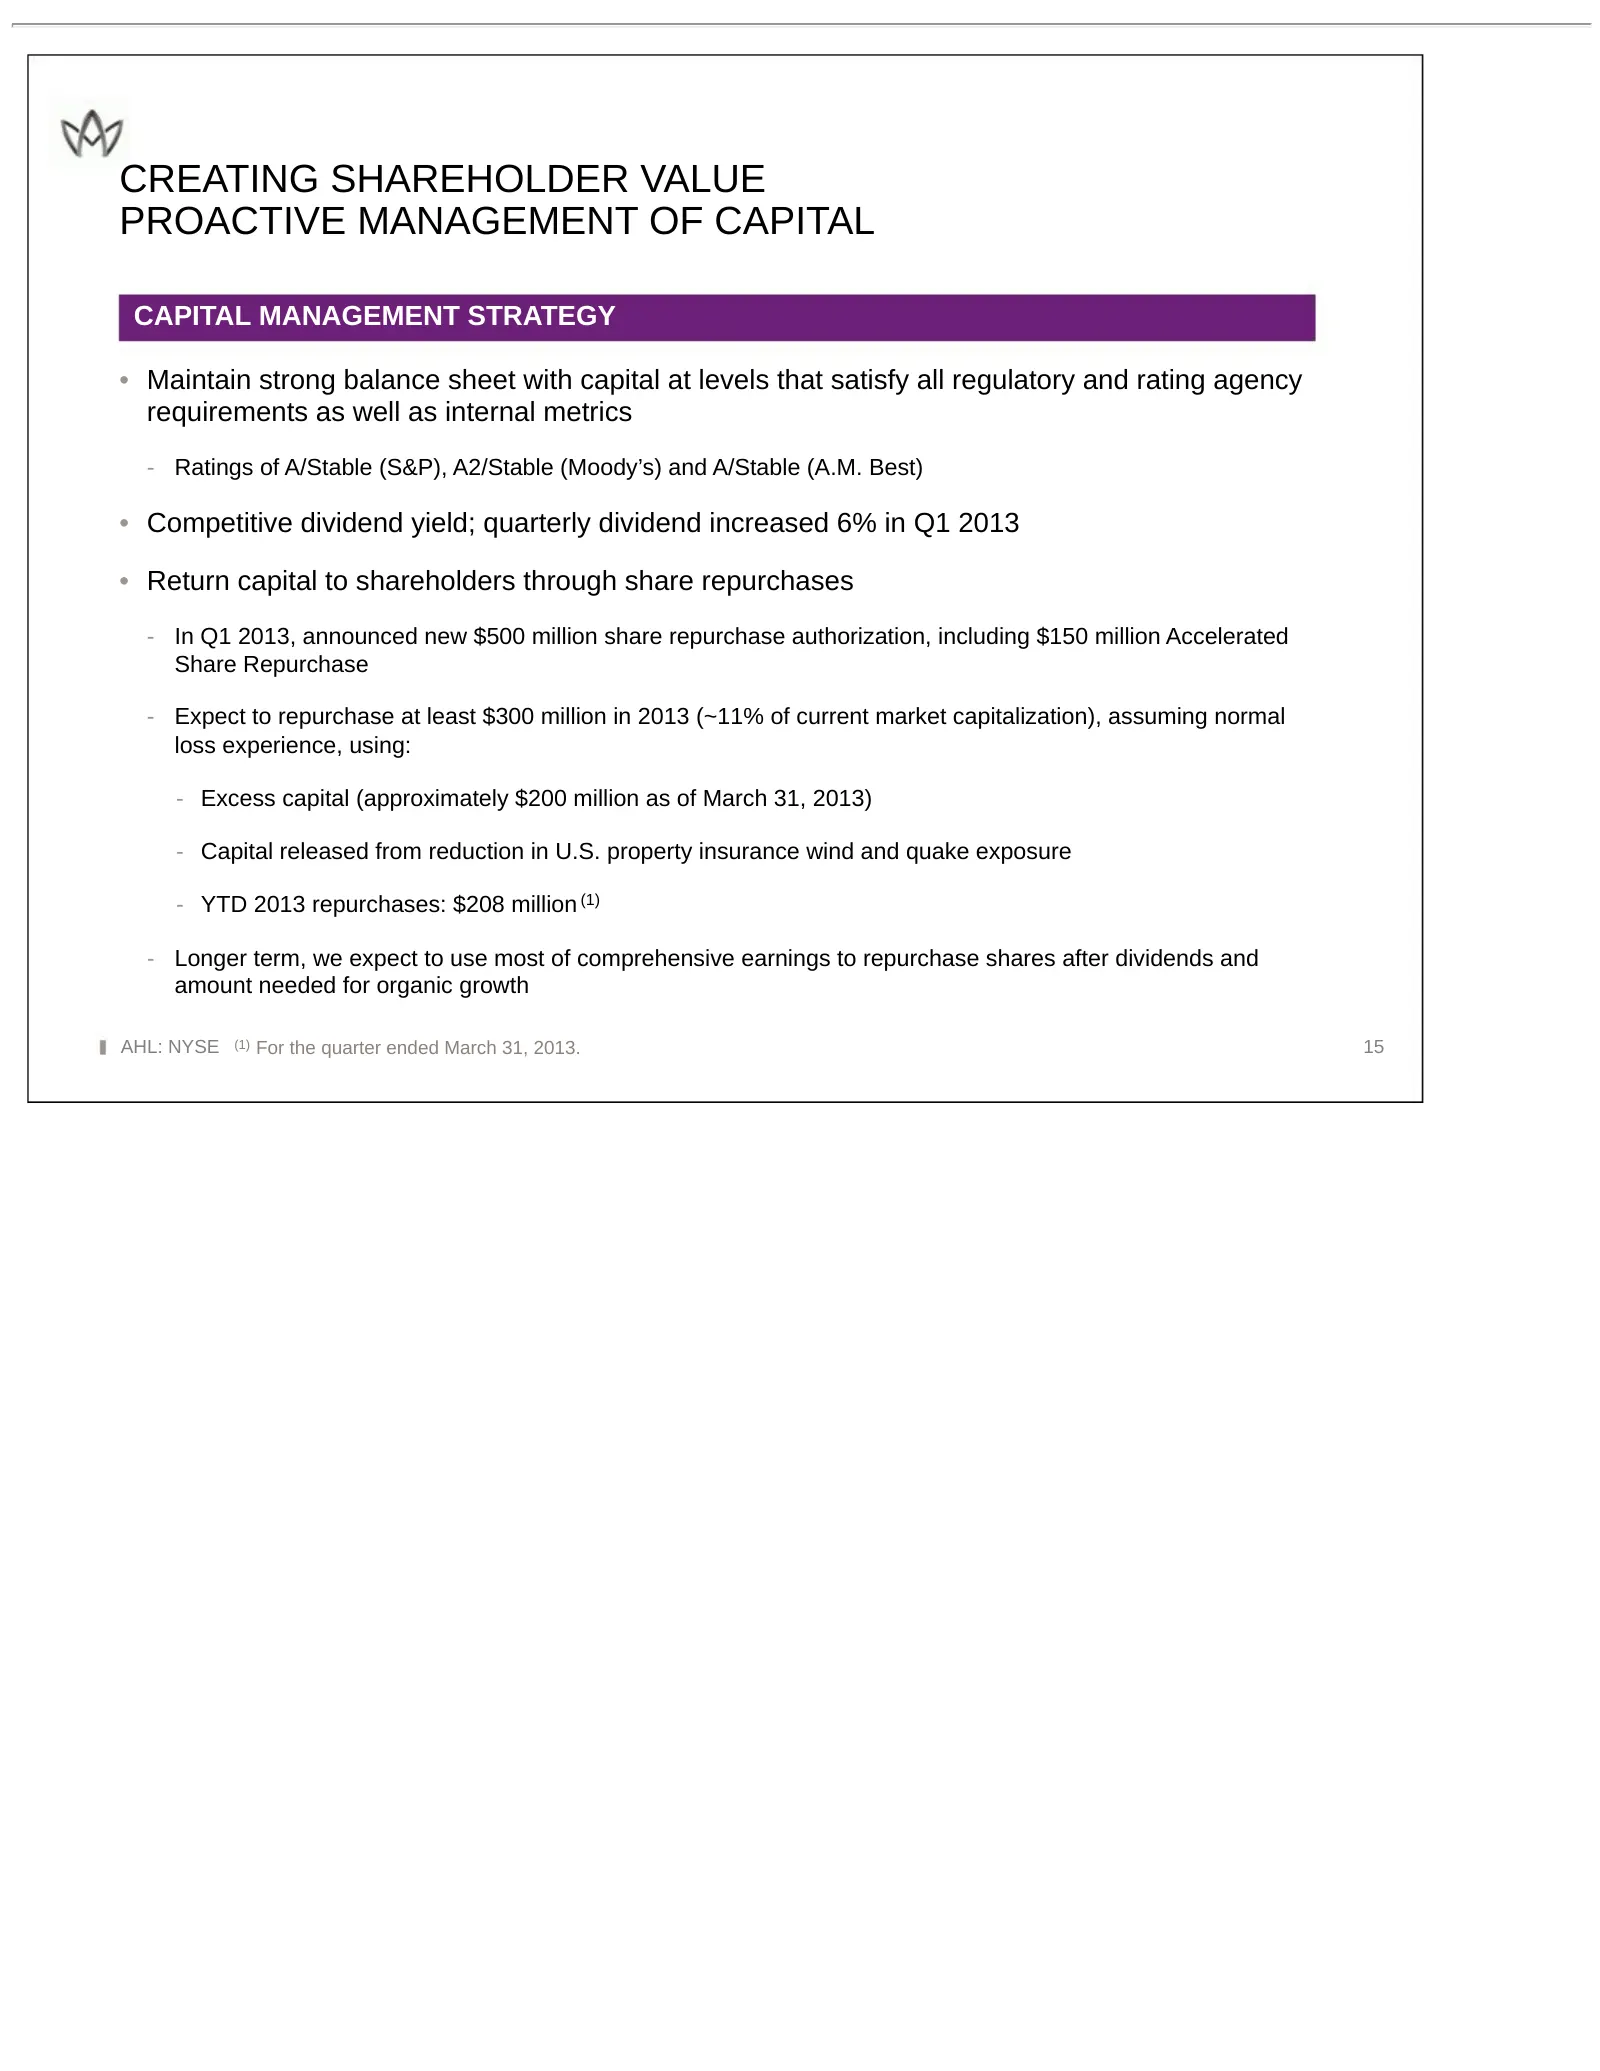
CREATING SHAREHOLDER VALUE PROACTIVE MANAGEMENT OF CAPITAL CAPITAL MANAGEMENT STRATEGY • Maintain strong balance sheet with capital at levels that satisfy all regulatory and rating agency requirements as well as internal metrics - Ratings of A/Stable (S&P), A2/Stable (Moody’s) and A/Stable (A.M. Bes
Slide 16: Delivering Strong Investment Returns with High Quality Portfolio
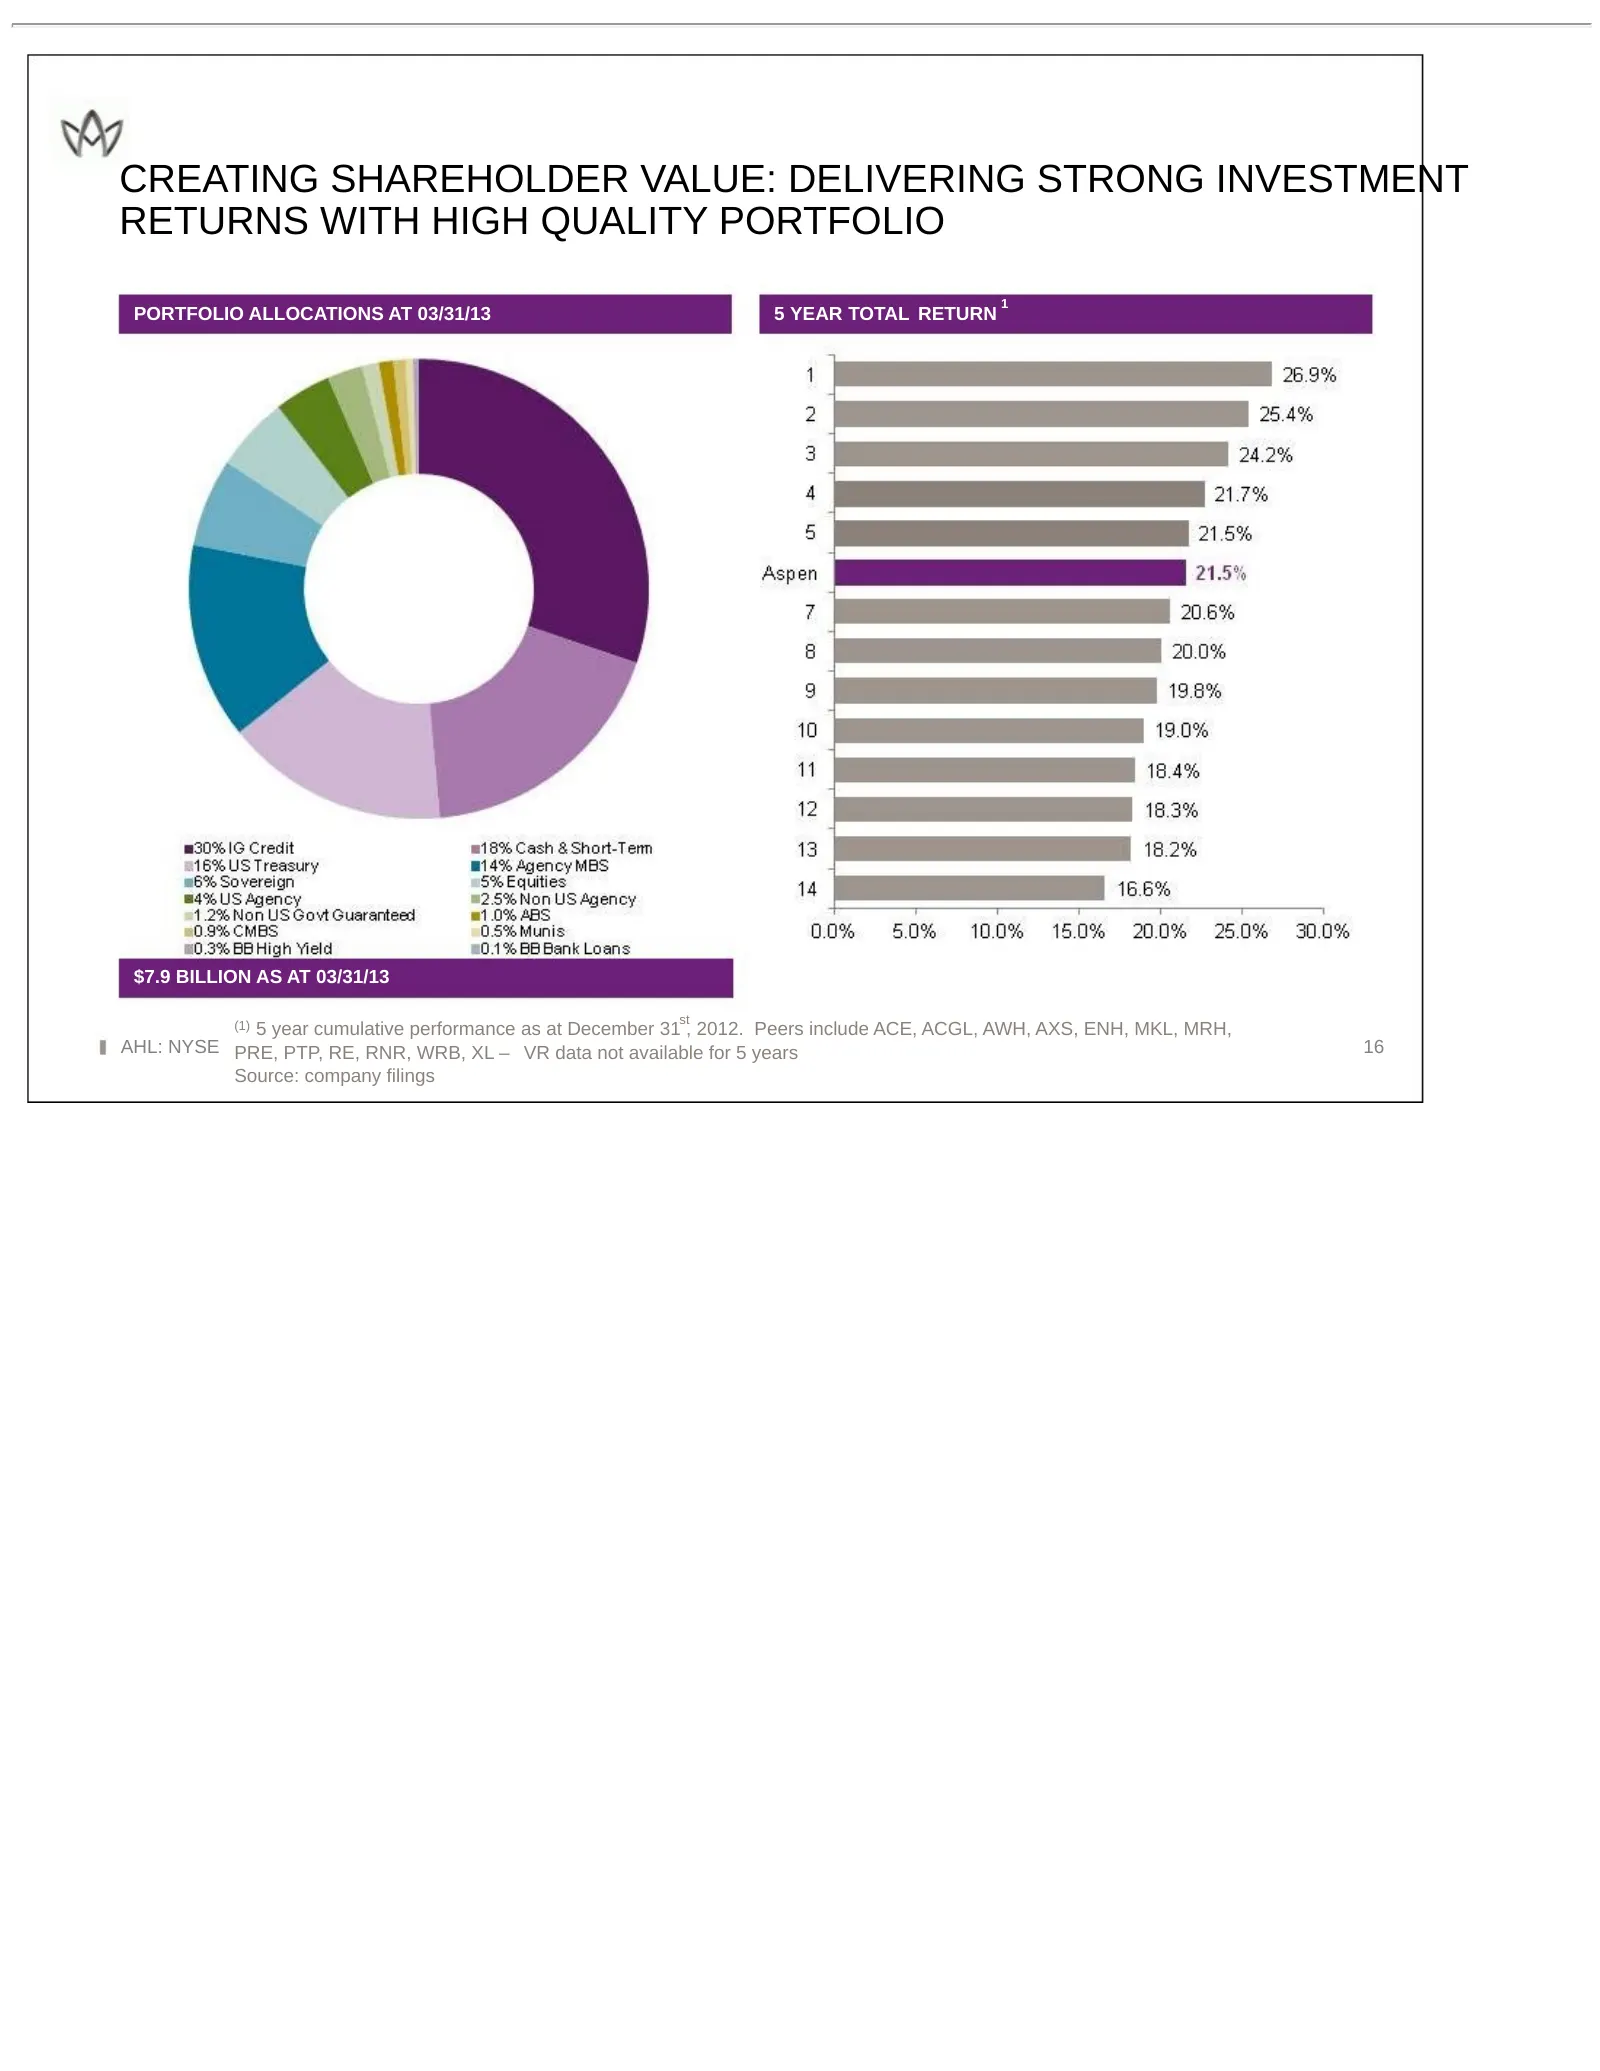
CREATING SHAREHOLDER VALUE: DELIVERING STRONG INVESTMENT RETURNS WITH HIGH QUALITY PORTFOLIO 1 PORTFOLIO ALLOCATIONS AT 03/31/13 5 YEAR TOTAL RETURN $7.9 BILLION AS AT 03/31/13 st (1) 5 year cumulative performance as at December 31 , 2012. Peers include ACE, ACGL, AWH, AXS, ENH, MKL, MRH, AHL: NYSE
Slide 17: The Aspen Approach: Conclusion
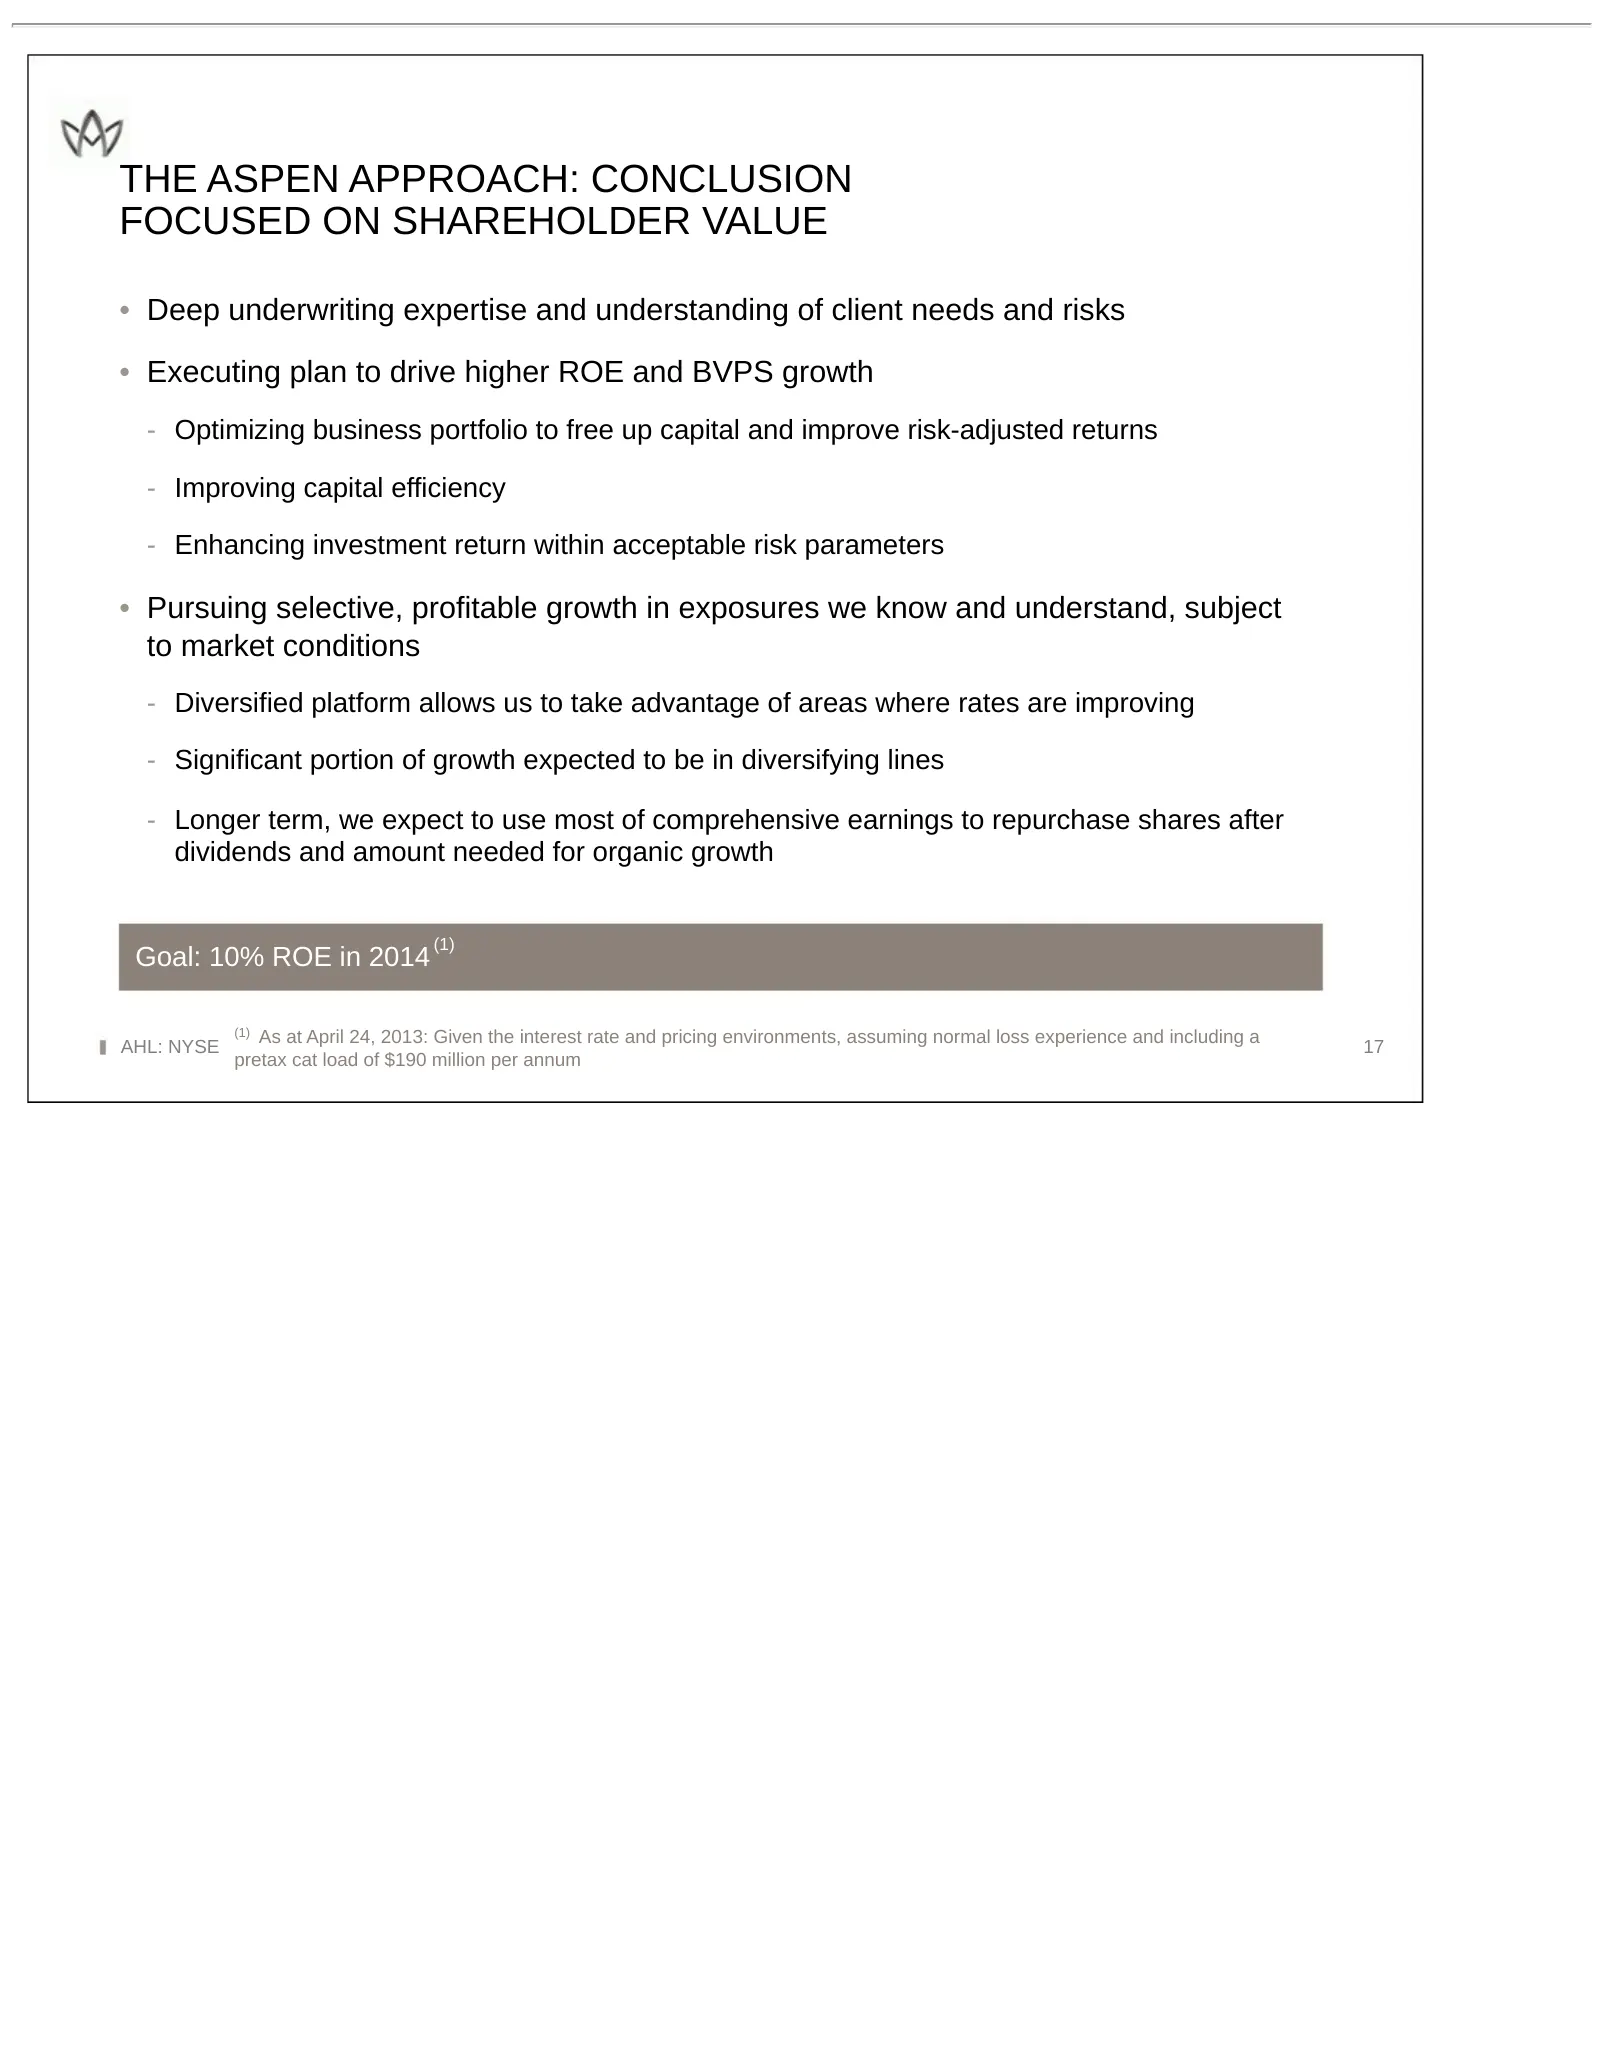
THE ASPEN APPROACH: CONCLUSION FOCUSED ON SHAREHOLDER VALUE • Deep underwriting expertise and understanding of client needs and risks • Executing plan to drive higher ROE and BVPS growth - Optimizing business portfolio to free up capital and improve risk-adjusted returns - Improving capital efficien
Slide 18: Appendix
APPENDIX
Slide 19: Improving Rate Environment
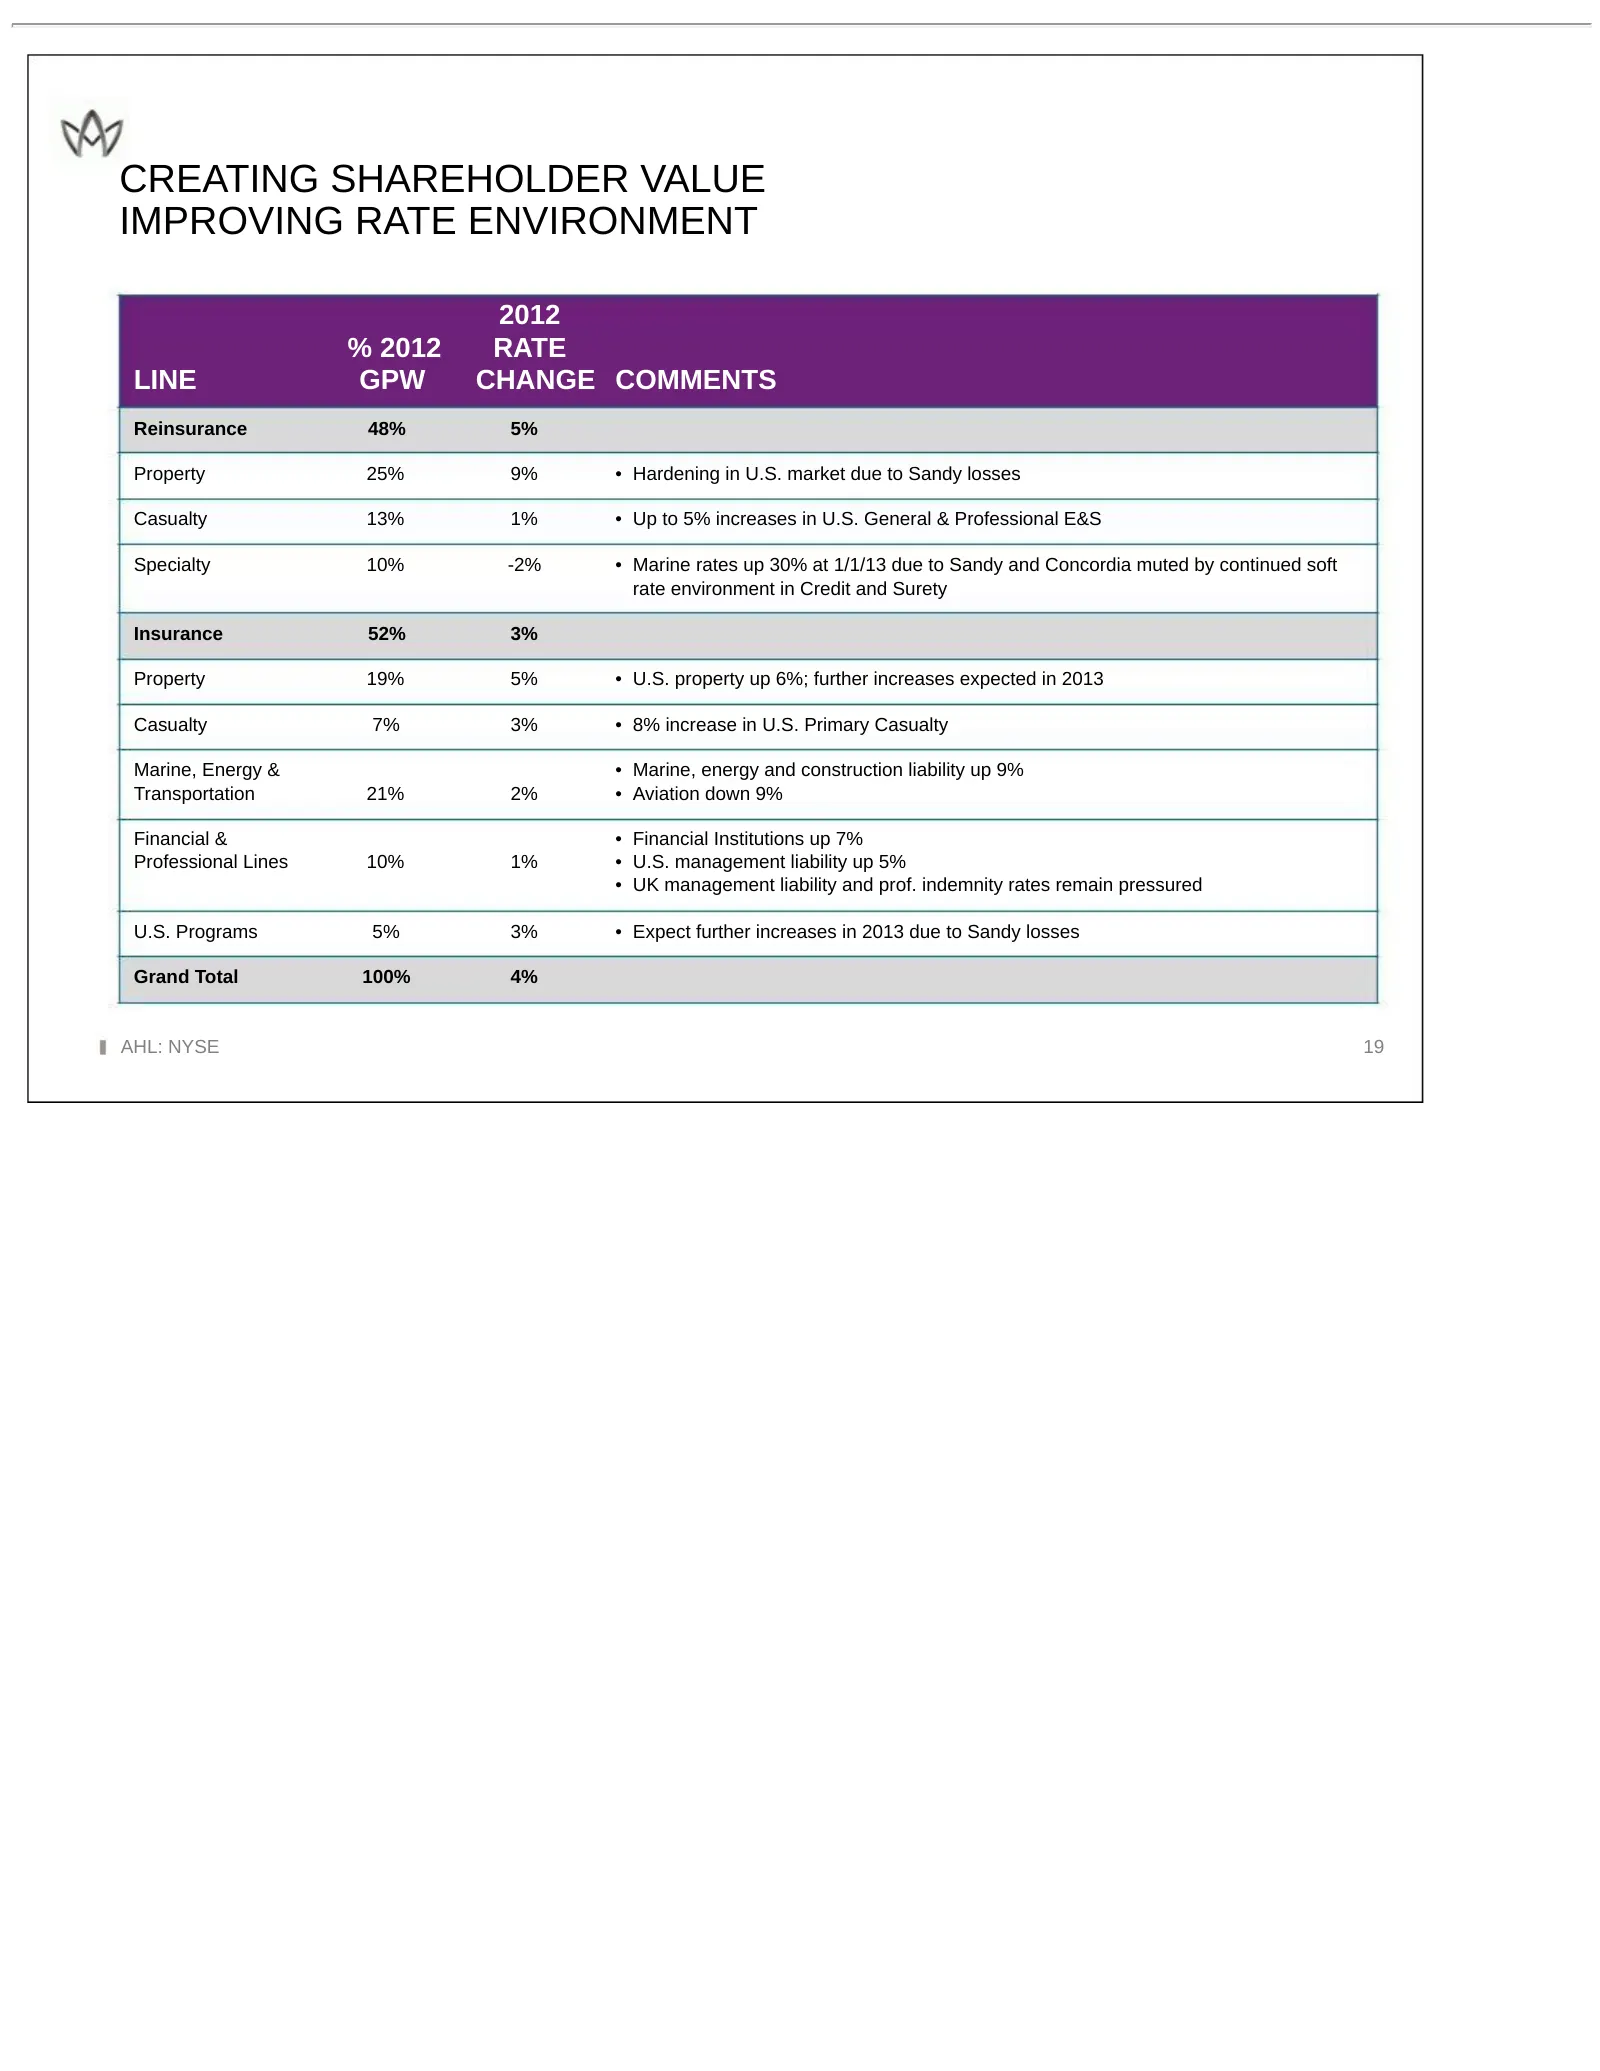
CREATING SHAREHOLDER VALUE IMPROVING RATE ENVIRONMENT 2012 % 2012 RATE LINE GPW CHANGE COMMENTS Reinsurance 48% 5% Property 25% 9% • Hardening in U.S. market due to Sandy losses Casualty 13% 1% • Up to 5% increases in U.S. General & Professional E&S Specialty 10% -2% • Marine rates up 30% at 1/1/13
Slide 20: Aspen's Natural Catastrophe Exposures: Major Peril Zones
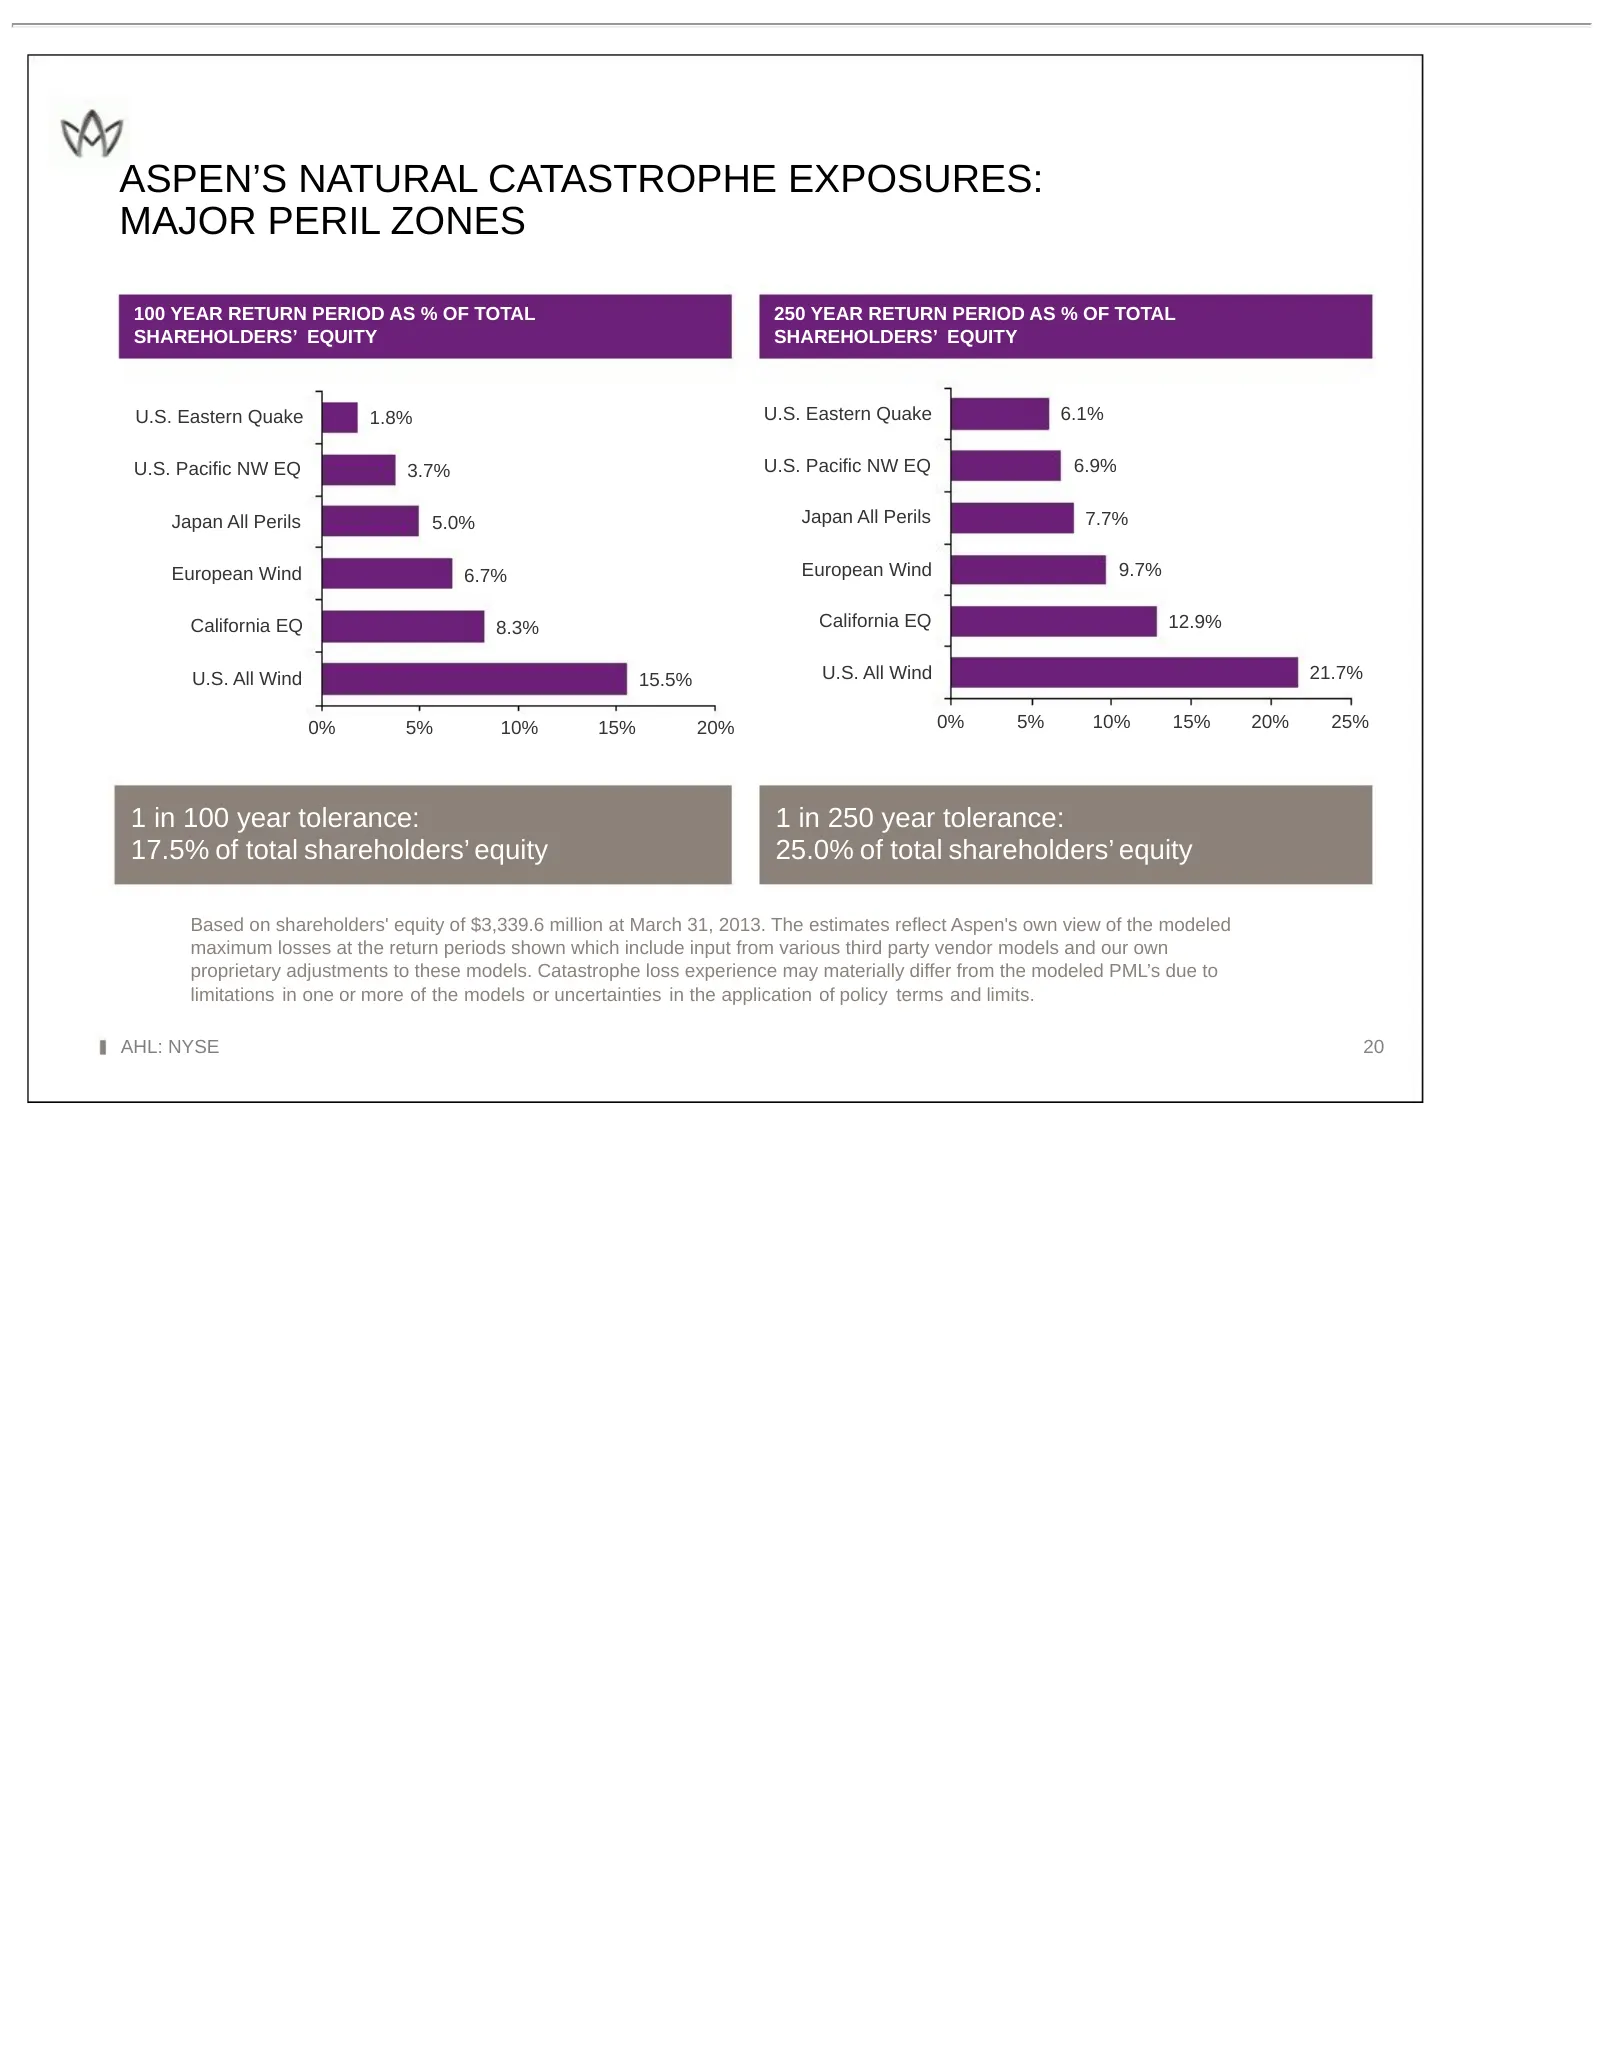
ASPEN’S NATURAL CATASTROPHE EXPOSURES: MAJOR PERIL ZONES 100 YEAR RETURN PERIOD AS % OF TOTAL 250 YEAR RETURN PERIOD AS % OF TOTAL SHAREHOLDERS’ EQUITY SHAREHOLDERS’ EQUITY U.S. Eastern Quake 1.8% U.S. Eastern Quake 6.1% U.S. Pacific NW EQ 3.7% U.S. Pacific NW EQ 6.9% Japan All Perils 5.0% Japan All
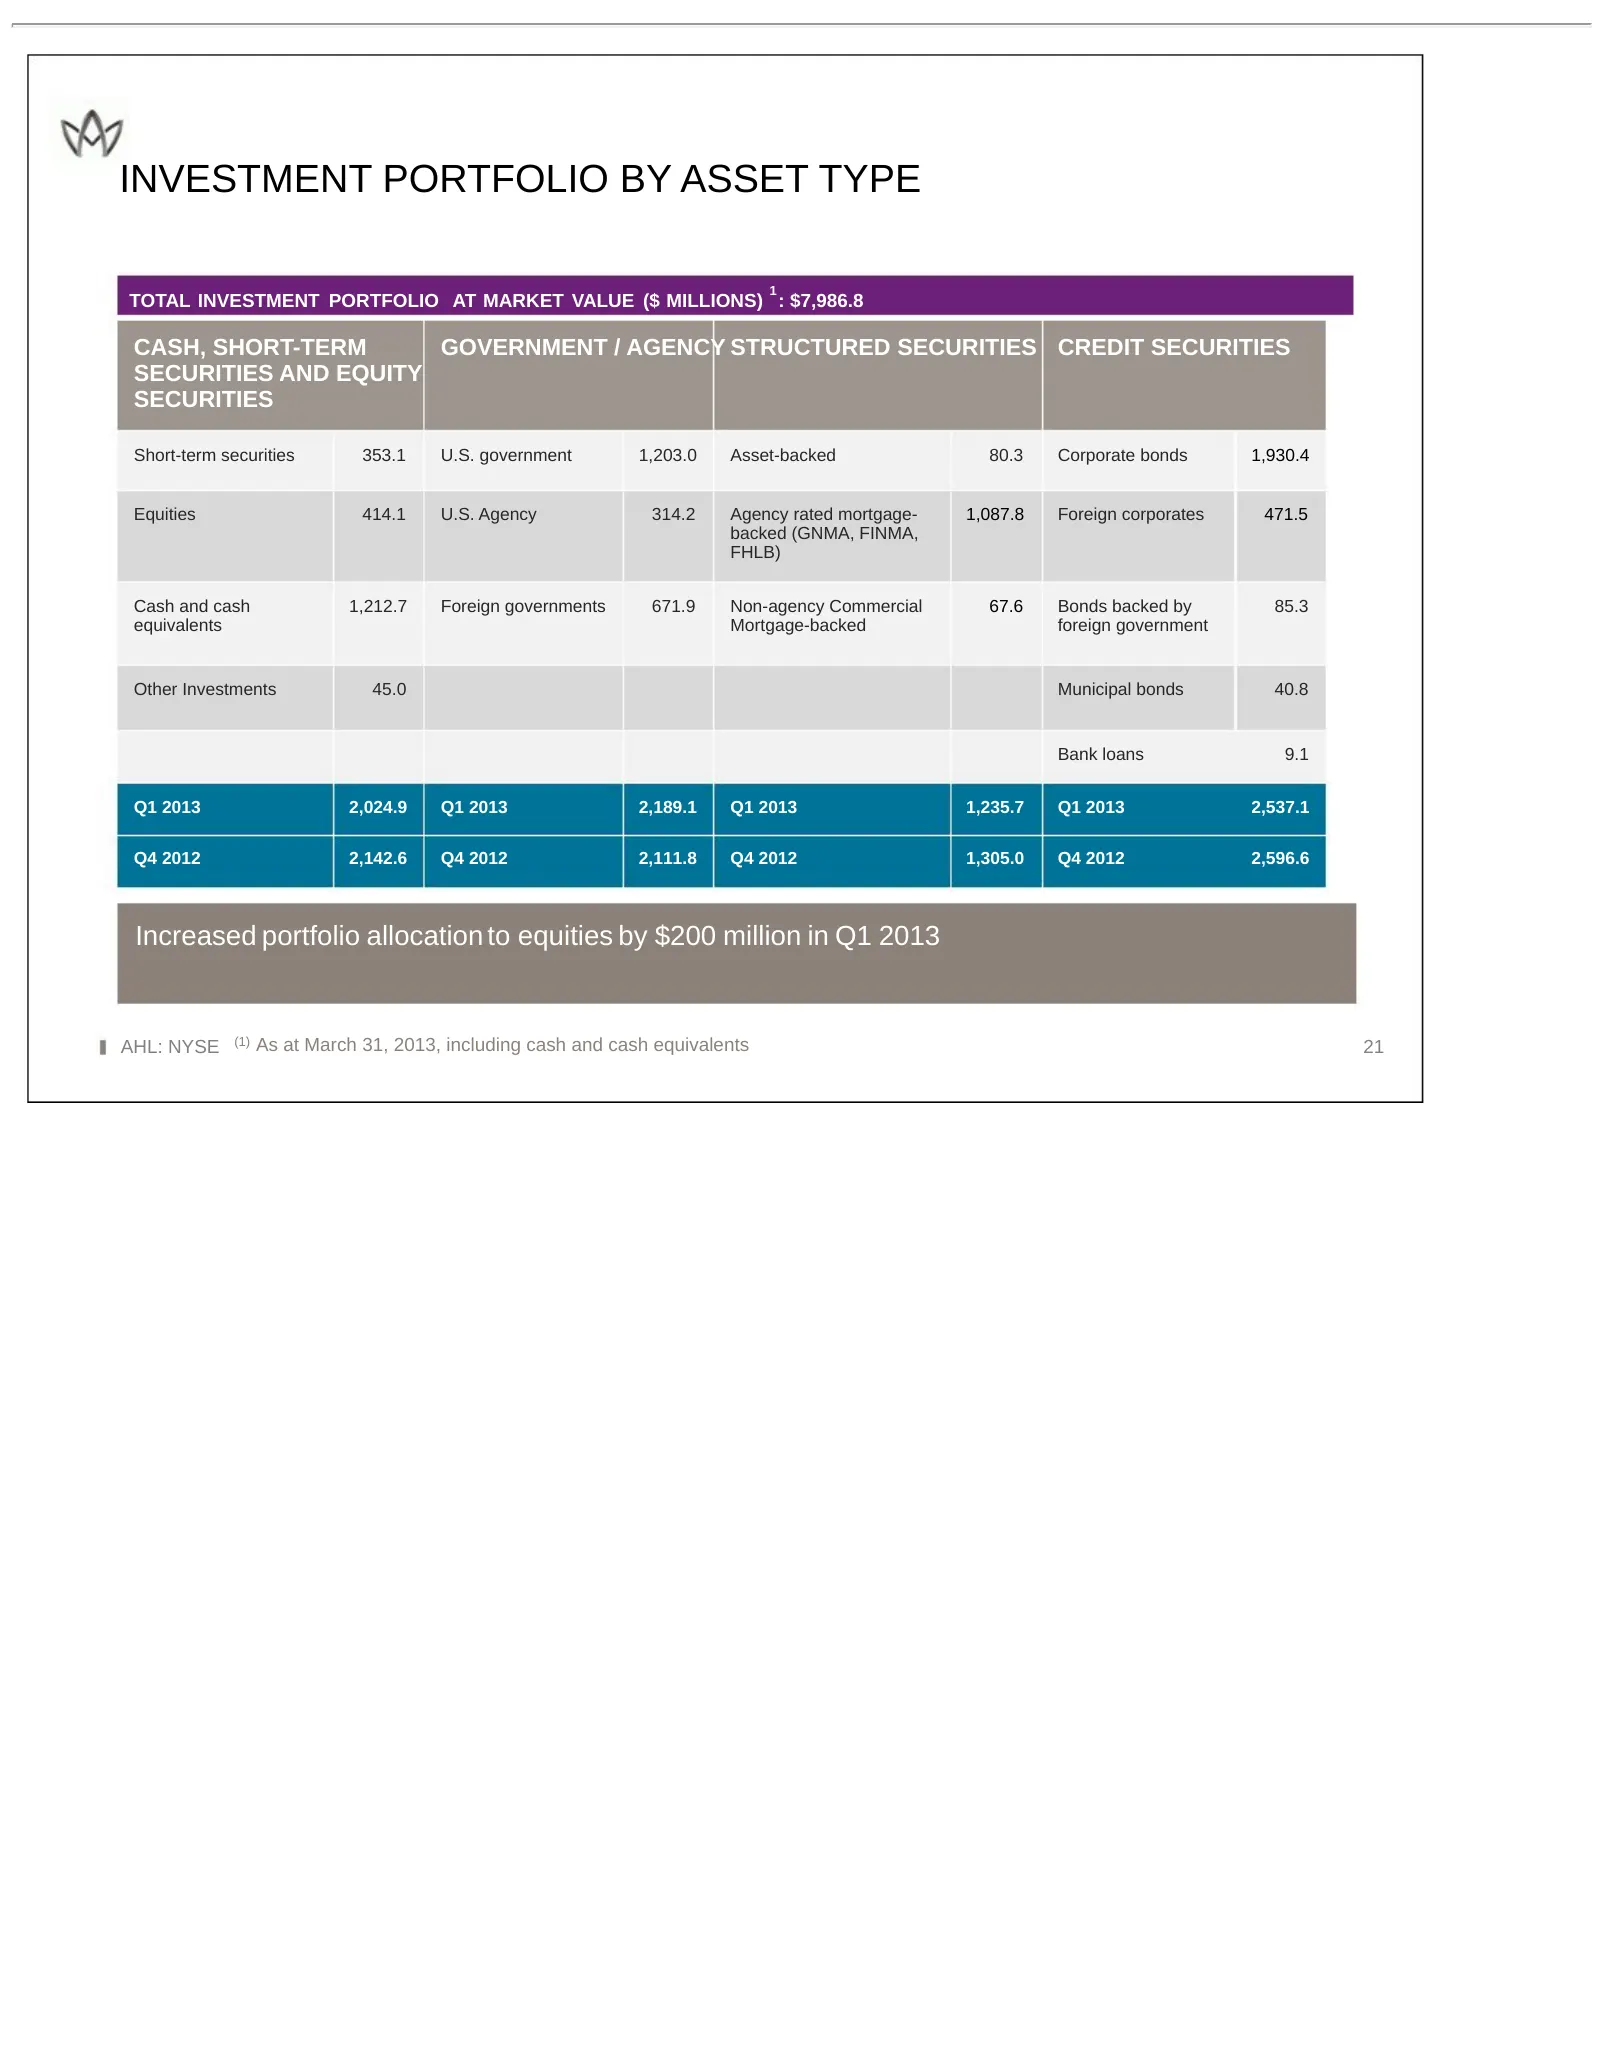
Slide 21: Investment Portfolio by Asset Type
INVESTMENT PORTFOLIO BY ASSET TYPE 1 TOTAL INVESTMENT PORTFOLIO AT MARKET VALUE ($ MILLIONS) : $7,986.8 CASH, SHORT-TERM GOVERNMENT / AGENCY STRUCTURED SECURITIES CREDIT SECURITIES SECURITIES AND EQUITY SECURITIES Short-term securities 353.1 U.S. government 1,203.0 Asset-backed 80.3 Corporate bonds
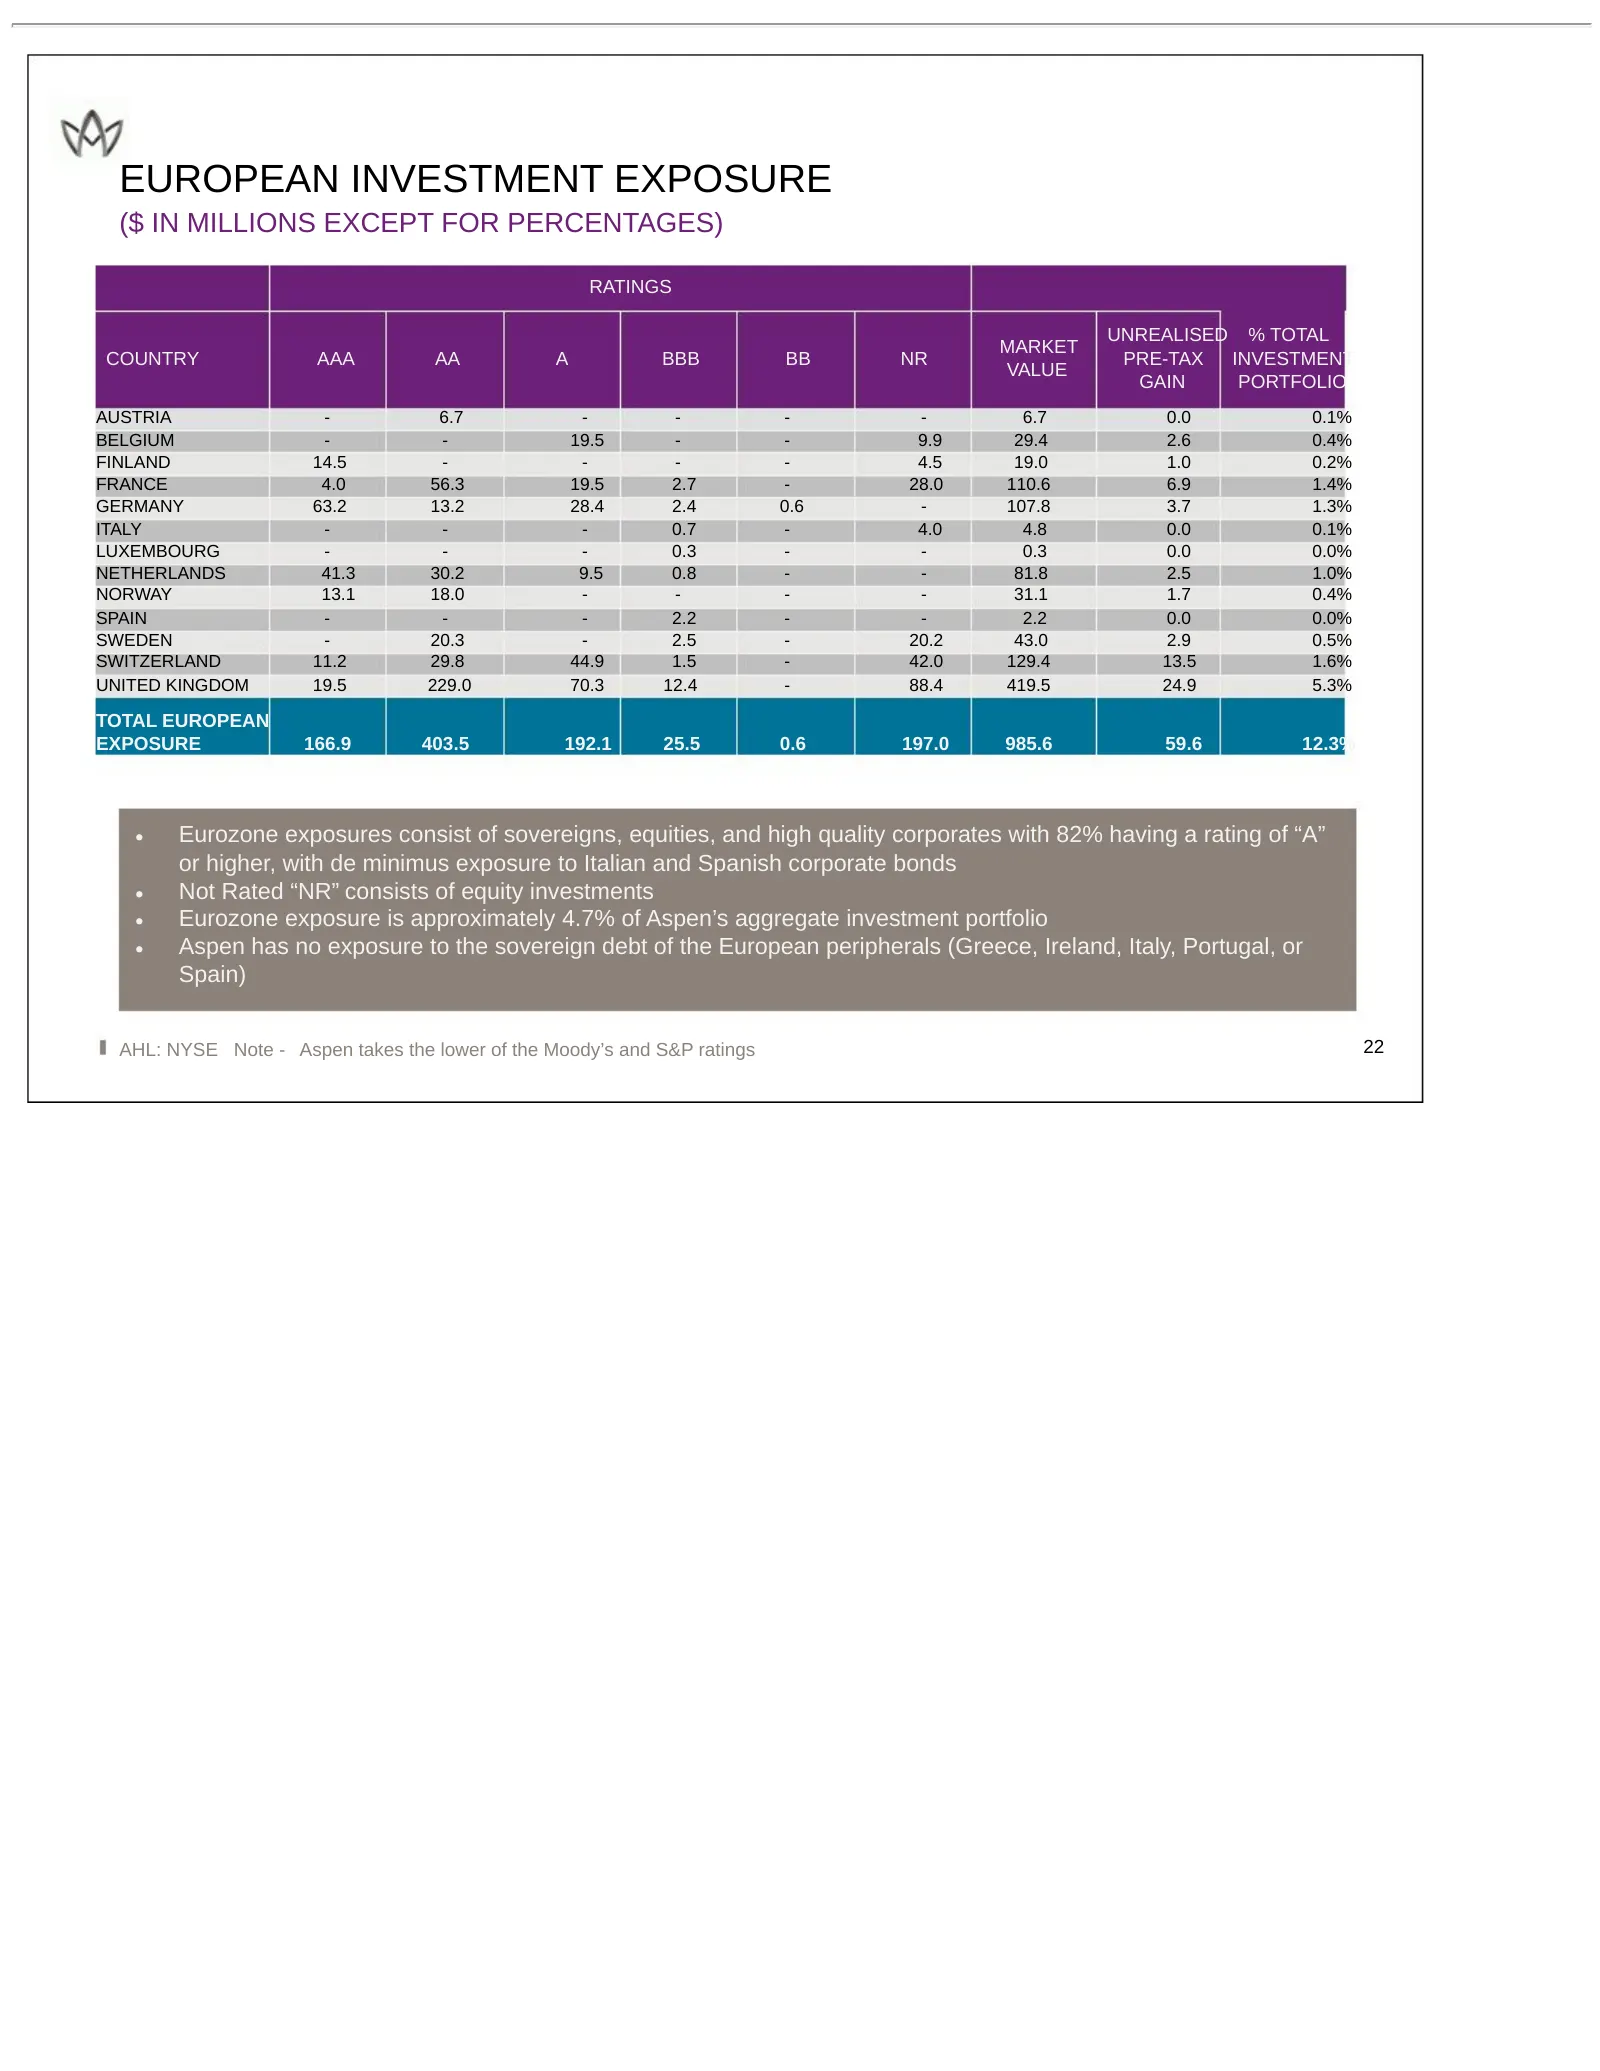
Slide 22: European Investment Exposure
EUROPEAN INVESTMENT EXPOSURE ($ IN MILLIONS EXCEPT FOR PERCENTAGES) RATINGS UNREALISED % TOTAL MARKET COUNTRY AAA AA A BBB BB NR PRE-TAX INVESTMENT VALUE GAIN PORTFOLIO AUSTRIA - 6.7 - - - - 6.7 0.0 0.1% BELGIUM - - 19.5 - - 9.9 29.4 2.6 0.4% FINLAND 14.5 - - - - 4.5 19.0 1.0 0.2% FRANCE 4.0 56.3 19

Slide 23: Investor Presentation First Quarter 2013
INVESTOR PRESENTATION FIRST QUARTER 2013 Aspen Insurance Holdings Limited
Source: SEC EDGAR · 8-K filed May 13, 2013
More decks from Aspen Insurance Holdings Ltd
 Q1 2018 Earnings Presentation13 slides · May 2, 2018
 Q3 2017 Earnings Presentation20 slides · Nov 15, 2017
 Q2 2017 Earnings Presentation20 slides · Jul 26, 2017
 Q1 2017 Earnings Presentation20 slides · Apr 26, 2017
 Q4 2016 Earnings Presentation16 slides · Feb 14, 2017
 Q3 2016 Earnings Presentation16 slides · Oct 26, 2016