Broadmark Realty Capital — SPAC Merger (August 2019)
41 slides from Broadmark Realty Capital's SPAC merger presentation, Aug 12, 2019
Slide 1: Investor Presentation August 2019
Investor PresentationAugust 2019 Broadmark realty Capital
Slide 2: Disclaimer
Disclaimer This presentation contemplates the business combination (the “Business Combination”) pursuant to an Agreement and Plan of Merger (the “Merger Agreement”) among Trinity Merger Corporation, a Delaware corporation (“Trinity”), Trinity Sub Inc., a Maryland corporation and wholly-owned subsidi
Slide 3: Disclaimer: Cautionary Statement Concerning Forward-Looking Statements
Disclaimer Cautionary Statement Concerning Forward-Looking Statements This presentation contains forward-looking statements within the meaning of Section 27A of the Securities Act of 1933, as amended, and Section 21E of the Securities Exchange Act of 1934, as amended, conveying the expectations of m
Slide 4: Disclaimer: Use of Projections
Disclaimer Use of Projections This presentation contains financial forecasts and projections relating to the anticipated future financial performance of Trinity, the Target and the combined company. Such financial forecasts and projections constitute forward looking information, are for illustrative
Slide 5: Transaction Summary Overview
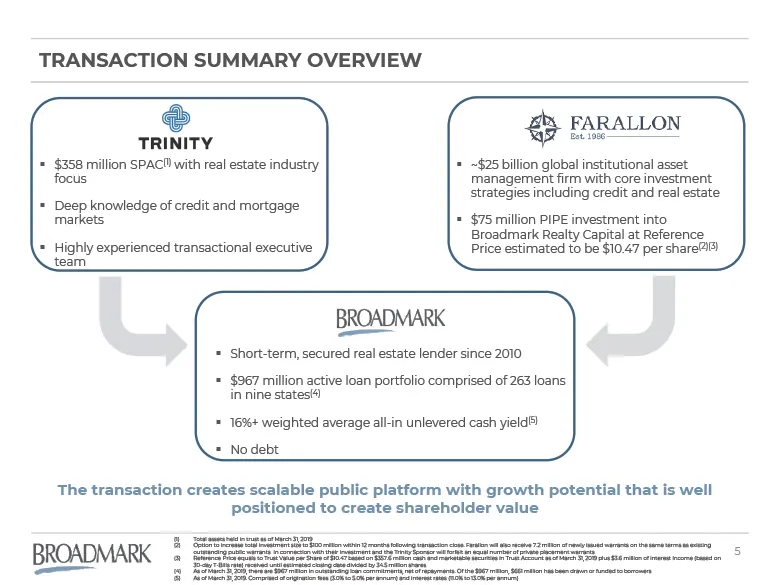
Transaction Summary Overview $358 million SPAC(1) with real estate industry focusDeep knowledge of credit and mortgage marketsHighly experienced transactional executive team ~$25 billion global institutional asset management firm with core investment strategies including credit and real estate$75 mi
Slide 6: Formation of a publicly-traded unlevered internally managed mortgage REIT
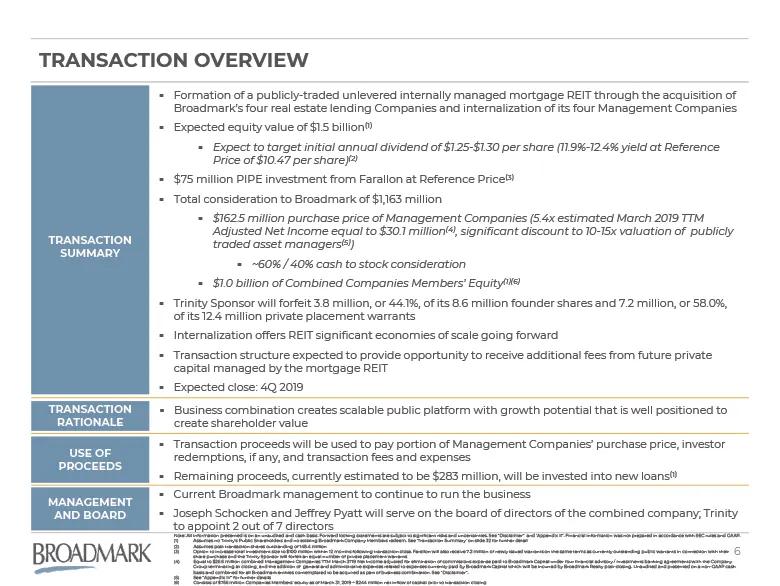
Formation of a publicly-traded unlevered internally managed mortgage REIT through the acquisition of Broadmark’s four real estate lending Companies and internalization of its four Management CompaniesExpected equity value of $1.5 billion(1)Expect to target initial annual dividend of $1.25-$1.30 per
Slide 7: Broadmark Overview
Broadmark Overview Section 1
Slide 8: Broadmark Realty Capital Overview
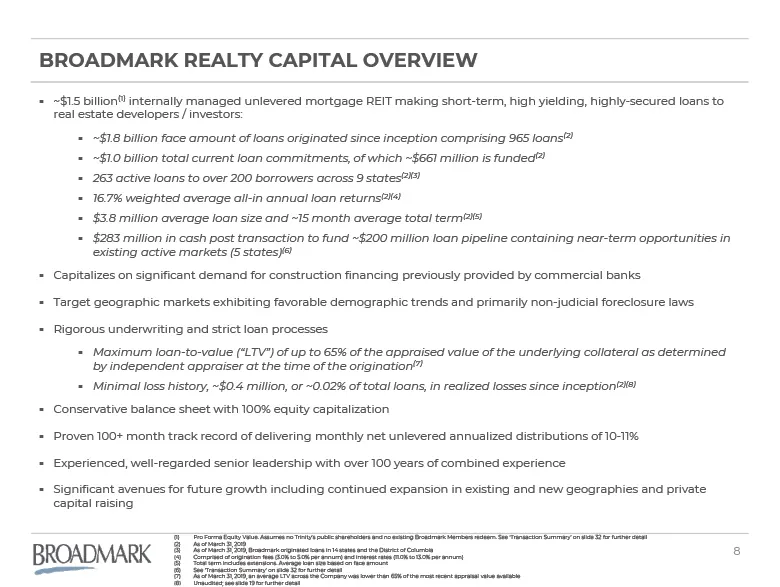
Broadmark REALTY CAPITAL Overview ~$1.5 billion(1) internally managed unlevered mortgage REIT making short-term, high yielding, highly-secured loans to real estate developers / investors:~$1.8 billion face amount of loans originated since inception comprising 965 loans(2)~$1.0 billion total current
Slide 9: Highlights
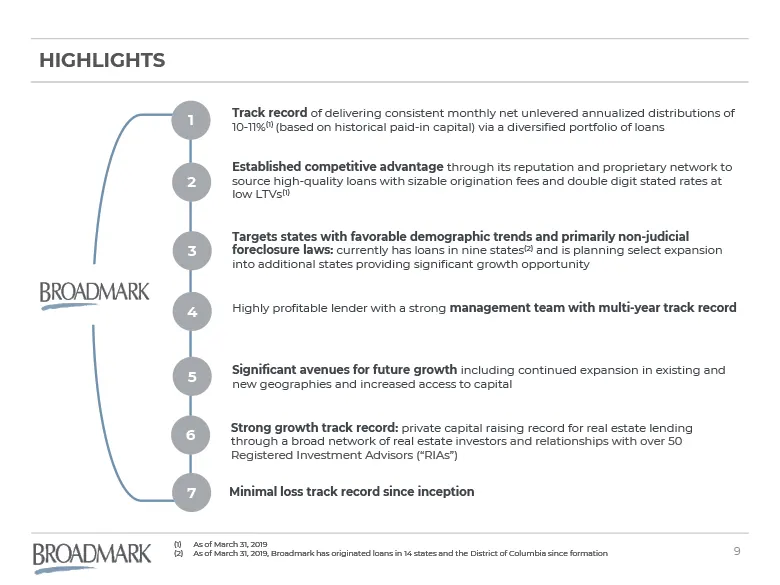
As of March 31, 2019As of March 31, 2019, Broadmark has originated loans in 14 states and the District of Columbia since formation Track record of delivering consistent monthly net unlevered annualized distributions of 10-11%(1) (based on historical paid-in capital) via a diversified portfolio of lo
Slide 10: 1. Track Record: Rapid AUM Growth + Steady 10-11% Distributions
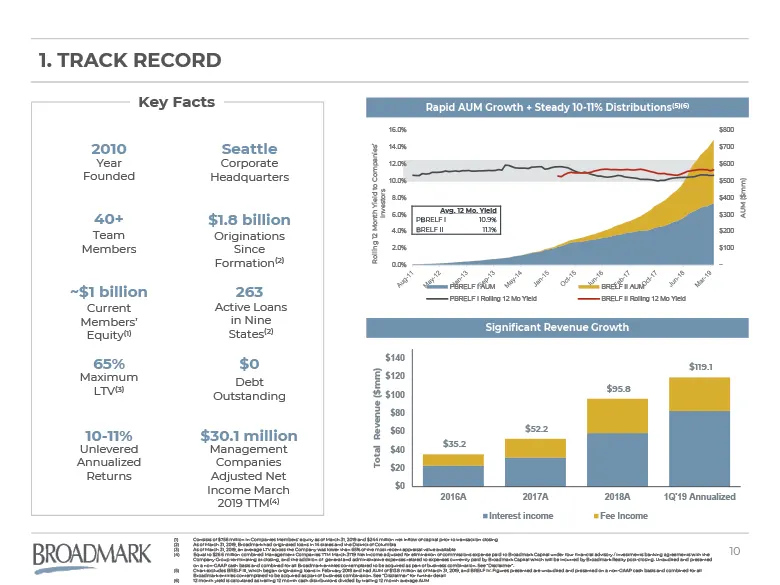
1. Track record Rapid AUM Growth + Steady 10-11% Distributions(5)(6) Consists of $756 million in Companies Members’ equity as of March 31, 2019 and $244 million net inflow of capital prior to transaction closingAs of March 31, 2019, Broadmark had originated loans in 14 states and the District of Col
Slide 11: 1. Track Record (Cont'd)
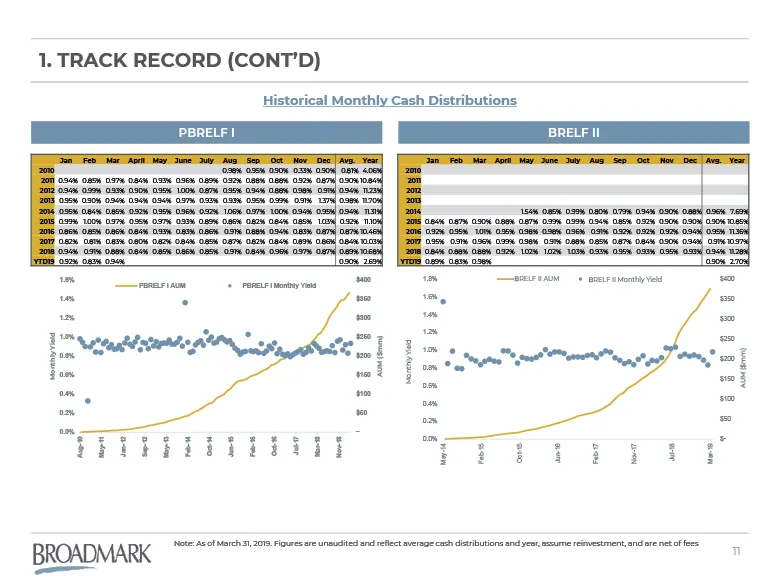
1. Track record (Cont’d) Note: As of March 31, 2019. Figures are unaudited and reflect average cash distributions and year, assume reinvestment, and are net of fees PBRELF I BRELF II Historical Monthly Cash Distributions Jan Feb Mar April May June July Aug Sep Oct Nov Dec Avg. Year 2010 0.98% 0.95%
Slide 12: 2. Established Competitive Advantage
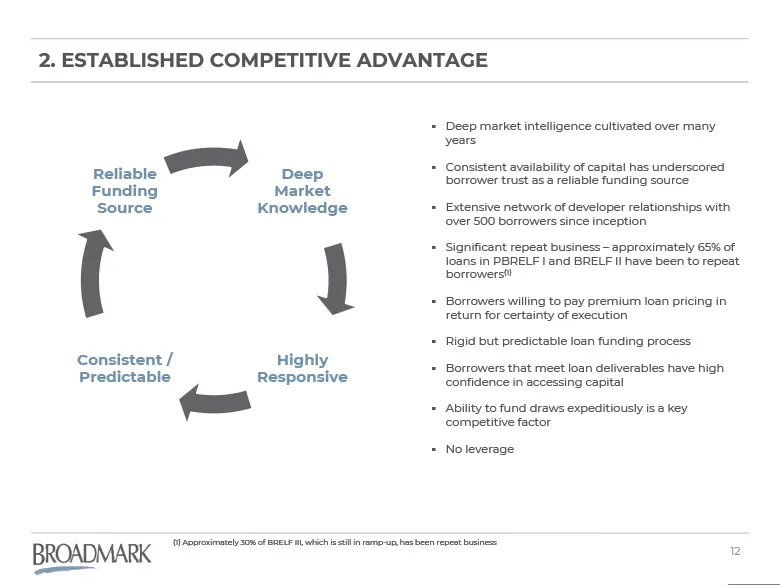
2. ESTABLISHED COMPETITIVE ADVANTAGE Deep market intelligence cultivated over many yearsConsistent availability of capital has underscored borrower trust as a reliable funding sourceExtensive network of developer relationships with over 500 borrowers since inceptionSignificant repeat business – appr
Slide 13: 2. ...And Differentiated High-Yielding Growth Opportunity
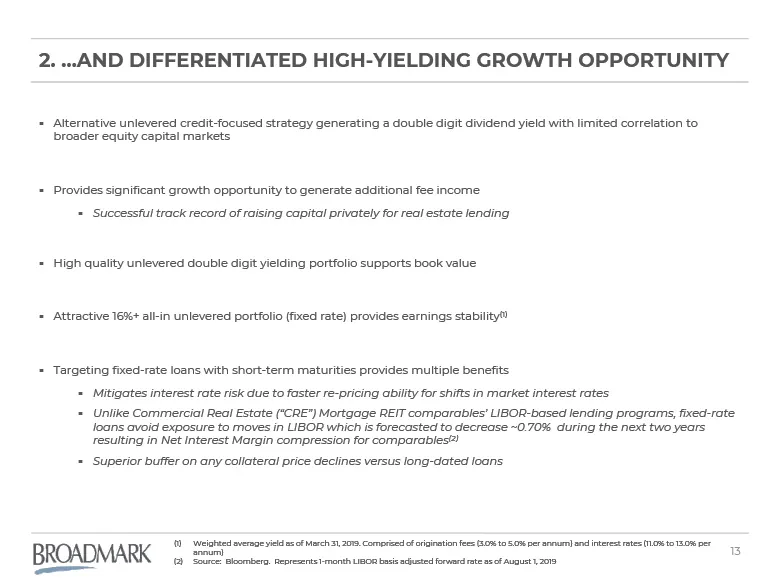
2. …And Differentiated High-Yielding Growth Opportunity Alternative unlevered credit-focused strategy generating a double digit dividend yield with limited correlation to broader equity capital marketsProvides significant growth opportunity to generate additional fee incomeSuccessful track record of
Slide 14: 3. Target States with Favorable Demographic Trends
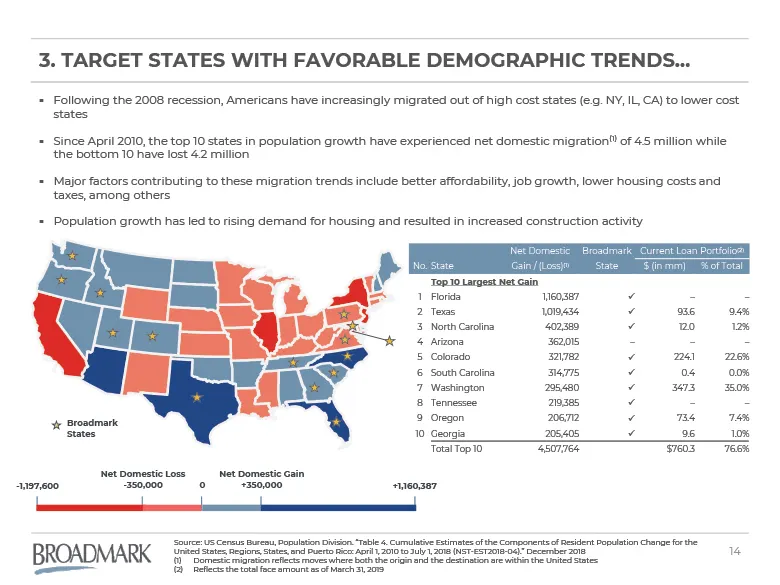
Net Domestic Broadmark Current Loan Portfolio(2) No. State Gain / (Loss)(1) State $ (in mm) % of Total Top 10 Largest Net Gain 1 Florida 1,160,387 ü – – 2 Texas 1,019,434 ü 93.6 9.4% 3 North Carolina 402,389 ü 12.0 1.2% 4 Arizona 362,015 – – – 5 Colorado 321,782 ü 224.1 22.6% 6 South Carolina 314,77
Slide 15: 3. ...and States with Non-Judicial Foreclosure Laws
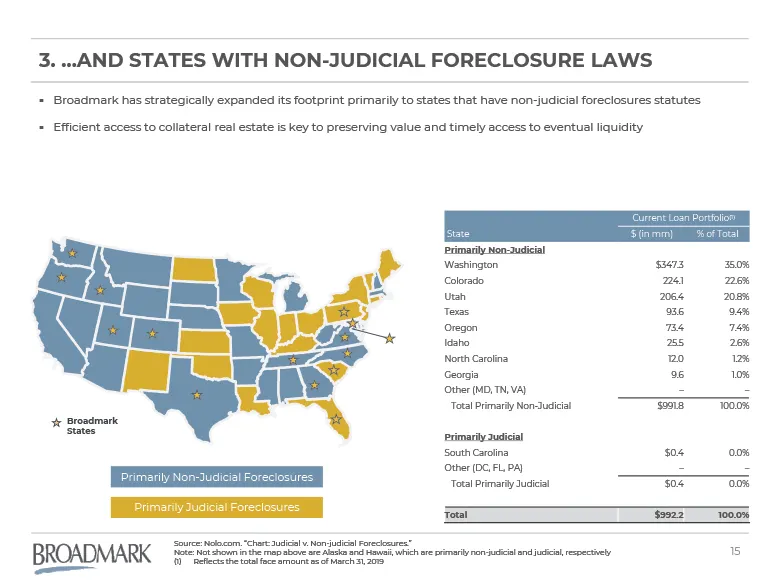
Current Loan Portfolio(1) State $ (in mm) % of Total Primarily Non-Judicial Washington $347.3 35.0% Colorado 224.1 22.6% Utah 206.4 20.8% Texas 93.6 9.4% Oregon 73.4 7.4% Idaho 25.5 2.6% North Carolina 12.0 1.2% Georgia 9.6 1.0% Other (MD, TN, VA) – – Total Primarily Non-Judicial $991.8 100.0% Prima
Slide 16: 4. Management Team with Multi-Year Track Record
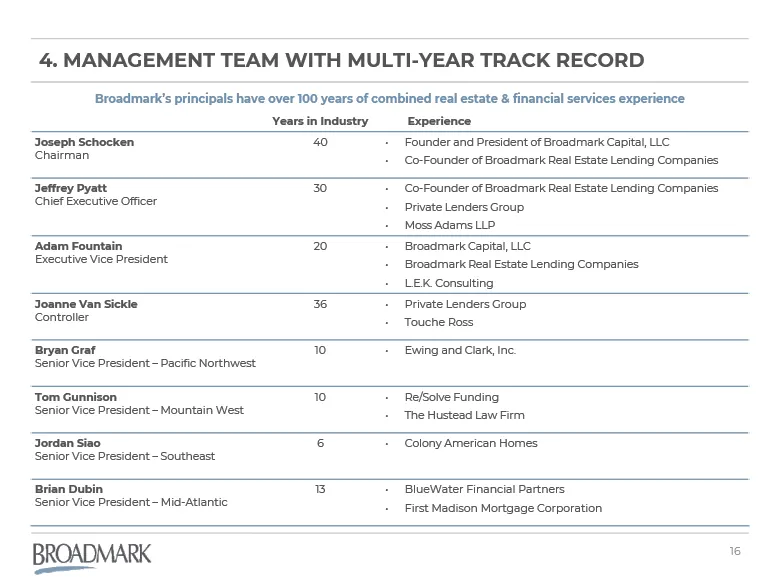
4. management team WITH MULTI-YEAR TRACK RECORD Broadmark’s principals have over 100 years of combined real estate & financial services experience Years in Industry Experience Joseph SchockenChairman 40 Founder and President of Broadmark Capital, LLCCo-Founder of Broadmark Real Estate Lending Compan
Slide 17: 5. Significant Avenues for Future Growth
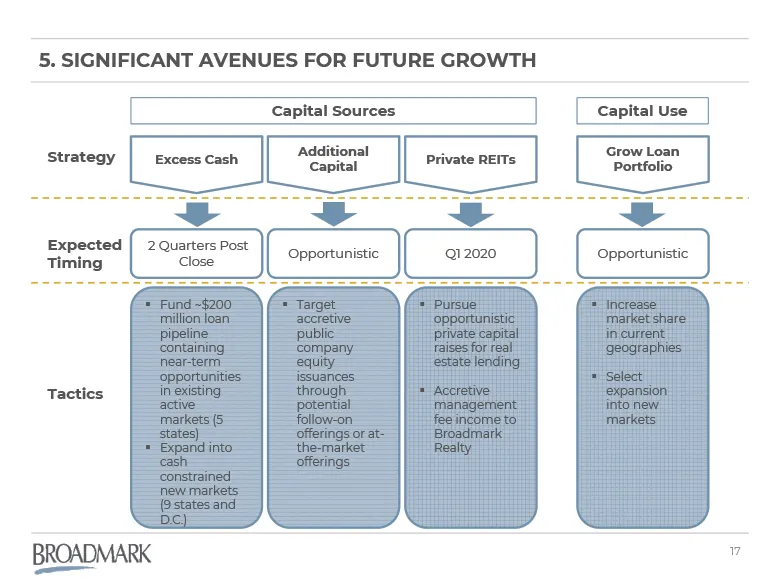
Increase market share in current geographiesSelect expansion into new markets Grow Loan Portfolio Opportunistic Tactics Fund ~$200 million loan pipeline containing near-term opportunities in existing active markets (5 states)Expand into cash constrained new markets (9 states and D.C.) Excess Cash 2
Slide 18: 6. Strong Growth Track Record
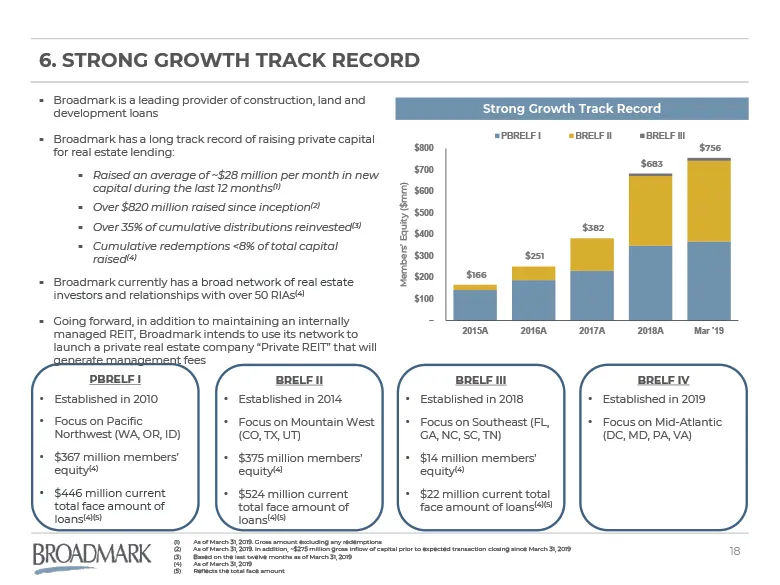
Strong Growth Track Record 6. Strong Growth Track Record PBRELF IEstablished in 2010Focus on Pacific Northwest (WA, OR, ID)$367 million members’ equity(4)$446 million current total face amount of loans(4)(5) BRELF IIEstablished in 2014Focus on Mountain West (CO, TX, UT)$375 million members’ equity(4
Slide 19: 7. Minimal Loss Track Record Since Inception
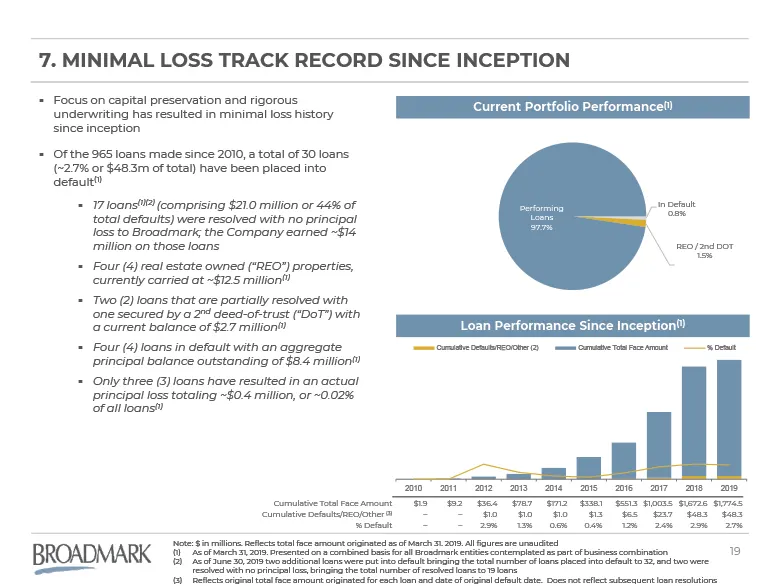
7. Minimal loss Track Record Since Inception Note: $ in millions. Reflects total face amount originated as of March 31. 2019. All figures are unauditedAs of March 31, 2019. Presented on a combined basis for all Broadmark entities contemplated as part of business combinationAs of June 30, 2019 two ad
Slide 20: Summary Loan Overview
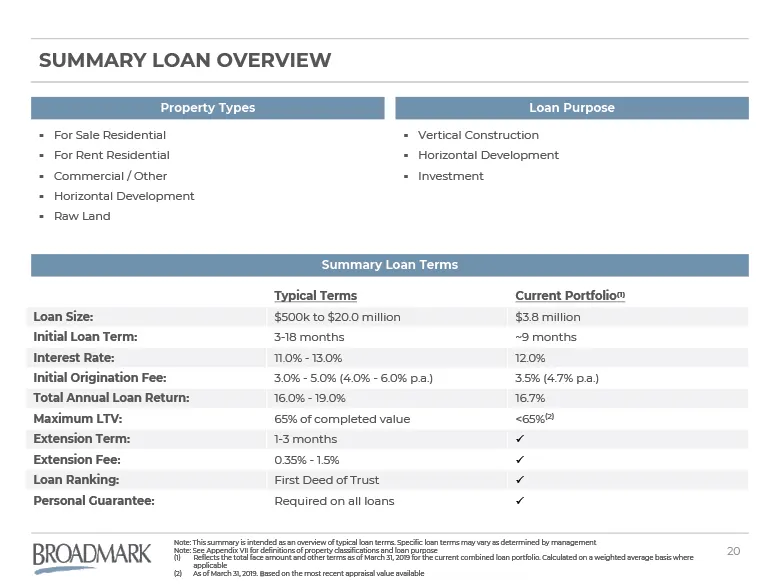
Summary loan overview Property Types Loan Purpose Summary Loan Terms For Sale ResidentialFor Rent ResidentialCommercial / OtherHorizontal DevelopmentRaw Land Vertical ConstructionHorizontal DevelopmentInvestment Note: This summary is intended as an overview of typical loan terms. Specific loan terms
Slide 21: Rigorous and Responsive Underwriting Process
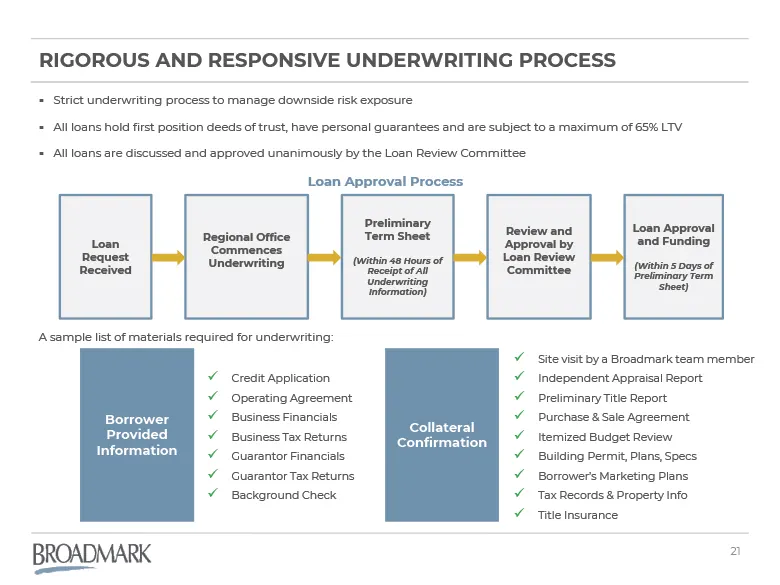
Rigorous and responsive Underwriting process Credit ApplicationOperating AgreementBusiness FinancialsBusiness Tax ReturnsGuarantor FinancialsGuarantor Tax ReturnsBackground Check Site visit by a Broadmark team memberIndependent Appraisal ReportPreliminary Title ReportPurchase & Sale AgreementItemize
Slide 22: Loan Servicing Overview
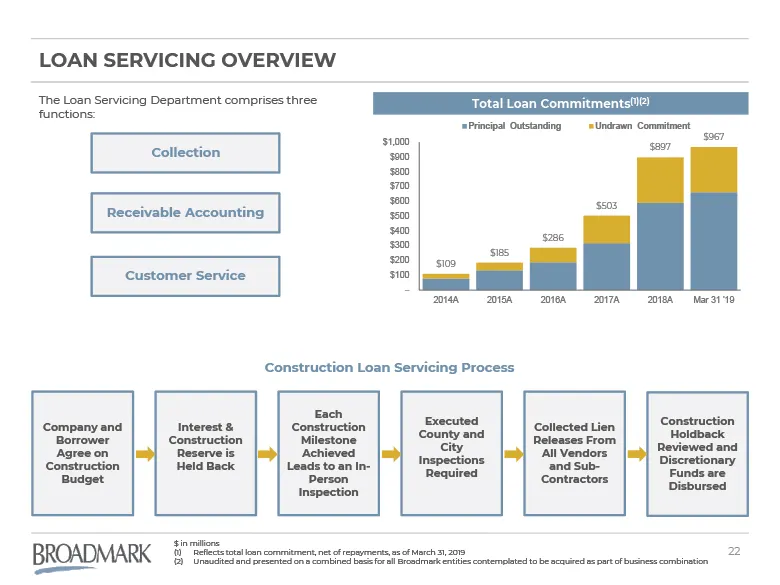
Collection Receivable Accounting Customer Service Loan servicing overview The Loan Servicing Department comprises three functions: Company and Borrower Agree on Construction Budget Construction Loan Servicing Process Interest & Construction Reserve is Held Back Each Construction Milestone Achieved L
Slide 23: Loan Overview by Property Classification
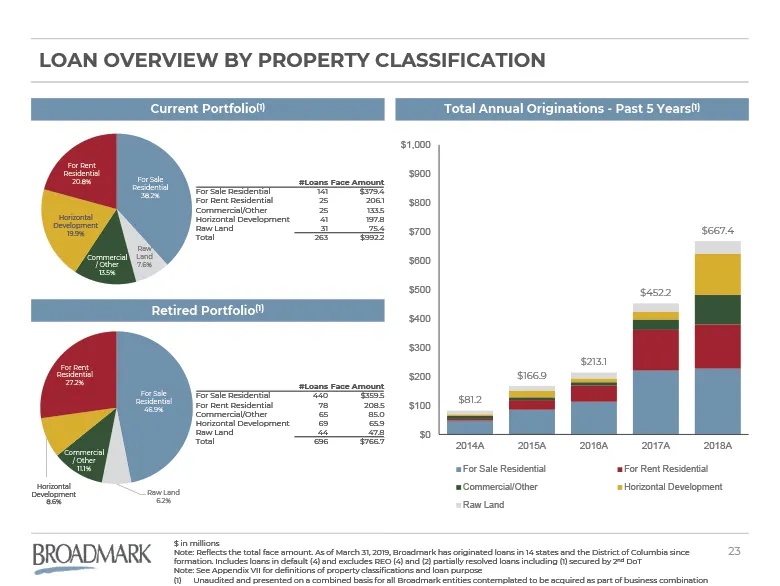
Loan overview by property Classification Current Portfolio(1) Total Annual Originations - Past 5 Years(1) Retired Portfolio(1) $ in millionsNote: Reflects the total face amount. As of March 31, 2019, Broadmark has originated loans in 14 states and the District of Columbia since formation. Includes l
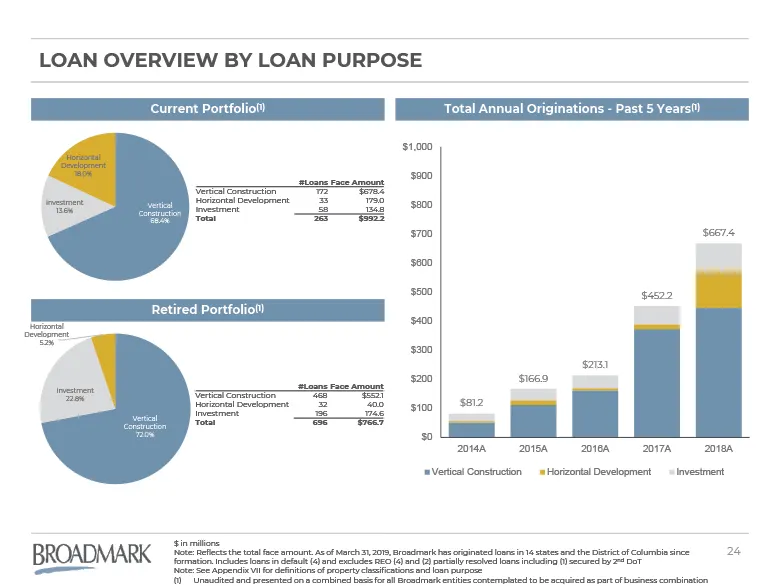
Slide 24: Loan Overview by Loan Purpose
#Loans Face Amount Vertical Construction 172 $678.4 Horizontal Development 33 179.0 Investment 58 134.8 Total 263 $992.2 Loan overview BY loan purpose Current Portfolio(1) Total Annual Originations - Past 5 Years(1) Retired Portfolio(1) $ in millionsNote: Reflects the total face amount. As of March
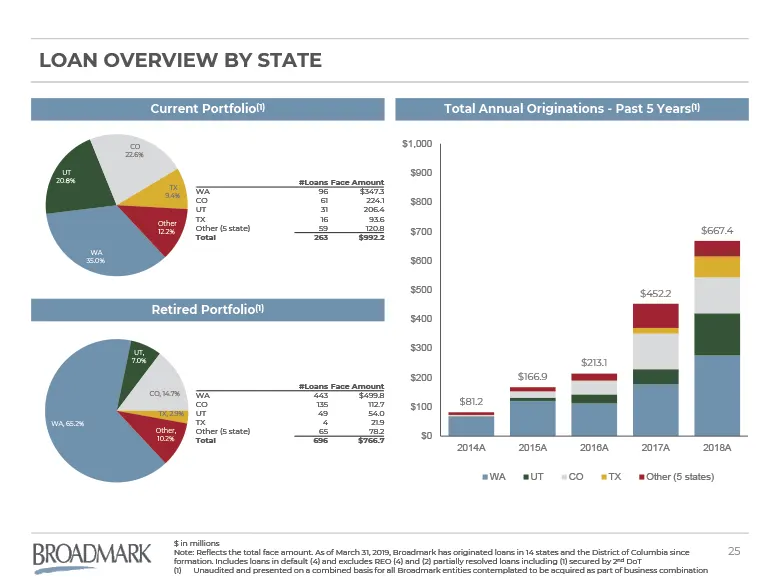
Slide 25: Loan Overview by State
#Loans Face Amount WA 443 $499.8 CO 135 112.7 UT 49 54.0 TX 4 21.9 Other (5 state) 65 78.2 Total 696 $766.7 Loan overview BY state Retired Portfolio(1) Current Portfolio(1) Total Annual Originations - Past 5 Years(1) $ in millionsNote: Reflects the total face amount. As of March 31, 2019, Broadmark
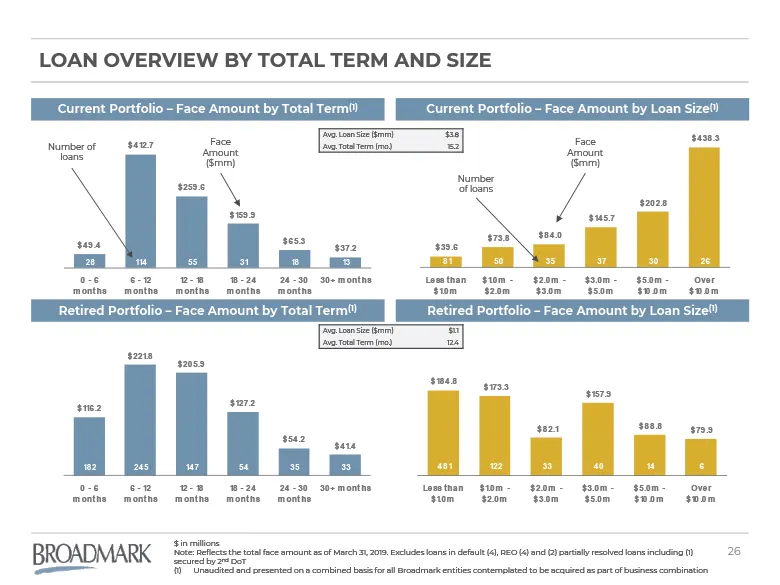
Slide 26: Loan Overview by Total Term and Size
Loan overview BY Total Term and SIZE Current Portfolio – Face Amount by Total Term(1) Retired Portfolio – Face Amount by Total Term(1) Number of loans Face Amount ($mm) Current Portfolio – Face Amount by Loan Size(1) Retired Portfolio – Face Amount by Loan Size(1) Face Amount ($mm) Number of loans $

Slide 27: Financial Overview
Financial Overview Section 2
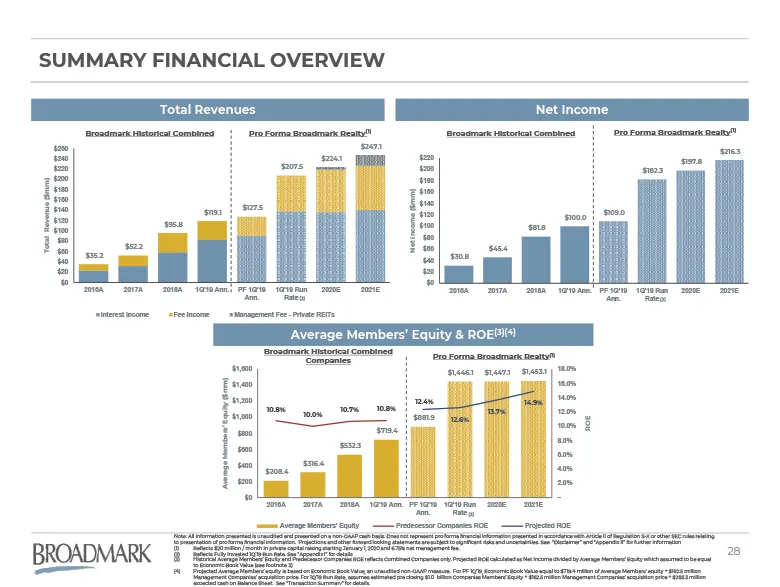
Slide 28: Summary Financial Overview
Summary Financial Overview Total Revenues Net Income Broadmark Historical Combined Broadmark Historical Combined Note: All information presented is unaudited and presented on a non-GAAP cash basis. Does not represent pro forma financial information presented in accordance with Article II of Regulati
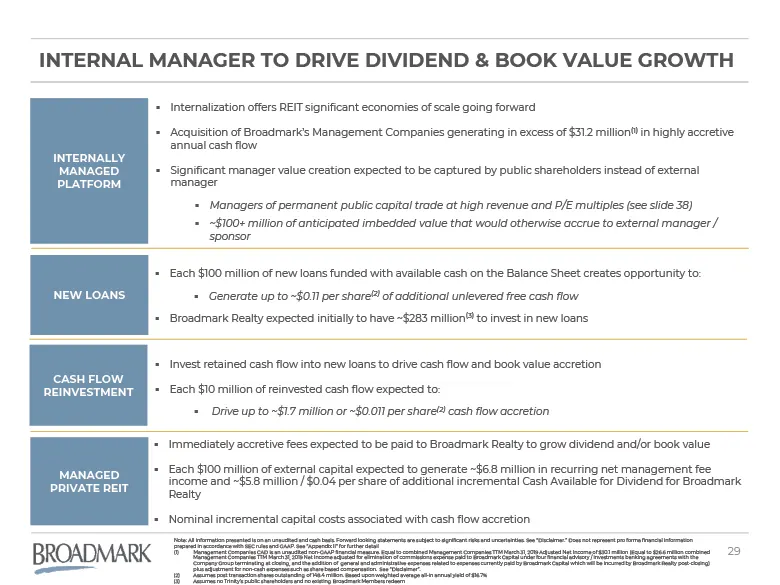
Slide 29: Invest Retained Cash Flow into New Loans
Invest retained cash flow into new loans to drive cash flow and book value accretionEach $10 million of reinvested cash flow expected to: Drive up to ~$1.7 million or ~$0.011 per share(2) cash flow accretion INTERNAL Manager to DRIVE Dividend & Book Value growth NEW LOANS Each $100 million of new lo
Slide 30: Transaction Overview
Transaction Overview Section 3
Slide 31: Transaction Structure
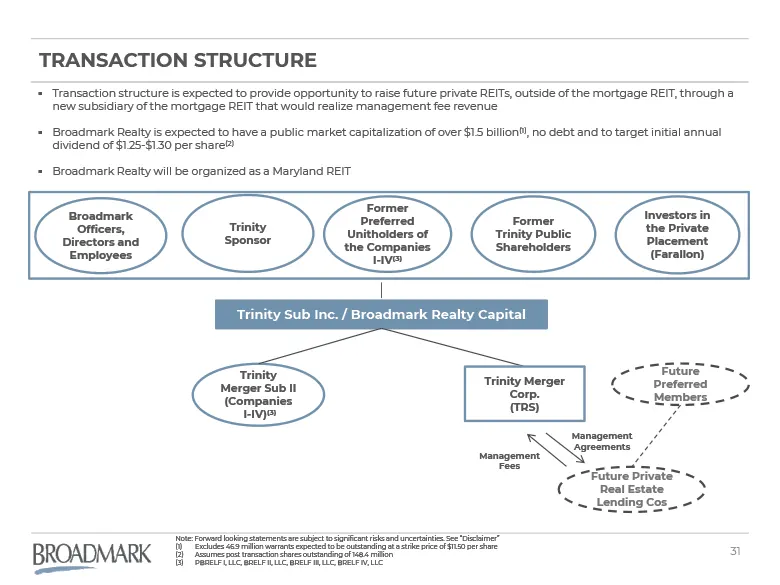
Transaction structure Transaction structure is expected to provide opportunity to raise future private REITs, outside of the mortgage REIT, through a new subsidiary of the mortgage REIT that would realize management fee revenueBroadmark Realty is expected to have a public market capitalization of ov
Slide 32: Transaction Summary
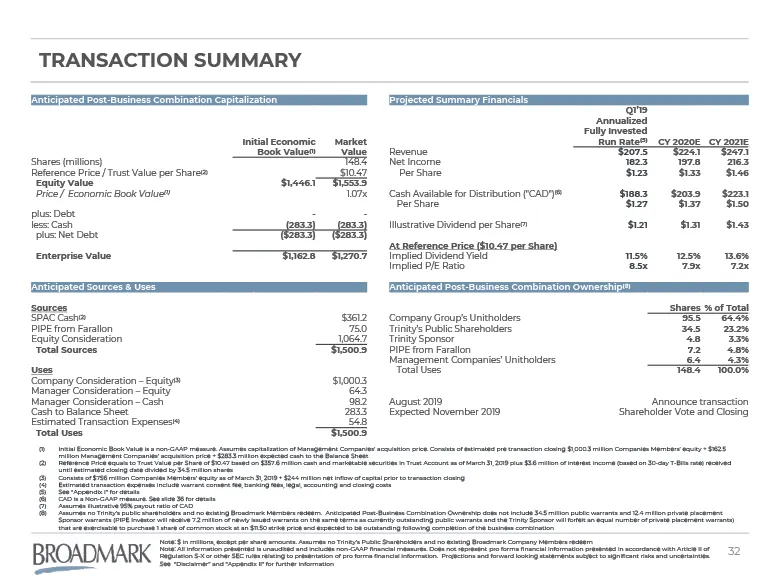
transaction summary Anticipated Post-Business Combination Capitalization Projected Summary Financials Q1’19 Annualized Fully Invested Initial Economic Market Run Rate(5) CY 2020E CY 2021E Book Value(1) Value Revenue $207.5 $224.1 $247.1 Shares (millions) 148.4 Net Income 182.3 197.8 216.3 Reference
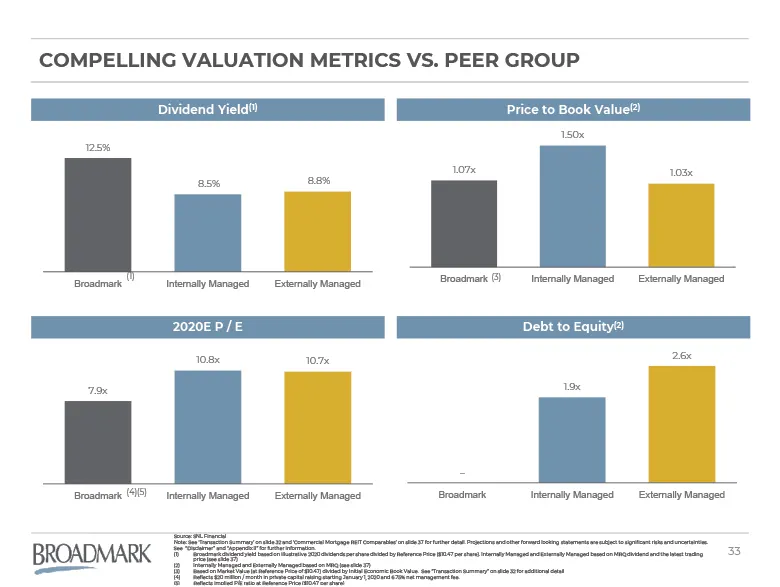
Slide 33: Compelling Valuation Metrics vs. Peer Group
Compelling Valuation Metrics vs. PEER Group Dividend Yield(1) Source: SNL FinancialNote: See ‘Transaction Summary’ on slide 32 and ‘Commercial Mortgage REIT Comparables’ on slide 37 for further detail. Projections and other forward looking statements are subject to significant risks and uncertaintie
Slide 34: Appendix
APPENDIX v Section 4
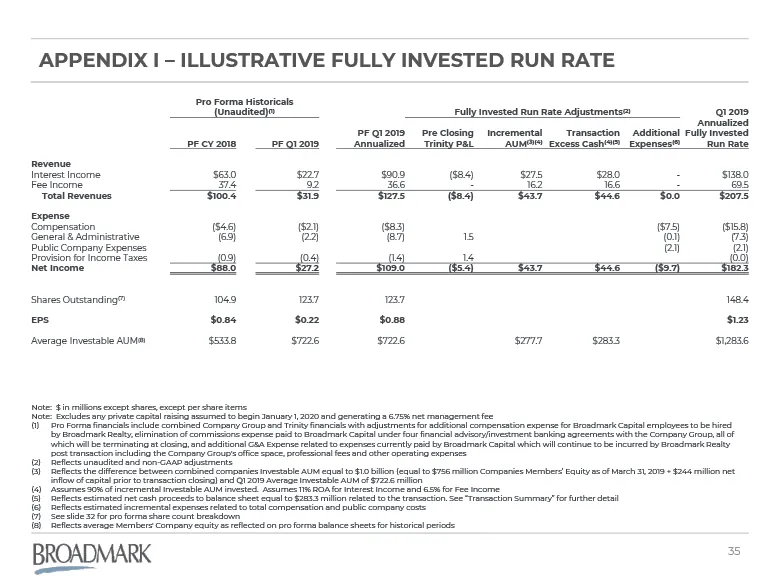
Slide 35: Appendix I - Illustrative Fully Invested Run Rate
Appendix I – Illustrative Fully Invested Run Rate Note: $ in millions except shares, except per share itemsNote: Excludes any private capital raising assumed to begin January 1, 2020 and generating a 6.75% net management feePro Forma financials include combined Company Group and Trinity financials w
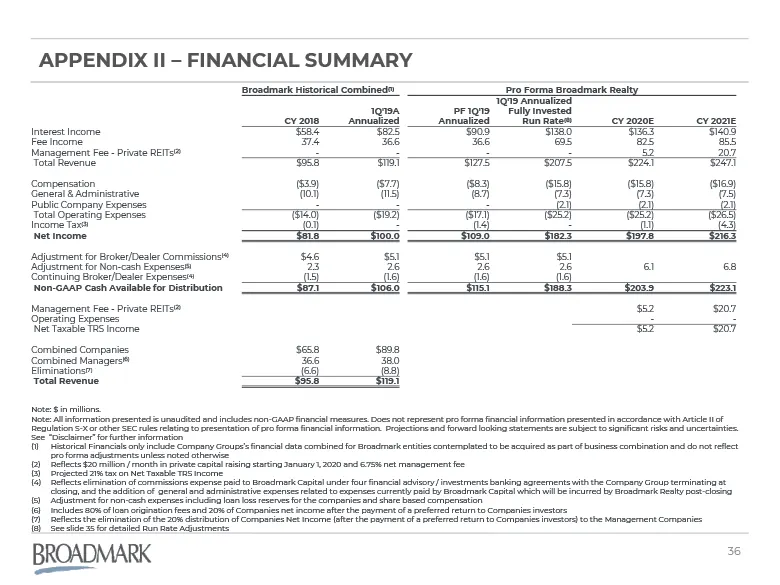
Slide 36: Appendix II - Financial Summary
Appendix II – Financial summary Note: $ in millions. Note: All information presented is unaudited and includes non-GAAP financial measures. Does not represent pro forma financial information presented in accordance with Article II of Regulation S-X or other SEC rules relating to presentation of pro
Slide 37: Commercial Mortgage REIT Comparables
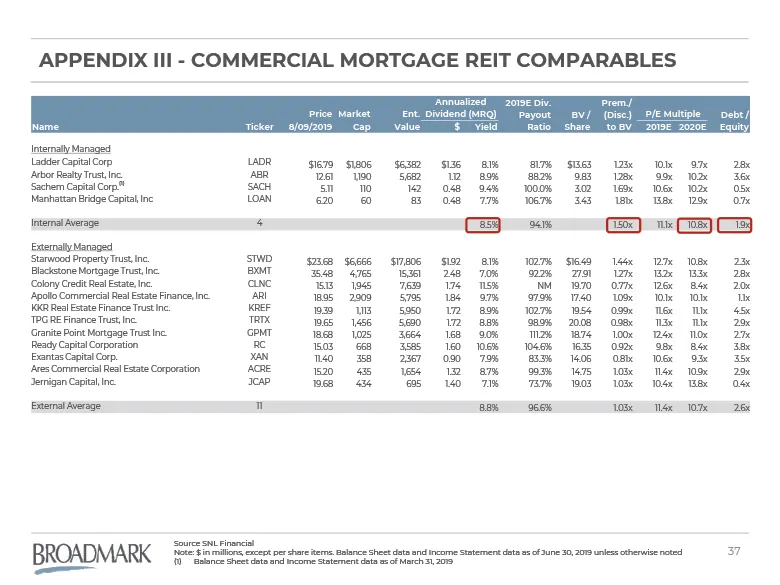
Annualized 2019E Div. Prem./ Price Market Ent. Dividend (MRQ) Payout BV / (Disc.) P/E Multiple Debt / Name Ticker 8/09/2019 Cap Value $ Yield Ratio Share to BV 2019E 2020E Equity Internally Managed Ladder Capital Corp LADR $16.79 $1,806 $6,382 $1.36 8.1% 81.7% $13.63 1.23x 10.1x 9.7x 2.8x Arbor Real
Slide 38: Appendix IV - Asset Manager Comparables
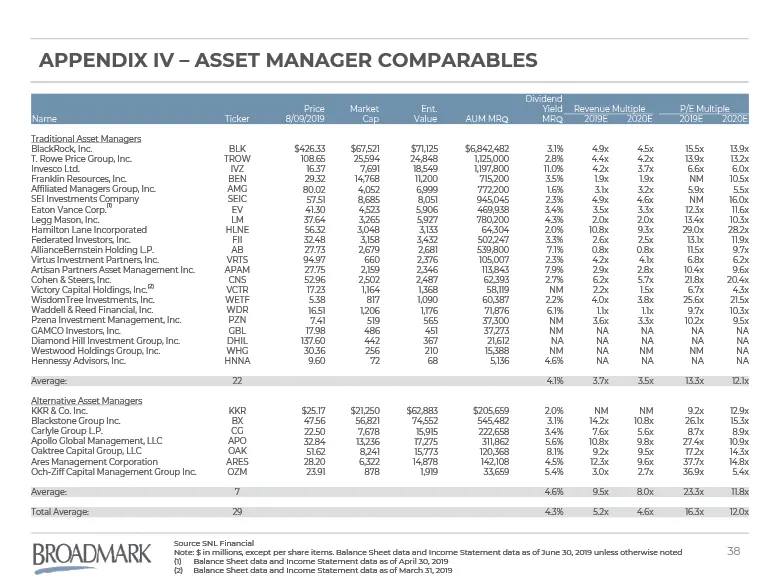
Appendix IV – Asset Manager Comparables Source SNL FinancialNote: $ in millions, except per share items. Balance Sheet data and Income Statement data as of June 30, 2019 unless otherwise notedBalance Sheet data and Income Statement data as of April 30, 2019Balance Sheet data and Income Statement dat
Slide 39: Appendix V: Evolution of Construction Financing Landscape
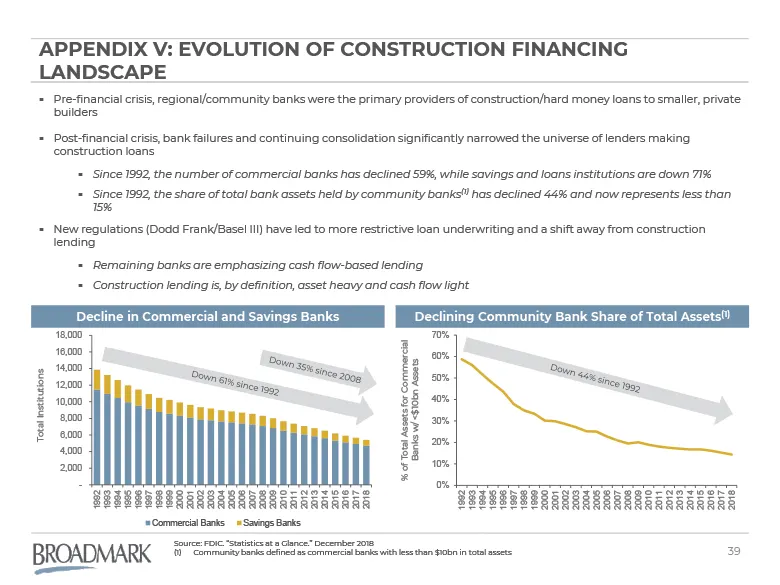
Pre-financial crisis, regional/community banks were the primary providers of construction/hard money loans to smaller, private buildersPost-financial crisis, bank failures and continuing consolidation significantly narrowed the universe of lenders making construction loansSince 1992, the number of c
Slide 40: Appendix VI: Steady Recovery in Housing Construction Trends
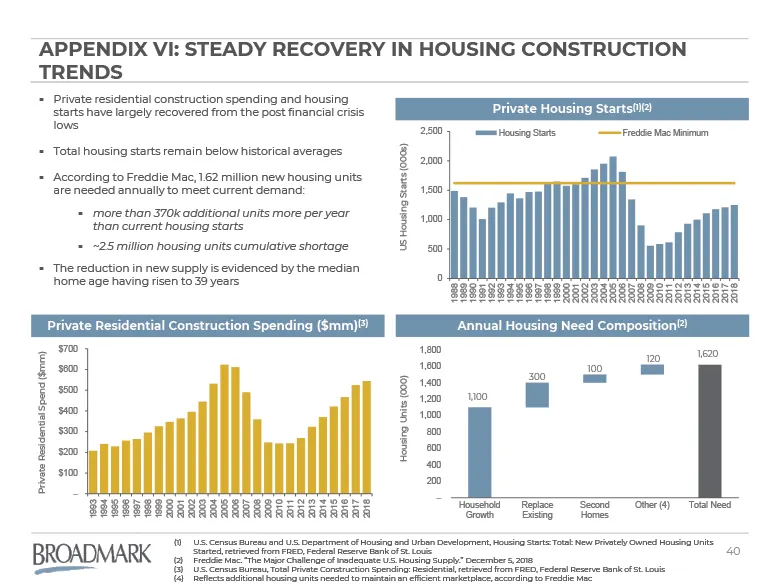
Private Residential Construction Spending ($mm)(3) Appendix VI: Steady recovery in Housing CONSTRUCTION TRENDS Private residential construction spending and housing starts have largely recovered from the post financial crisis lowsTotal housing starts remain below historical averagesAccording to Fred
Slide 41: Appendix VII: Definitions of Property Classifications and Loan Purpose
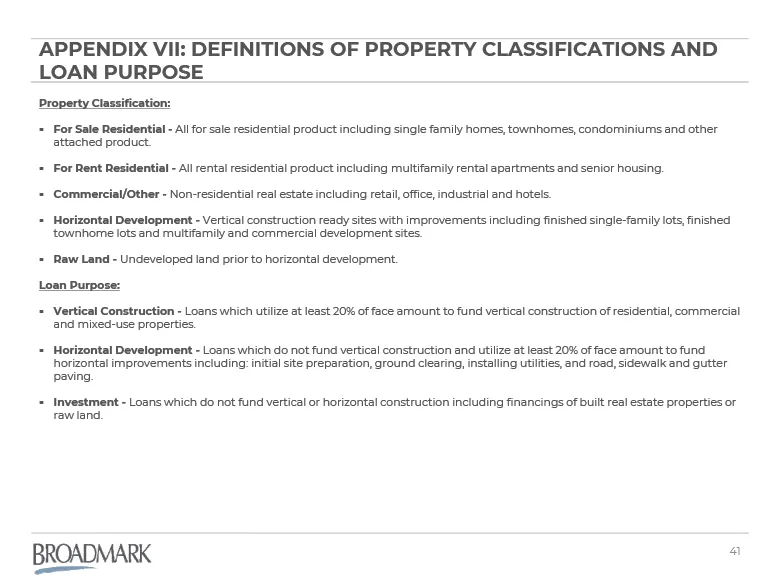
Appendix VII: definitions of property classifications and loan purpose Property Classification:For Sale Residential - All for sale residential product including single family homes, townhomes, condominiums and other attached product.For Rent Residential - All rental residential product including mul
Source: SEC EDGAR · 425 filed Aug 12, 2019