NexTier Oilfield Solutions Inc
NexTier Oilfield Solutions — JP Morgan Energy Conference 2022
22 slides from NexTier Oilfield Solutions's conference presentation, Jun 15, 2022
Slide 1: NexTier Oilfield Solutions JP Morgan Energy Conference June 2022
vo o d o o 1 NexTier Oilfield Solutions JP Morgan Energy Conference June 2022 NYSE: NEX
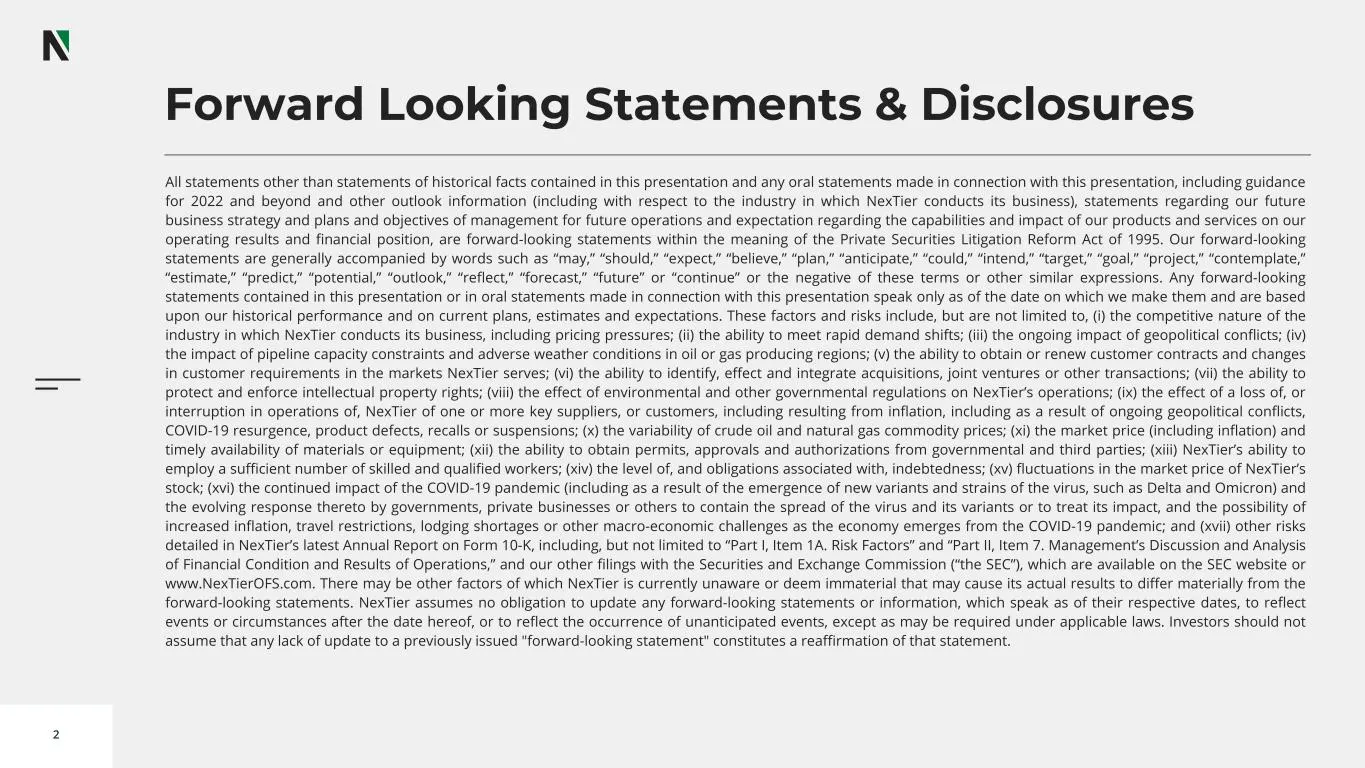
Slide 2: Forward Looking Statements & Disclosures
2 Forward Looking Statements & Disclosures All statements other than statements of historical facts contained in this presentation and any oral statements made in connection with this presentation, including guidance for 2022 and beyond and other outlook information (including with respect to the in
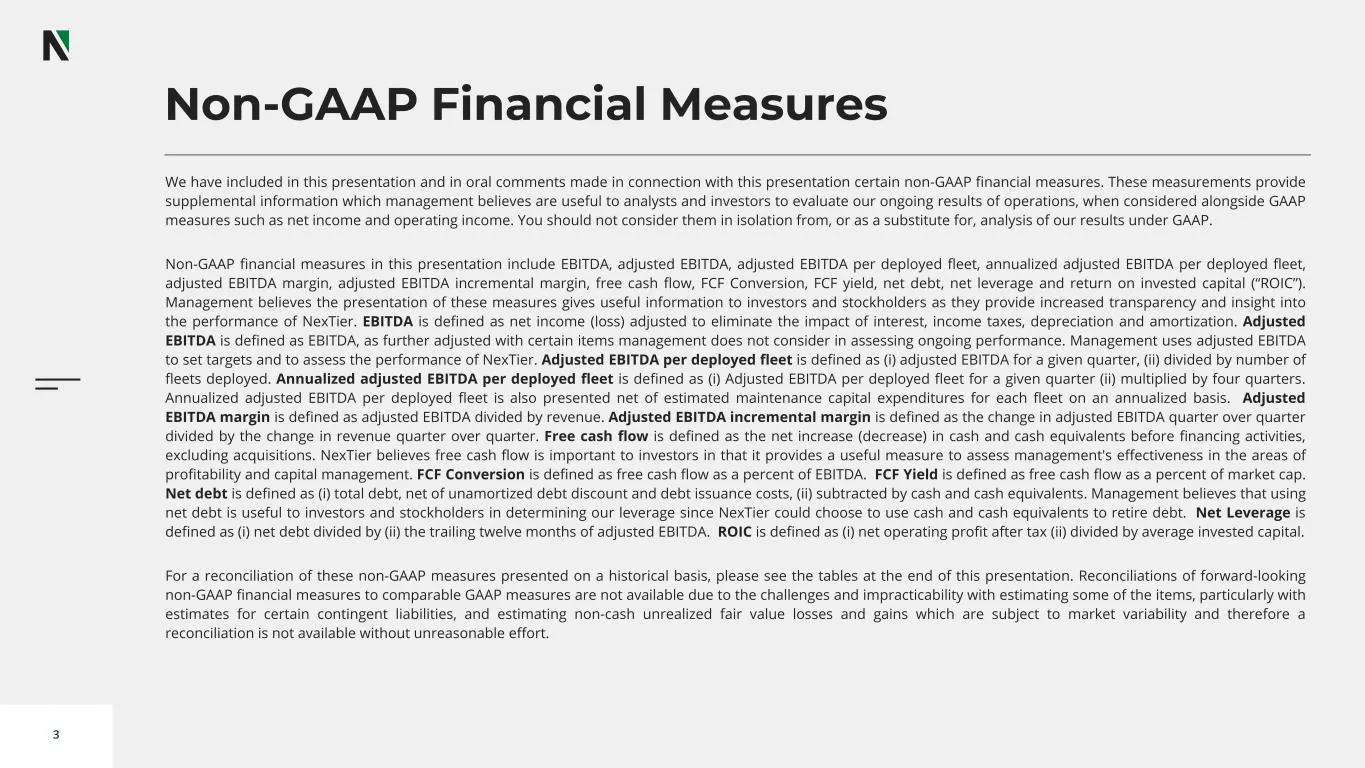
Slide 3: Non-GAAP Financial Measures
3 Non-GAAP Financial Measures We have included in this presentation and in oral comments made in connection with this presentation certain non-GAAP financial measures. These measurements provide supplemental information which management believes are useful to analysts and investors to evaluate our o
Slide 4: Introduction
4 Introduction
Slide 5: NexTier at a Glance
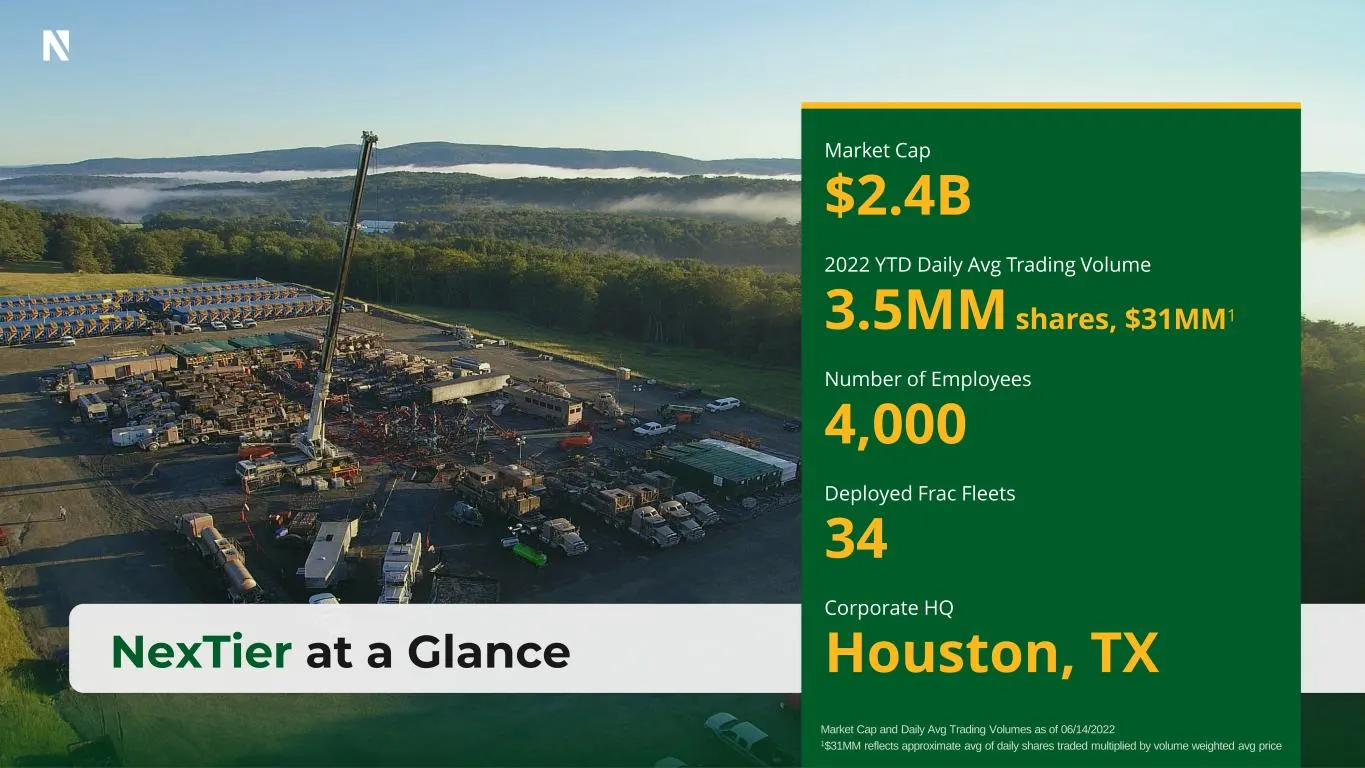
5 NexTier at a Glance Market Cap $2.4B 2022 YTD Daily Avg Trading Volume 3.5MM shares, $31MM1 Number of Employees 4,000 Deployed Frac Fleets 34 Corporate HQ Houston, TX Market Cap and Daily Avg Trading Volumes as of 06/14/2022 1$31MM reflects approximate avg of daily shares traded multiplied by volu
Slide 6: NexTier Diversified Footprint
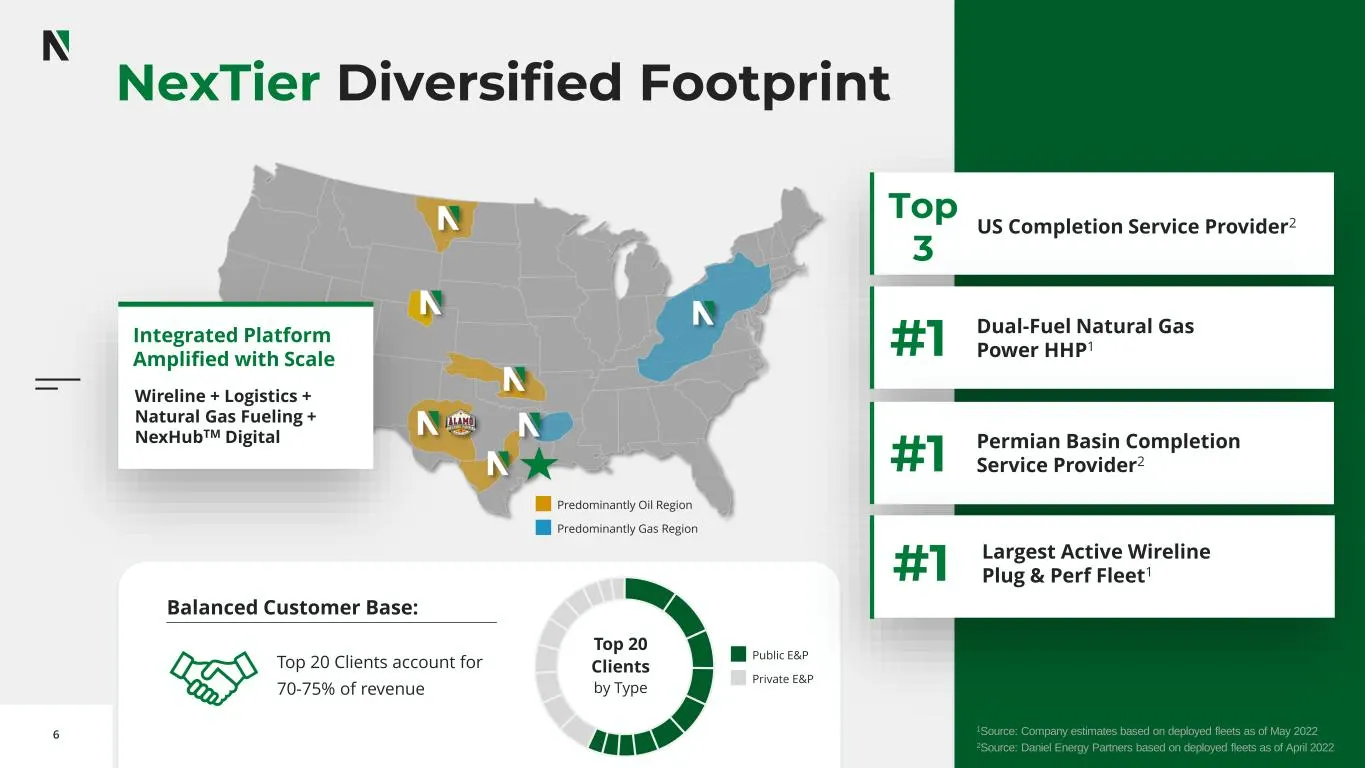
6 NexTier Diversified Footprint 1Source: Company estimates based on deployed fleets as of May 2022 2Source: Daniel Energy Partners based on deployed fleets as of April 2022 Top 3 US Completion Service Provider2 #1 Permian Basin Completion Service Provider2#1 Dual-Fuel Natural Gas Power HHP1 #1 Large
Slide 7: Operational Update
7 Operational Update
Slide 8: Activity Beating Revenue Growth Yields Margin Recovery
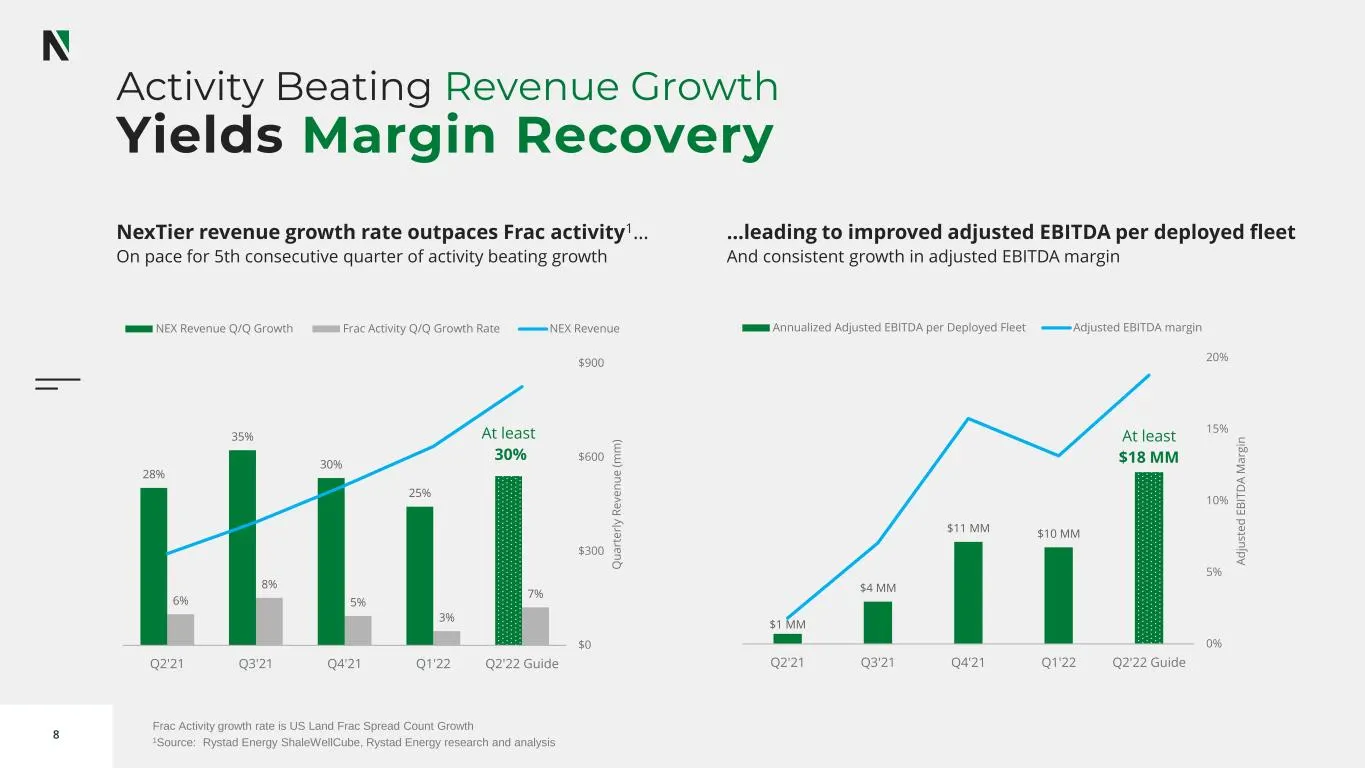
8 Activity Beating Revenue Growth Yields Margin Recovery Frac Activity growth rate is US Land Frac Spread Count Growth 1Source: Rystad Energy ShaleWellCube, Rystad Energy research and analysis $1 MM $4 MM $11 MM $10 MM At least $18 MM 0% 5% 10% 15% 20% 0 5 10 15 20 25 30 Q2'21 Q3'21 Q4'21 Q1'22 Q2'2
Slide 9: 2Q'22 Operational Update
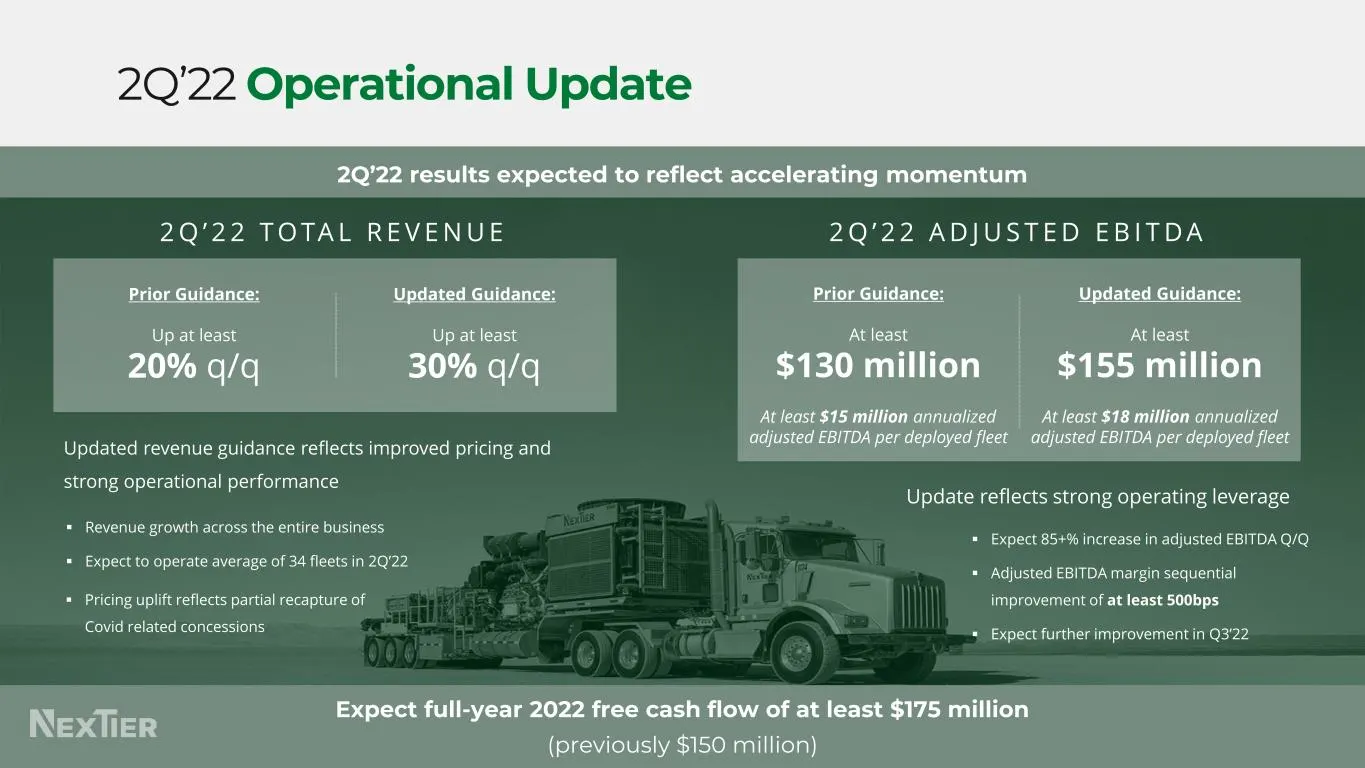
2Q’22 Operational Update 2 Q ’ 2 2 T O TA L R E V E N U E 2Q’22 results expected to reflect accelerating momentum 2 Q ’ 2 2 A D J U S T E D E B I T D A Update reflects strong operating leverage ▪ Expect 85+% increase in adjusted EBITDA Q/Q ▪ Adjusted EBITDA margin sequential improvement of at least
Slide 10: Why invest with NexTier?
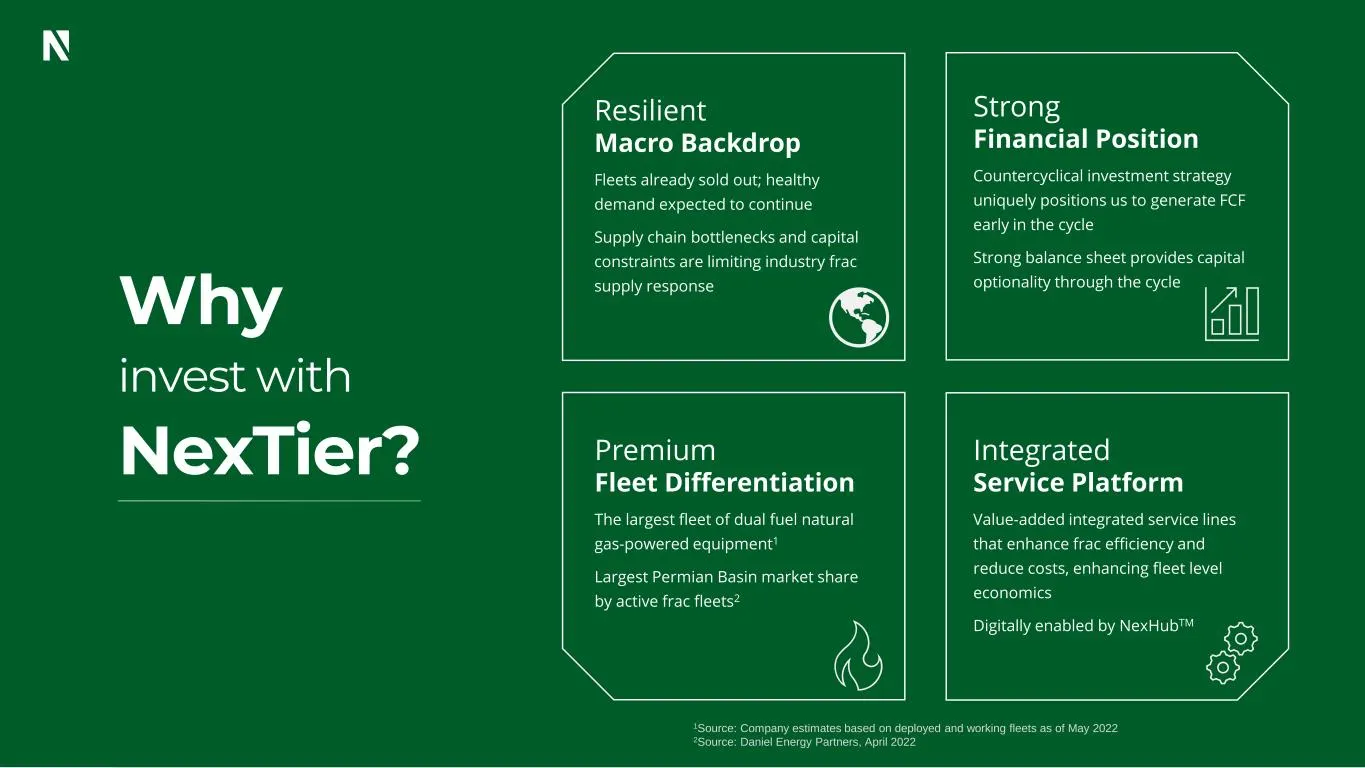
10 Why invest with NexTier? 1Source: Company estimates based on deployed and working fleets as of May 2022 2Source: Daniel Energy Partners, April 2022 Premium Fleet Differentiation The largest fleet of dual fuel natural gas-powered equipment1 Largest Permian Basin market share by active frac fleets2
Slide 11: Increased frac intensity and limited supply setting up high equipment utilization
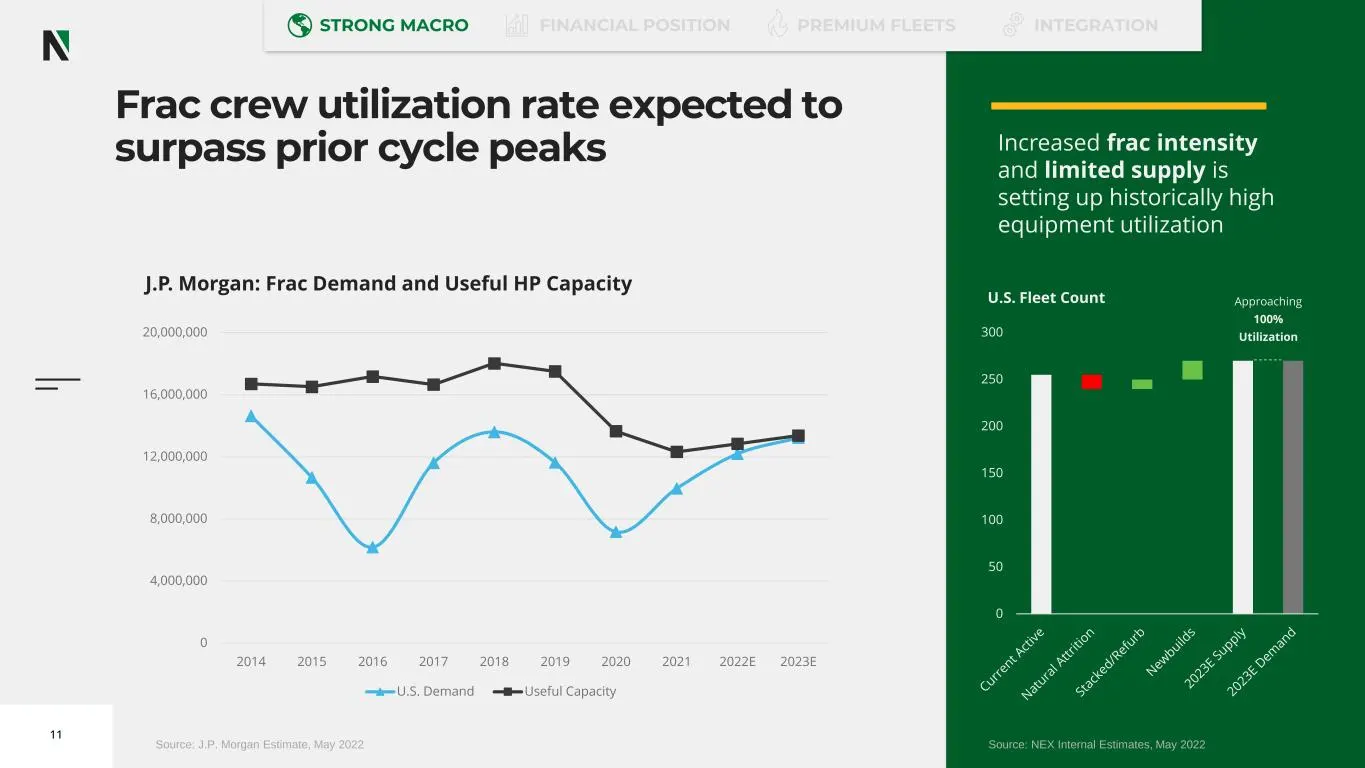
11 Increased frac intensity and limited supply is setting up historically high equipment utilization Frac crew utilization rate expected to surpass prior cycle peaks Source: J.P. Morgan Estimate, May 2022 J.P. Morgan: Frac Demand and Useful HP Capacity 0 4,000,000 8,000,000 12,000,000 16,000,000 20,
Slide 12: Capturing momentum from countercyclical investments
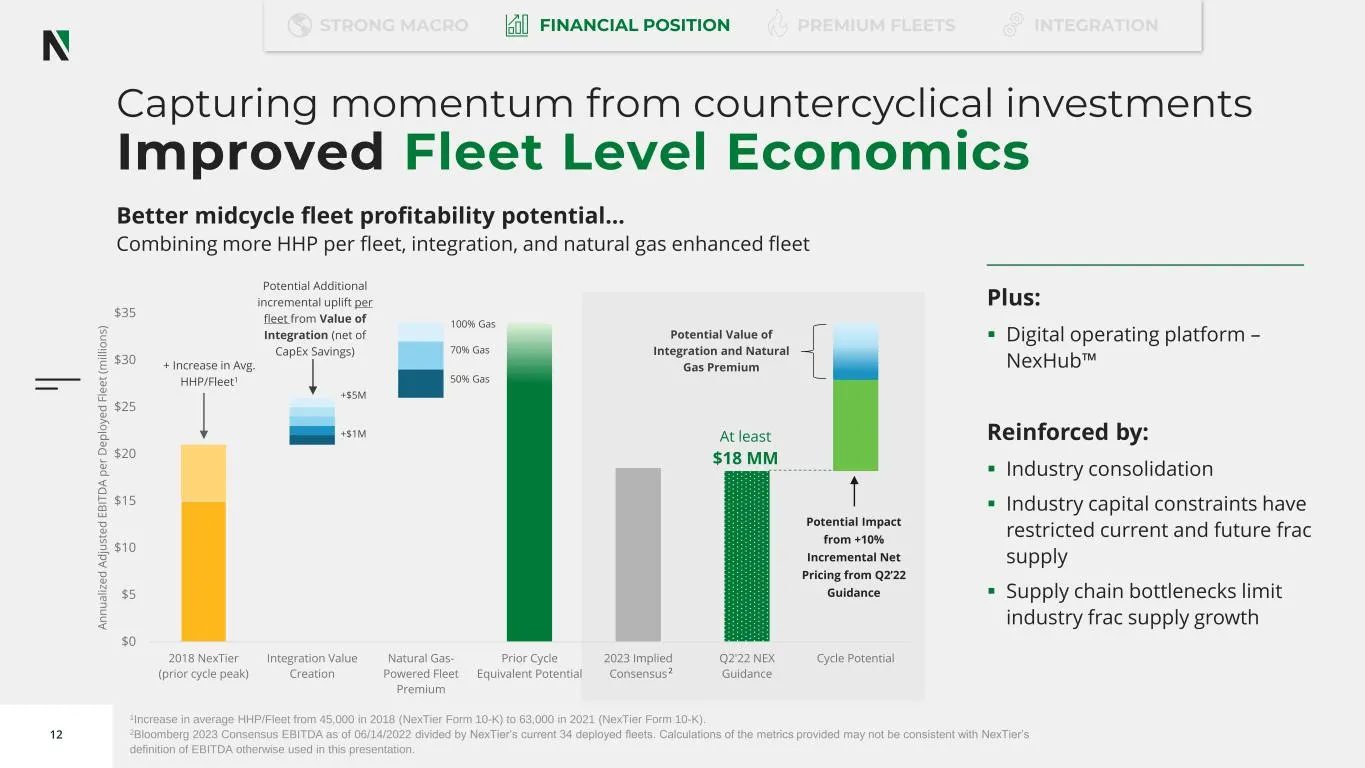
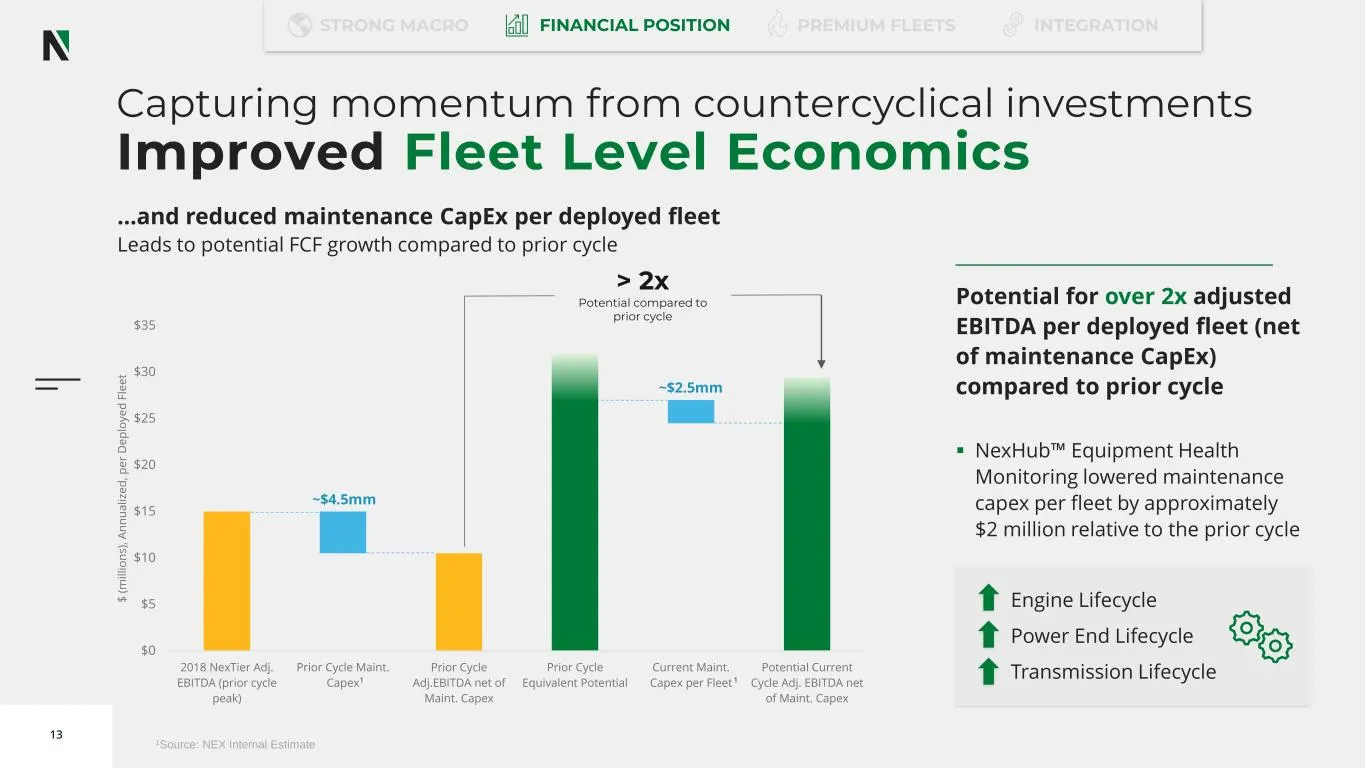
12 Plus: ▪ Digital operating platform – NexHub™ Reinforced by: ▪ Industry consolidation ▪ Industry capital constraints have restricted current and future frac supply ▪ Supply chain bottlenecks limit industry frac supply growth Capturing momentum from countercyclical investments Improved Fleet Level
Slide 13: Potential for over 2x adjusted EBITDA per deployed fleet
13 Potential for over 2x adjusted EBITDA per deployed fleet (net of maintenance CapEx) compared to prior cycle ▪ NexHub™ Equipment Health Monitoring lowered maintenance capex per fleet by approximately $2 million relative to the prior cycle …and reduced maintenance CapEx per deployed fleet Leads to
Slide 14: High FCF Conversion, Low Multiple
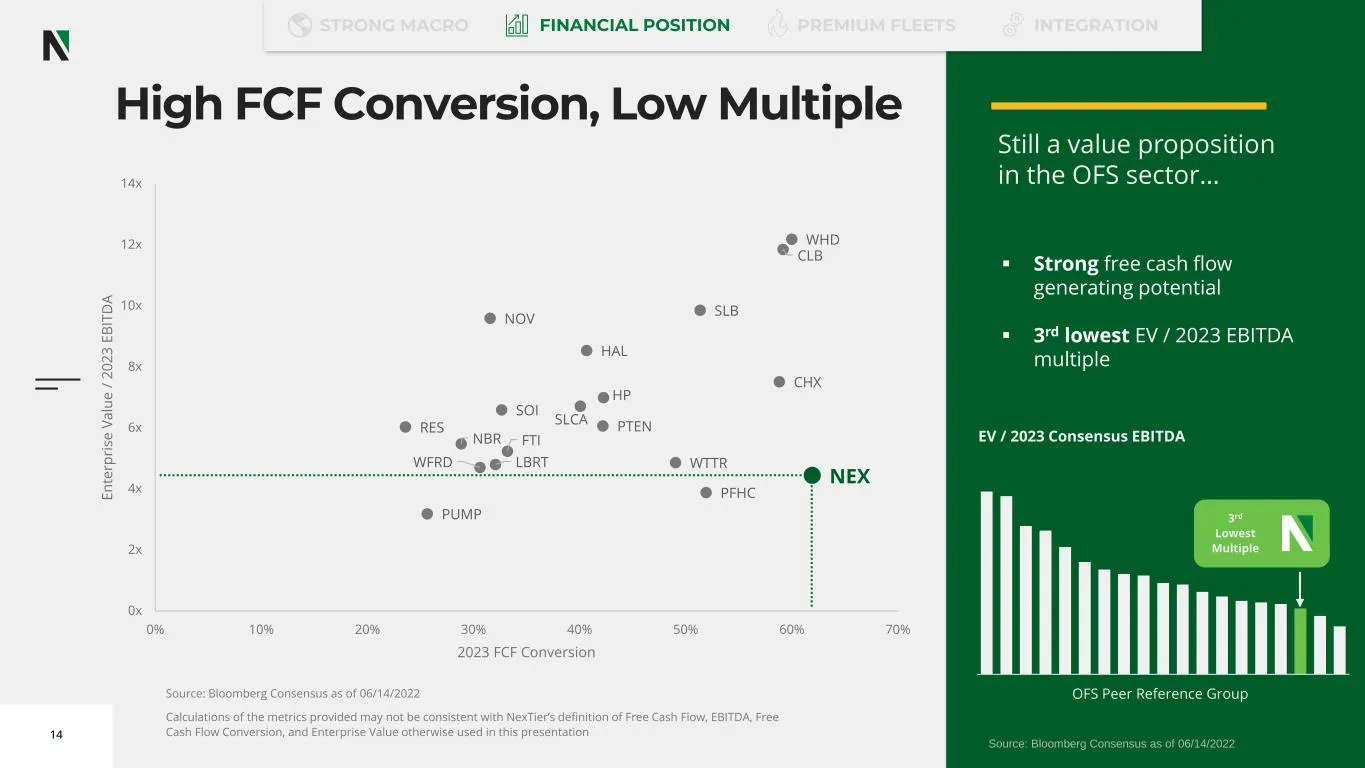
14 Source: Bloomberg Consensus as of 06/14/2022 Calculations of the metrics provided may not be consistent with NexTier’s definition of Free Cash Flow, EBITDA, Free Cash Flow Conversion, and Enterprise Value otherwise used in this presentation High FCF Conversion, Low Multiple ▪ Strong free cash flo
Slide 15: Attractive Valuation
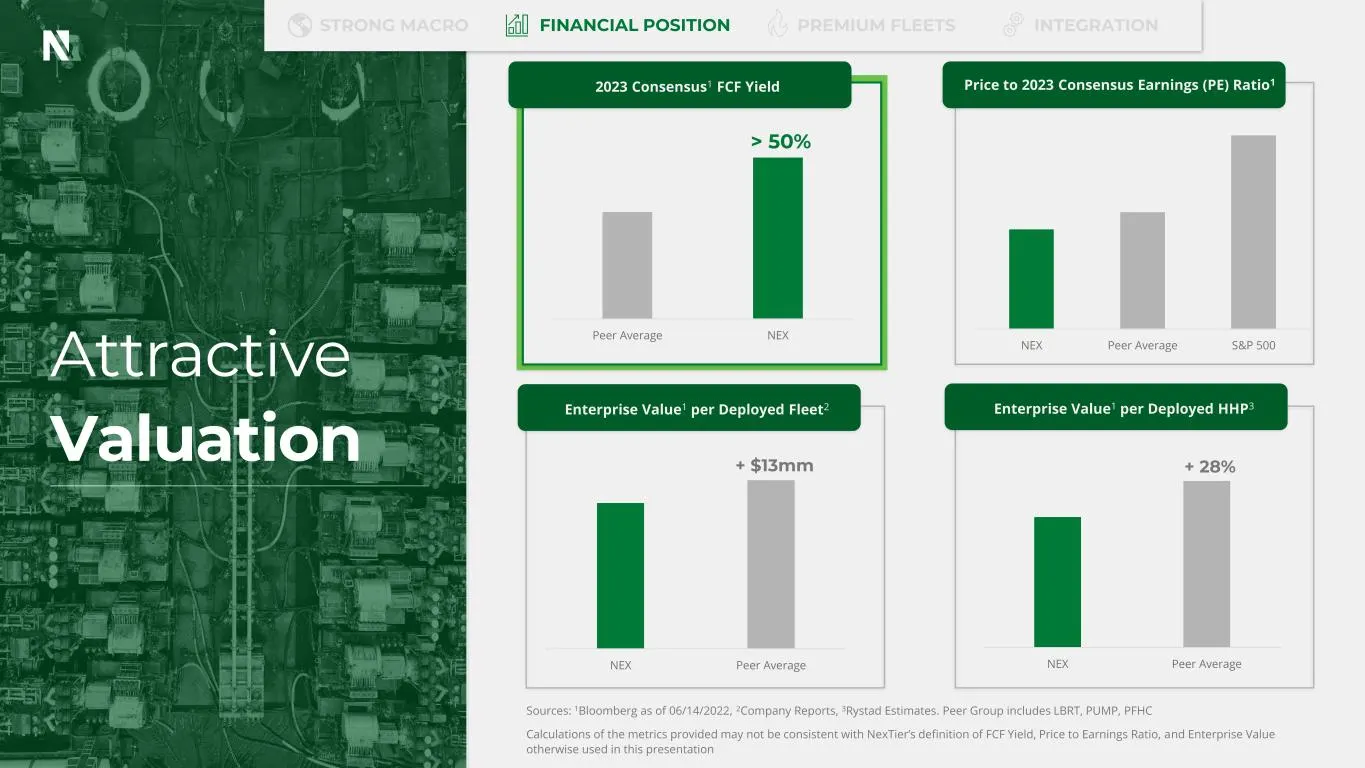
15 Attractive Valuation Sources: 1Bloomberg as of 06/14/2022, 2Company Reports, 3Rystad Estimates. Peer Group includes LBRT, PUMP, PFHC Calculations of the metrics provided may not be consistent with NexTier’s definition of FCF Yield, Price to Earnings Ratio, and Enterprise Value otherwise used in t
Slide 16: Lead the Industry in Next Generation Frac
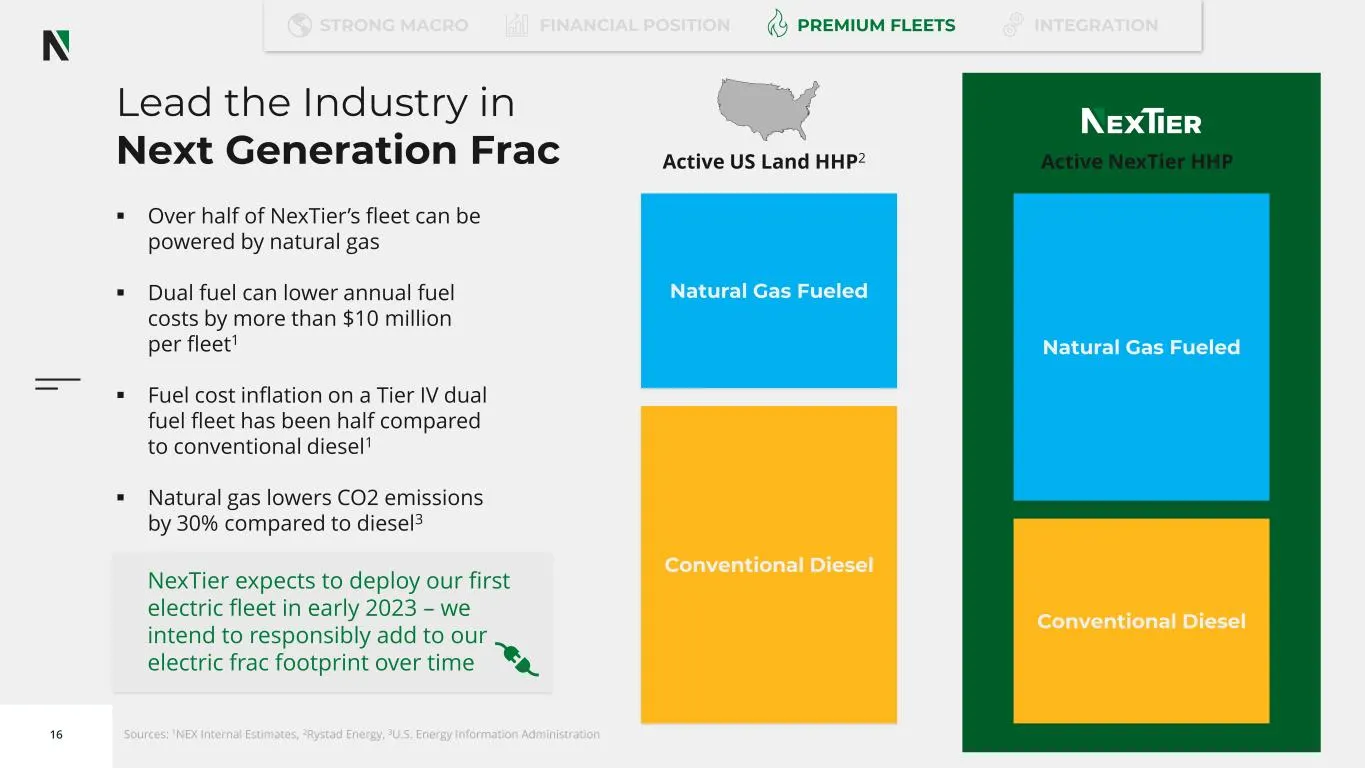
16 Lead the Industry in Next Generation Frac ▪ Over half of NexTier’s fleet can be powered by natural gas ▪ Dual fuel can lower annual fuel costs by more than $10 million per fleet1 ▪ Fuel cost inflation on a Tier IV dual fuel fleet has been half compared to conventional diesel1 ▪ Natural gas lowers
Slide 17: Extending the Lead in the Permian
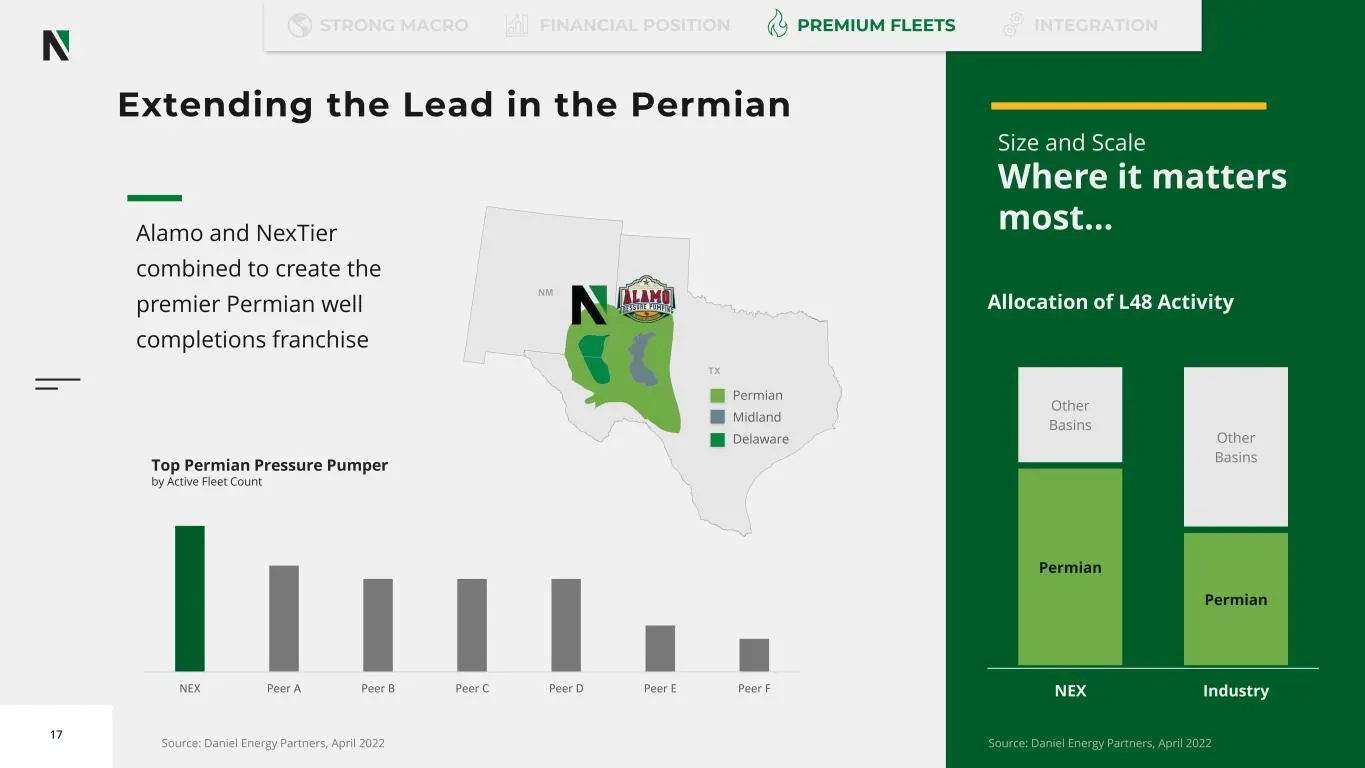
17 Source: Daniel Energy Partners, April 2022 Top Permian Pressure Pumper by Active Fleet Count Permian Midland Delaware NEX Peer A Peer B Peer C Peer D Peer E Peer F Extending the Lead in the Permian Permian Permian Other Basins Other Basins NEX Industry Alamo and NexTier combined to create the pre
Slide 18: Fully Integrated Wellsite
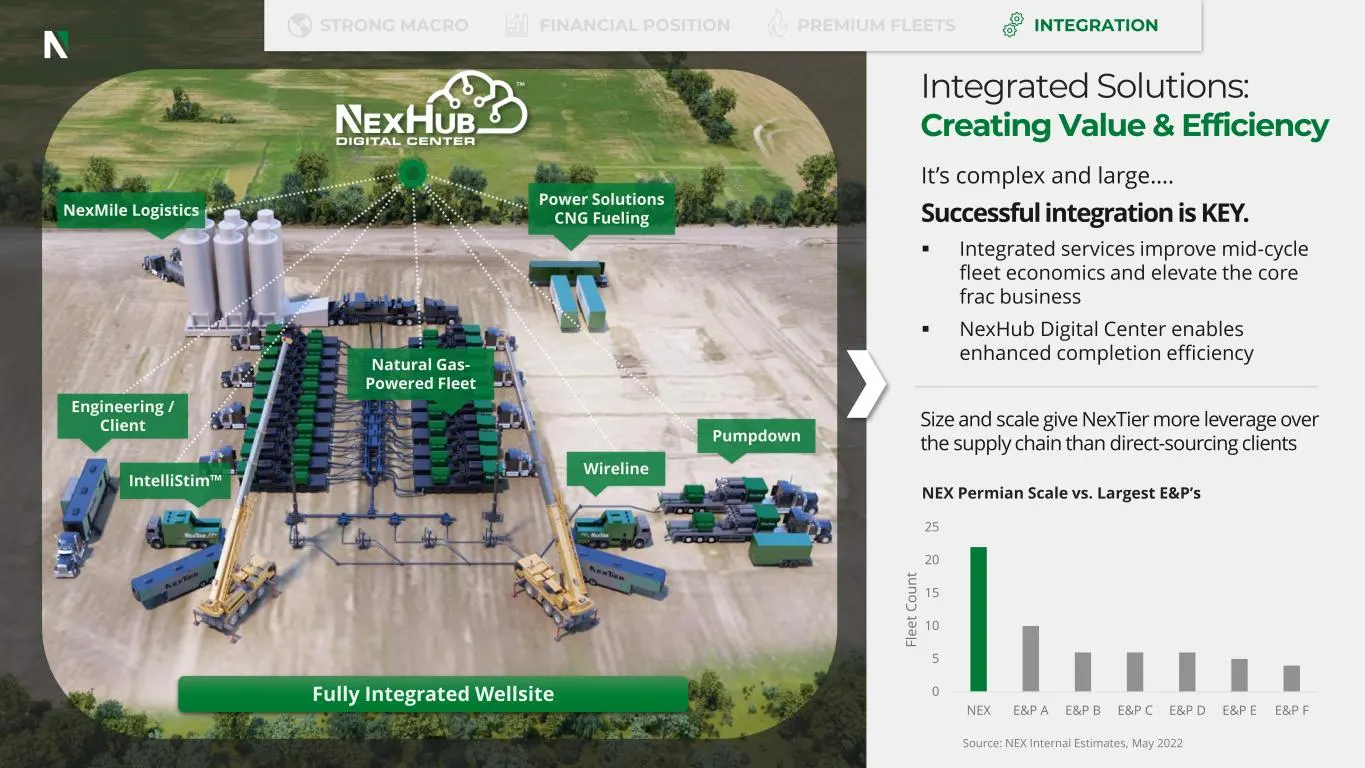
Fully Integrated Wellsite It’s complex and large…. Successful integration is KEY. ▪ Integrated services improve mid-cycle fleet economics and elevate the core frac business ▪ NexHub Digital Center enables enhanced completion efficiency Wireline Pumpdown Power Solutions CNG FuelingNexMile Logistics I
Slide 19: Enhancing Shareholder Value
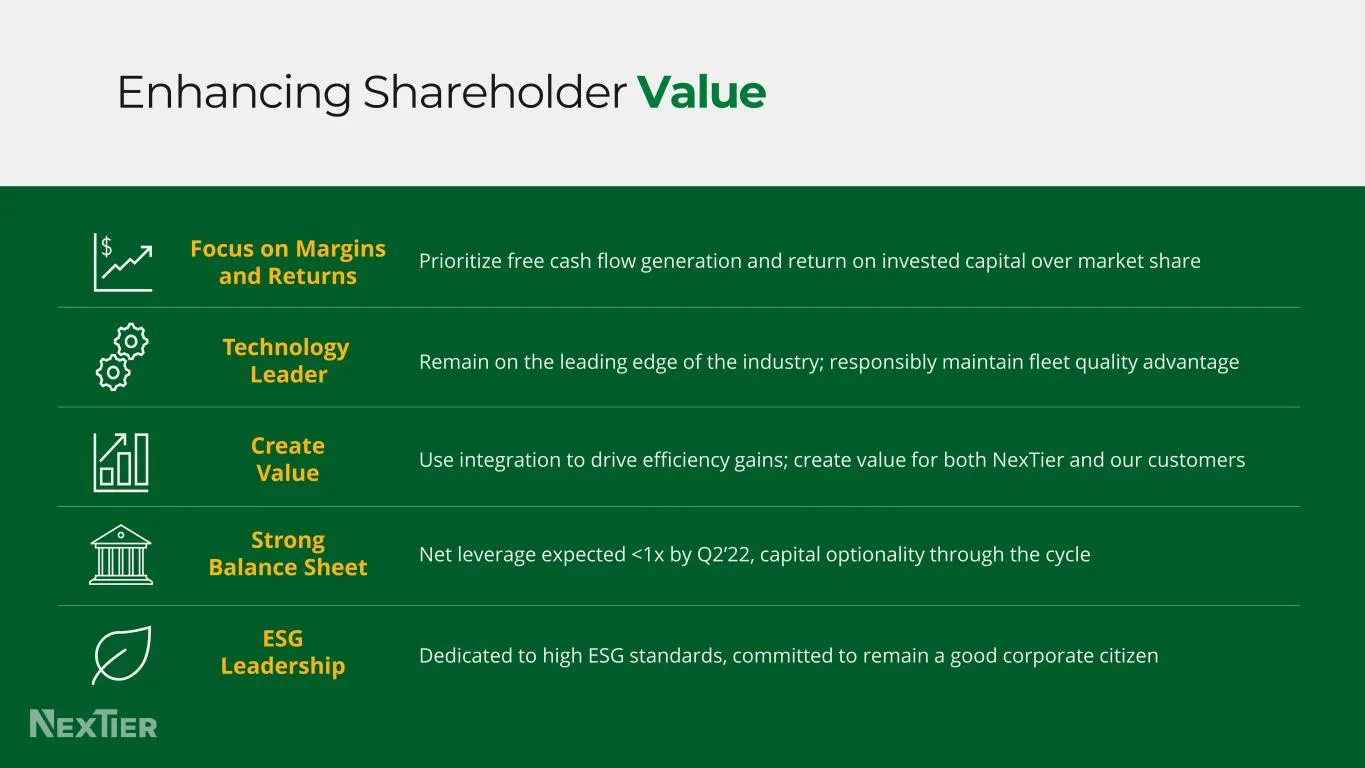
Enhancing Shareholder Value Remain on the leading edge of the industry; responsibly maintain fleet quality advantage Use integration to drive efficiency gains; create value for both NexTier and our customers Net leverage expected <1x by Q2’22, capital optionality through the cycle Dedicated to high
Slide 20: Appendix
20 Appendix
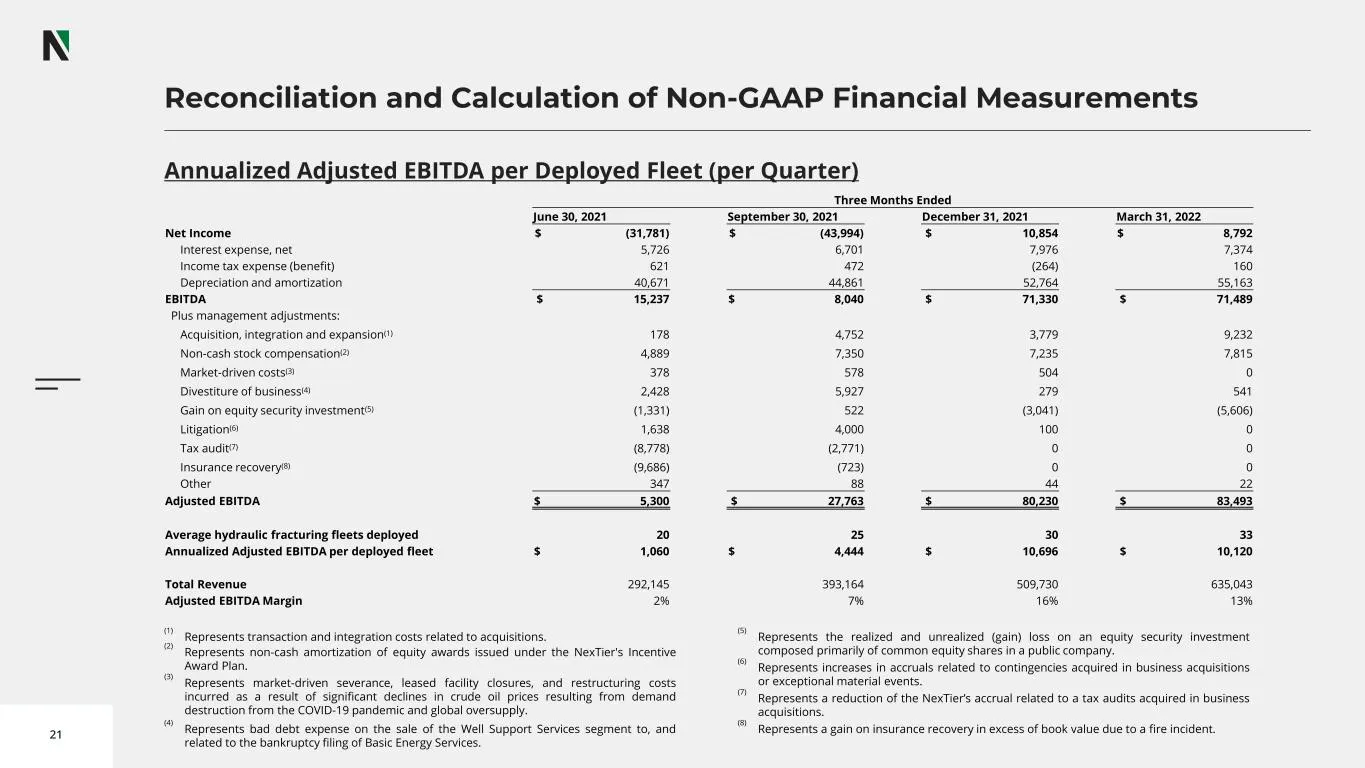
Slide 21: Reconciliation and Calculation of Non-GAAP Financial Measurements
21 Reconciliation and Calculation of Non-GAAP Financial Measurements Annualized Adjusted EBITDA per Deployed Fleet (per Quarter) (1) Represents transaction and integration costs related to acquisitions. (2) Represents non-cash amortization of equity awards issued under the NexTier's Incentive Award
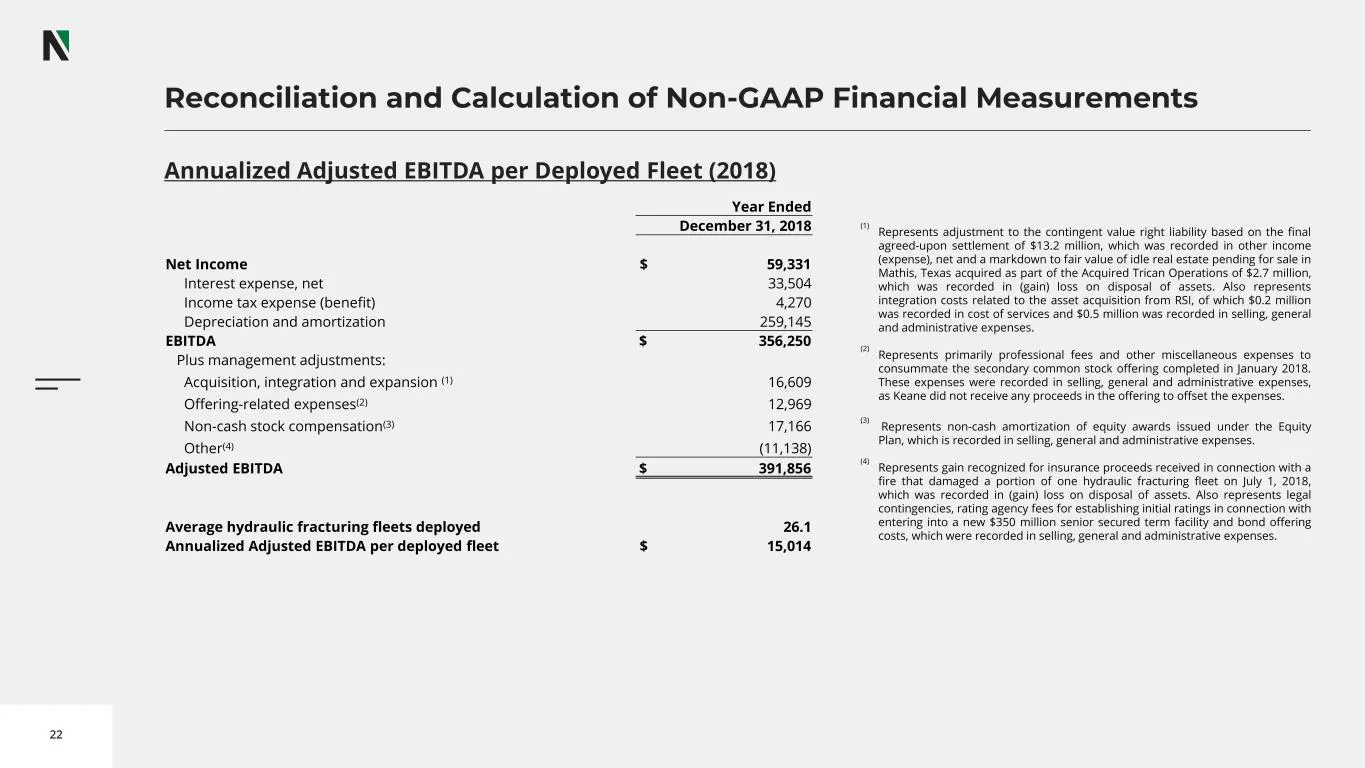
Slide 22: Reconciliation and Calculation of Non-GAAP Financial Measurements
22 Reconciliation and Calculation of Non-GAAP Financial Measurements (1) Represents adjustment to the contingent value right liability based on the final agreed-upon settlement of $13.2 million, which was recorded in other income (expense), net and a markdown to fair value of idle real estate pendin
Source: SEC EDGAR · 8-K filed Jun 15, 2022
More decks from NexTier Oilfield Solutions Inc
 Merger or Acquisition (July 2023)18 slides · Jul 5, 2023
 Merger or Acquisition (June 2023)18 slides · Jun 16, 2023
 Merger or Acquisition (June 2023)23 slides · Jun 15, 2023
 Shareholder Meeting (June 2023)23 slides · Jun 1, 2023
 Investor Presentation (February 2023)26 slides · Feb 15, 2023
 Investor Presentation (October 2022)28 slides · Oct 25, 2022