Endeavour International — IPAA OGIS New York Conference 2011
25 slides from Endeavour International's conference presentation, Apr 12, 2011
Slide 1: IPAA OGIS New York Conference April 11, 2011
IPAA OGIS New York Conference April 11, 2011
Slide 2: Forward-looking statements and cautionary notes
2 This is an oral presentation which is accompanied by slides. Investors are urged to review our SEC filings. This presentation contains certain forward-looking statements regarding various oil and gas discoveries, oil and gas exploration, development and production activities, anticipated and poten
Slide 3: Endeavour At A Glance
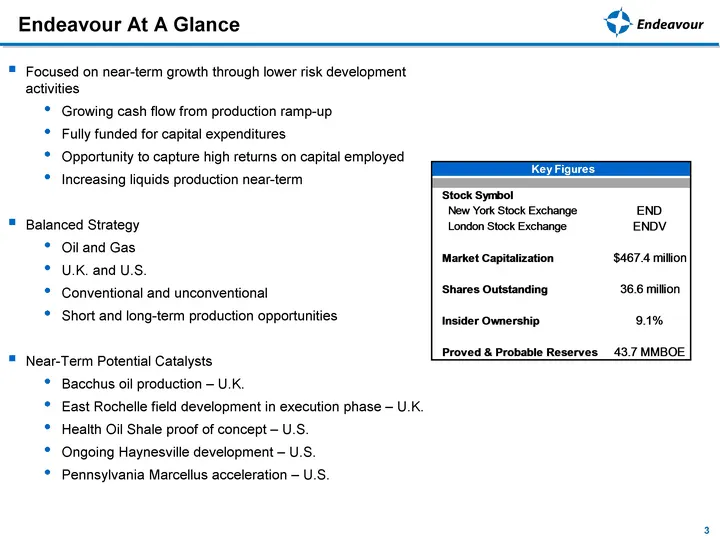
3 Endeavour At A Glance Focused on near-term growth through lower risk development activities Growing cash flow from production ramp-up Fully funded for capital expenditures Opportunity to capture high returns on capital employed Increasing liquids production near-term Balanced Strategy Oil and Gas
Slide 4: Overview of Endeavour's U.K. Assets
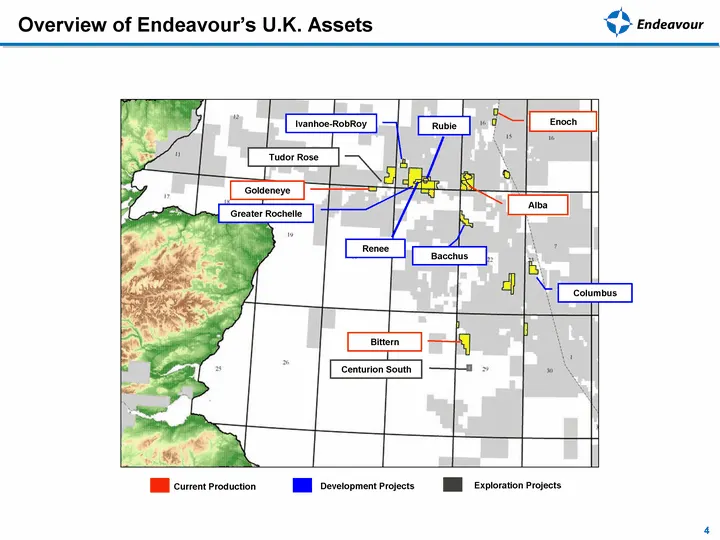
Overview of Endeavour's U.K. Assets 4 Rubie Renee Current Production Development Projects Exploration Projects
Slide 5: Overview of Endeavour's U.S. Assets
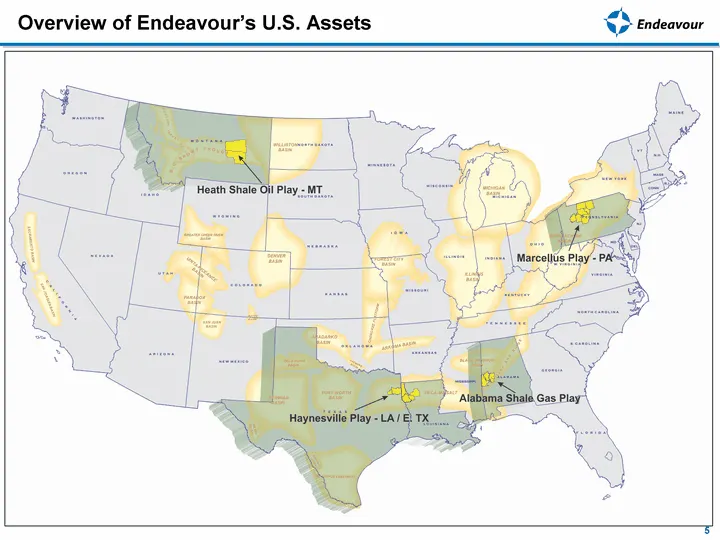
5 Overview of Endeavour's U.S. Assets
Slide 6: Growing Our Proved and Probable Reserve Base
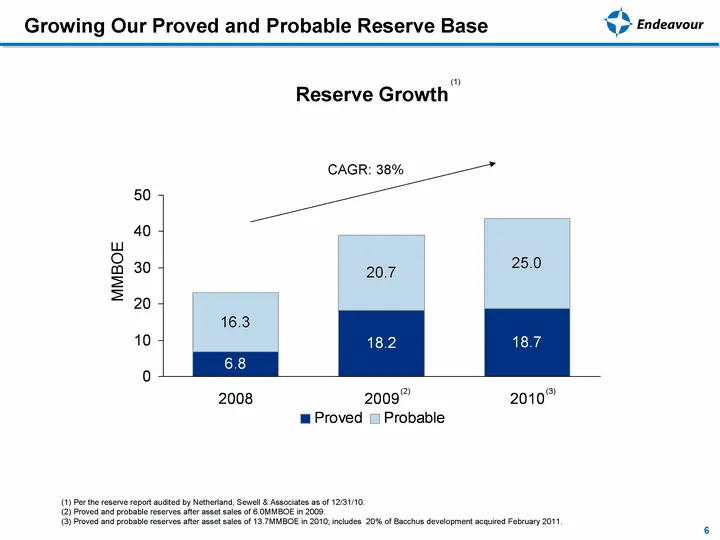
Growing Our Proved and Probable Reserve Base 6 Reserve Growth (1) Per the reserve report audited by Netherland, Sewell & Associates as of 12/31/10. (2) Proved and probable reserves after asset sales of 6.0MMBOE in 2009. (3) Proved and probable reserves after asset sales of 13.7MMBOE in 2010; include
Slide 7: Growing Exposure to Liquids Through the Drill-Bit
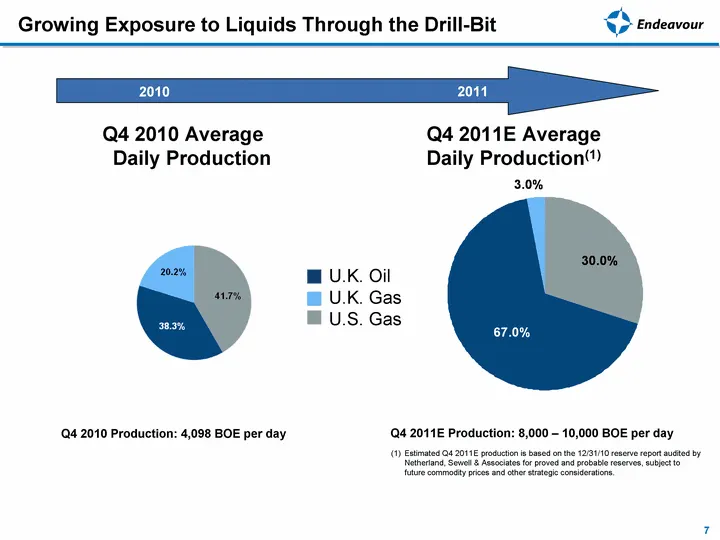
7 Growing Exposure to Liquids Through the Drill-Bit Q4 2010 Production: 4,098 BOE per day Q4 2011E Production: 8,000 - 10,000 BOE per day Q4 2010 Average Daily Production Q4 2011E Average Daily Production(1) U.K. Oil U.K. Gas U.S. Gas 2010 2011 Estimated Q4 2011E production is based on the 12/31/10
Slide 8: Indicative Production Growth Potential
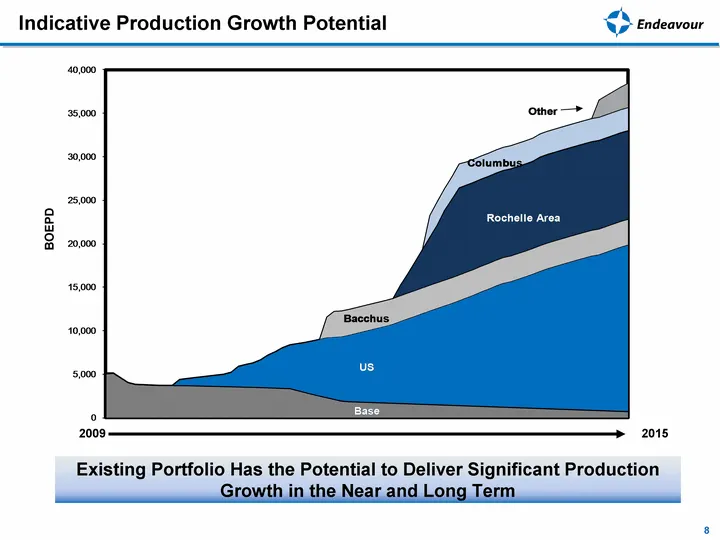
Indicative Production Growth Potential 8 Existing Portfolio Has the Potential to Deliver Significant Production Growth in the Near and Long Term 2009 2015 BOEPD
Slide 9: Outstanding Portfolio Management Capturing Value to Accelerate Returns
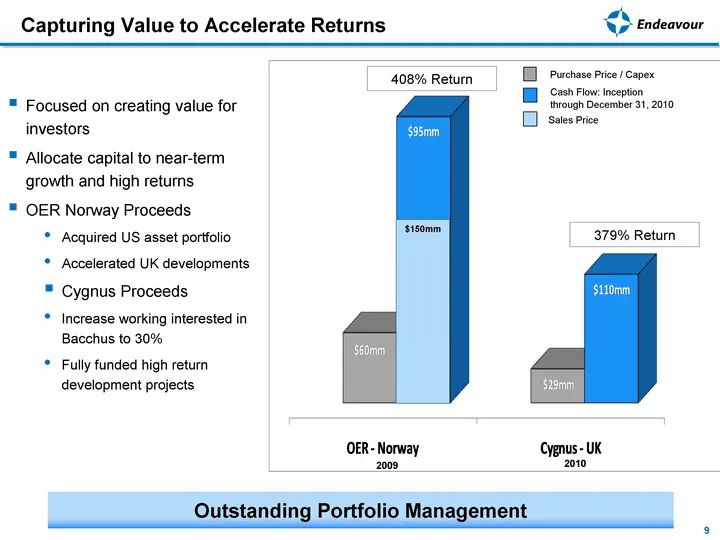
9 Outstanding Portfolio Management Capturing Value to Accelerate Returns 408% Return 379% Return Cash Flow: Inception through December 31, 2010 Purchase Price / Capex Sales Price $150mm 2009 2010 Focused on creating value for investors Allocate capital to near-term growth and high returns OER Norway
Slide 10: Our North Sea Assets
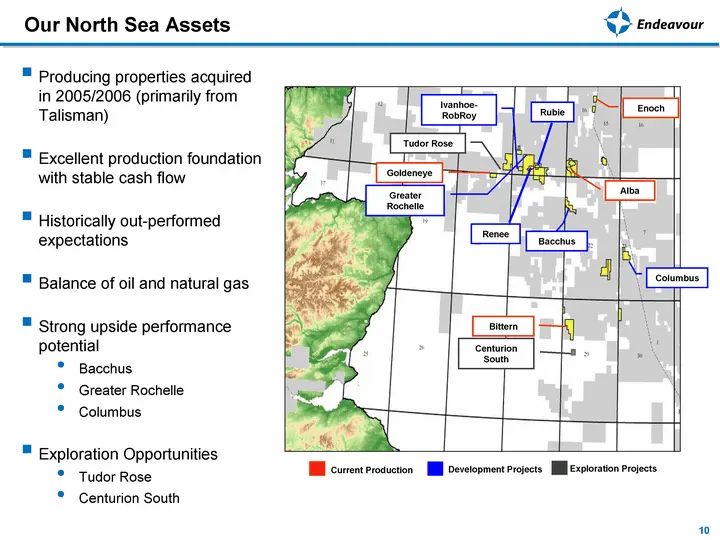
10 Our North Sea Assets Producing properties acquired in 2005/2006 (primarily from Talisman) Excellent production foundation with stable cash flow Historically out-performed expectations Balance of oil and natural gas Strong upside performance potential Bacchus Greater Rochelle Columbus Exploration
Slide 11: Bacchus: Block 22/06a Central North Sea
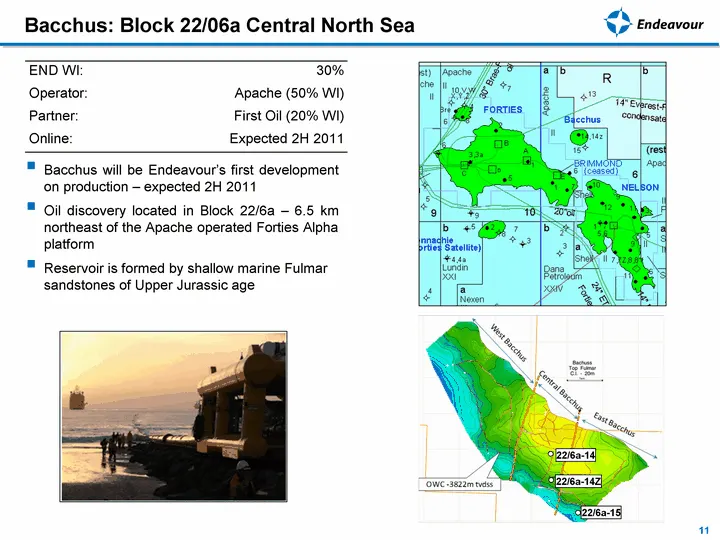
Bacchus: Block 22/06a Central North Sea 11 Bacchus will be Endeavour's first development on production - expected 2H 2011 Oil discovery located in Block 22/6a - 6.5 km northeast of the Apache operated Forties Alpha platform Reservoir is formed by shallow marine Fulmar sandstones of Upper Jurassic ag
Slide 12: East Rochelle
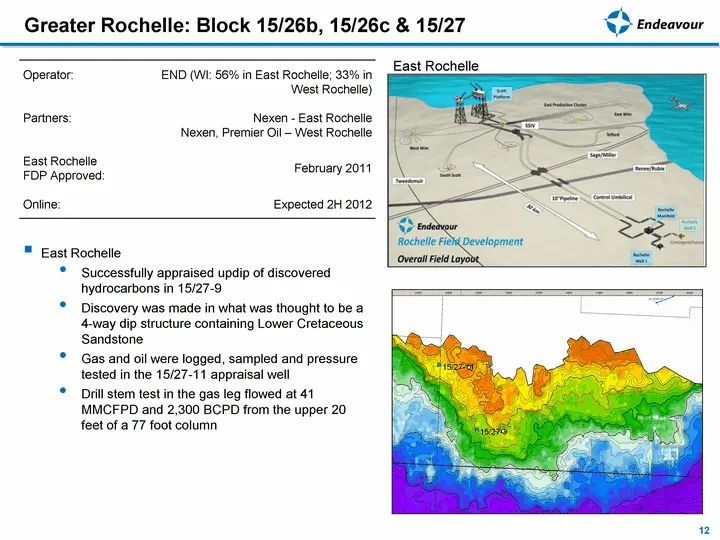
East Rochelle Successfully appraised updip of discovered hydrocarbons in 15/27-9 Discovery was made in what was thought to be a 4-way dip structure containing Lower Cretaceous Sandstone Gas and oil were logged, sampled and pressure tested in the 15/27-11 appraisal well Drill stem test in the gas leg
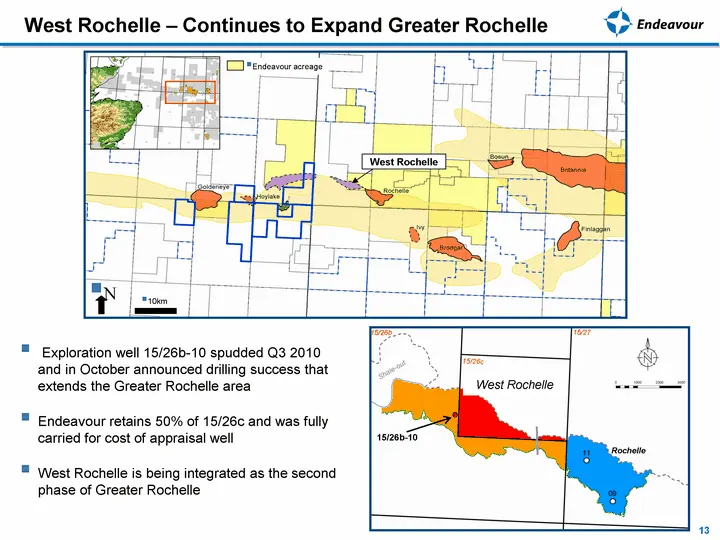
Slide 13: West Rochelle - Continues to Expand Greater Rochelle
10km N West Rochelle 13 Exploration well 15/26b-10 spudded Q3 2010 and in October announced drilling success that extends the Greater Rochelle area Endeavour retains 50% of 15/26c and was fully carried for cost of appraisal well West Rochelle is being integrated as the second phase of Greater Rochel
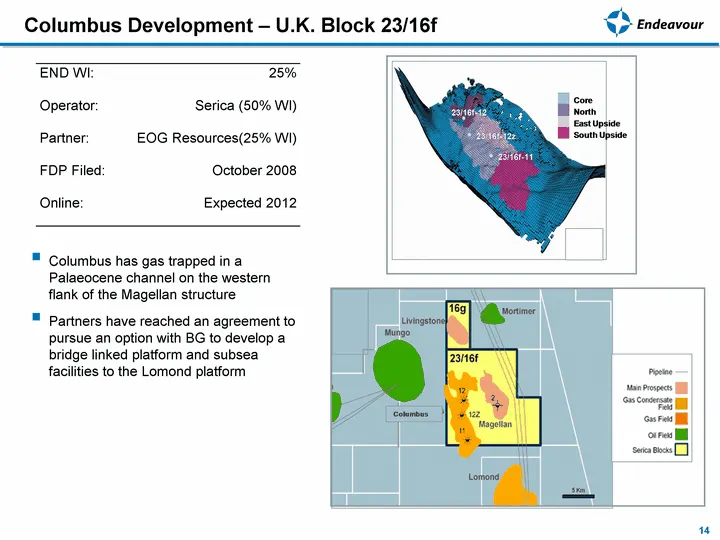
Slide 14: Columbus Development - U.K. Block 23/16f
Columbus Development - U.K. Block 23/16f 14 Columbus has gas trapped in a Palaeocene channel on the western flank of the Magellan structure Partners have reached an agreement to pursue an option with BG to develop a bridge linked platform and subsea facilities to the Lomond platform END WI: 25% Oper
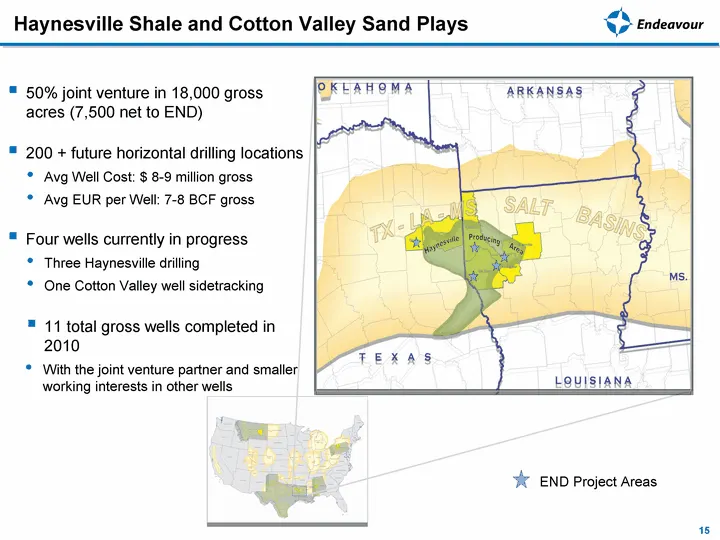
Slide 15: Haynesville Shale and Cotton Valley Sand Plays
Haynesville Shale and Cotton Valley Sand Plays 50% joint venture in 18,000 gross acres (7,500 net to END) 200 + future horizontal drilling locations Avg Well Cost: $ 8-9 million gross Avg EUR per Well: 7-8 BCF gross Four wells currently in progress Three Haynesville drilling One Cotton Valley well s
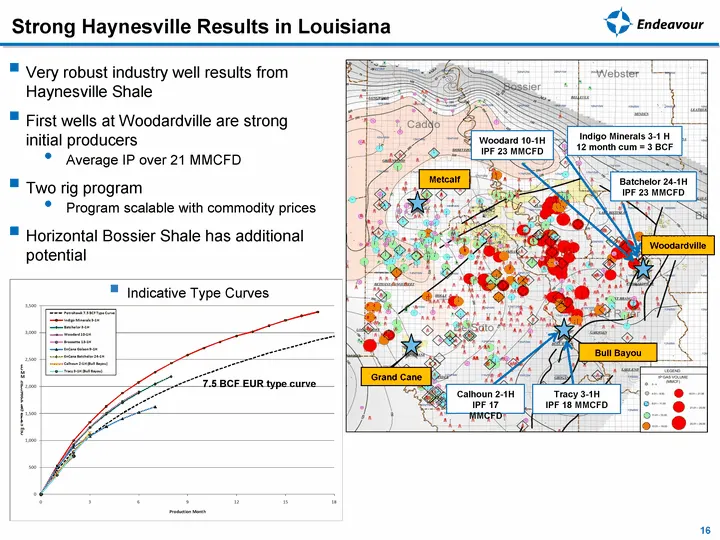
Slide 16: Strong Haynesville Results in Louisiana
Strong Haynesville Results in Louisiana 16 Very robust industry well results from Haynesville Shale First wells at Woodardville are strong initial producers Average IP over 21 MMCFD Two rig program Program scalable with commodity prices Horizontal Bossier Shale has additional potential Woodard 10-1H
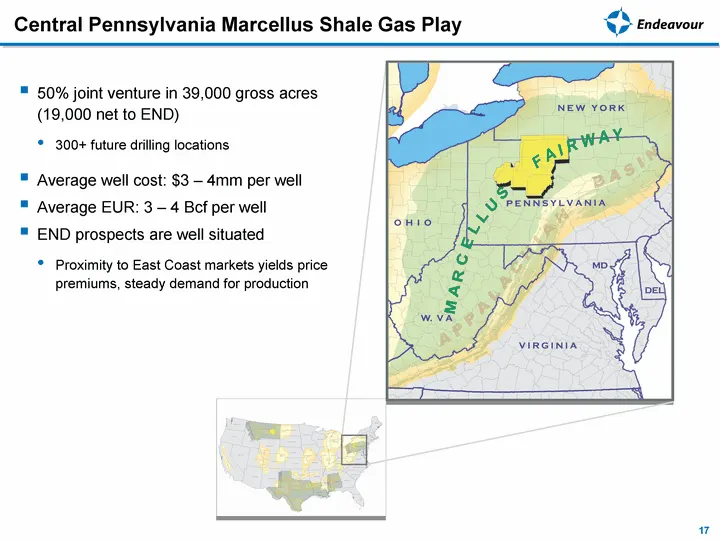
Slide 17: Central Pennsylvania Marcellus Shale Gas Play
Central Pennsylvania Marcellus Shale Gas Play 17 50% joint venture in 39,000 gross acres (19,000 net to END) 300+ future drilling locations Average well cost: $3 - 4mm per well Average EUR: 3 - 4 Bcf per well END prospects are well situated Proximity to East Coast markets yields price premiums, stea
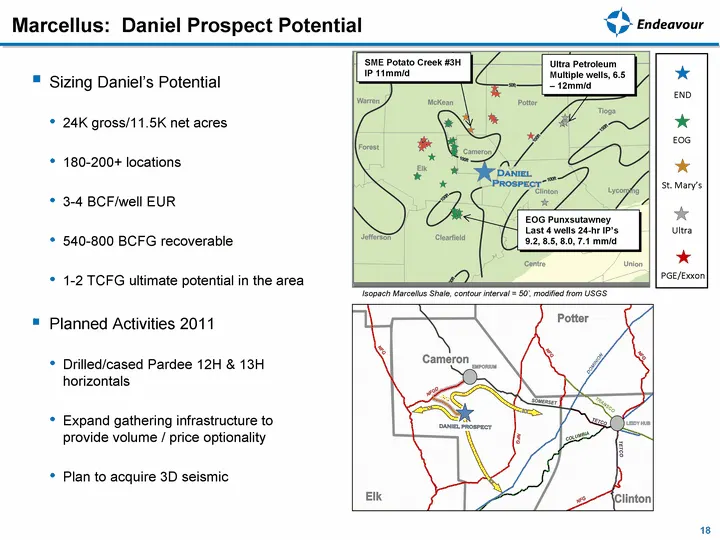
Slide 18: Marcellus: Daniel Prospect Potential Sizing
Marcellus: Daniel Prospect Potential 18 Sizing Daniel's Potential 24K gross/11.5K net acres 180-200+ locations 3-4 BCF/well EUR 540-800 BCFG recoverable 1-2 TCFG ultimate potential in the area Planned Activities 2011 Drilled/cased Pardee 12H & 13H horizontals Expand gathering infrastructure to provi
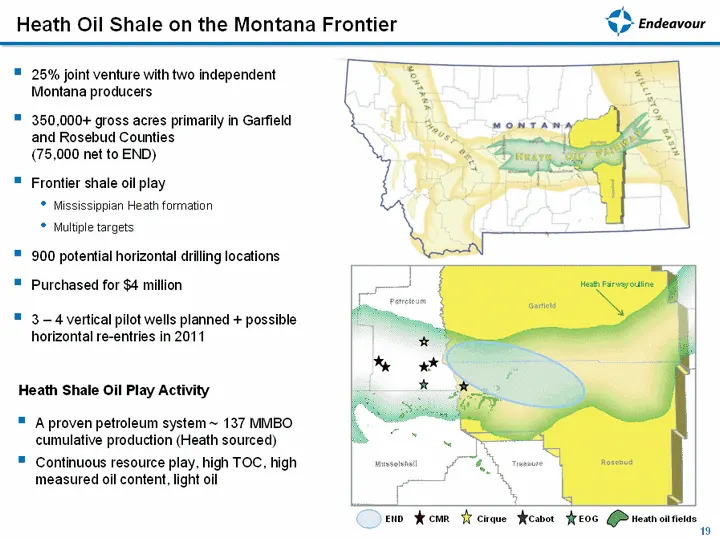
Slide 19: Heath Oil Shale on the Montana Frontier
Heath Oil Shale on the Montana Frontier 25% joint venture with two independent Montana producers 350,000+ gross acres primarily in Garfield and Rosebud Counties (75,000 net to END) Frontier shale oil play Mississippian Heath formation Multiple targets 900 potential horizontal drilling locations Purc
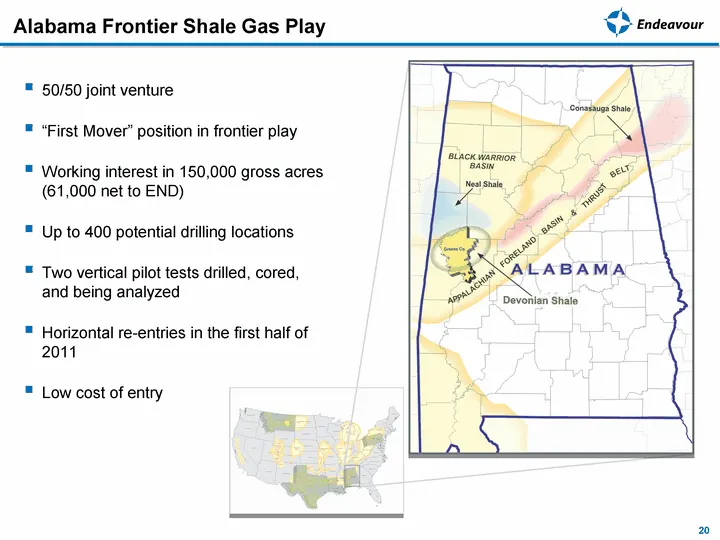
Slide 20: Alabama Frontier Shale Gas Play
Alabama Frontier Shale Gas Play 20 50/50 joint venture "First Mover" position in frontier play Working interest in 150,000 gross acres (61,000 net to END) Up to 400 potential drilling locations Two vertical pilot tests drilled, cored, and being analyzed Horizontal re-entries in the first half of 201
Slide 21: Capital Structure
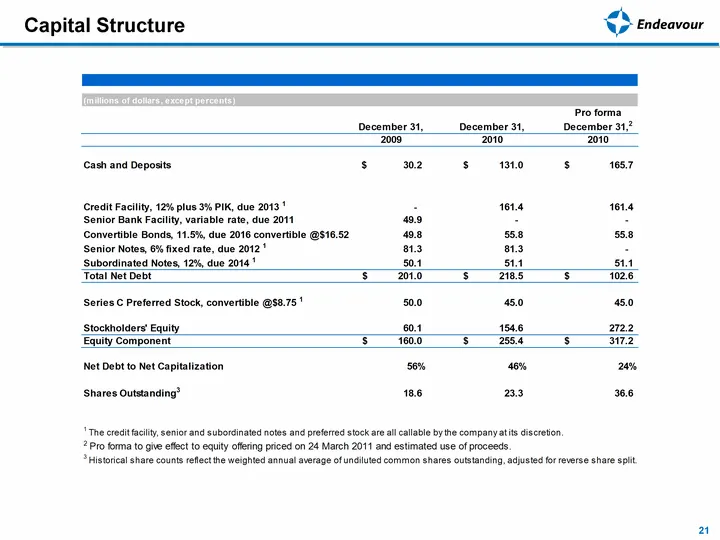
Capital Structure } Endeavour Proforma December 31, December 31, __December 317 2009 2010 2010 ‘cash and Deposits s 302 Ss 1310 s 1657 Credit Facility, 12% plus 3% PIK, due 2013 ° : 1614 1614 Senior Bank Facility, variable rate, due 2011 499 : : Convertible Bonds, 11.5%, due 2016 convertible @S16.52
Slide 22: 2011 Capital Budget
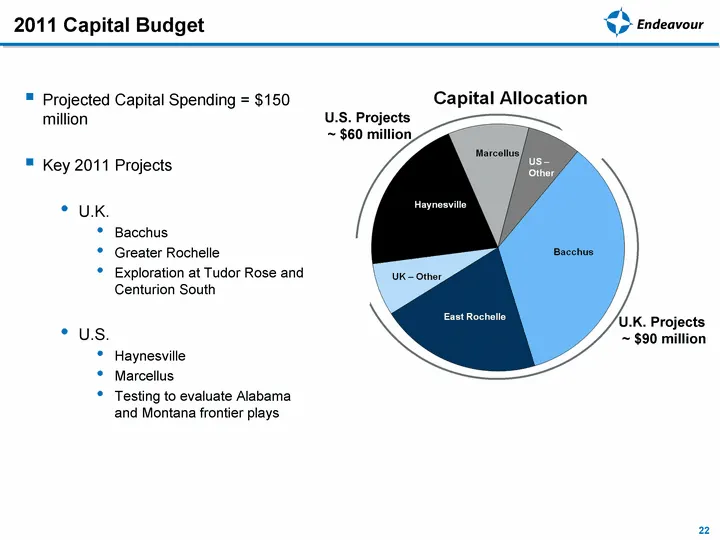
2011 Capital Budget 22 Projected Capital Spending = $150 million Key 2011 Projects U.K. Bacchus Greater Rochelle Exploration at Tudor Rose and Centurion South U.S. Haynesville Marcellus Testing to evaluate Alabama and Montana frontier plays U.K. Projects ~ $90 million U.S. Projects ~ $60 million
Slide 23: Estimated Valuation
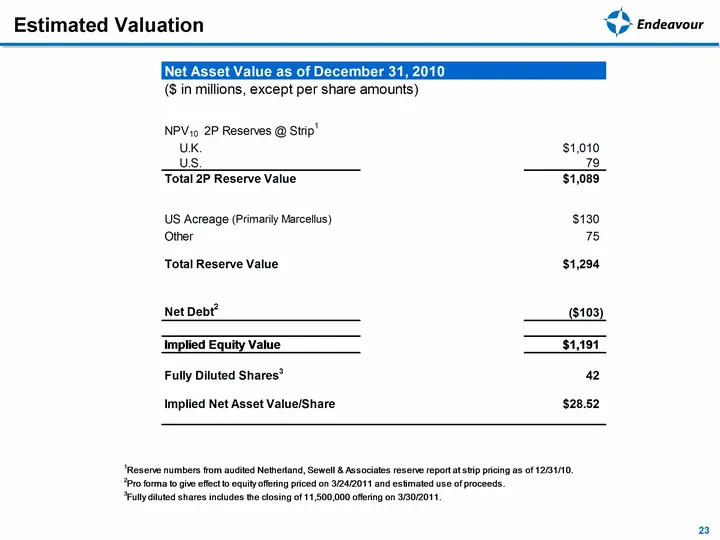
Estimated Valuation © (Sin millions, except per share amounts) NPVio 2P Reserves @ Strip’ UK $1,010 us. 79 Total 2P Reserve Value $4,089 US Acreage (Primariy Marcellus) $130 Other 75 Total Reserve Value $1,294 Net Debt ($103) S194 Fully Diluted Shares* 2 Implied Net Asset Value'Share $28.62 ‘Reserve
Slide 24: Key Investment Highlights
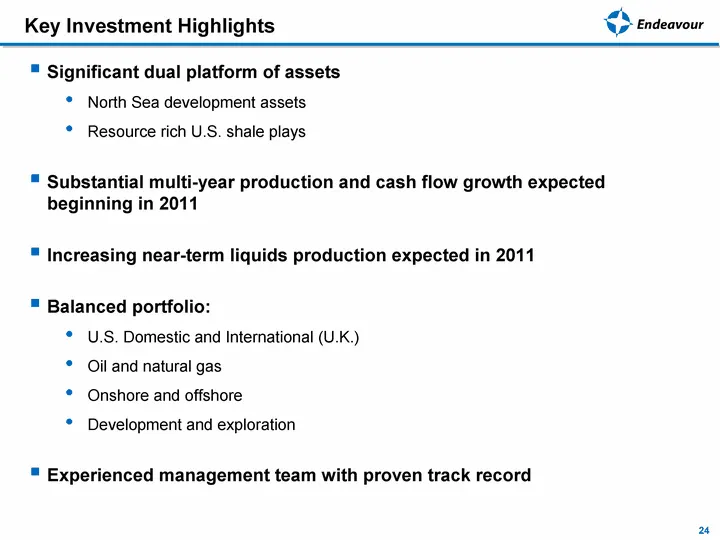
Key Investment Highlights 24 Significant dual platform of assets North Sea development assets Resource rich U.S. shale plays Substantial multi-year production and cash flow growth expected beginning in 2011 Increasing near-term liquids production expected in 2011 Balanced portfolio: U.S. Domestic an
Slide 25: Endeavour Contact Information
25 Endeavour Contact Information Endeavour International Corporation 1001 Fannin Street, Suite 1600 Houston, TX 77002 713.307.8700 Endeavour Energy UK Limited 114 St. Martin's Lane London WC2N 4BE United Kingdom +44.0.207.451.2350 www.endeavourcorp.com Investor Contacts: Mike Kirksey Darcey Matthews
Source: SEC EDGAR · 8-K filed Apr 12, 2011
More decks from Endeavour International Corp
 Presentation (May 2015)5 slides · May 7, 2015
 Corporate Update (February 2015)23 slides · Feb 27, 2015
 Debt Investor Presentation (October 2014)16 slides · Oct 14, 2014
 Q2 2014 Earnings Presentation12 slides · Aug 5, 2014
 Proxy Contest (May 2014)45 slides · May 8, 2014
 Q1 2014 Earnings Presentation12 slides · May 7, 2014