Copano Energy L.L.C — IPAA OGIS MLP Investor Conference 2009
53 slides from Copano Energy L.L.C's conference presentation, Jan 15, 2009

Slide 1: IPAA OGIS MLP Investor Conference
IPAA OGIS MLP Investor Conference Houston, TX NASDAQ: CPNO January 15, 2009

Slide 2: Disclaimer
Disclaimer Statements made by representatives of Copano Energy, L.L.C. (“Copano”) during this presentation will include “forward-looking statements,” as defined in the federal securities laws. All statements that address activities, events or developments that Copano expects, believes or anticipates
Slide 3: Introduction to Copano
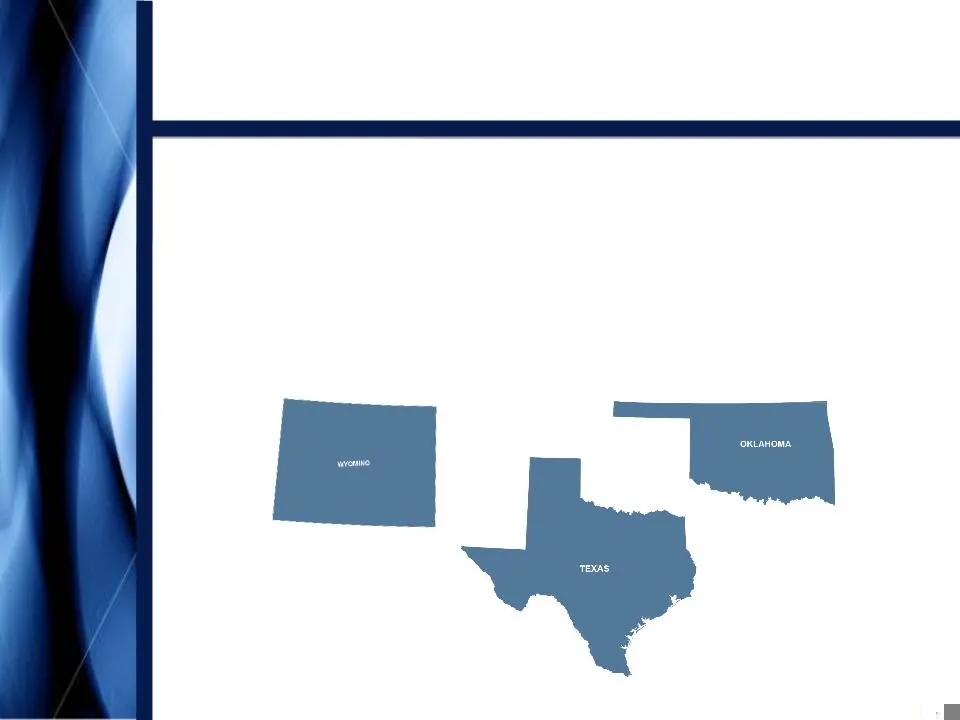
Introduction to • Serves natural gas producers in three leading producing regions • Founded in 1992 - built through more than 45 acquisitions and major capital projects Texas South Texas and North Texas Oklahoma Central and Eastern Oklahoma Rocky Mountains Wyoming’s Powder River Basin

Slide 4: Key Metrics
Key Metrics • Service throughput volumes exceed 1,700,000 MMBtu per day of natural gas (1) • Equity market cap: $823 million (2) • Enterprise value: $1.5 billion (2) • Copano has outperformed its peer group since IPO with a total return of 74% (2) compared to the Alerian MLP Total Return Index (AMZX
Slide 5: Copano's LLC Structure
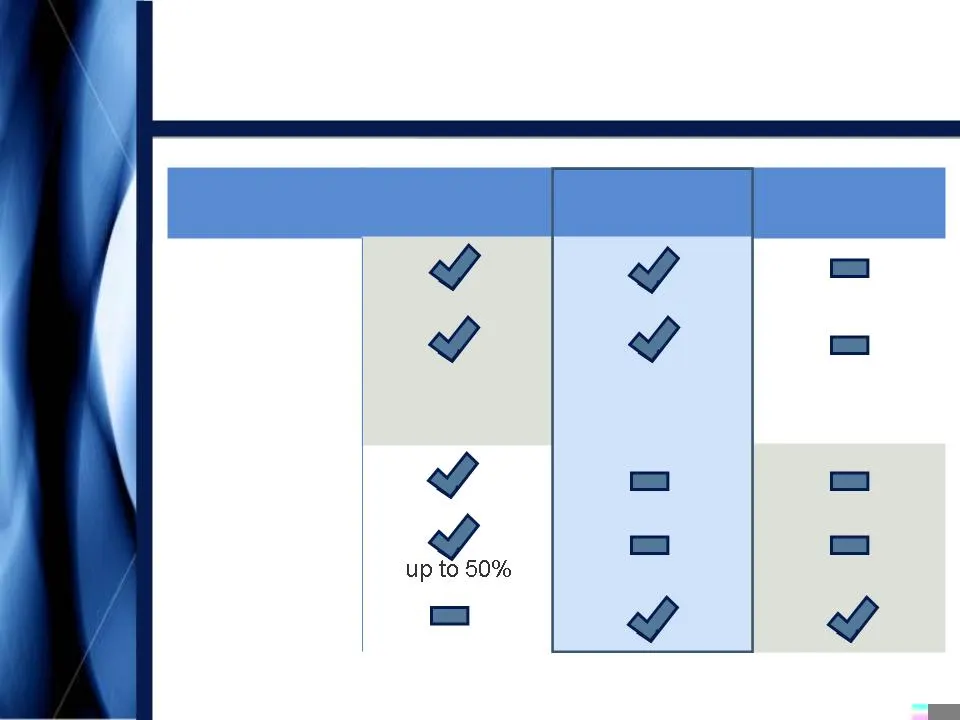
Characteristic Typical MLP Copano Energy Typical Corporation Non-Taxable Entity Tax Shield on Distributions Tax Reporting General Partner Incentive Distribution Rights Voting Rights Copano’s LLC Structure Schedule K-1 Schedule K-1 Form

Slide 6: Today's Agenda
Throughput Volume Outlook Today’s Agenda Commodity Prices and Margin Sensitivities Capital Access Distribution Policy and Outlook
Slide 7: Total Volume Trends
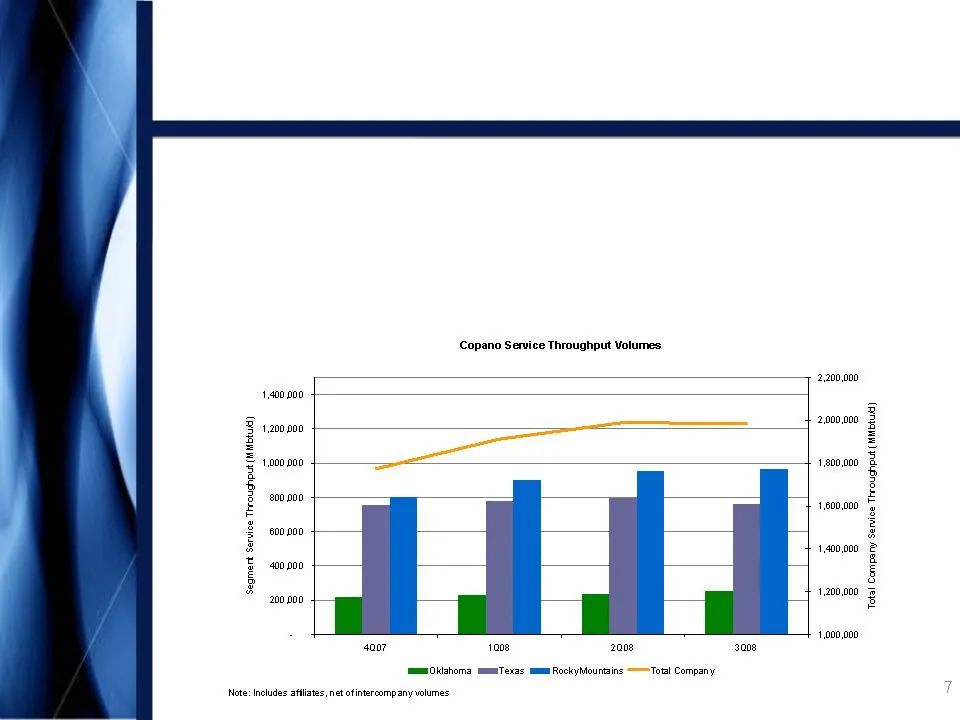
• Total service throughput volumes grew 12% from 4Q07 - 3Q08 – 4Q08E volumes exceeded 3Q08 – All three segments participated in year-over-year volume growth Total Volume Trends

Slide 8: Oklahoma Volume Outlook
• Rich gas (primarily Hunton de-watering play) – Drilling activity remains consistent – 8 rigs running currently in the Hunton and 14 in other rich gas areas – High BTU gas, processing upgrade and low geologic risk support drilling economics • Lean gas – Drilling activity has remained consistent des

Slide 9: South Texas Volume Outlook
South Texas Volume Outlook • Volumes remain consistent overall • Several south Texas niche areas remain strong • January Upper Gulf Coast transport volumes are at exceptional daily levels

Slide 10: North Texas Volume Outlook
North Texas Volume Outlook • Drilling activity remains steady • 4-5 rigs running in our gathering area • Producers focused on higher-performing “sweet spots” • High BTU, processing upgrade and low geologic risk support drilling economics, but declining crude prices are a negative • Completion of St.

Slide 11: Rocky Mountains Volume Outlook
Rocky Mountains Volume Outlook • Bighorn: – 2009 volumes expected to increase based on de-watering of new well connections – Development of extensive acreage dedication remains active but will be driven by drilling economics • Fort Union: – Volumes have increased and should accelerate in 2009 based

Slide 12: Commodity Prices and Margin Sensitivities
Commodity Prices and Margin Sensitivities Commodity Prices and Margin Sensitivities Distribution Policy and Outlook Capital Access Throughput Volume Outlook
Slide 13: Recent Oklahoma Prices
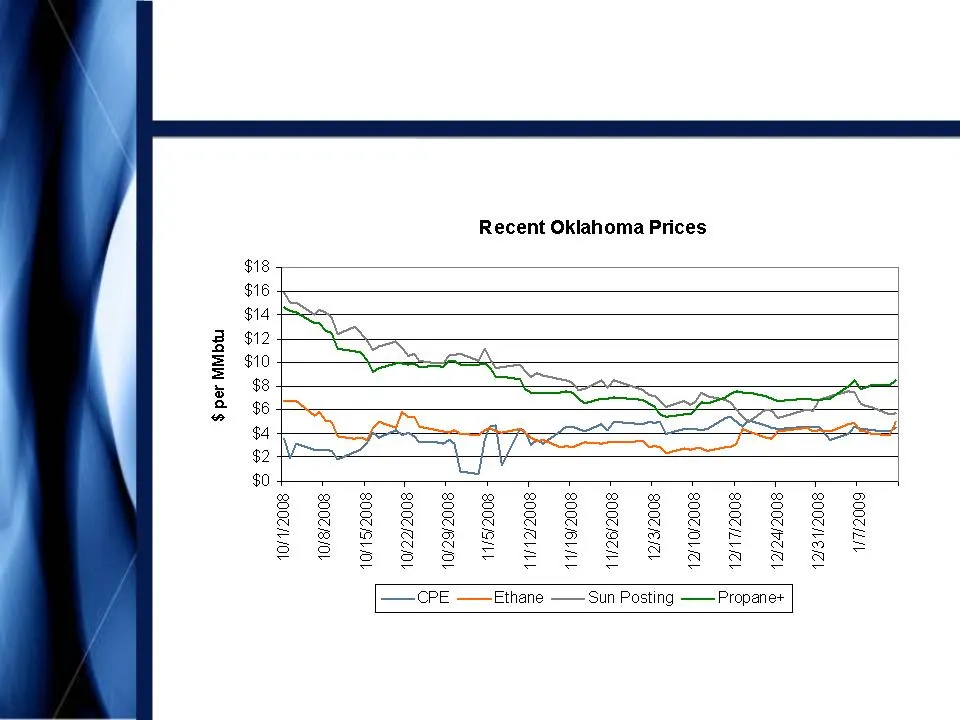
BOOZ ALL BOOTLE L 8007 PTEL Propanet B00Z/L LLL 8002/0 LL s00z/E/eL 8027/11 N 800Z/6 L/L 8002 ILL Pm 800ZIS/LL Sun Posting Recent Oklahoma Prices Ethane 8007/67/01 8007 T/L Ls 8007/51/01 8002 /8/01 fe al ae as 8007/1 /OL MAWIN 40d ¢

Slide 14: Oklahoma Contract Mix
Oklahoma Contract Mix • Third quarter – Total service throughput volumes: 243,000 MMBtu/d (1) – Unit margin: $1.50/MMBtu (2) – Increasing percentage of contract volumes (approximately 56%) contain fee-based components, including volumes subject to minimum margin provisions – Approximately 75% of con
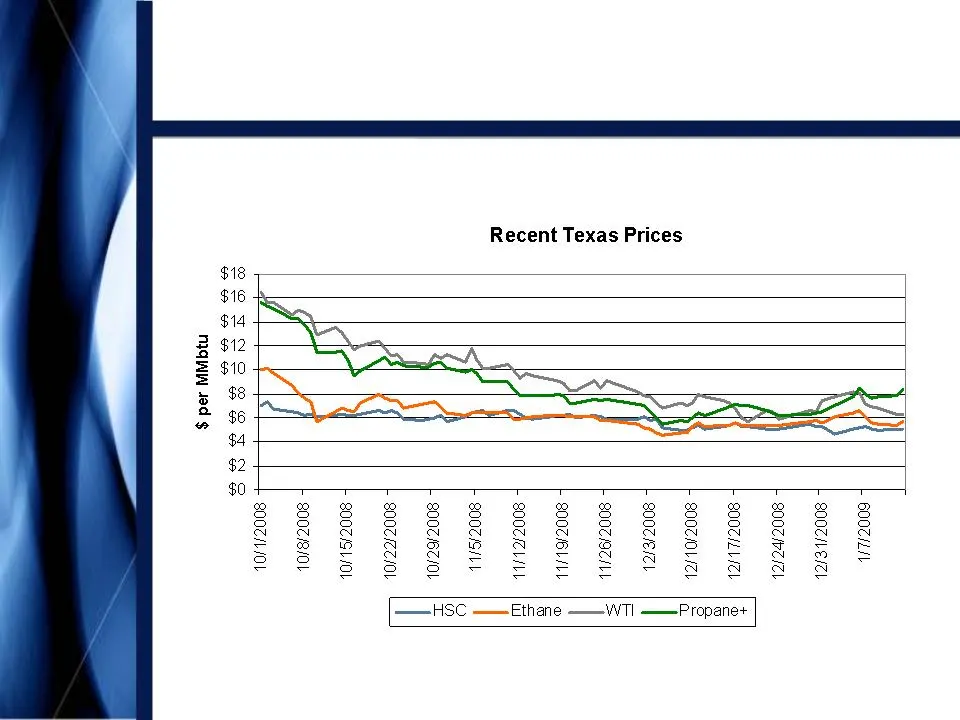
Slide 15: Recent Texas Prices
Recent Texas Prices BO0Z/LL SO0T/LEITL S007 MPTITL SO0T/LLITL SO0Z/OL ZL SO0T/EIZL SO0TMTILL SO0T/EL ILL SOOT L ILL 8007/SILL 8007/57/01 S007 ET/OL 8007/51/01 8007/S/0L 8007/L/0L [—rsc ——Ethane ——WTl ——Propane+

Slide 16: Texas Contract Mix
Texas Contract Mix • Third quarter – Total service throughput volumes: 670,000 MMBtu/d (1) – Unit margin: $0.67/MMBtu (2) – Approximately 84% of contract volumes have fee-based components, including volumes subject to minimum margin provisions – Approximately 88% of contract volumes directly correla
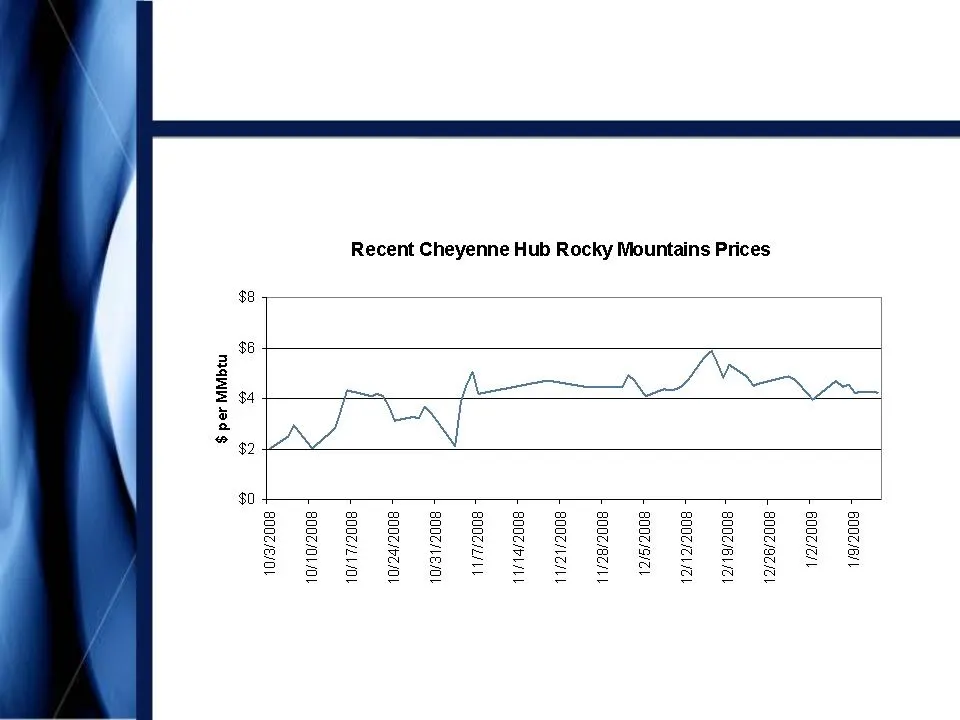
Slide 17: Rocky Mountains Natural Gas Prices
Rocky Mountains Natural Gas Prices

Slide 18: Rocky Mountains Contract Mix
Rocky Mountains Contract Mix • Third Quarter – Total service throughput volumes: • Consolidated (producer services): 230,000 MMBtu/d • Unconsolidated affiliates: § Bighorn: 210,000 MMBtu/d § Fort Union: 735,000 MMBtu/d • All Bighorn and Fort Union margins are fixed fee – Virtually all producer servi
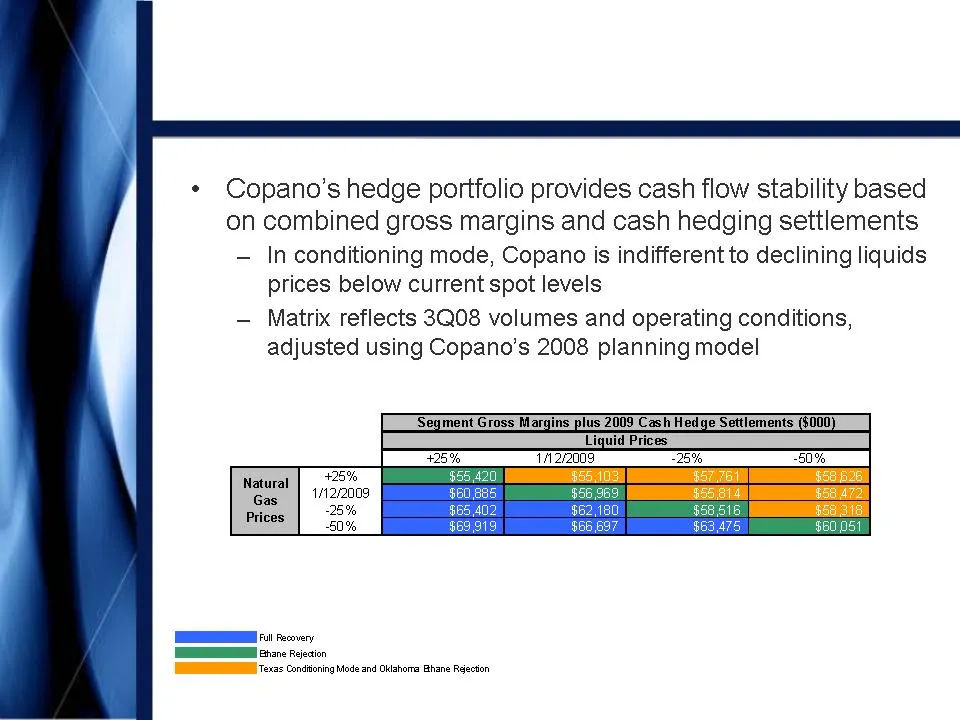
Slide 19: Margin Sensitivities
Margin Sensitivities Oklahoma and Texas Segments Note: Please see Appendix for definitions of processing modes and additional details.

Slide 20: Capital Access
Capital Access Capital Access Distribution Policy and Outlook Commodity Prices and Margin Sensitivities Throughput Volume Outlook
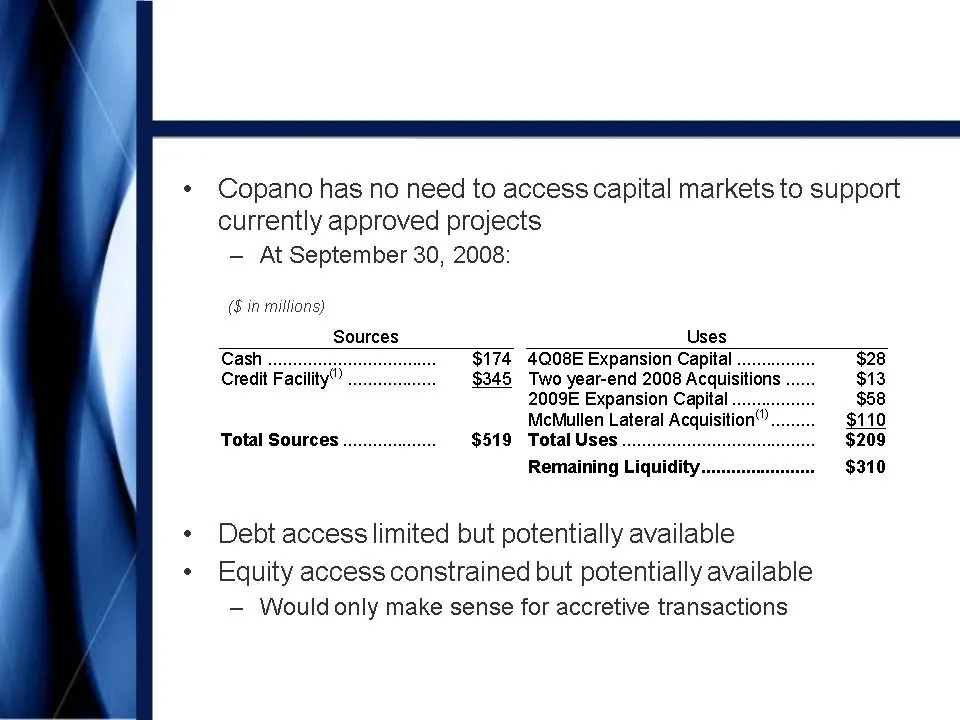
Slide 21: Capital Access
Capital Access (1) Credit facility availability is $345 million only in the case of a qualifying acquisition. The McMullen Lateral acquisition would qualify, but remains subject to FERC approval. Please see Appendix for additional details.

Slide 22: Distribution Policy and Outlook
Distribution Policy and Outlook Distribution Policy and Outlook Capital Access Commodity Prices and Margin Sensitivities Throughput Volume Outlook
Slide 23: Distribution Track Record
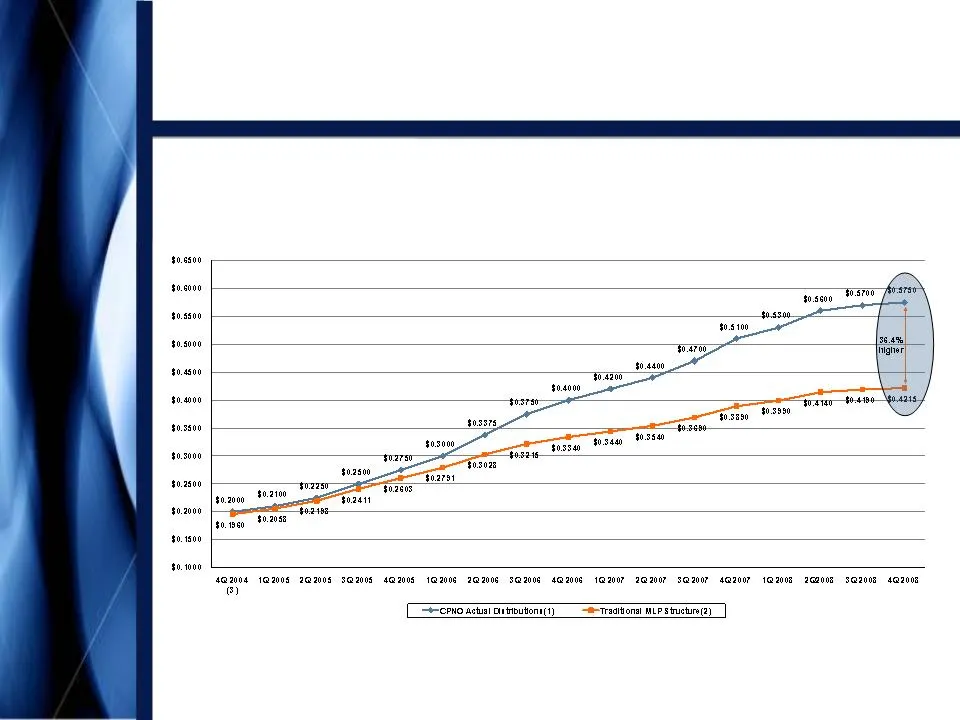
Distribution Track Record • On January 14, 2009, Copano announced its sixteenth consecutive increase in quarterly distributions since its IPO (1) All pre-1Q 2007 distributions are adjusted to reflect Copano’s 3/30/07 two-for-one unit split. (2) Assumes generic MLP splits with 10%, 25% & 50% increase
Slide 24: Distribution Outlook
Driver Potential 2011 - 2012 Annual Incremental Total DCF Impact (1) ($ in millions) Comments and Risk Factors Rocky Mountains Volumes $40 - $55 • Resource play • Drilling activity • Dewatering rates • Fort Union expansion • New projects St. Jo Plant and North Texas Volumes (2) $10 - $15 • Resource
Slide 25: Distribution Outlook
Driver Potential 2011 - 2012 Annual Incremental Total DCF Impact (1) ($ in millions) Comments and Risk Factors Balance Sheet, Contract and Cost Management $10 - $15 • Cash deployment • Debt management • G&A and O&M efficiencies • Market conditions Forward Commodity Prices (3Q08 vs. 2012 forward curv

Slide 26: Appendix
Appendix
Slide 27: Oklahoma Assets
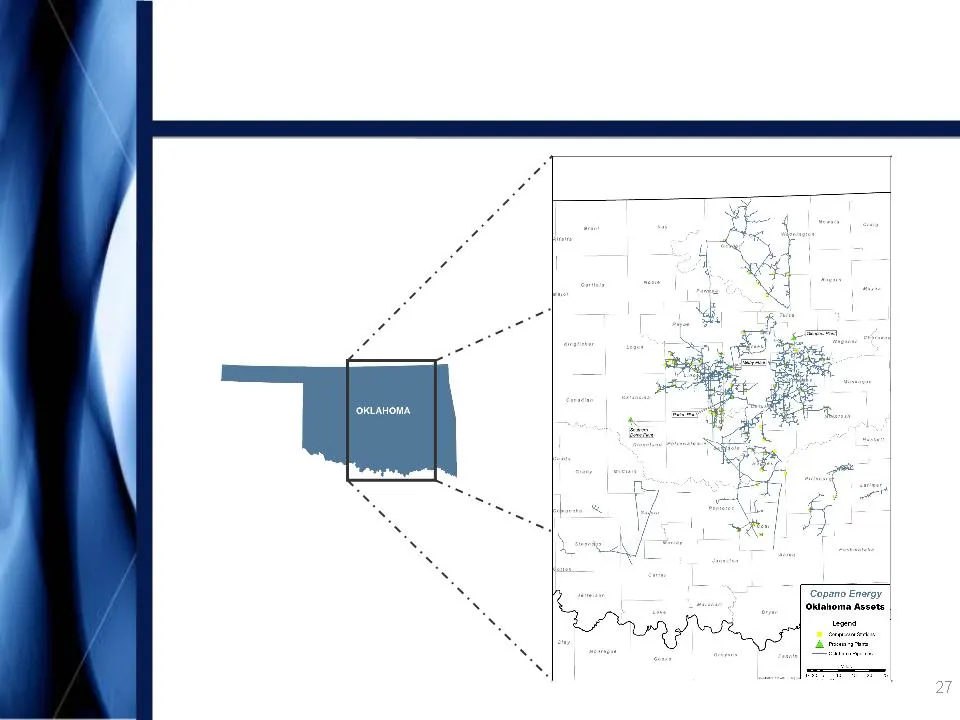
Copano Eneray | ‘Oklahoma Assets | a 27
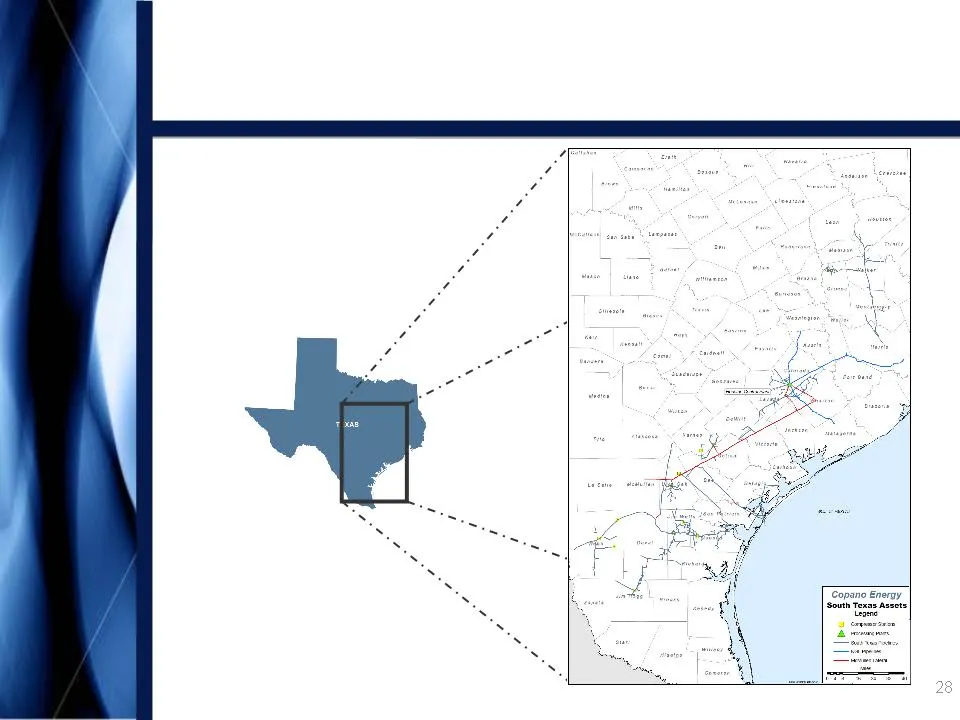
Slide 28: South Texas Assets
South Texas Assets Appendix
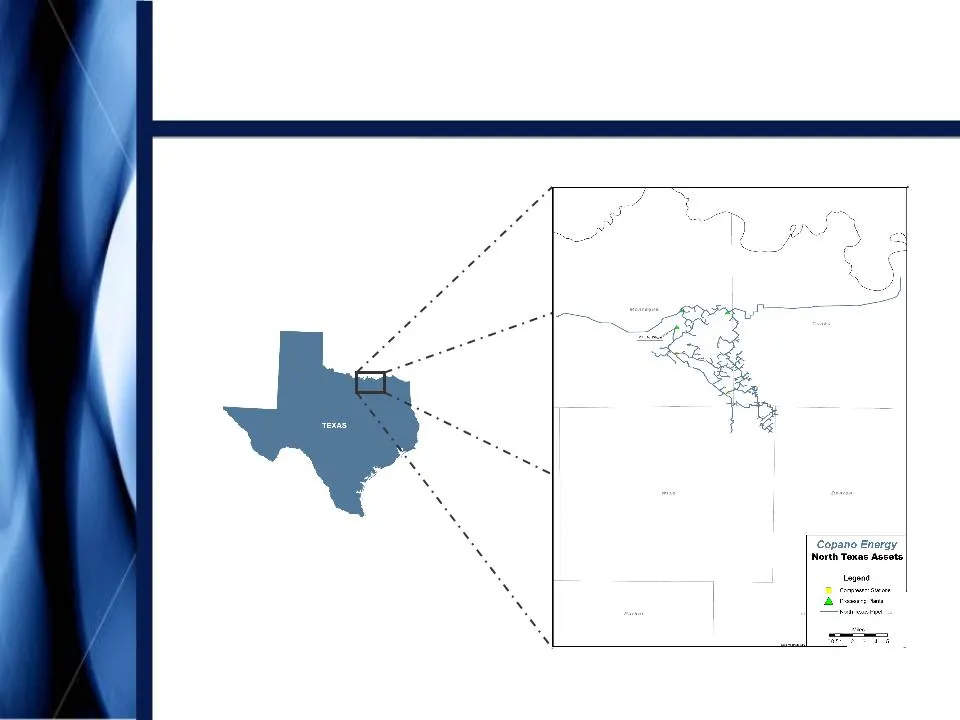
Slide 29: North Texas Assets
Copano Energy North Taxas Asote . a
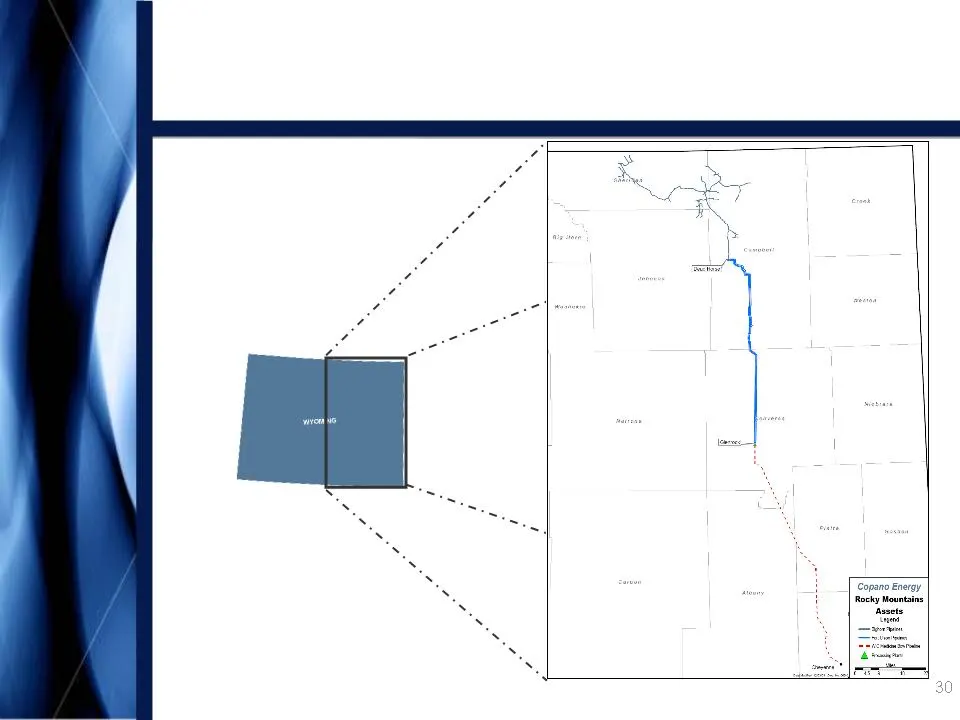
Slide 30: Rocky Mountains Assets
Rocky Mountains Assets Appendix

Slide 31: Processing Modes
Processing Modes • Full Recovery • Ethane Rejection • Conditioning Mode → Texas and Oklahoma - If the value of recovered NGLs exceeds the fuel and gas shrinkage costs of recovering NGLs → Texas - If the value of recovered NGLs is less than the fuel and gas shrinkage cost of recovering NGLs (availabl
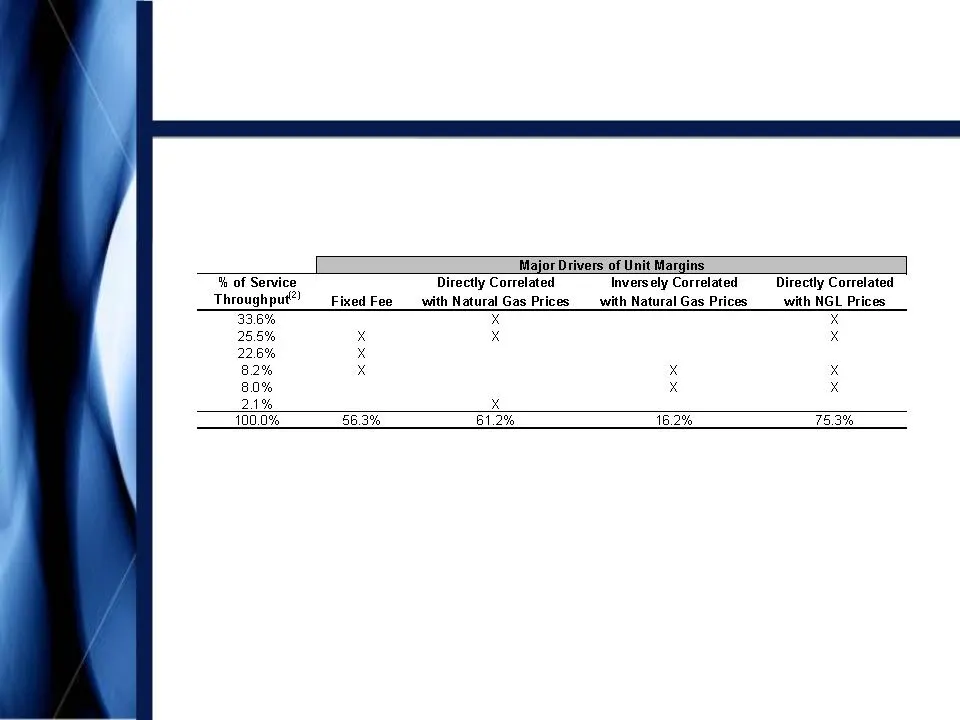
Slide 32: Oklahoma Contract Mix
Oklahoma Contract Mix • Third quarter 2008 contract mix (1) Appendix (1) Source: Copano Energy internal financial planning models for consolidated subsidiaries. (2) Excludes 11,557 MMBtu/d service throughput for Southern Dome, a majority-owned affiliate.

Slide 33: Oklahoma Net Commodity Exposure
Oklahoma Net Commodity Exposure • Third quarter 2008 (1) – Net share of NGLs: • Ethane: 2,300 BPD § If in ethane rejection: 1,700 BPD (2) • Propane+: 2,700 BPD § Propane: 70% § Iso Butane: 8% § Normal Butane: 23% § Natural Gasoline: - -1% (3) – Net share of natural gas: 6,300 MMBtu/d • Net share of
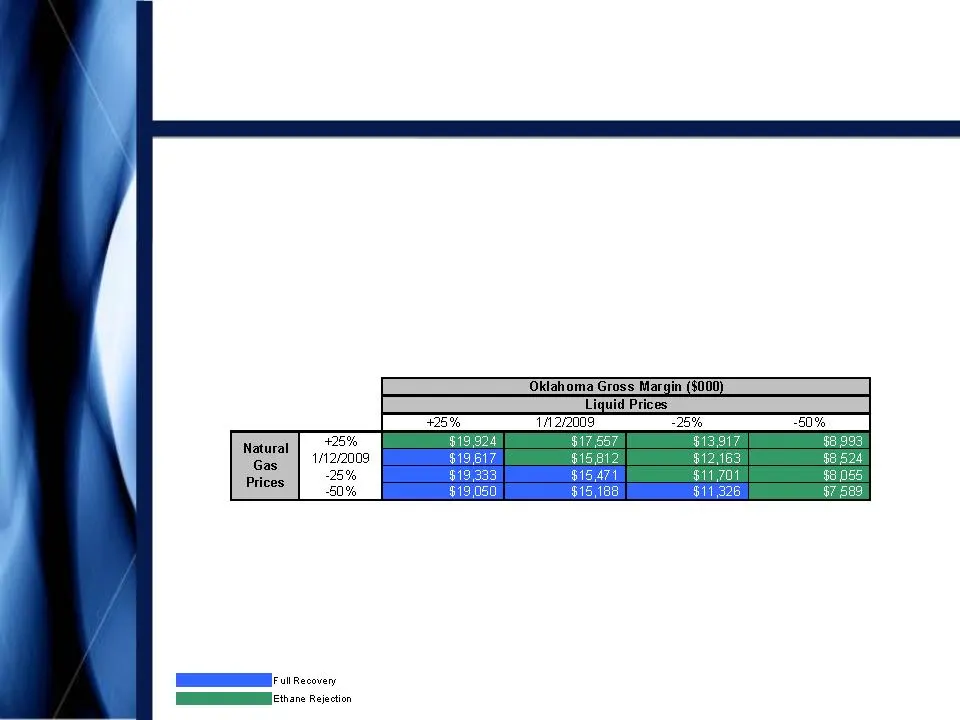
Slide 34: Oklahoma Commodity Price Sensitivities
Oklahoma Commodity Price Sensitivities • Oklahoma segment gross margins excluding hedge settlements – Matrix reflects 3Q08 volumes and operating conditions, adjusted using Copano’s 2008 planning model Appendix
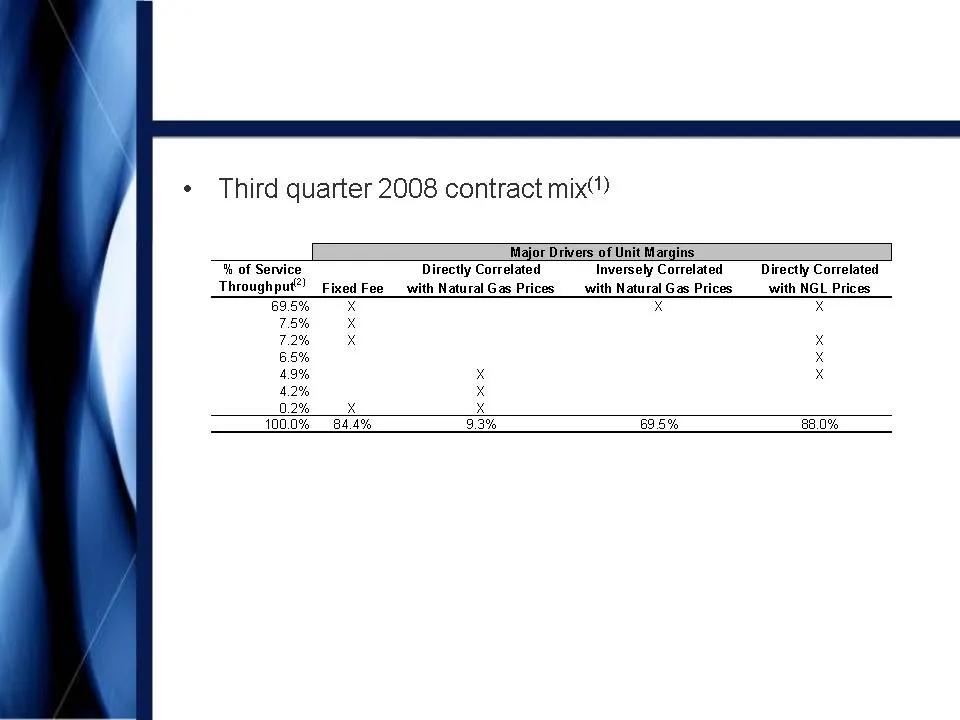
Slide 35: Texas Contract Mix
Texas Contract Mix Appendix (1) Source: Copano Energy internal financial planning models for consolidated subsidiaries. (2) Excludes 97,906 MMBtu/d service throughput for Webb Duval, a majority-owned affiliate.

Slide 36: Texas Net Commodity Exposure
Texas Net Commodity Exposure • Third quarter 2008 (1) – Net share of NGLs: • Ethane: 4,800 BPD § 8 BPD if in ethane rejection (2) • Propane+: 6,000 BPD § Propane: 60% § Iso Butane: 14% § Normal Butane: 19% § Natural Gasoline: 7% • Propane+ in conditioning mode: 80 BPD – Net share of natural gas: (43
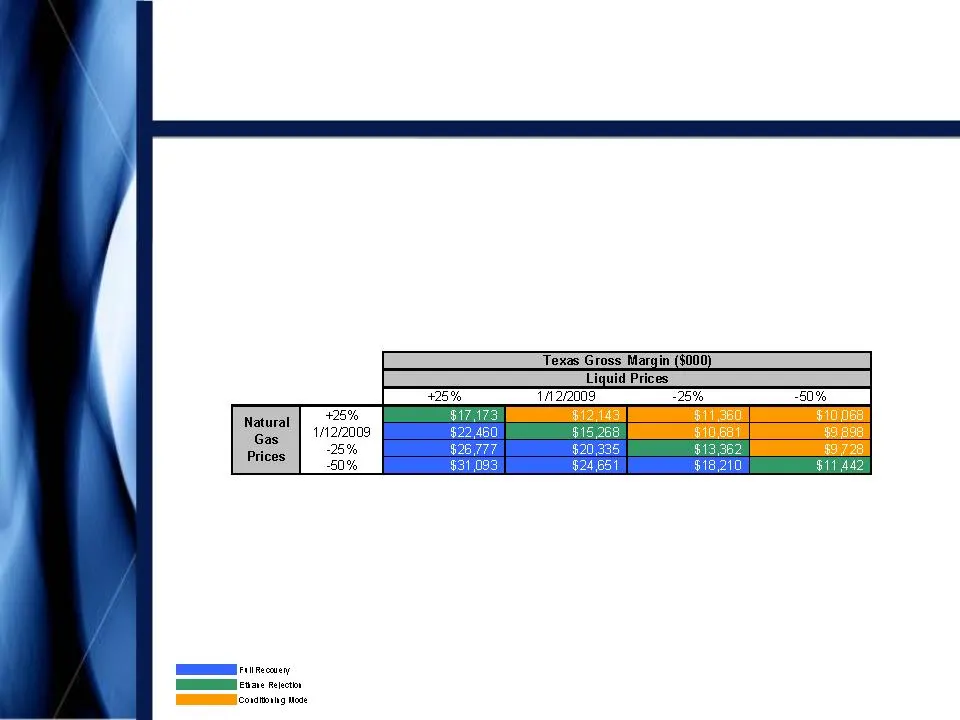
Slide 37: Texas Commodity Price Sensitivities
Texas Commodity Price Sensitivities • Texas segment gross margins excluding hedge settlements – Matrix reflects 3Q08 volumes and operating conditions, adjusted using Copano’s 2008 planning model Appendix

Slide 38: Rocky Mountains Sensitivities
Rocky Mountains Sensitivities • Third Quarter – Adjusted EBITDA volume sensitivity (positive or negative impact) • Consolidated (producer services): 10,000 MMBtu/d = $55,000 • Unconsolidated affiliates: § Bighorn: 10,000 MMBtu/d = $209,000 § Fort Union: 10,000 MMBtu/d = $70,000 Note: See this Append
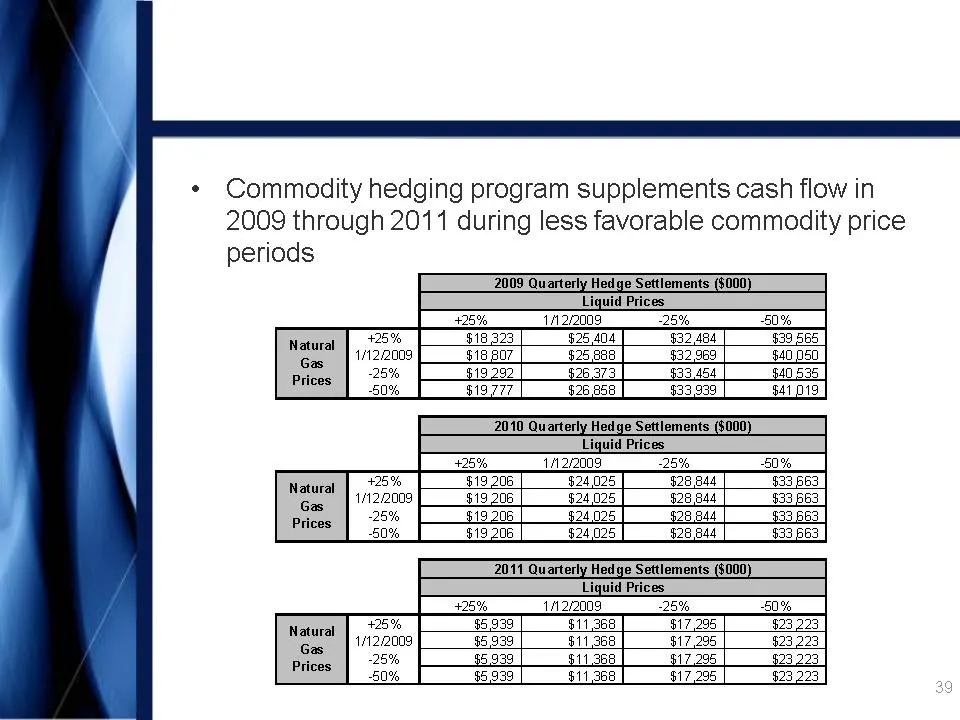
Slide 39: Hedging Impact of Commodity Price Sensitivities
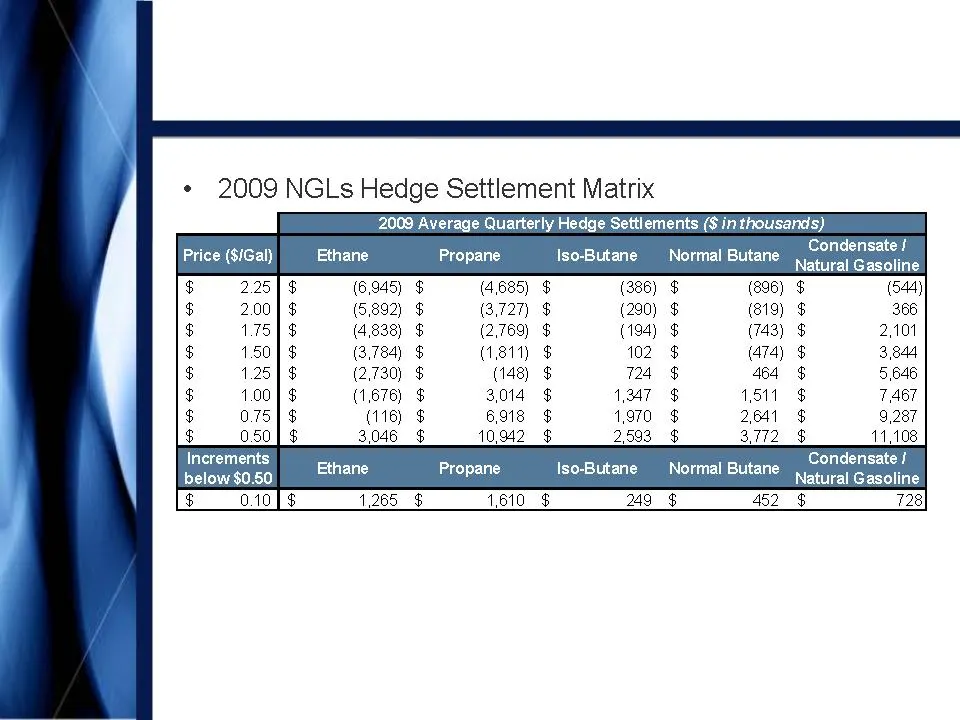
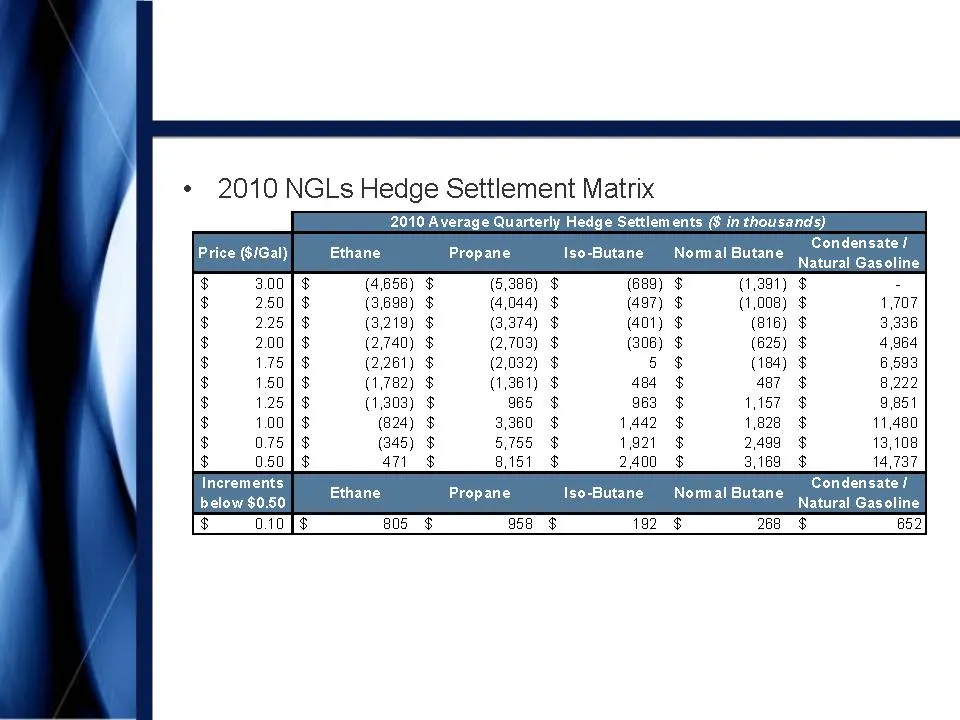
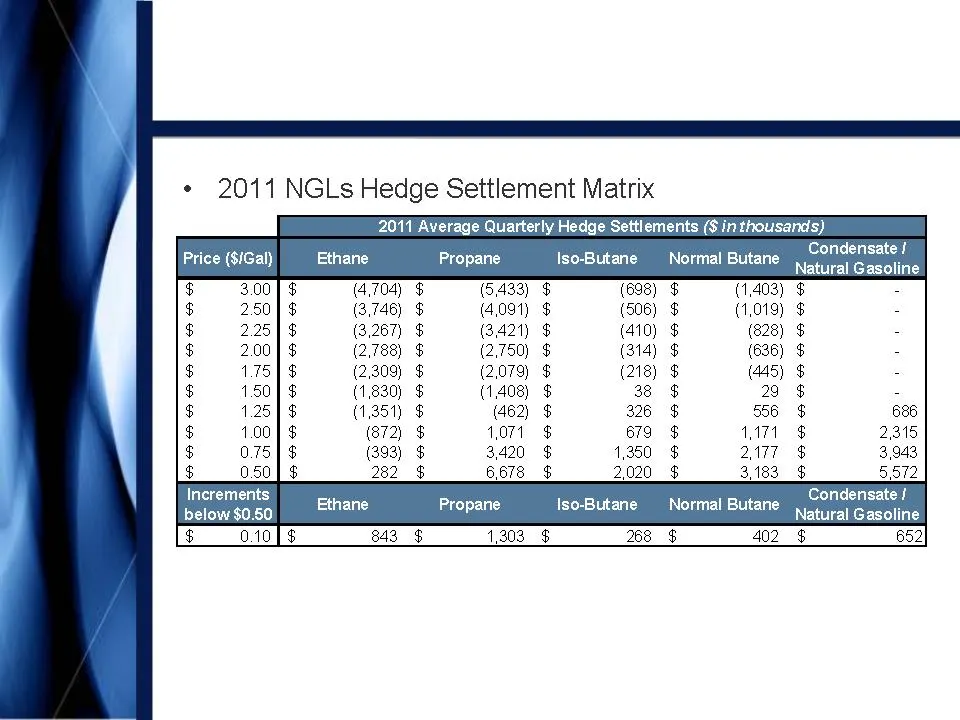
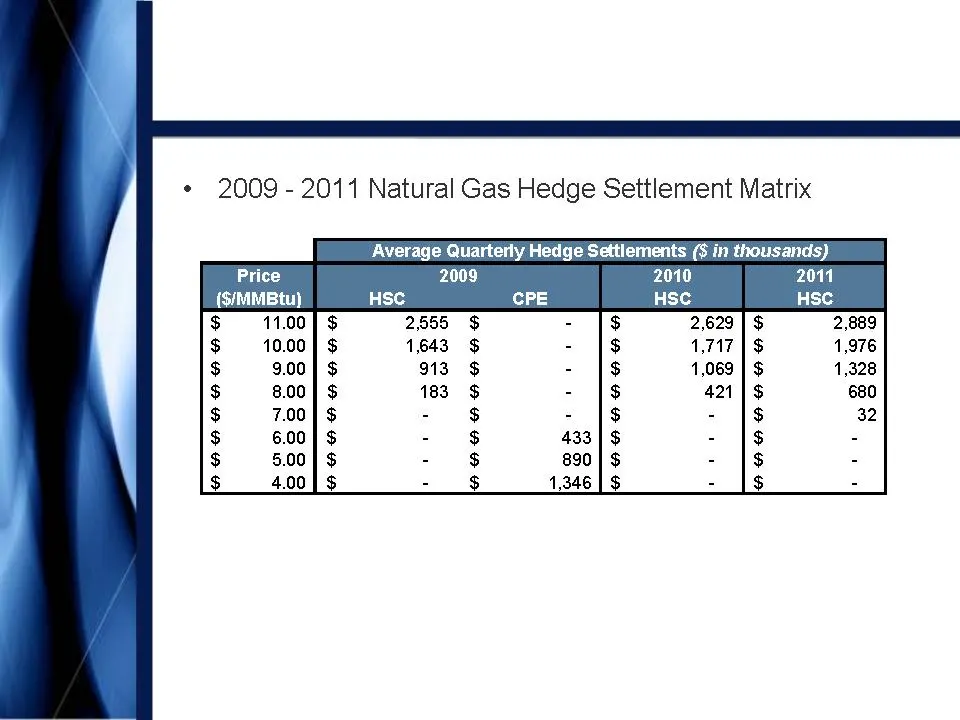
Hedging Impact of Commodity Price Sensitivities Appendix
Slide 40: Hedging Impact
Hedging Impact Note: All hedge instruments are reported in Copano’s SEC filings. Hedge settlements are based on monthly average Mt. Belvieu NGL and NYMEX WTI prices. Positive amounts reflect payments from hedge counterparties under swap and put option instruments. Negative amounts reflect payments t
Slide 41: Hedging Impact
Hedging Impact Note: All hedge instruments are reported in Copano’s SEC filings. Hedge settlements are based on monthly average Mt. Belvieu NGL and NYMEX WTI prices. Positive amounts reflect payments from hedge counterparties under swap and put option instruments. Negative amounts reflect payments t
Slide 42: Hedging Impact
Hedging Impact Note: All hedge instruments are reported in Copano’s SEC filings. Hedge settlements are based on monthly average Mt. Belvieu NGL and NYMEX WTI prices. Positive amounts reflect payments from hedge counterparties under swap and put option instruments. Negative amounts reflect payments t
Slide 43: Hedging Impact
Hedging Impact Note: All hedge instruments are reported in Copano’s SEC filings. Hedge settlements are based on first of the month Houston Ship Channel and CenterPoint East natural gas prices. Positive amounts reflect payments from hedge counterparties under call and put option instruments. Appendix

Slide 44: Liquidity
Liquidity • At September 30, – Cash: $174 million – Revolving credit facility availability • Without acquisition: approximately $300 million • With acquisition: approximately $345 million (1) • Remaining term: approximately 4 years • Currently LIBOR + 175 bps – $650 million senior notes • $350 milli

Slide 45: Key Debt Terms and Covenants
Key Debt Terms and Covenants • Senior Secured Revolving Credit Facility – $550 million facility with $100 million accordion – Maintenance tests: • 5x defined EBITDA (1) limitation on total debt § 3.74x at September 30, 2008 (2) • Minimum required interest coverage 2.5x defined EBITDA § 4.17x at Sept

Slide 46: Key Debt Terms and Covenants
Key Debt Terms and Covenants • Senior Notes – Incurrence tests: • Minimum defined EBITDA to interest test of 2.00x for debt incurrence • Minimum defined EBITDA to interest test of 1.75x for restricted payments § Defined EBITDA is similar to that for credit facility Appendix

Slide 47: Limited Liability Company Agreement
Limited Liability Company Agreement • Distributions based on “Available Cash” – Cash on hand at the end of a quarter less reserves established by the Board – Board may increase or decrease reserves quarterly • Since IPO and as of September 30, 2008: – Initial available cash and reserve at IPO: $20 m
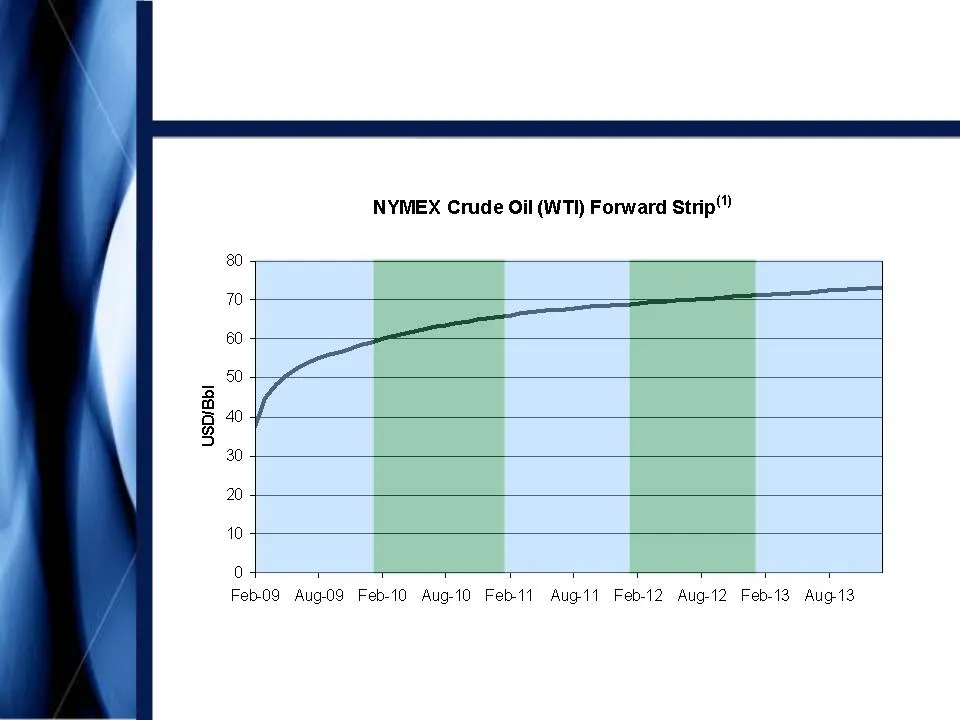
Slide 48: Oil Price Trends
Oil Price Trends (1) As of January 13, 2009.
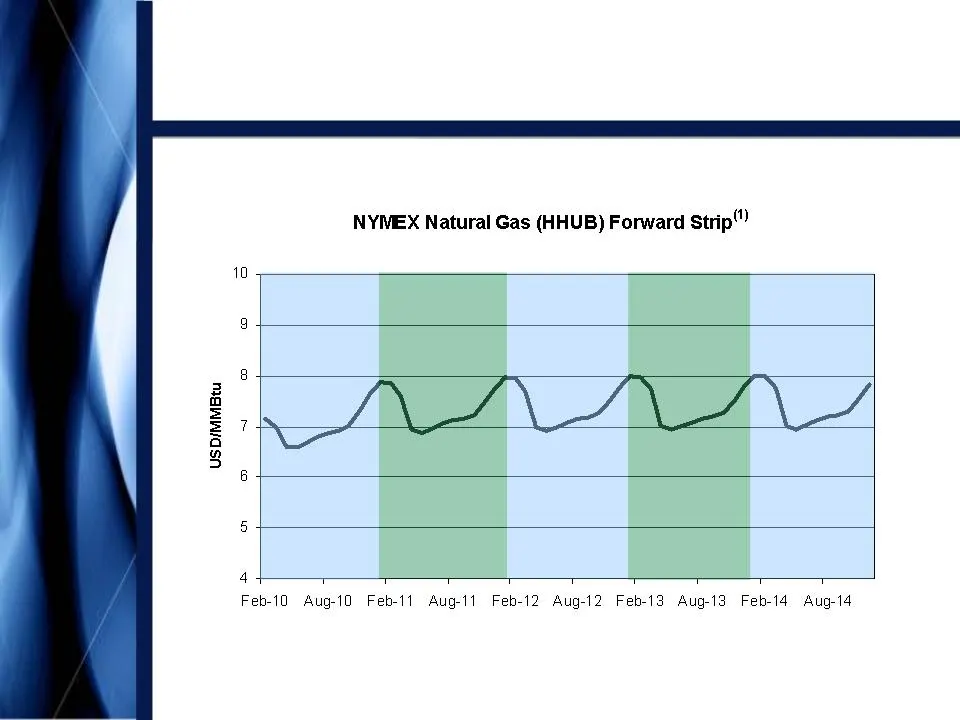
Slide 49: Natural Gas Price Trends
Natural Gas Price Trends (1) As of January 13, 2009.
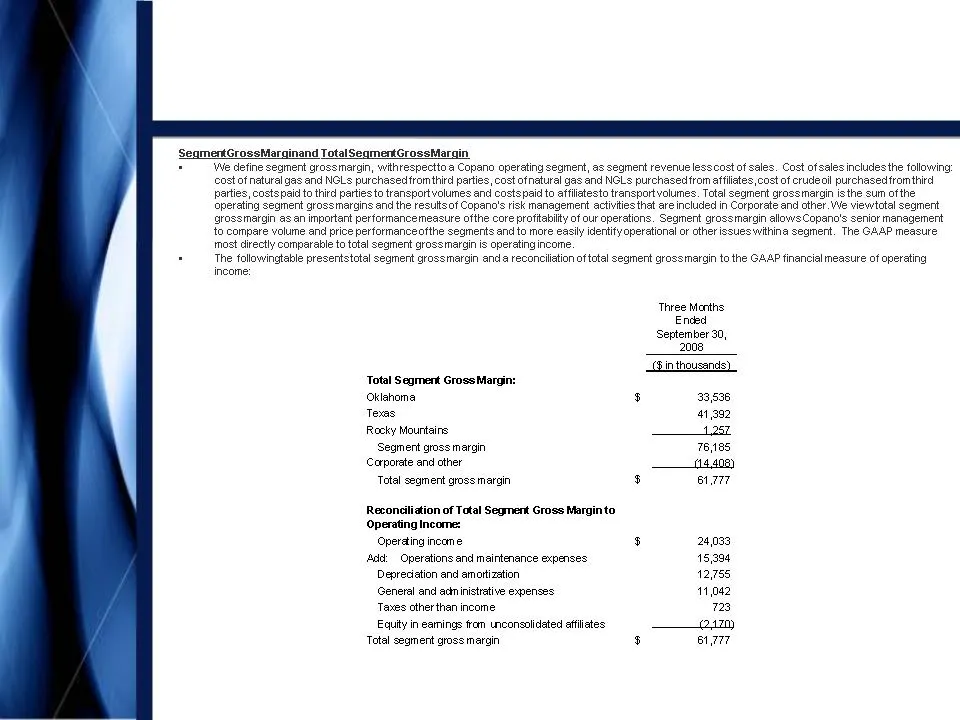
Slide 50: Reconciliation of Non-GAAP Financial Measures
Reconciliation of Non-GAAP Financial Measures Appendix
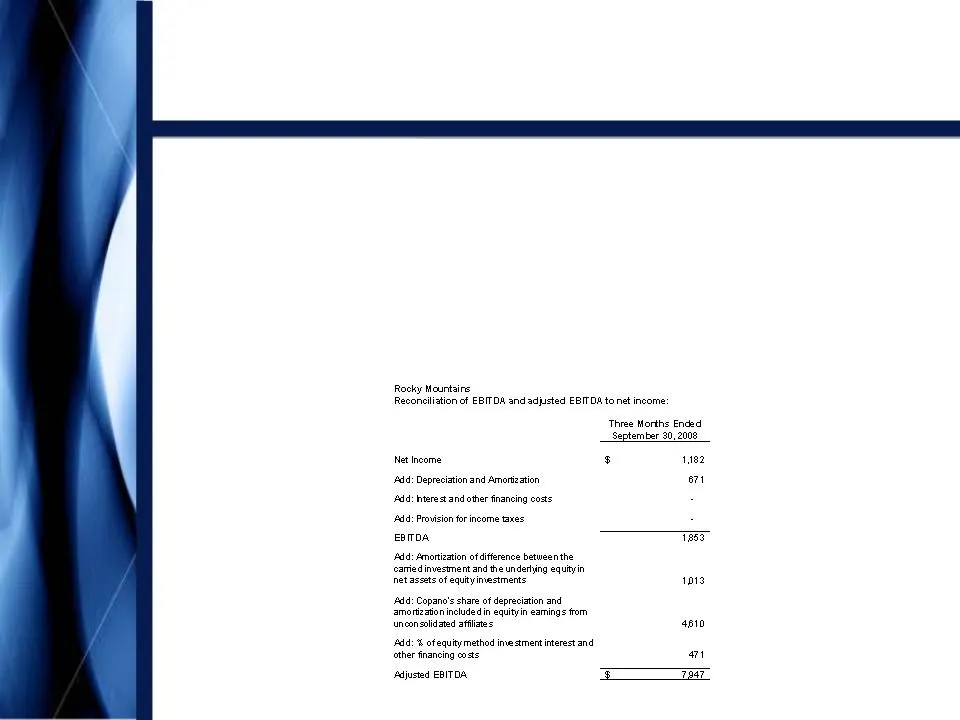
Slide 51: Reconciliation of Non-GAAP Financial Measures: Adjusted EBITDA
Reconciliation of Non-GAAP Financial Measures Adjusted EBITDA • We define EBITDA as net income (loss) plus interest expense, provision for income taxes and depreciation and amortization expense. Because a portion of our net income (loss) is attributable to equity in earnings (loss) from our equity i
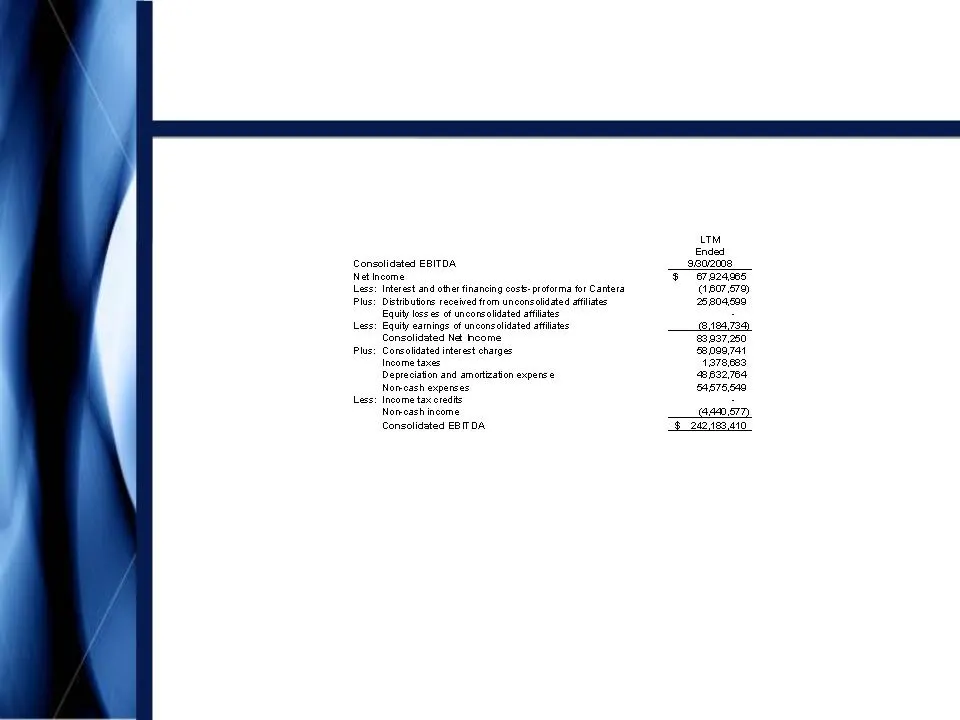
Slide 52: Reconciliation of Non-GAAP Financial Measures: Consolidated EBITDA
Reconciliation of Non-GAAP Financial Measures Consolidated EBITDA § EBITDA is also a financial measure that, with negotiated pro forma adjustments relating to acquisitions completed during the period, is reported to our lenders as Consolidated EBITDA and is used to compute our financial covenants un

Slide 53: January
NASDAQ: CPNO January
Source: SEC EDGAR · 8-K filed Jan 15, 2009
More decks from Copano Energy L.L.C.
 2012 RBC Capital Markets MLP Conference35 slides · Nov 15, 2012
 2012 Citi One-on-One MLP/Midstream Infrastructure Conference35 slides · Aug 21, 2012
 Investor Presentation (June 2012)34 slides · Jun 18, 2012
 NAPTP 2012 MLP Investor Conference34 slides · May 22, 2012
 Morgan Stanley MLP and Diversified Natural Gas Corporate Access Day 201245 slides · Mar 7, 2012
 2011 RBC Capital Markets MLP Conference42 slides · Nov 17, 2011