Tellurian — Citi Midstream/Energy Infrastructure Conference 2020
31 slides from Tellurian's conference presentation, Aug 12, 2020
Slide 1: Citi Midstream/Energy Infrastructure Conference 2020
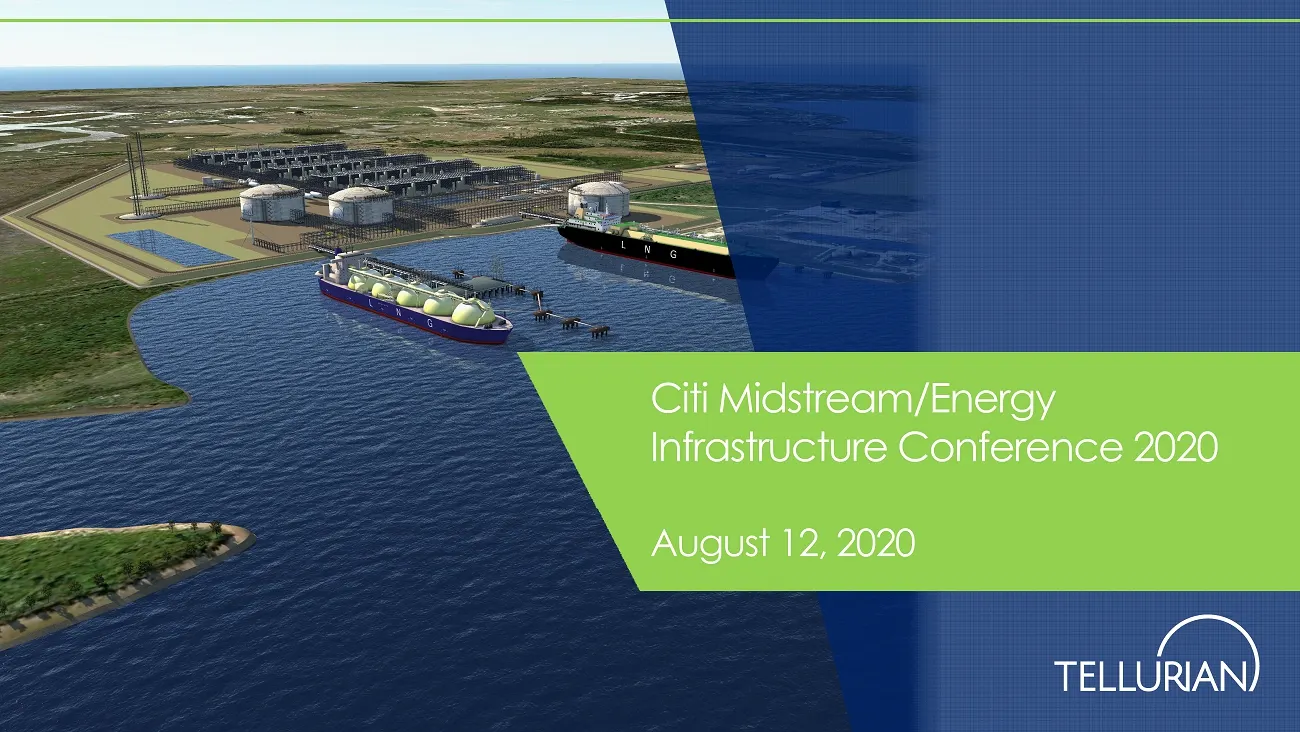
Citi Midstream/Energy Infrastructure Conference 2020 August 12, 2020
Slide 2: Cautionary statements
Cautionary statements The information in this presentation includes “forward - looking statements” within the meaning of Section 27A of the Securities Act of 1933, as amended, and Section 21E of the Securities Exchange Act of 1934, as amended. All statements other than statements of historical fact
Slide 3: Tellurian value proposition
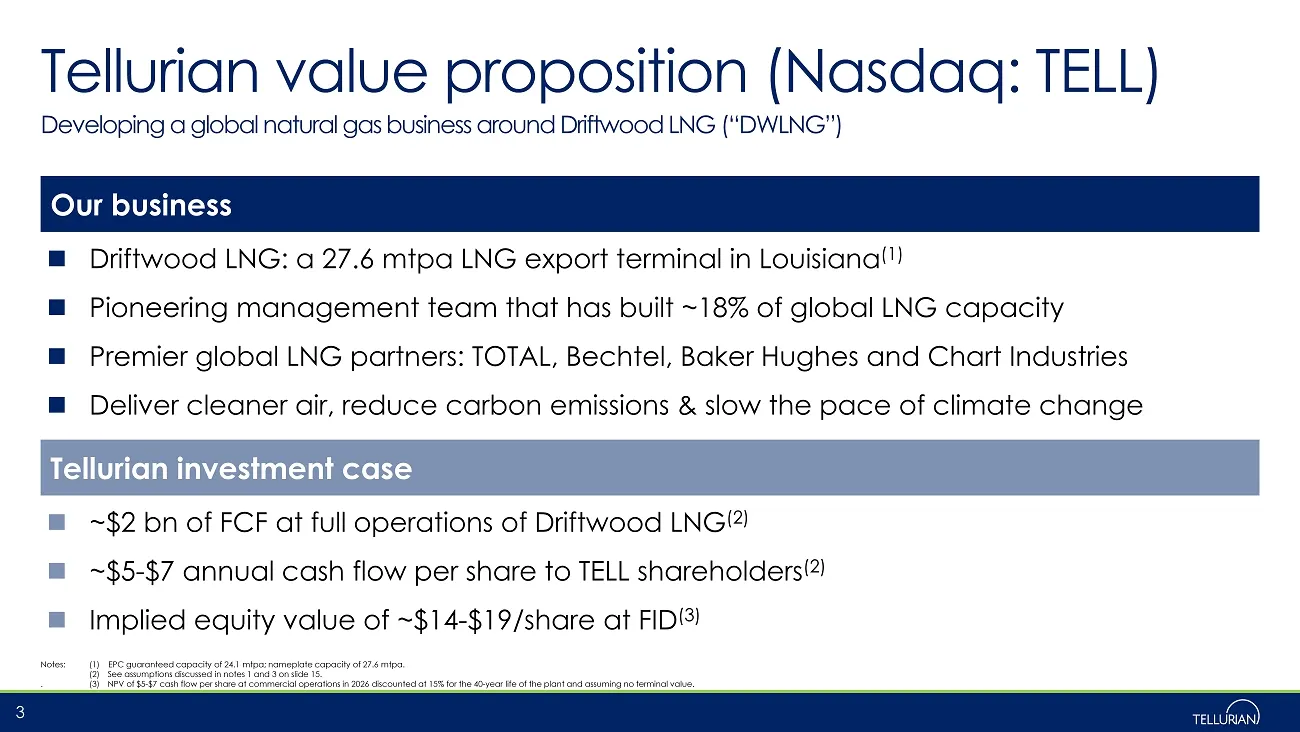
Notes: (1) EPC guaranteed capacity of 24.1 mtpa; nameplate capacity of 27.6 mtpa. (2) See assumptions discussed in notes 1 and 3 on slide 15. . (3) NPV of $5 - $7 cash flow per share at commercial operations in 2026 discounted at 15% for the 40 - year life of the plant and assuming no terminal value
Slide 4: Driftwood LNG update
Driftwood LNG update 4
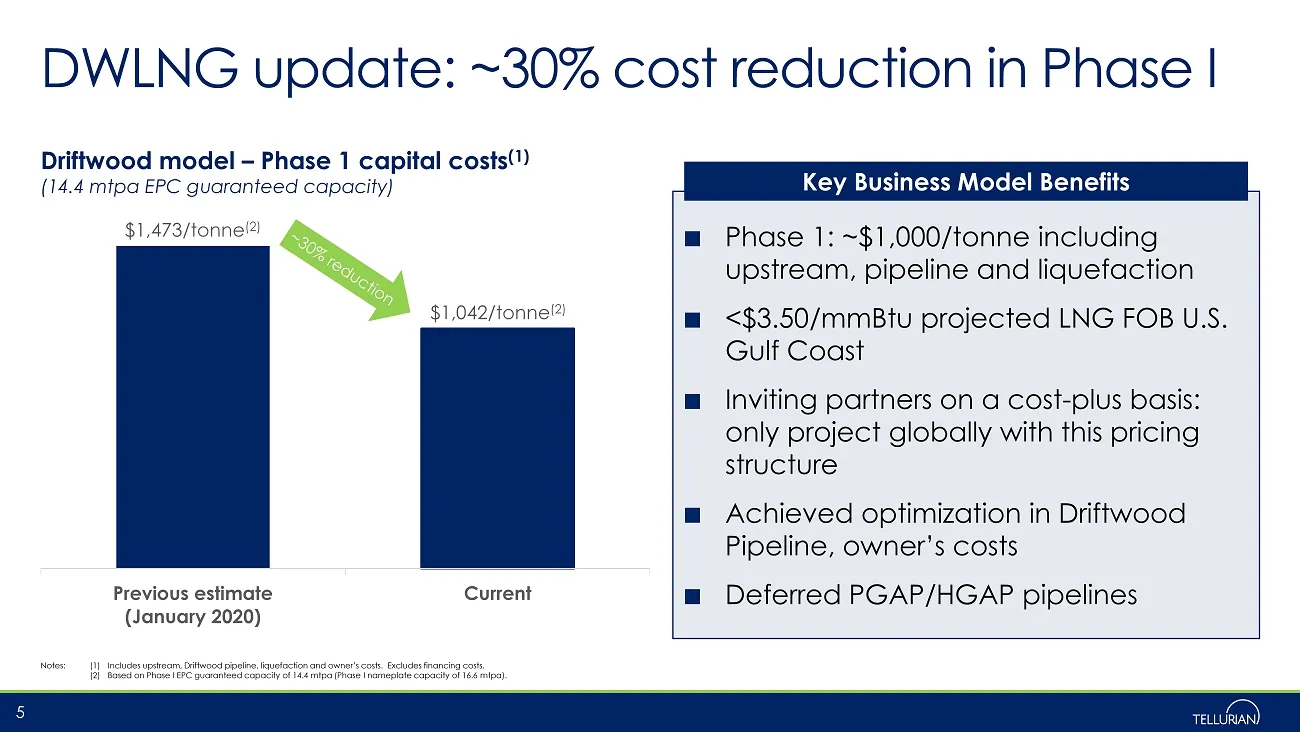
Slide 5: DWLNG update: ~30% cost reduction in Phase I
DWLNG update: ~30% cost reduction in Phase I 5 Previous estimate (January 2020) Current ■ Phase 1: ~$1,000/tonne including upstream, pipeline and liquefaction ■ <$3.50/mmBtu projected LNG FOB U.S. Gulf Coast ■ Inviting partners on a cost - plus basis: only project globally with this pricing structur
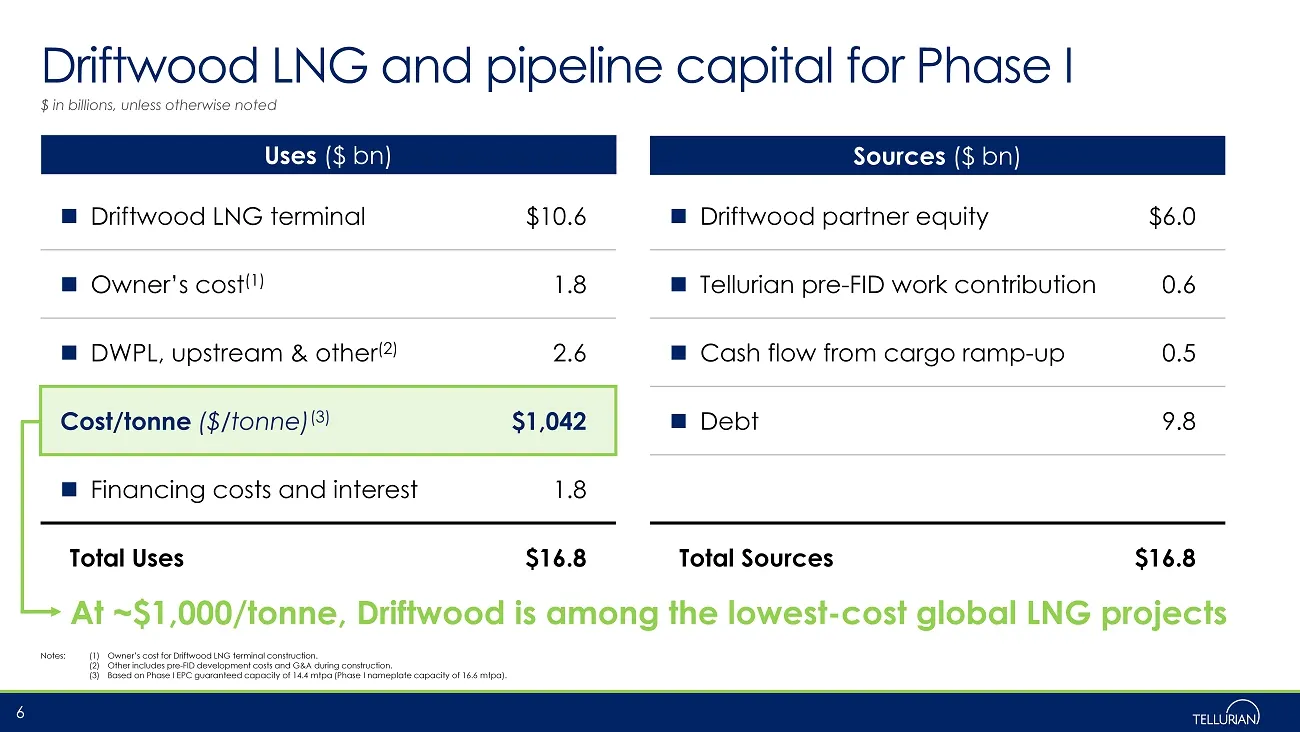
Slide 6: Driftwood LNG and pipeline capital for Phase I
Driftwood LNG and pipeline capital for Phase I Notes: (1) Owner’s cost for Driftwood LNG terminal construction. (2) Other includes pre - FID development costs and G&A during construction. (3) Based on Phase I EPC guaranteed capacity of 14.4 mtpa (Phase I nameplate capacity of 16.6 mtpa). 6 Uses ($ b
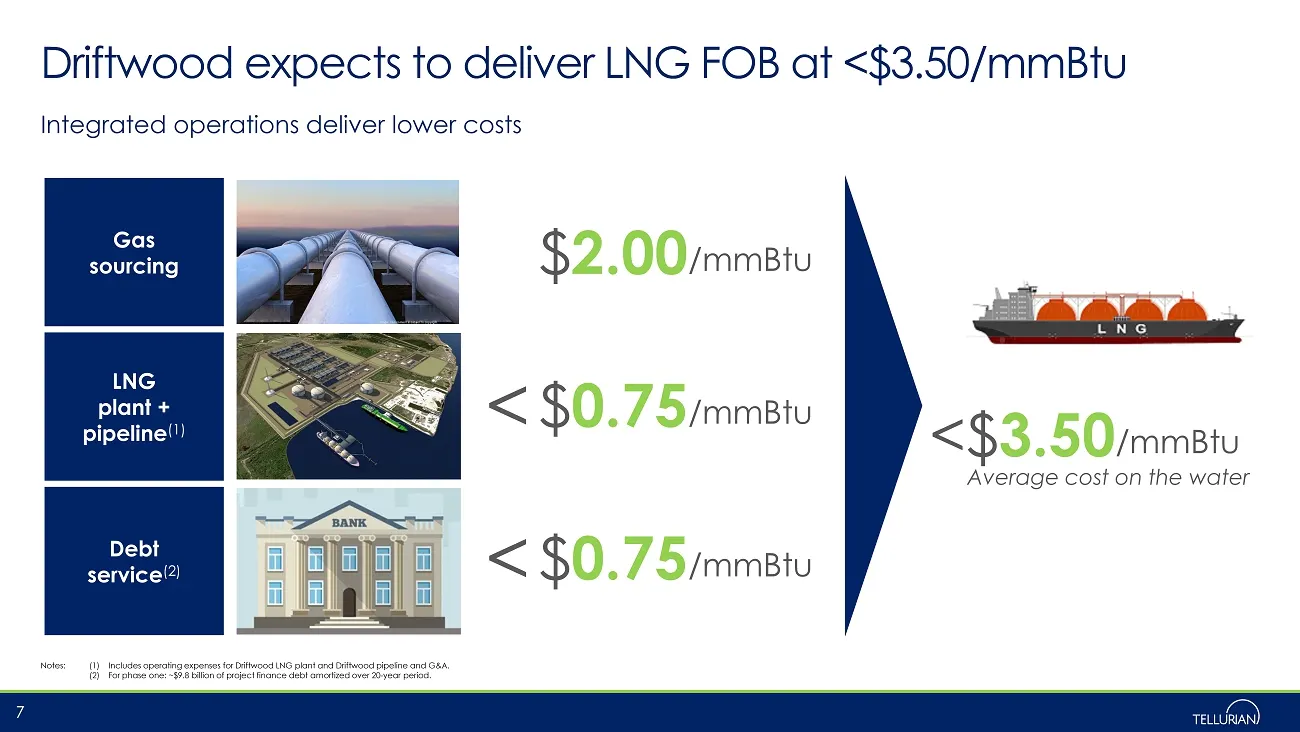
Slide 7: Driftwood expects to deliver LNG FOB at <$3.50/mmBtu
Driftwood expects to deliver LNG FOB at <$3.50/mmBtu Integrated operations deliver lower costs Notes: (1) Includes operating expenses for Driftwood LNG plant and Driftwood pipeline and G&A. (2) For phase one: ~$9.8 billion of project finance debt amortized over 20 - year period. 7 Gas sourcing LNG p
Slide 8: LNG macro update
LNG macro update 8
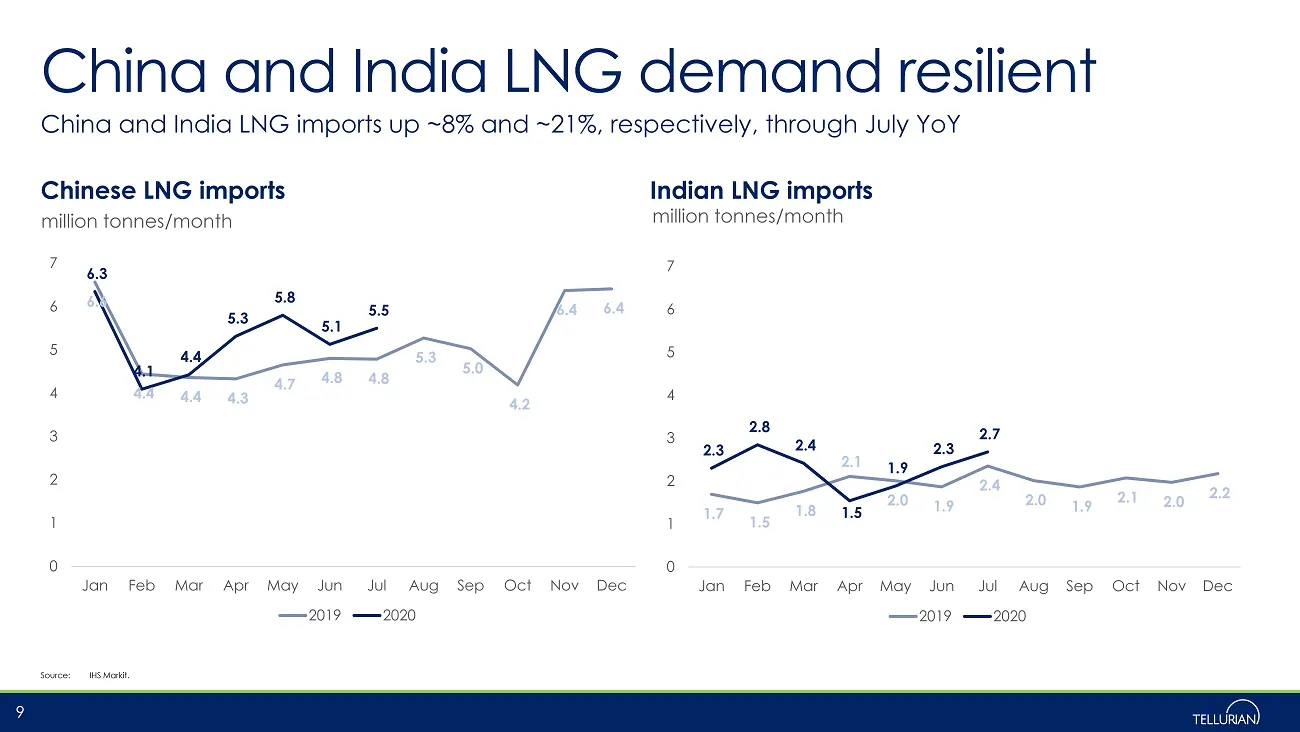
Slide 9: China and India LNG demand resilient
China and India LNG demand resilient China and India LNG imports up ~8% and ~21%, respectively, through July YoY Source: IHS Markit. 9 Chinese LNG imports Indian LNG imports million tonnes/month million tonnes/month 6.6 4.4 4.4 4.3 4.7 4.8 4.8 5.3 5.0 4.2 6.4 6.4 6.3 4.1 4.4 5.3 5.8 5.1 5.5 0 1 2 3
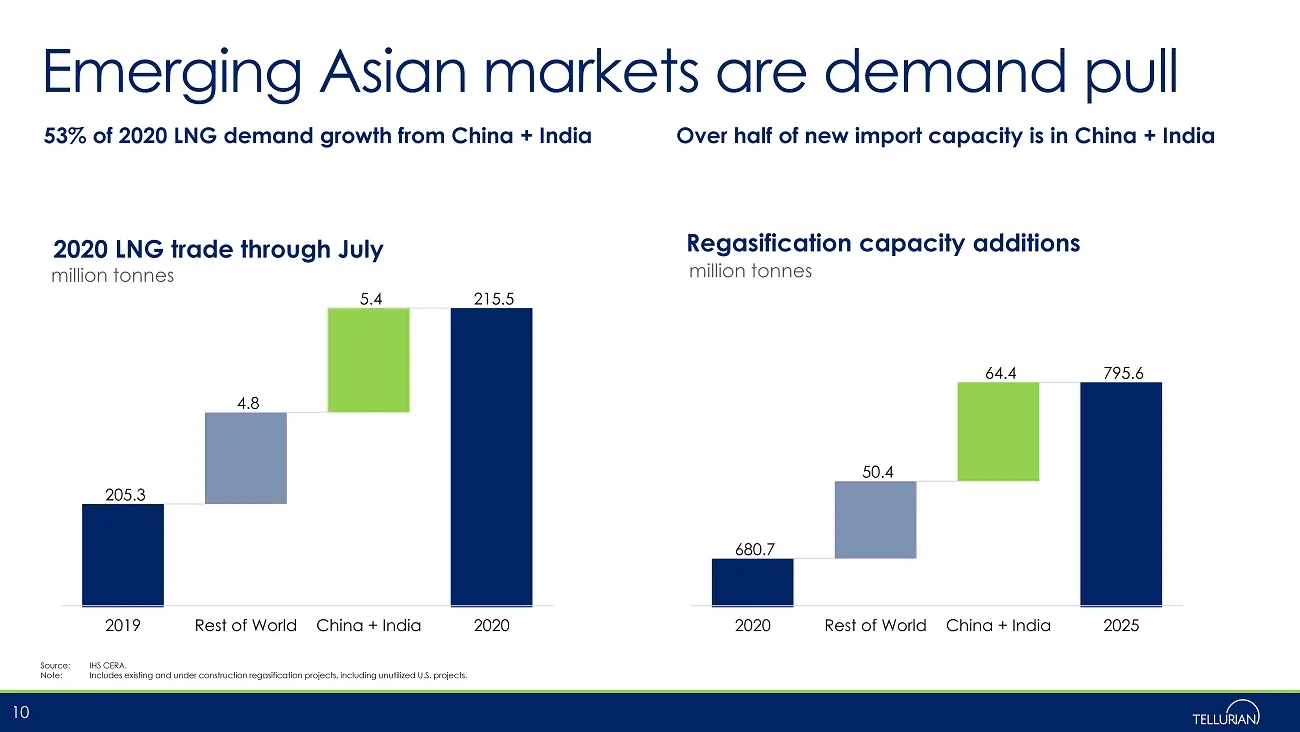
Slide 10: Emerging Asian markets are demand pull
Emerging Asian markets are demand pull Over half of new import capacity is in China + India Source: IHS CERA. Note: Includes existing and under construction regasification projects, including unutilized U.S. projects. 10 2020 LNG trade through July million tonnes million tonnes Regasification capaci
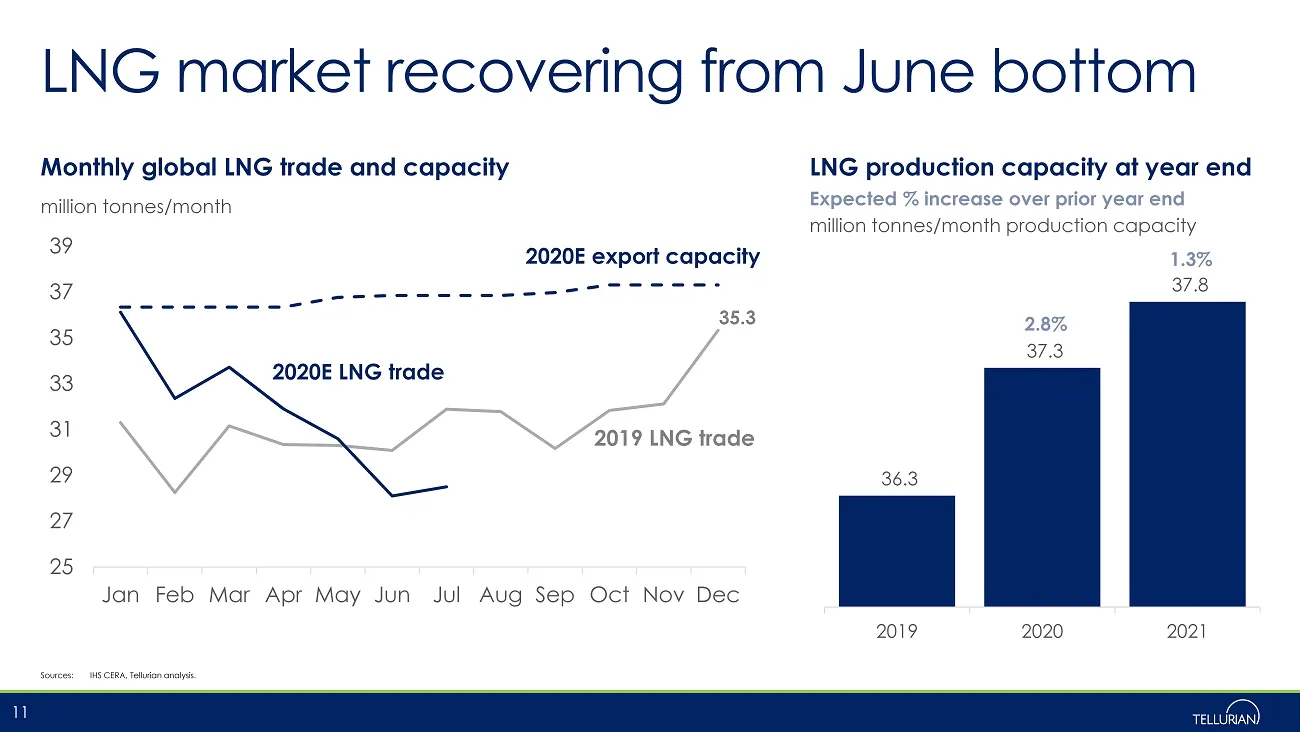
Slide 11: LNG market recovering from June bottom
LNG market recovering from June bottom Sources: IHS CERA, Tellurian analysis. 11 Monthly global LNG trade and capacity million tonnes/month 35.3 25 27 29 31 33 35 37 39 Jan Feb Mar Apr May Jun Jul Aug Sep Oct Nov Dec 2020E LNG trade LNG production capacity at year end Expected % increase over prior
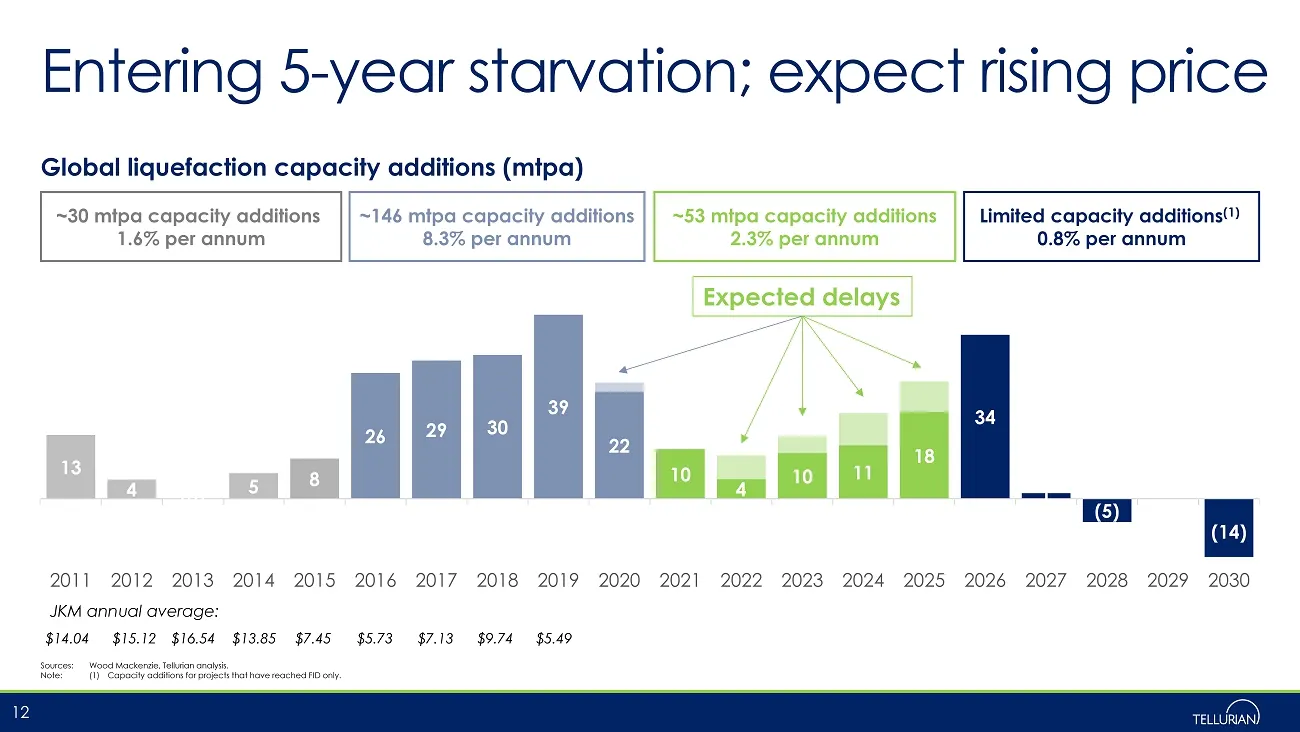
Slide 12: Entering year starvation; expect rising price
Entering 5 - year starvation; expect rising price Sources: Wood Mackenzie, Tellurian analysis. Note: (1) Capacity additions for projects that have reached FID only. 12 13 4 (0) 5 8 26 29 30 39 22 10 4 10 11 18 34 1 (5) -- (14) 2011 2012 2013 2014 2015 2016 2017 2018 2019 2020 2021 2022 2023 2024 202
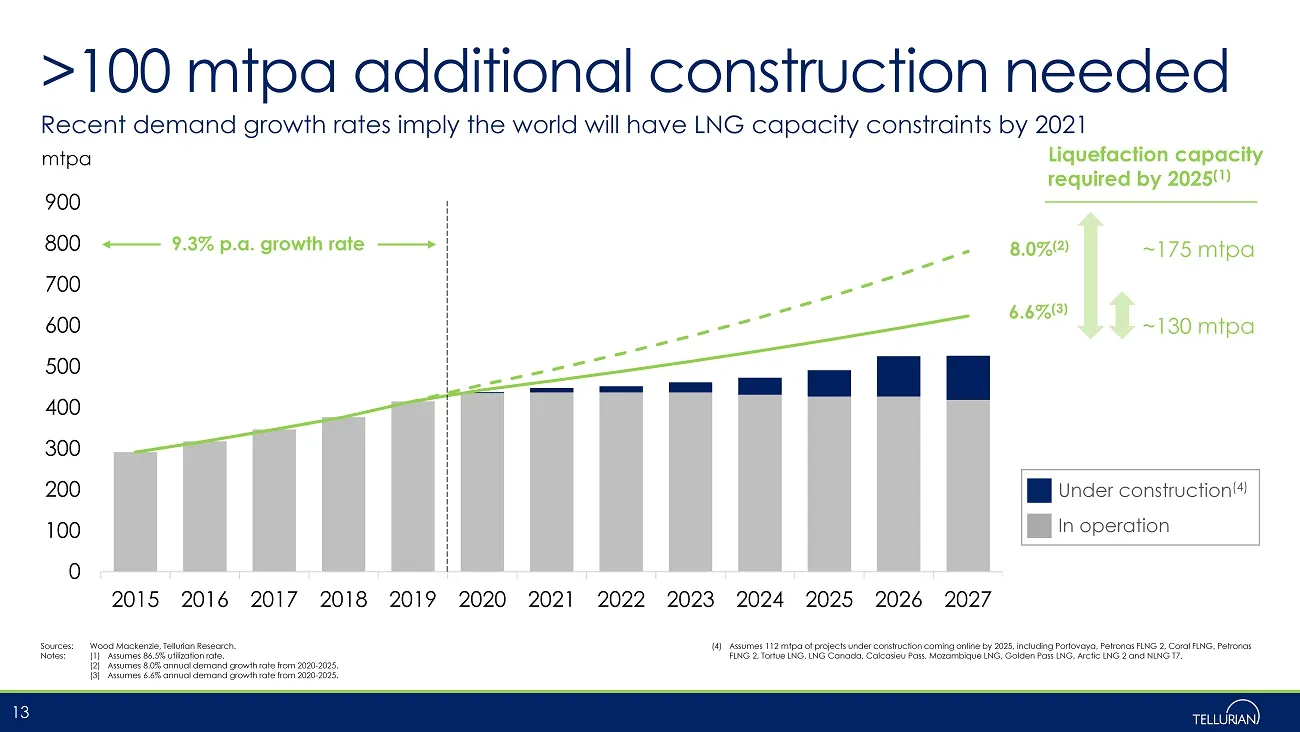
Slide 13: >100 mtpa additional construction needed
>100 mtpa additional construction needed Recent demand growth rates imply the world will have LNG capacity constraints by 2021 Sources: Wood Mackenzie, Tellurian Research. Notes: (1) Assumes 86.5% utilization rate. (2) Assumes 8.0% annual demand growth rate from 2020 - 2025. (3) Assumes 6.6% annual
Slide 14: Driftwood LNG overview
Driftwood LNG overview 14
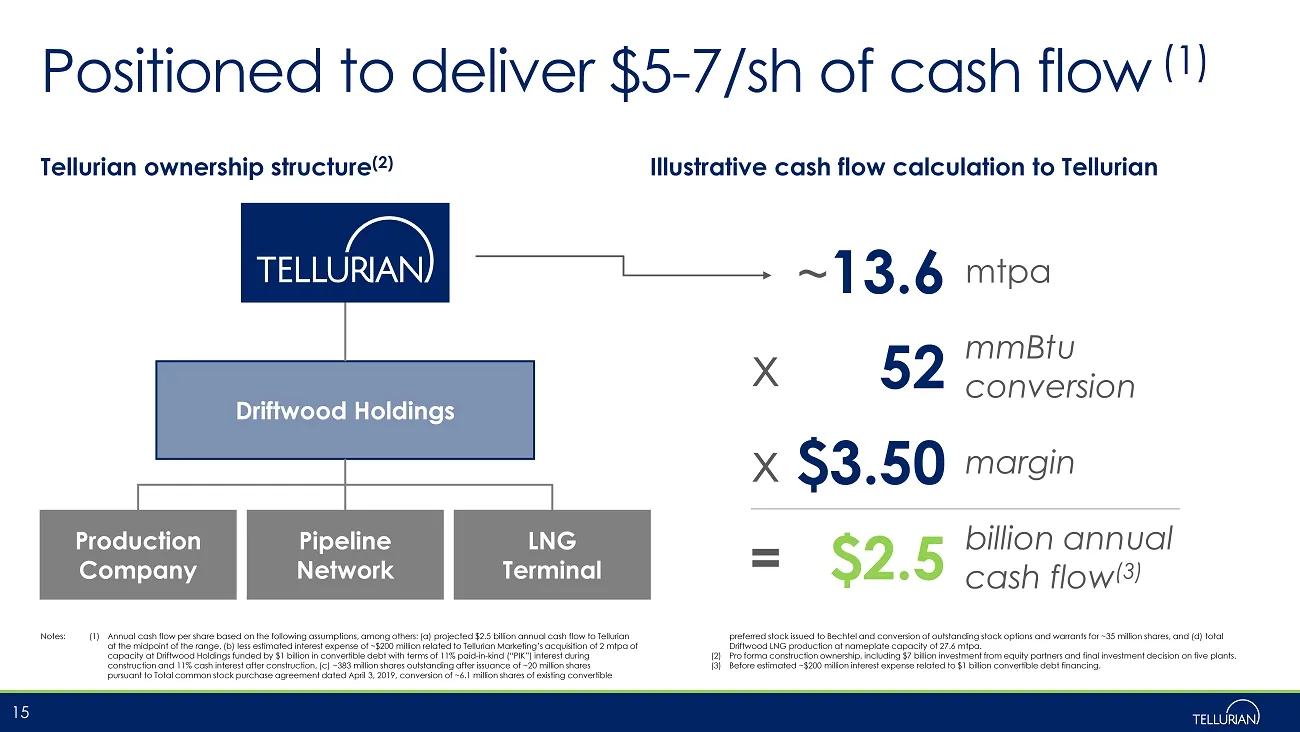
Slide 15: Illustrative cash flow calculation to Tellurian
~ 13.6 mtpa x 52 mmBtu conversion x $3.50 margin = $2.5 billion annual cash flow (3) Tellurian ownership structure (2) Illustrative cash flow calculation to Tellurian Notes: (1) Annual cash flow per share based on the following assumptions, among others: (a) projected $2.5 billion annual cash flow t
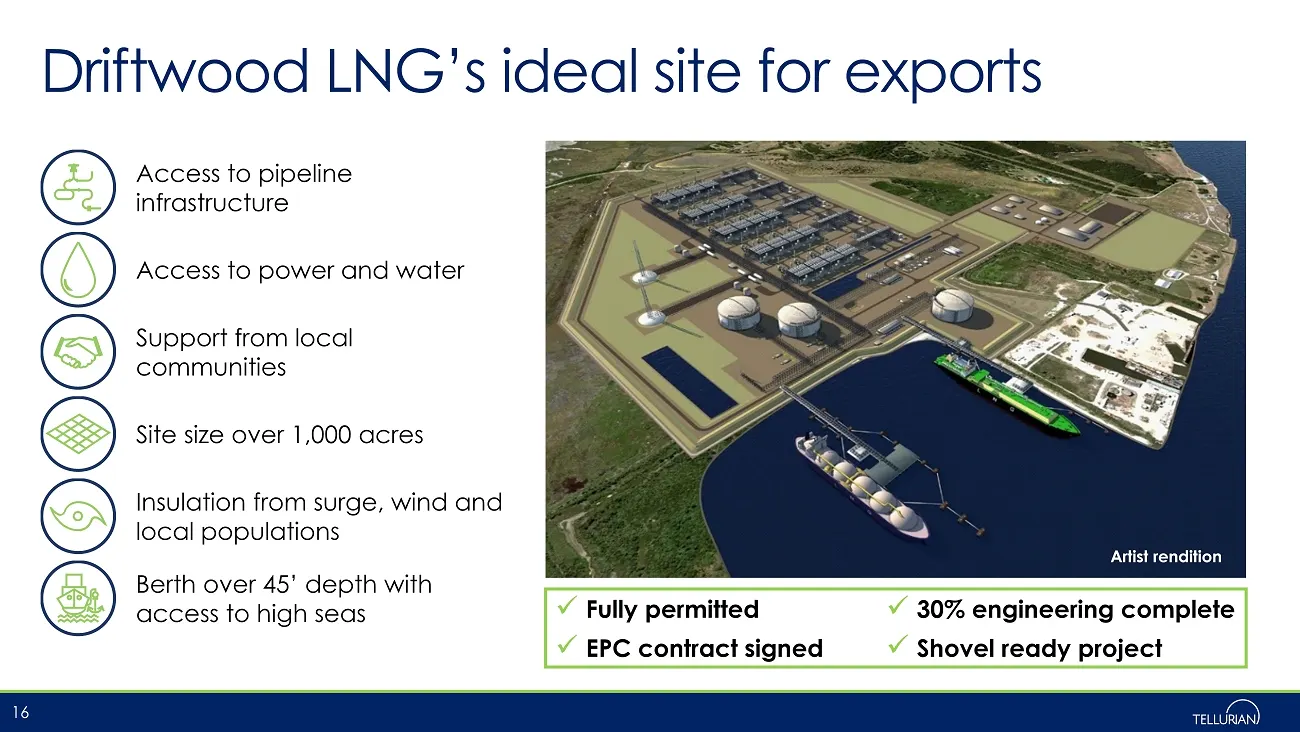
Slide 16: Driftwood LNG's ideal site for exports
Driftwood LNG’s ideal site for exports 16 Access to power and water Berth over 45’ depth with access to high seas Support from local communities Access to pipeline infrastructure Site size over 1,000 acres Insulation from surge, wind and local populations Artist rendition x Fully permitted x 30% eng
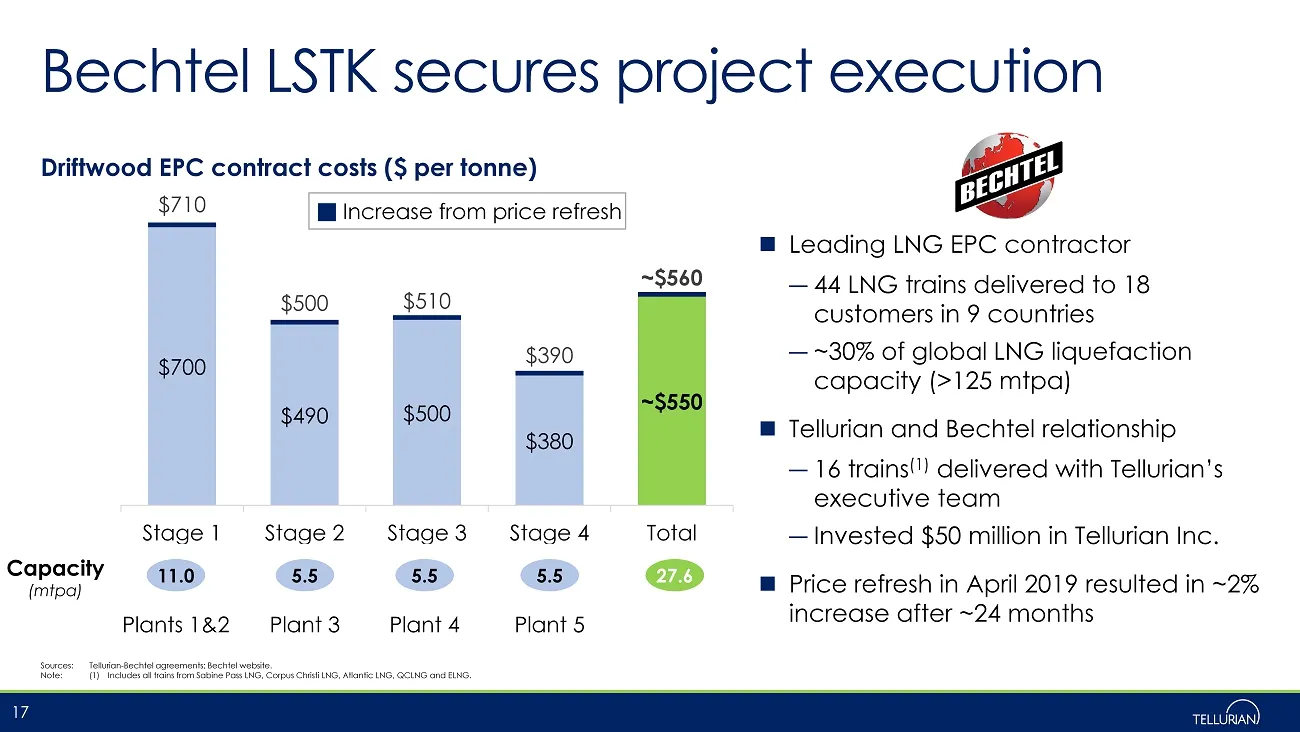
Slide 17: Bechtel LSTK secures project execution
$700 $490 $500 $380 ~$550 $710 $500 $510 $390 ~ $560 Stage 1 Stage 2 Stage 3 Stage 4 Total Bechtel LSTK secures project execution Leading LNG EPC contractor ― 44 LNG trains delivered to 18 customers in 9 countries ― ~30% of global LNG liquefaction capacity (>125 mtpa) Tellurian and Bechtel relations
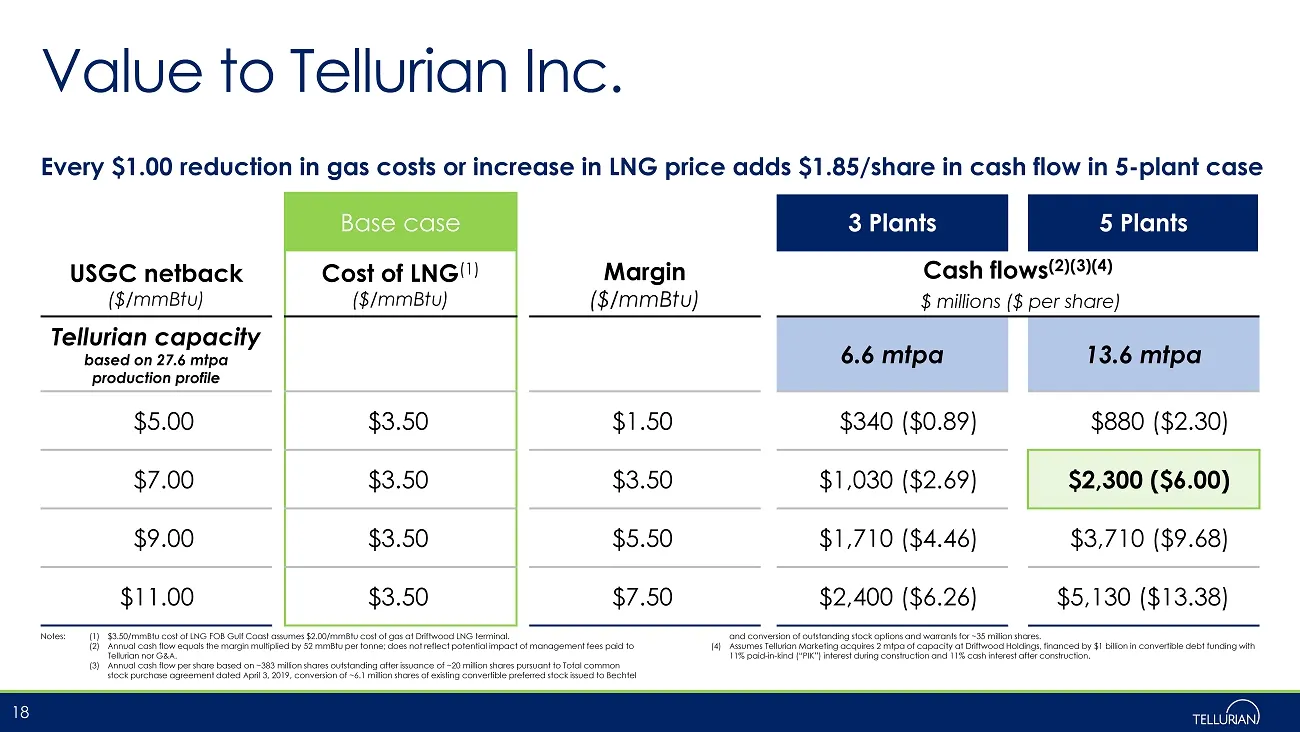
Slide 18: Value to Tellurian Inc. base case cash flows
Base case 3 Plants 5 Plants USGC netback ($/mmBtu) Cost of LNG (1) ($/mmBtu) Margin ($/mmBtu) Cash flows (2)(3)(4) $ millions ($ per share) Tellurian capacity based on 27.6 mtpa production profile 6.6 mtpa 13.6 mtpa $5.00 $3.50 $1.50 $340 ($0.89) $880 ($2.30) $7.00 $3.50 $3.50 $1,030 ($2.69) $2,300
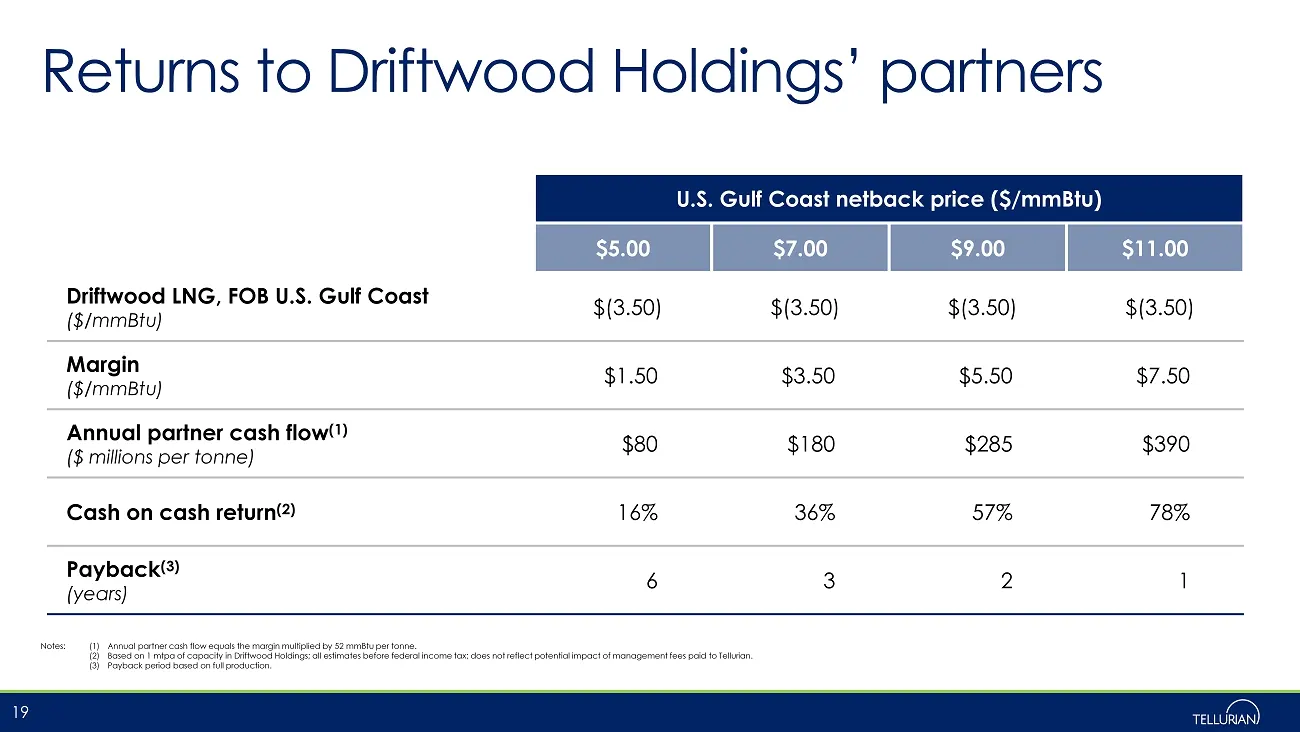
Slide 19: Returns to Driftwood Holdings' partners
U.S. Gulf Coast netback price ($/mmBtu) $5.00 $7.00 $9.00 $11.00 Driftwood LNG, FOB U.S. Gulf Coast ($/mmBtu) $(3.50) $(3.50) $(3.50) $(3.50) Margin ($/mmBtu) $1.50 $3.50 $5.50 $7.50 Annual partner cash flow (1) ($ millions per tonne) $80 $180 $285 $390 Cash on cash return (2) 16% 36% 57% 78% Paybac
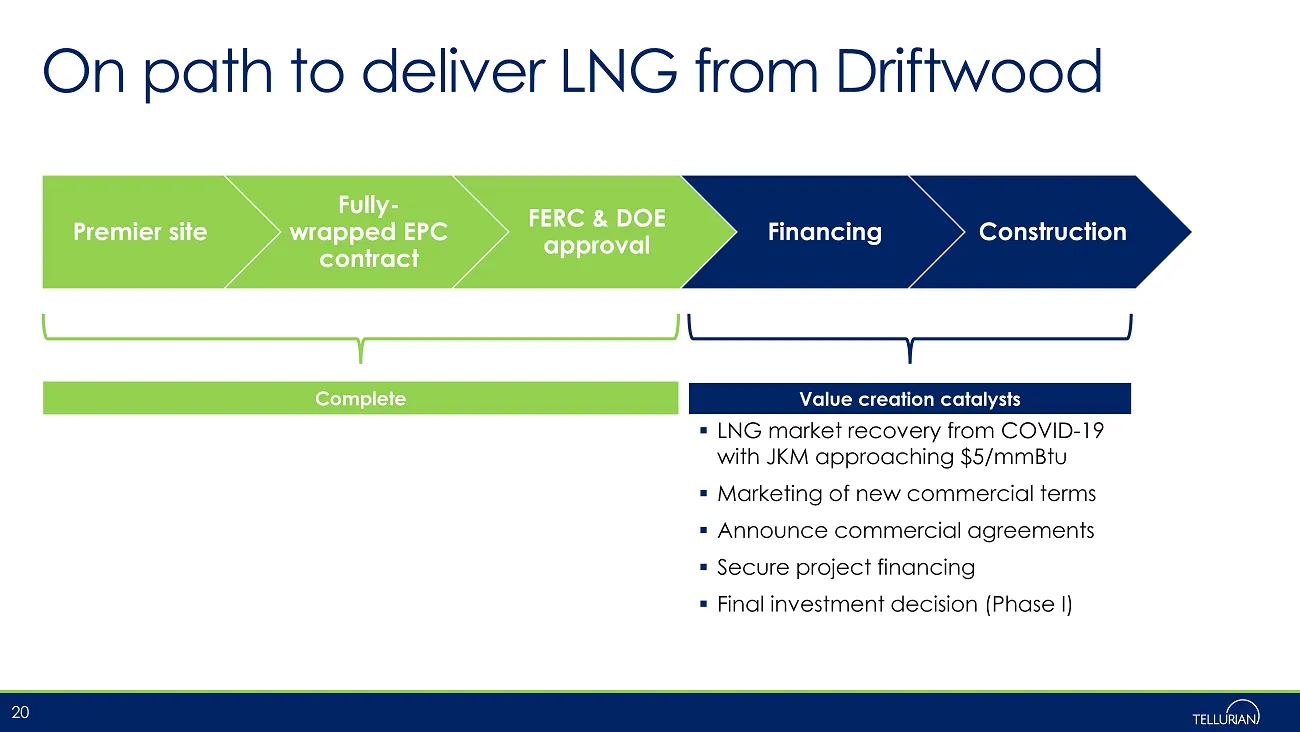
Slide 20: On path to deliver LNG from Driftwood
Premier site Fully - wrapped EPC contract FERC & DOE approval Financing Construction On path to deliver LNG from Driftwood 20 Value creation catalysts ▪ LNG market recovery from COVID - 19 with JKM approaching $5/mmBtu ▪ Marketing of new commercial terms ▪ Announce commercial agreements ▪ Secure pro
Slide 21: Key investment highlights
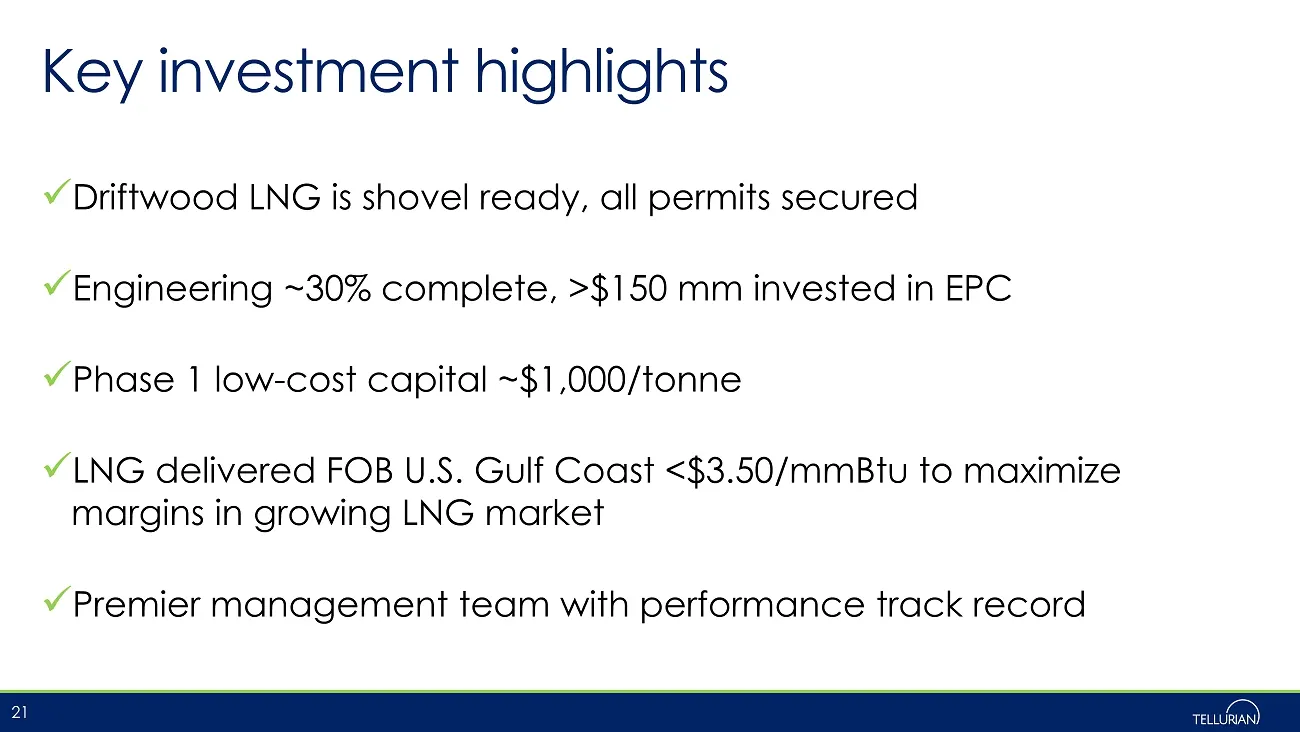
Key investment highlights x Driftwood LNG is shovel ready, all permits secured x Engineering ~30% complete, >$150 mm invested in EPC x Phase 1 low - cost capital ~$1,000/tonne x LNG delivered FOB U.S. Gulf Coast <$3.50/mmBtu to maximize margins in growing LNG market x Premier management team with pe

Slide 22: Contact us
Social media Contact us ▪ Matt Phillips Director, Investor Relations & Finance +1 832 320 9331 [email protected] ▪ Joi Lecznar SVP, Public Affairs & Communication +1 832 962 4044 [email protected] 22 @TellurianLNG

Slide 23: Appendix
Appendix 2 é 23 rewhan)
Slide 24: Total Driftwood equity investment and SPA
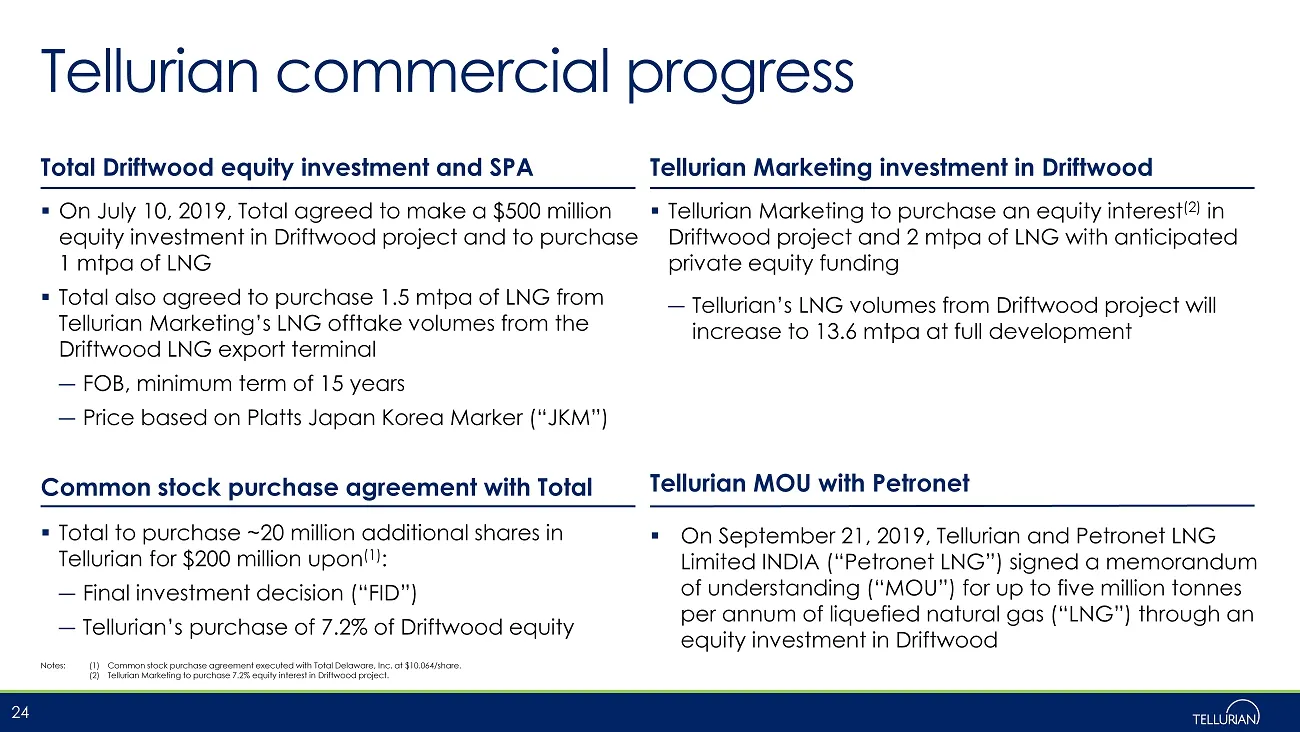
Total Driftwood equity investment and SPA Tellurian Marketing investment in Driftwood Tellurian commercial progress ▪ On July 10, 2019, Total agreed to make a $500 million equity investment in Driftwood project and to purchase 1 mtpa of LNG ▪ Total also agreed to purchase 1.5 mtpa of LNG from Tellur
Slide 25: Global energy needs require natural gas
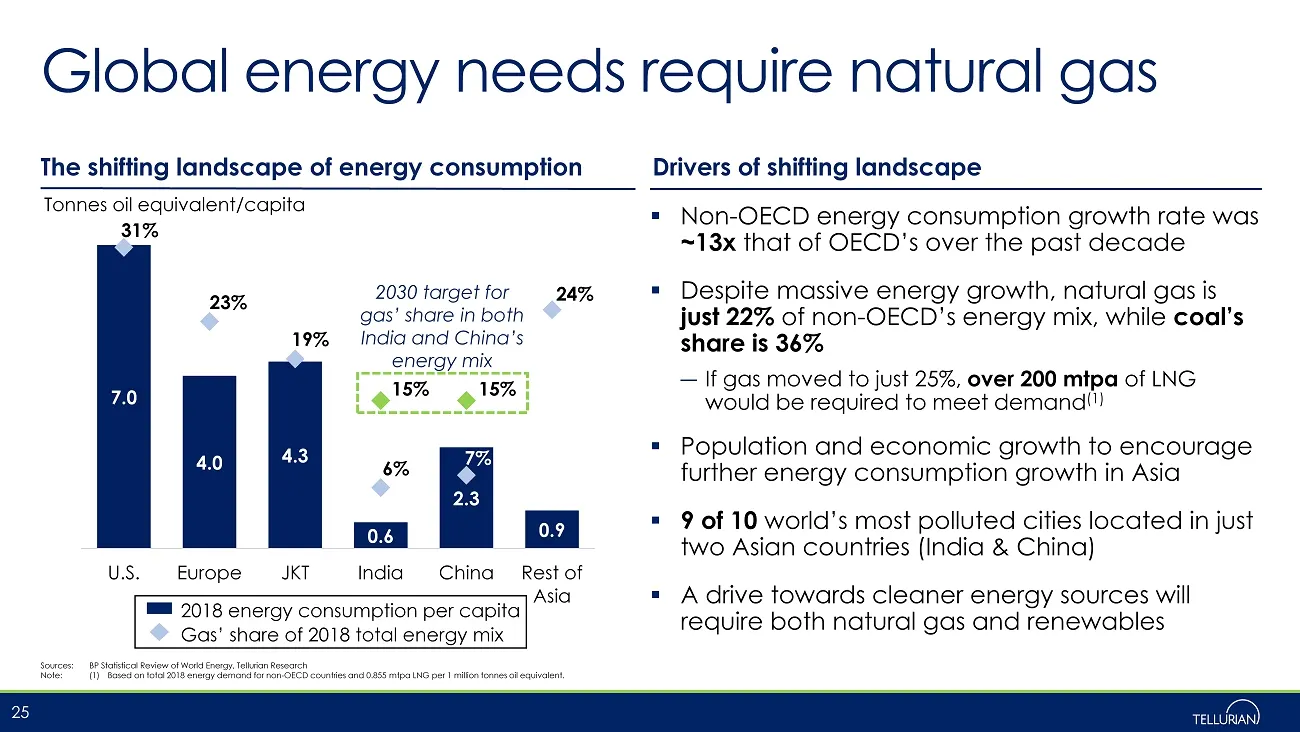
Global energy needs require natural gas Sources: BP Statistical Review of World Energy, Tellurian Research Note: (1) Based on total 2018 energy demand for non - OECD countries and 0.855 mtpa LNG per 1 million tonnes oil equivalent. 25 7.0 4.0 4.3 0.6 2.3 0.9 31% 23% 19% 6% 7% 24% 15% 15% 0% 5% 10% 1
Slide 26: China & India: ~90 mtpa growth potential
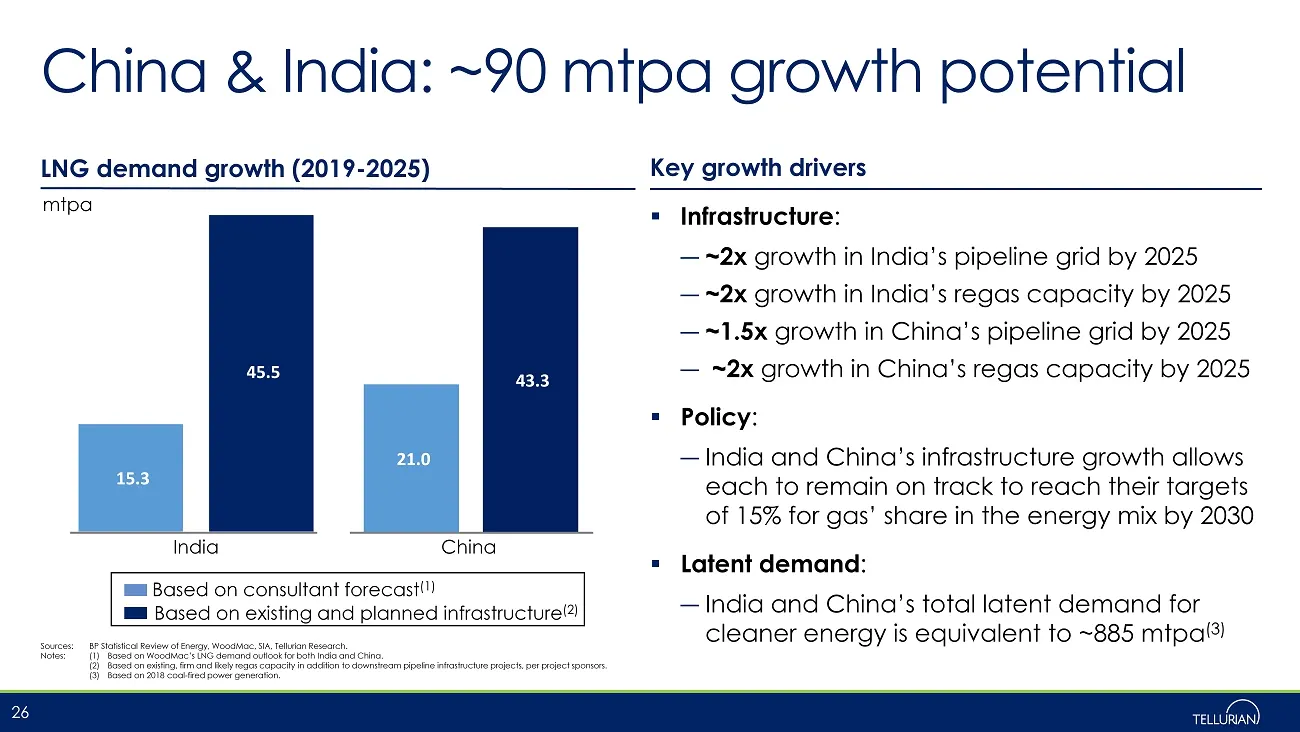
▪ Infrastructure : ― ~2x growth in India’s pipeline grid by 2025 ― ~2x growth in India’s regas capacity by 2025 ― ~1.5x growth in China’s pipeline grid by 2025 ― ~2x growth in China’s regas capacity by 2025 ▪ Policy : ― India and China’s infrastructure growth allows each to remain on track to reach
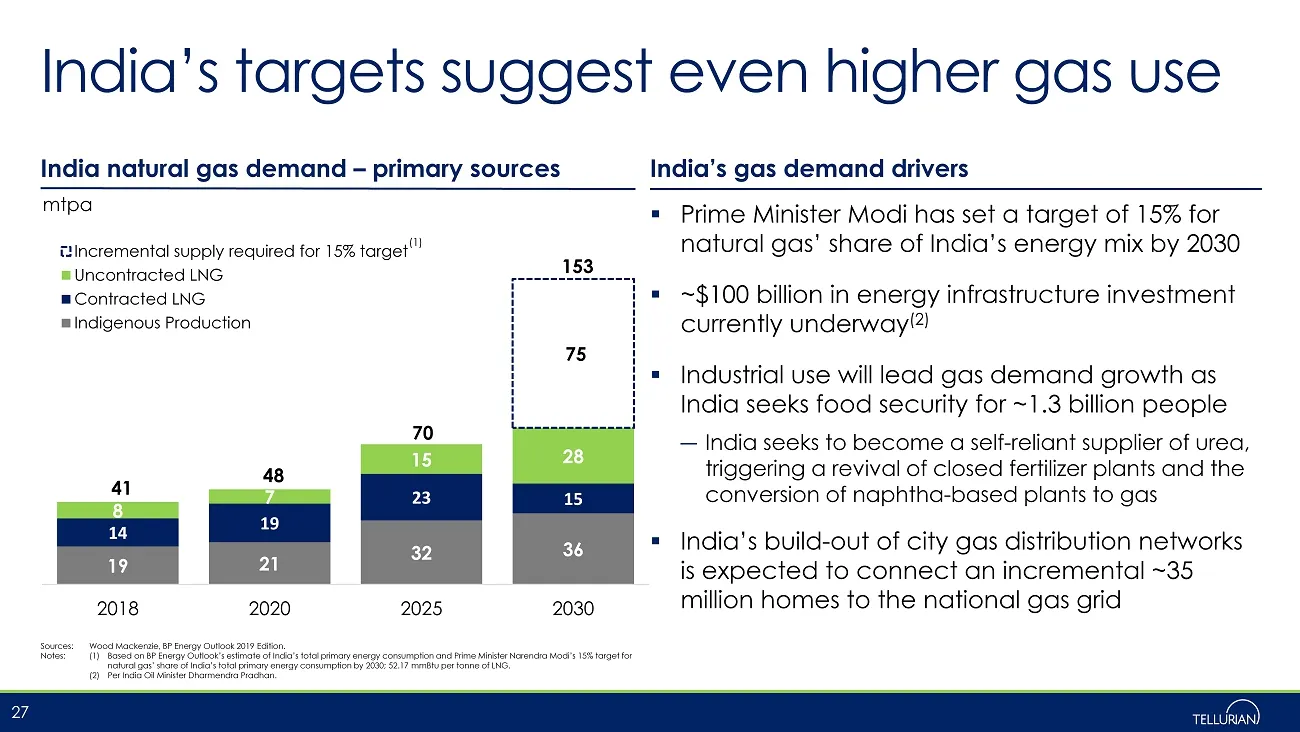
Slide 27: India's targets suggest even higher gas use
19 21 32 36 14 19 23 15 8 7 15 28 75 41 48 70 153 2018 2020 2025 2030 Incremental supply required for 15% target Uncontracted LNG Contracted LNG Indigenous Production India’s targets suggest even higher gas use ▪ Prime Minister Modi has set a target of 15% for natural gas’ share of India’s energy mi
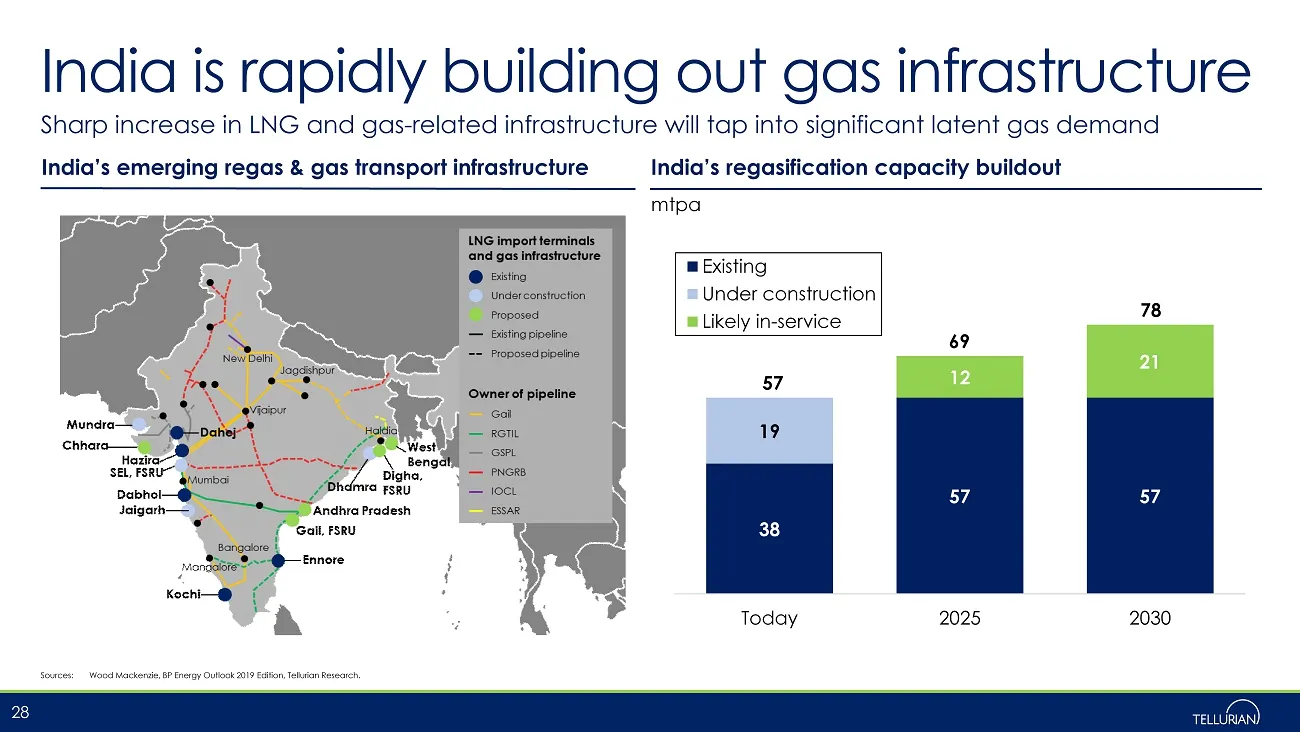
Slide 28: India is rapidly building out gas infrastructure
India is rapidly building out gas infrastructure Sharp increase in LNG and gas - related infrastructure will tap into significant latent gas demand Sources: Wood Mackenzie, BP Energy Outlook 2019 Edition, Tellurian Research. 28 India’s emerging regas & gas transport infrastructure India’s regasifica
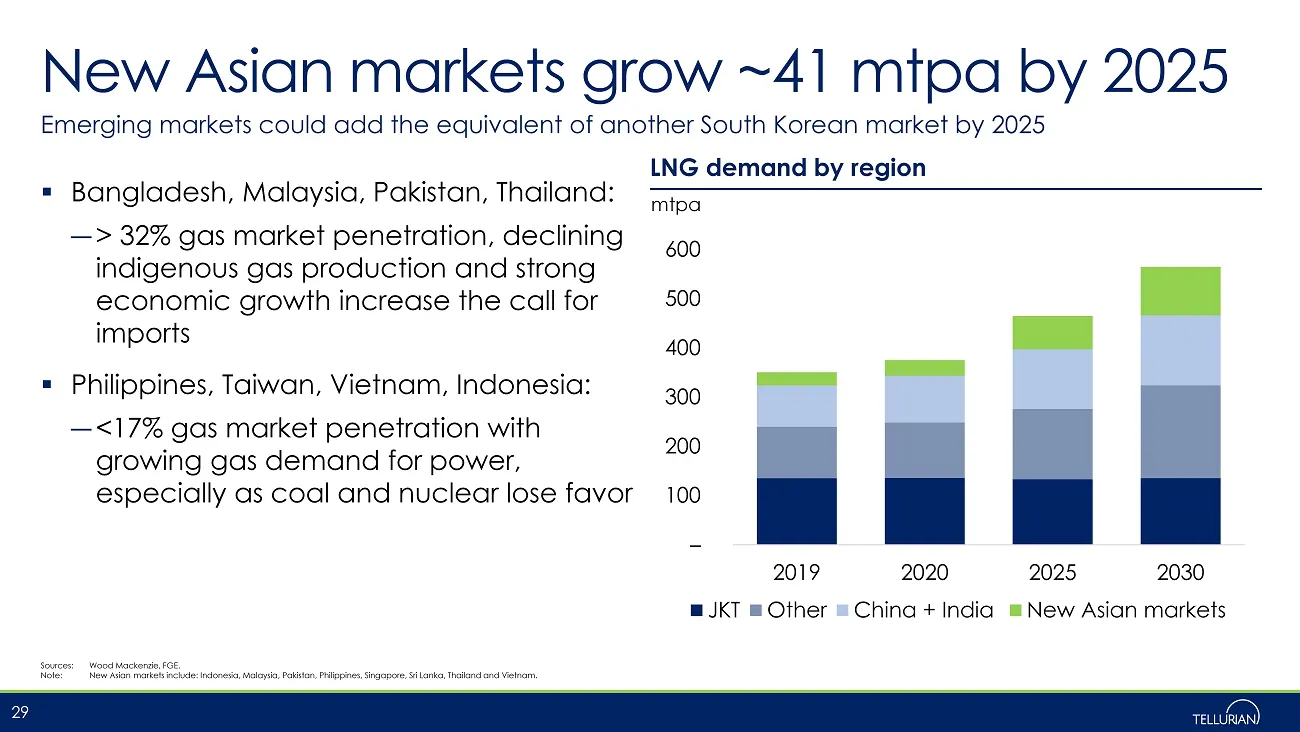
Slide 29: New Asian markets grow ~41 mtpa by 2025
New Asian markets grow ~41 mtpa by 2025 Emerging markets could add the equivalent of another South Korean market by 2025 ▪ Bangladesh, Malaysia, Pakistan, Thailand: ― > 32% gas market penetration, declining indigenous gas production and strong economic growth increase the call for imports ▪ Philippi
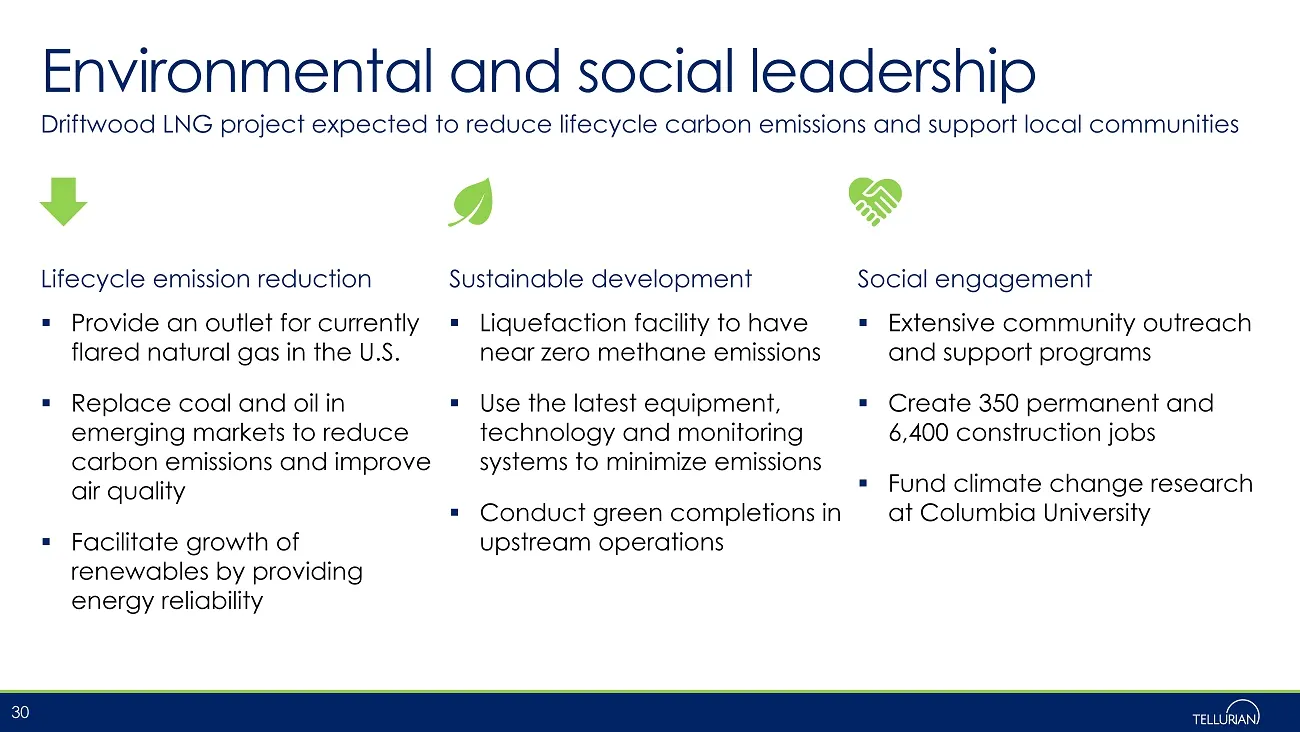
Slide 30: Environmental and social leadership
Environmental and social leadership ▪ Provide an outlet for currently flared natural gas in the U.S. ▪ Replace coal and oil in emerging markets to reduce carbon emissions and improve air quality ▪ Facilitate growth of renewables by providing energy reliability Driftwood LNG project expected to reduc
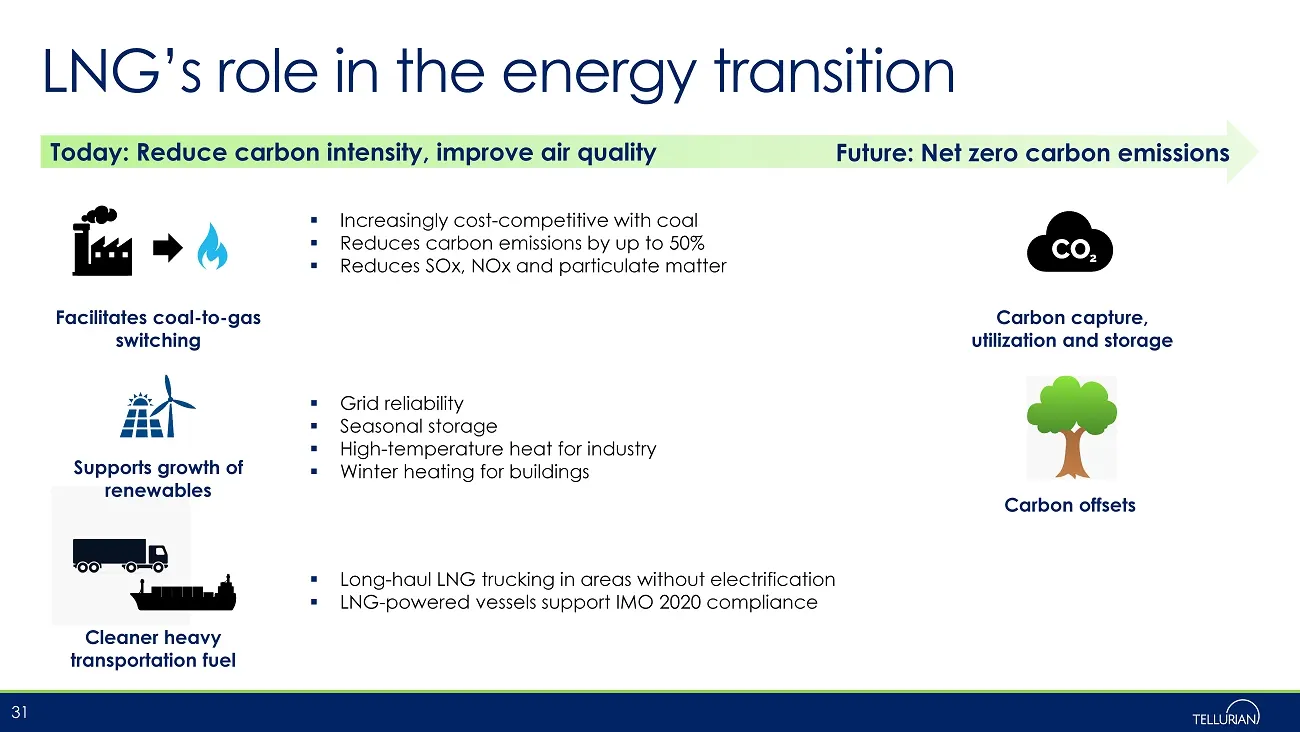
Slide 31: LNG's role in the energy transition
LNG’s role in the energy transition 31 Today: Reduce carbon intensity, improve air quality Future: Net zero carbon emissions Carbon capture, utilization and storage Carbon offsets Facilitates coal - to - gas switching Supports growth of renewables ▪ Increasingly cost - competitive with coal ▪ Reduce
Source: SEC EDGAR · 8-K filed Aug 12, 2020
More decks from Tellurian Inc
 Merger or Acquisition (July 2024)27 slides · Jul 22, 2024
 Investor Presentation (March 2024)16 slides · Mar 4, 2024
 Investor Presentation (August 2023)20 slides · Aug 7, 2023
 Investor Presentation (May 2023)20 slides · May 3, 2023
 Investor Presentation (February 2023)21 slides · Feb 22, 2023
 Investor Presentation (November 2022)19 slides · Nov 2, 2022