Aspen Insurance Holdings Ltd · NYSE:AHL/PE
Aspen Insurance — Q3 2009 Earnings Presentation
16 slides from Aspen Insurance's earnings presentation, Oct 28, 2009

Slide 1: Q3 2009 Earnings Conference Call
Aspen Insurance Holdings Limited October 29, 2009 Q3 2009 Earnings Conference Call AHL: NYSE
Slide 2: Safe Harbor Disclosure
Safe Harbor Disclosure This slide presentation is for information purposes only. It should be read in conjunction with our financial supplement posted on our website on the Investor Relations page and with other documents filed or to be filed shortly by Aspen Insurance Holdings Limited (the "Company
Slide 3: Financial Highlights: Q3 2009
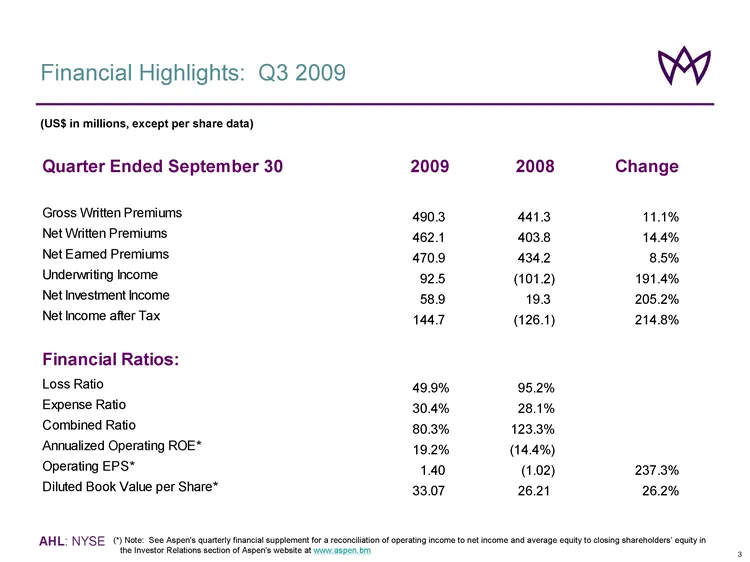
AHL : NYSE Financial Highlights: Q3 2009 3 (US$ in millions, except per share data) (*) Note: See Aspen’s quarterly financial supplement for a reconciliation of operating income to net income and average equity to closing shareholders’ equity in the Investor Relations section of Aspen’s website at w
Slide 4: Financial Highlights: Q3 2009 YTD
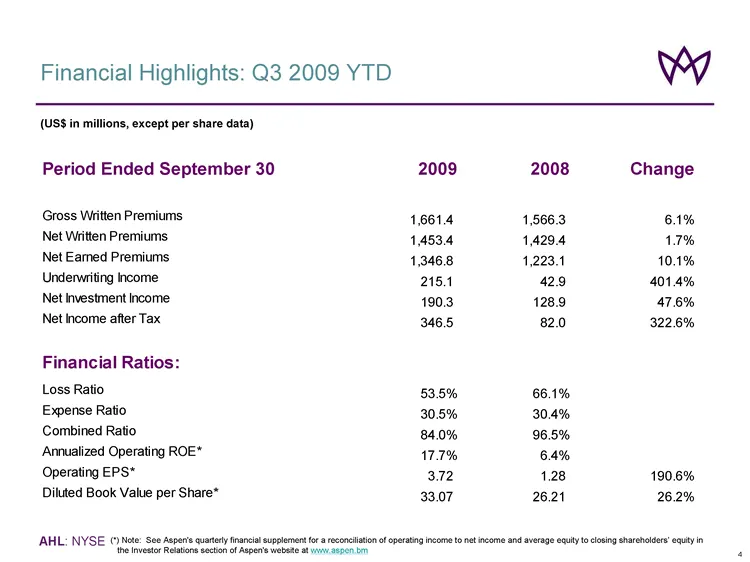
AHL : NYSE Financial Highlights: Q3 2009 YTD Period Ended September 30 2009 2008 Change Gross Written Premiums 1,661.4 1,566.3 6.1% Net Written Premiums 1,453.4 1,429.4 1.7% Net Earned Premiums 1,346.8 1,223.1 10.1% Underwriting Income 215.1 4 2.9 401.4% Net Investment Income 190.3 128.9 47.6% Net I
Slide 5: Financial Highlights: Group Summary Q3 2009
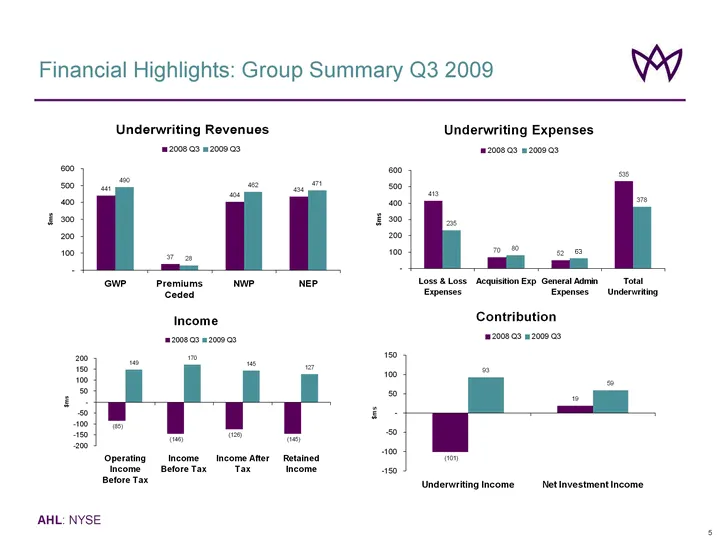
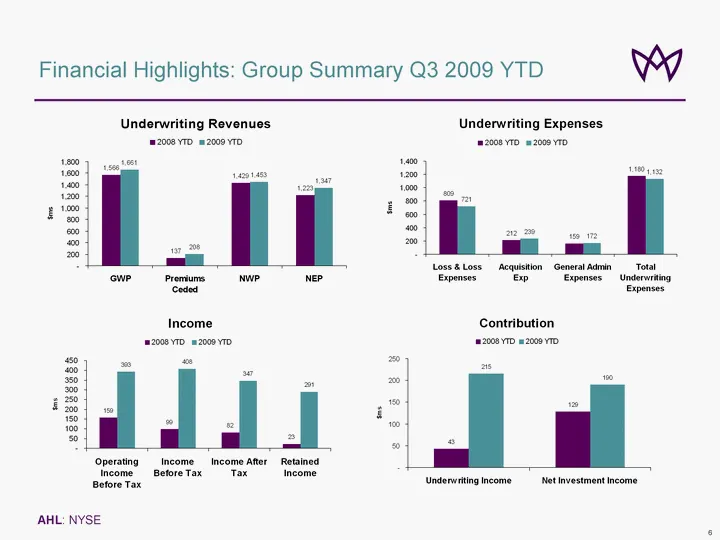
Financial Highlights: Group Summary Q3 2009 5
Slide 6: Financial Highlights: Group Summary Q3 2009 YTD
Financial Highlights: Group Summary Q3 2009 YTD 6
Slide 7: Key Performance Metrics: Q3 2009
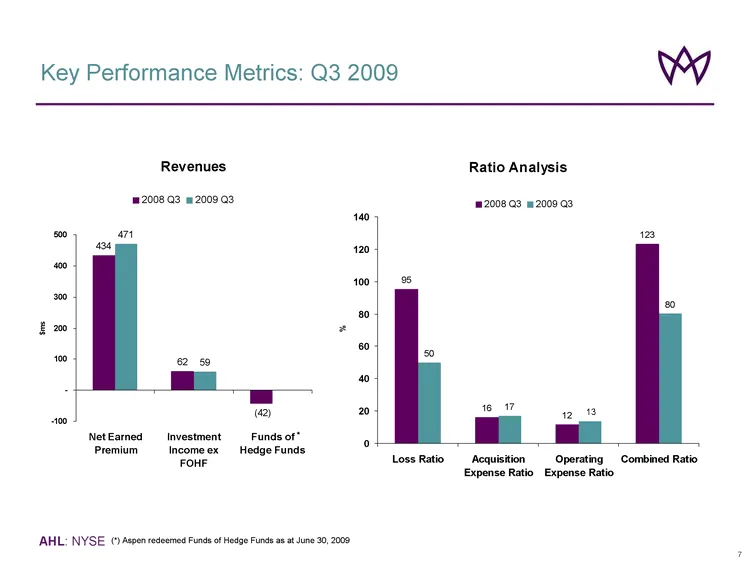
AHL : NYSE Key Performance Metrics: Q3 2009 Revenues 434 62 (42) 471 59 -100 - - 100 200 300 400 500 Net Earned Premium Investment Income ex FOHF Funds of Hedge Funds $ms 2008 Q3 2009 Q3 7 Ratio Analysis 95 16 12 123 50 17 14 80 0 20 40 60 80 100 120 140 Loss Ratio Acquisition Expense Ratio Operatin
Slide 8: Key Performance Metrics: Q3 2009 YTD
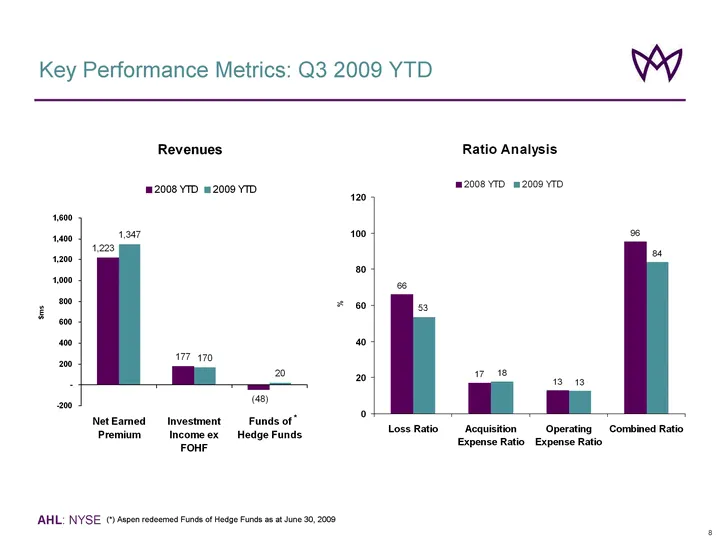
Key Performance Metrics: Q3 2009 YTD 8 * (*) Aspen redeemed Funds of Hedge Funds as at June 30, 2009
Slide 9: Results by Business Segment: Q3 2009
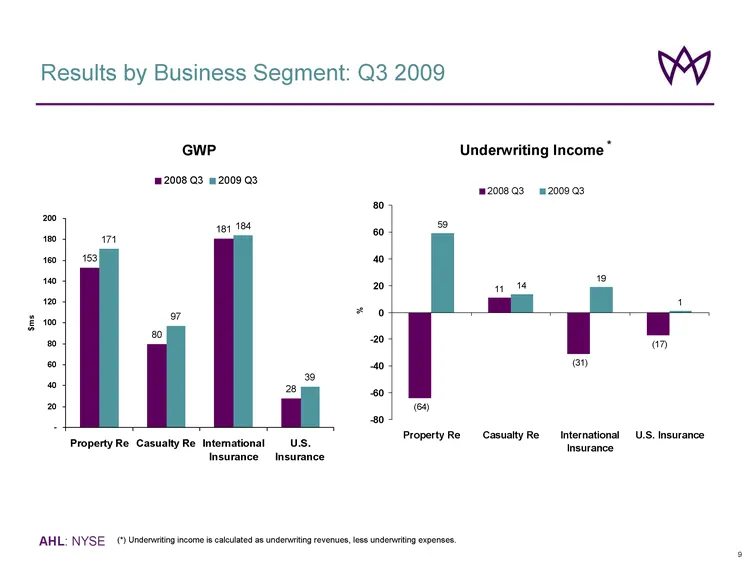
AHL : NYSE Results by Business Segment: Q3 2009 9 (*) Underwriting income is calculated as underwriting revenues, less underwriting expenses. GWP 153 80 181 28 171 97 184 39 - - 20 40 60 80 100 120 140 160 180 200 Property Re Casualty Re International Insurance U.S. Insurance $ms 2008 Q3 2009 Q3 Und
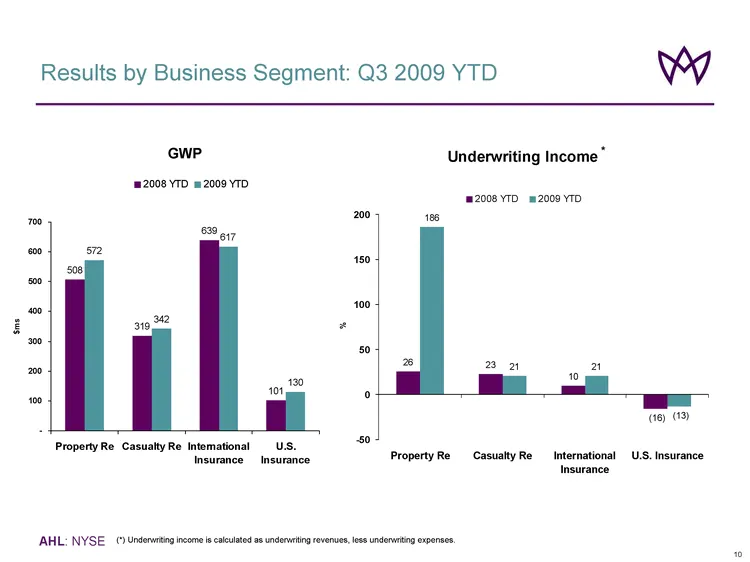
Slide 10: Results by Business Segment: Q3 2009 YTD
AHL : NYSE Results by Business Segment: Q3 2009 YTD GWP 508 319 639 101 572 342 617 130 - - 100 200 300 400 500 600 700 Property Re Casualty Re International Insurance U.S. Insurance $ms 2008 YTD 2009 YTD 10 (*) Underwriting income is calculated as underwriting revenues, less underwriting expenses.
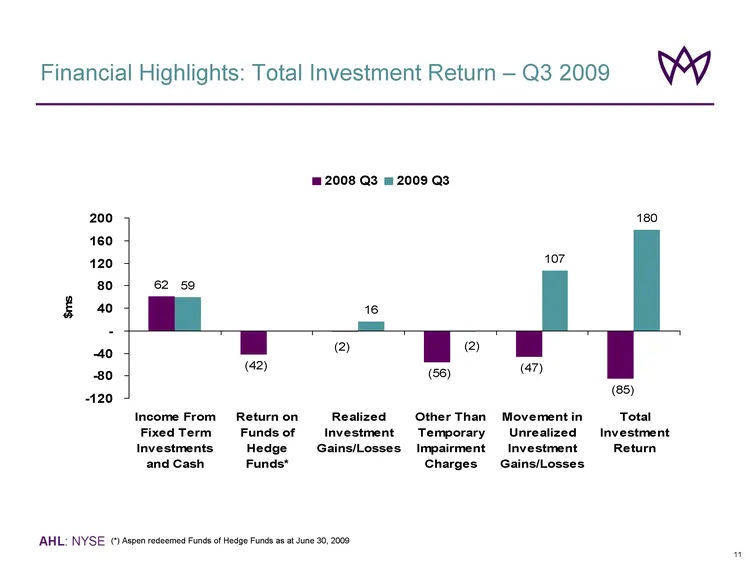
Slide 11: Financial Highlights: Total Investment Return — Q3 2009
AHL : NYSE Financial Highlights: Total Investment Return — Q3 2009 11 62 (42) (56) (47) (85) 59 16 107 180 (2) (2) -120 - -80 - -40 - - 40 80 120 160 200 Income From Fixed Term Investments and Cash Return on Funds of Hedge Funds* Realized Investment Gains/Losses Other Than Temporary Impairment Charg
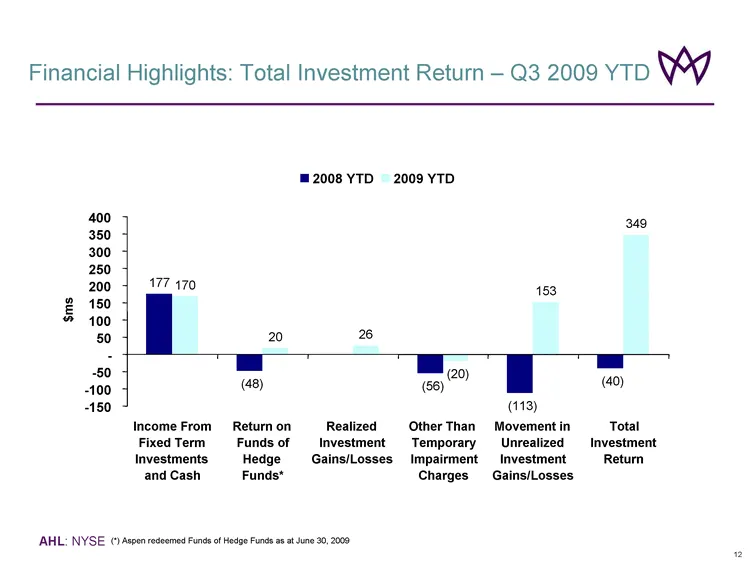
Slide 12: Financial Highlights: Total Investment Return — Q3 2009 YTD
AHL : NYSE Financial Highlights: Total Investment Return — Q3 2009 YTD 12 177 (48) (56) (113) (40) 170 20 26 (20) 153 349 (1) -150 - -100 - -50 - - 50 100 150 200 250 300 350 400 Income From Fixed Term Investments and Cash Return on Funds of Hedge Funds* Realized Investment Gains/Losses Other Than T
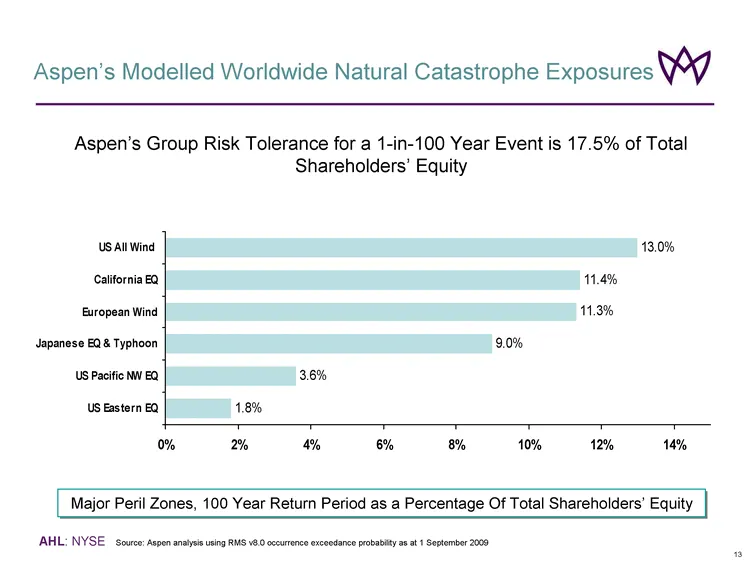
Slide 13: Aspen's Modelled Worldwide Natural Catastrophe Exposures
AHL : NYSE Aspen’s Modelled Worldwide Natural Catastrophe Exposures Source: Aspen analysis using RMS v8.0 occurrence exceedance probability as at 1 September 2009 Major Peril Zones, 100 Year Return Period as a Percentage Of Total Shareholders’ Major Peril Zones, 100 Year Return Period as a Percentag
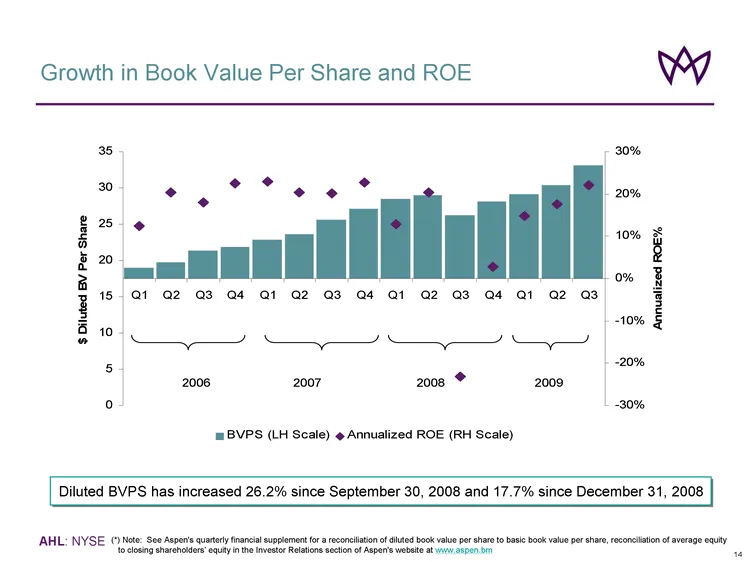
Slide 14: Growth in Book Value Per Share and ROE
AHL : NYSE Growth in Book Value Per Share and ROE (*) Note: See Aspen’s quarterly financial supplement for a reconciliation of diluted book value per share to basic book value per share, reconciliation of average equity to closing shareholders’ equity in the Investor Relations section of Aspen’s web
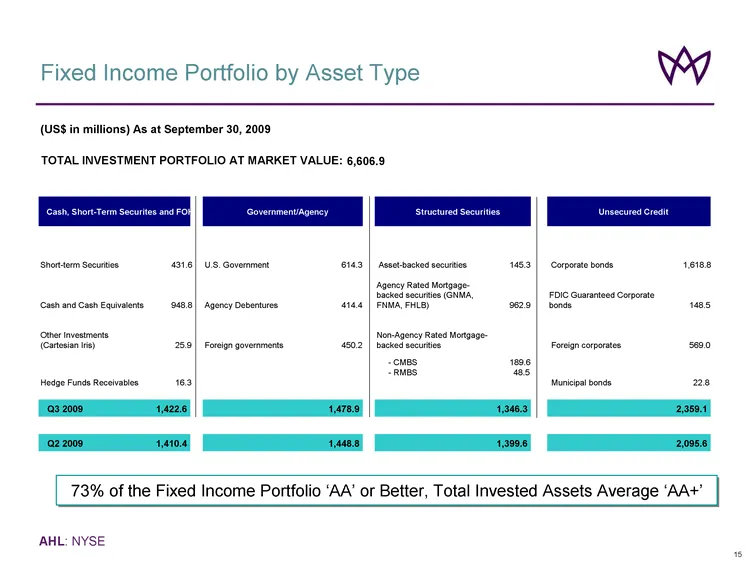
Slide 15: Fixed Income Portfolio by Asset Type
AHL : NYSE Fixed Income Portfolio by Asset Type (US$ in millions) As at September 30, 2009 15 73% of the Fixed Income Portfolio ‘AA’ 73% of the Fixed Income Portfolio ‘AA’ oorr BBeetttteerr,, TToottaall IInnvveesstteedd AAsssseettss AAvveerraaggee ''AAAA++’’ TOTAL INVESTMENT PORTFOLIO AT MARKET VALU
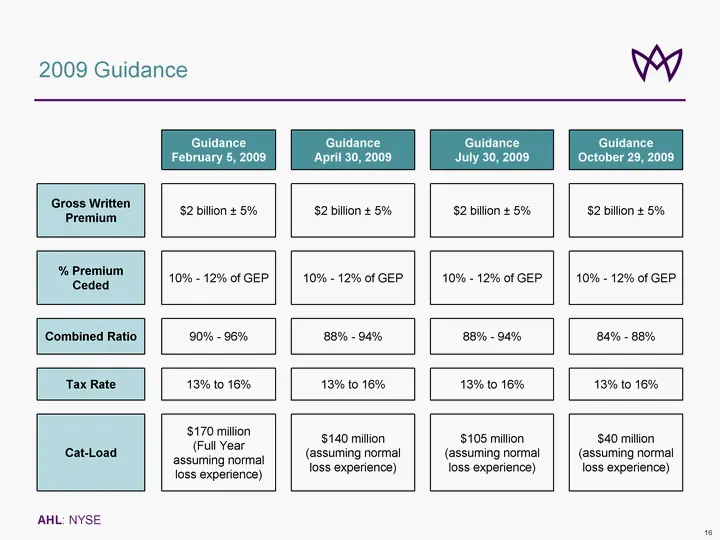
Slide 16: 2009 Guidance
2009 Guidance 16 Guidance February 5, 2009 Guidance April 30, 2009 Guidance July 30, 2009 Guidance October 29, 2009 Gross Written Premium $2 billion +- 5% $2 billion +- 5% $2 billion +- 5% $2 billion +- 5% % Premium Ceded 10% - 12% of GEP 10% - 12% of GEP 10% - 12% of GEP 10% - 12% of GEP Combined R
Source: SEC EDGAR · 8-K filed Oct 28, 2009
More decks from Aspen Insurance Holdings Ltd
 Q1 2018 Earnings Presentation13 slides · May 2, 2018
 Q3 2017 Earnings Presentation20 slides · Nov 15, 2017
 Q2 2017 Earnings Presentation20 slides · Jul 26, 2017
 Q1 2017 Earnings Presentation20 slides · Apr 26, 2017
 Q4 2016 Earnings Presentation16 slides · Feb 14, 2017
 Q3 2016 Earnings Presentation16 slides · Oct 26, 2016