Spirit Airlines — Debt Investor Presentation (November 2024)
56 slides from Spirit Airlines's debt investor presentation, Nov 18, 2024
Slide 1: Cleansing Materials November 18, 2024
1 Cleansing Materials November 18, 2024
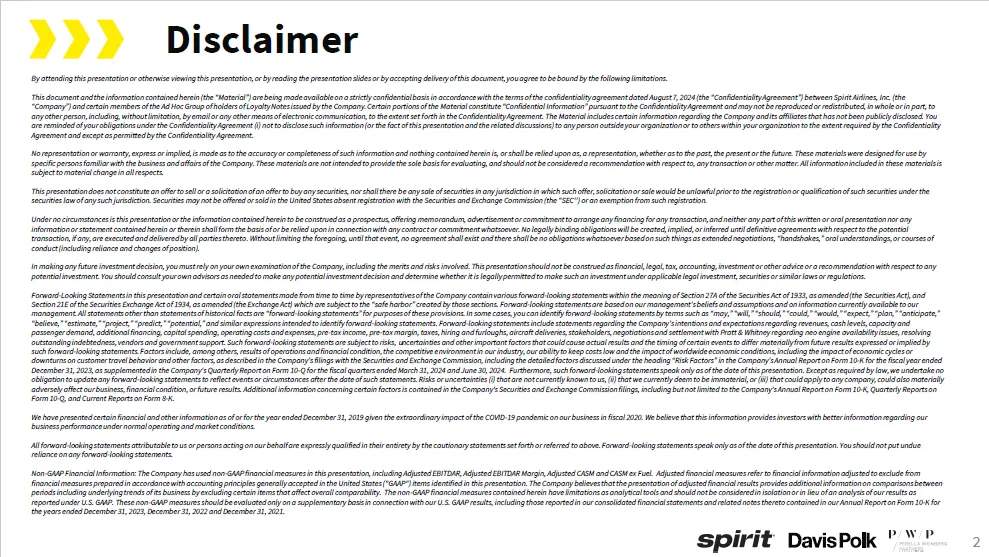
Slide 2: Disclaimer
2 Disc l aimer By attending this presentation or otherwise viewing this presentation, or by reading the presentation slides or by accepting delivery of this document, you agree to be bound by the following limitations. This document andthe information contained herein (the “Material”) are being made
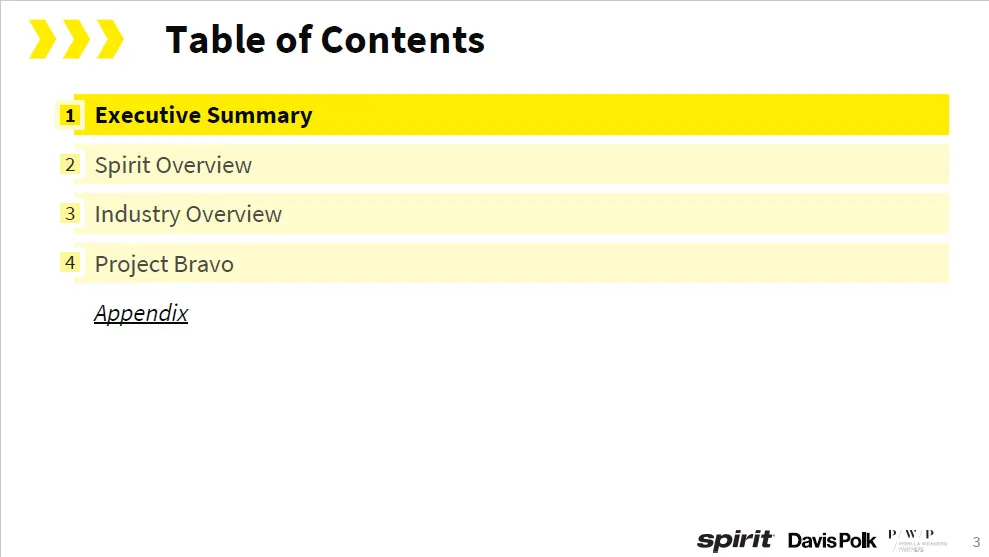
Slide 3: Table of Contents
3 Spirit Overview Industry Overview Project Bravo Appendi x 1 Executive Summary 2 3 4 Table of Contents
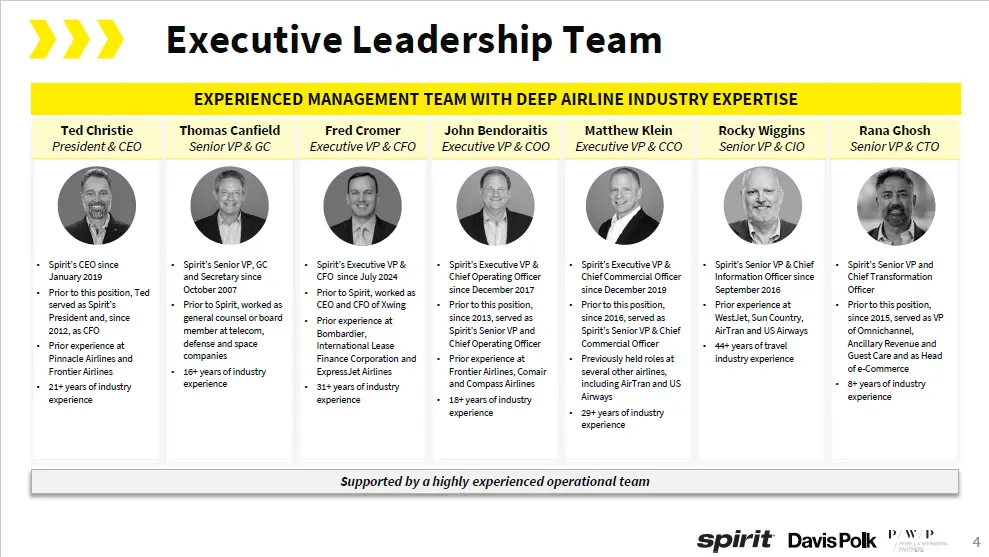
Slide 4: Executive Leadership Team
4 Executive Leadership Team EXPERIENCED MANAGEMENT TEAM WITH DEEP AIRLINE INDUSTRY EXPERTISE Rana Ghosh Senior VP & CTO Rocky Wiggins Senior VP & CIO Matthew Klein Executive VP & CCO John Bendoraitis Executive VP & COO Fred Cromer Executive VP & CFO Thomas Canfield Senior VP & GC Ted Christie Presid
Slide 5: Situation Overview
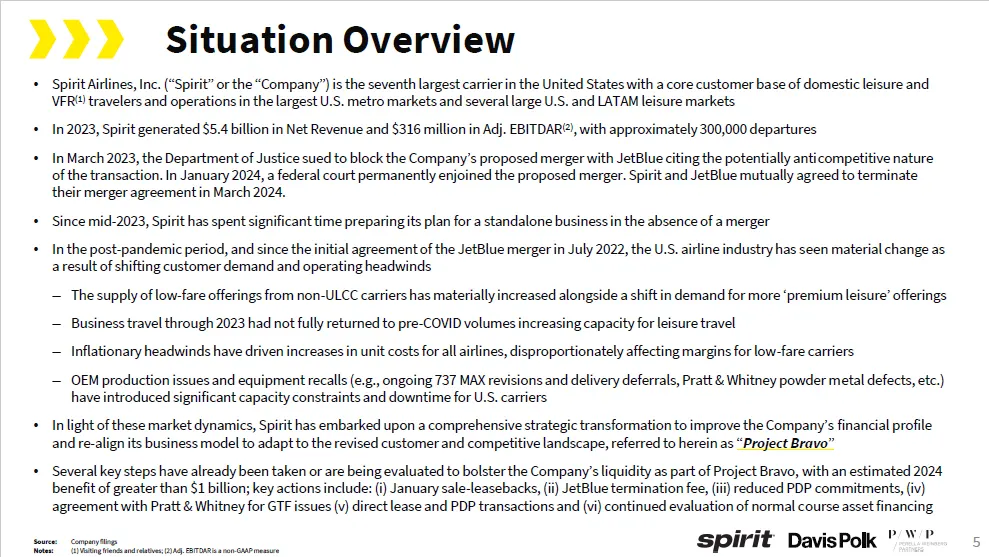
5 Situation Overview • Spirit Airlines, Inc. (“Spirit” or the “Company”) is the seventh largest carrier in the United States with a core customer base of domestic leisure and VFR (1) travelers and operations in the largest U.S. metro markets and several large U.S. and LATAM leisure markets • In 2023
Slide 6: Introducing Project Bravo
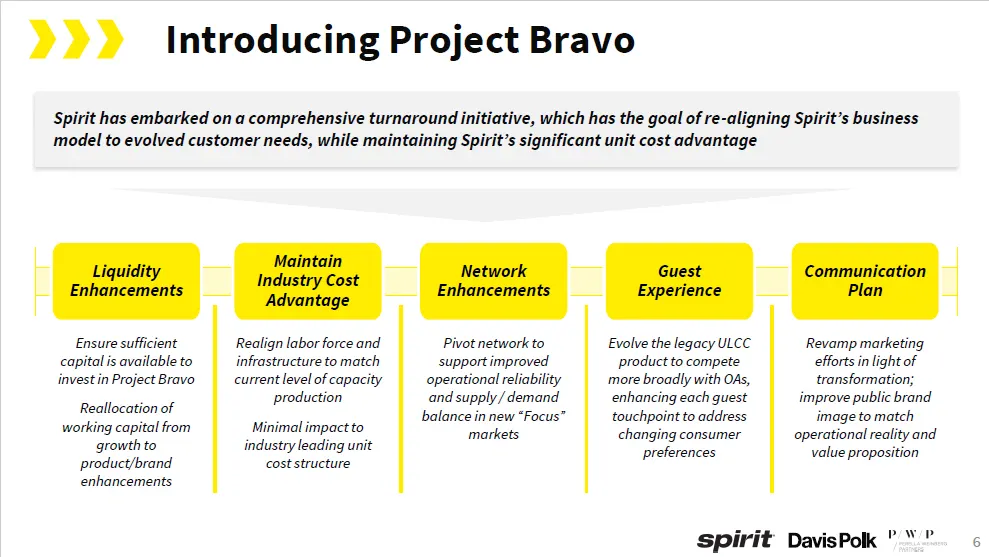
6 Introducing Project Bravo Spirit has embarked on a comprehensive turnaround initiative, which has the goal of re - aligning Spirit’s business model to evolved customer needs, while maintaining Spirit’s significant unit cost advantage Ensure sufficient capital is available to invest in Project Brav
Slide 7: Liquidity overview
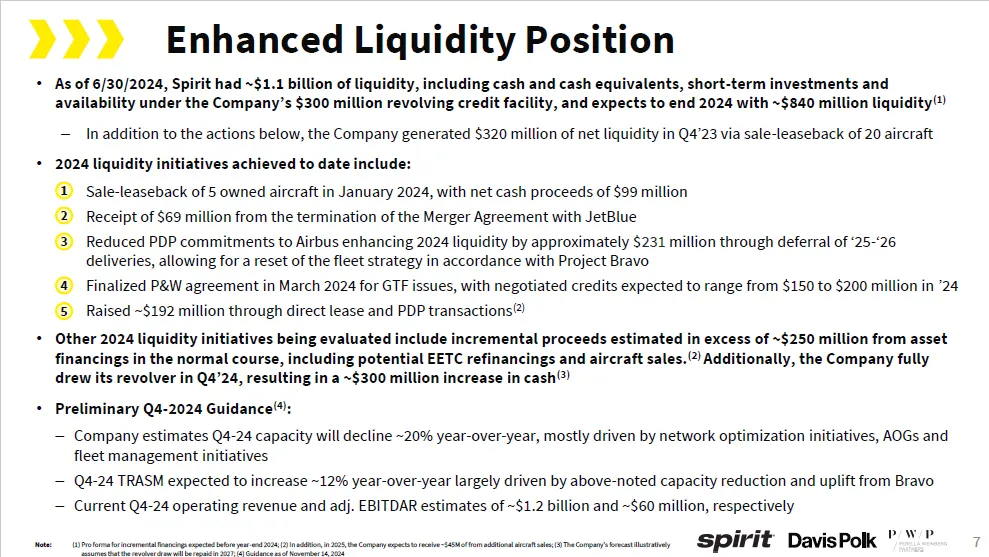
7 • As of 6/30/2024, Spirit had ~$1.1 billion of liquidity, including cash and cash equivalents, short - term investments and availability under the Company’s $300 million revolving credit facility, and expects to end 2024 with ~$840 million liquidity (1) – In addition to the actions below, the Comp
Slide 8: Table of Contents
8 Spirit Overview Industry Overview Project Bravo Appendi x 1 Executive Summary 2 3 4 Table of Contents
Slide 9: Key Credit Strengths
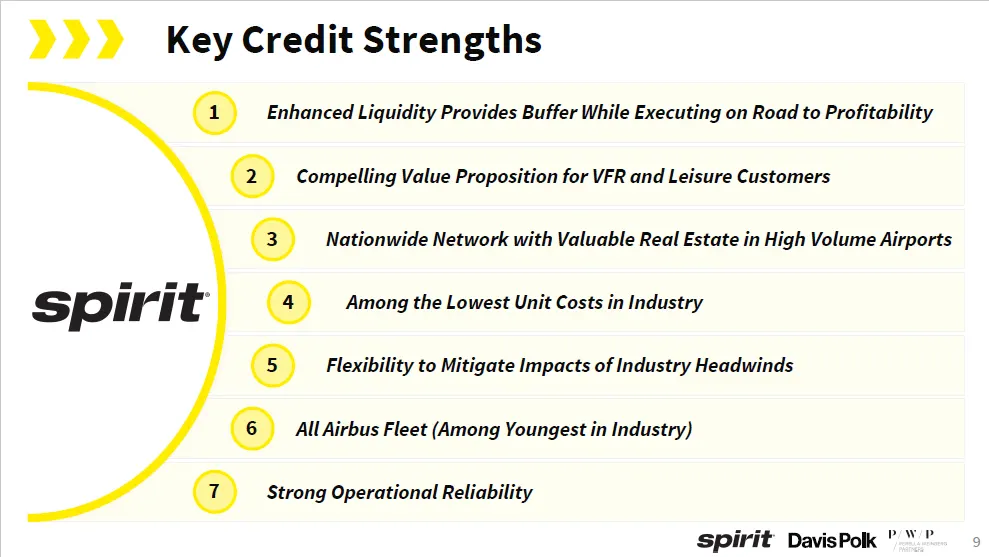
9 All Airbus Fleet (Among Youngest in Industry) Strong Operational Reliability Nationwide Network with Valuable Real Estate in High Volume Airports Flexibility to Mitigate Impacts of Industry Headwinds Among the Lowest Unit Costs in Industry Enhanced Liquidity Provides Buffer While Executing on Road
Slide 10: Spirit is a Leading, Low-Cost U.S. Airline
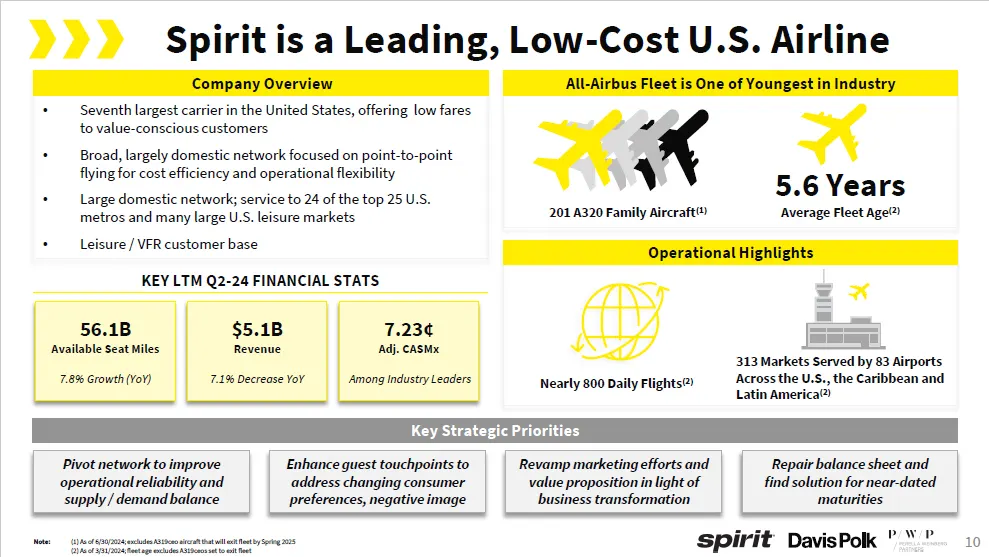
10 56.1B Available Seat Miles 7.8% Growth (YoY) • Seventh largest carrier in the United States, offering low fares to value - conscious customers • Broad, largely domestic network focused on point - to - point flying for cost efficiency and operational flexibility • Large domestic network; service t
Slide 11: Focus on the VFR & Leisure Customer
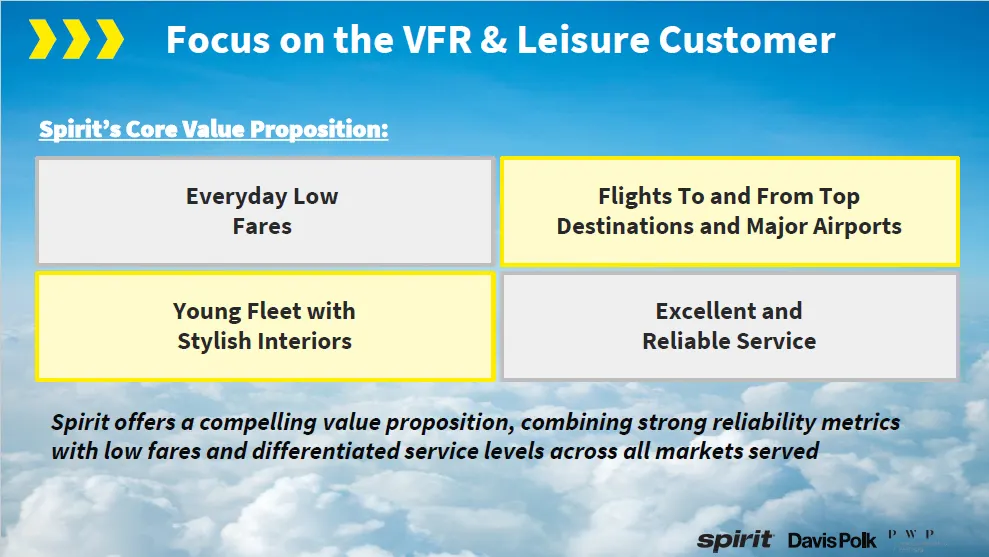
11 Everyday Low Fares Flights To and From Top Destinations and Major Airports Young Fleet with Stylish Interiors Excellent and Reliable Service Spirit’s Core Value Proposition: Spirit offers a compelling value proposition, combining strong reliability metrics with low fares and differentiated servic
Slide 12: How Spirit Keeps Costs Down
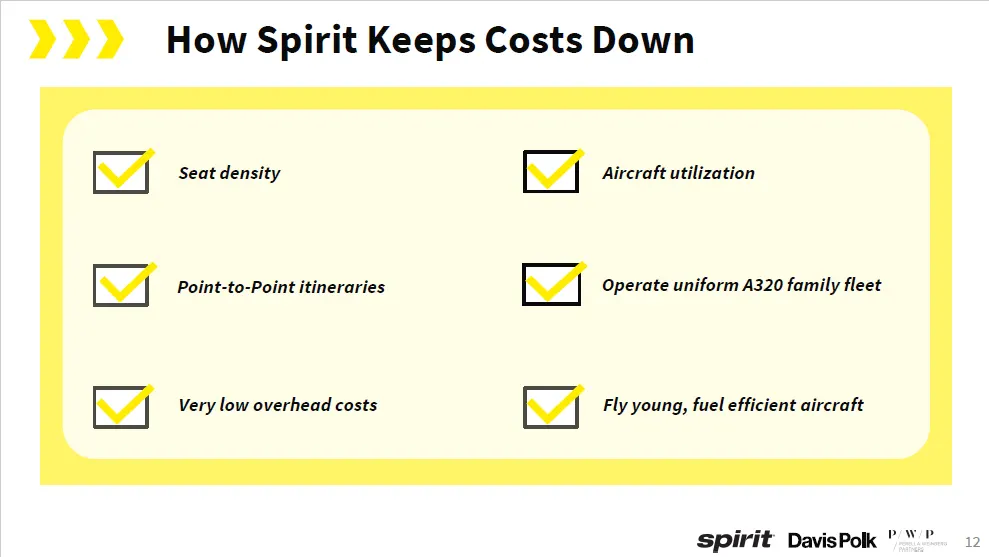
12 Seat density Point - to - Point itineraries Very low overhead costs Operate uniform A320 family fleet Fly young, fuel efficient aircraft How Spirit Keeps Costs Down Aircraft utilization
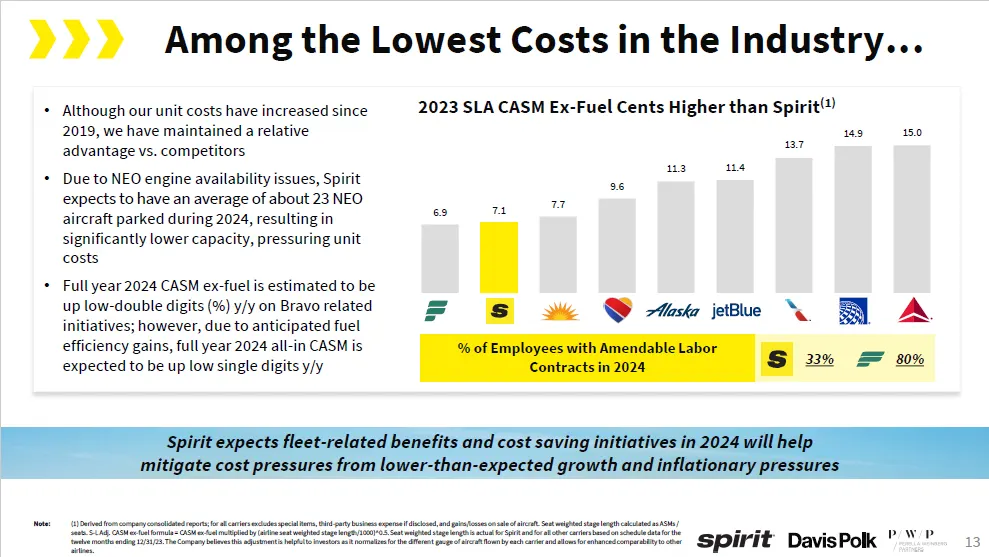
Slide 13: Among the Lowest Costs in the Industry
13 Among the Lowest Costs in the Industry… • Although our unit costs have increased since 2019, we have maintained a relative advantage vs. competitors • Due to NEO engine availability issues, Spirit expects to have an average of about 23 NEO aircraft parked during 2024, resulting in significantly l
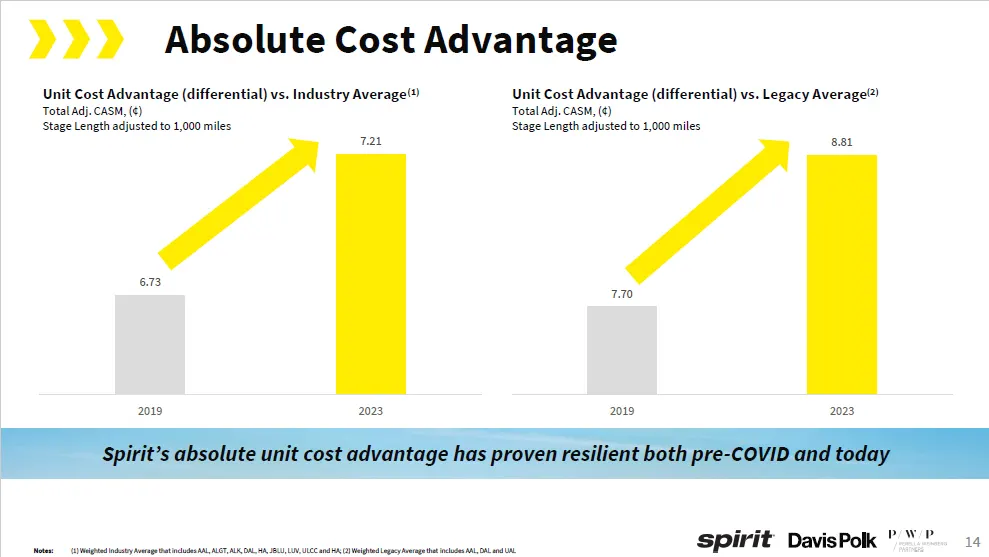
Slide 14: Absolute Cost Advantage
14 Absolute Cost Advantage 7 . 7 0 Unit Cost Advantage (differential) vs. Legacy Average (2) Total Adj. CASM, (¢) Stage Length adjusted to 1,000 miles 8.81 6 . 7 3 Unit Cost Advantage (differential) vs. Industry Average (1) Total Adj. CASM, (¢) Stage Length adjusted to 1,000 miles 7.21 2019 2023 201
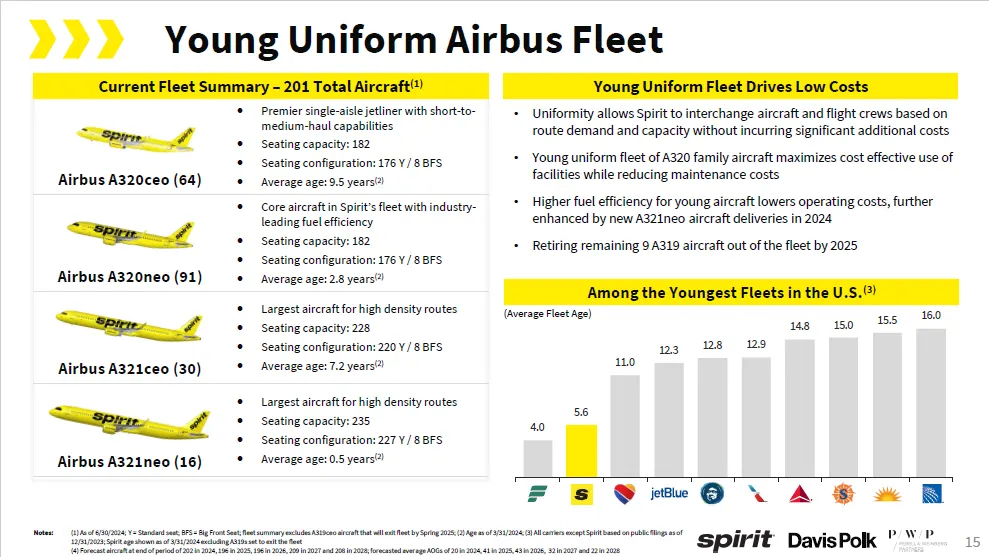
Slide 15: Current Fleet Summary
15 5 . 6 4.0 11 . 0 12 . 3 12 . 8 12 . 9 14 . 8 15 . 0 15 . 5 16 . 0 Current Fleet Summary – 201 Total Aircraft (1) Premier single - aisle jetliner with short - to - medium - haul capabilities Seating capacity: 182 Seating configuration: 176 Y / 8 BFS Average age: 9.5 years (2) Airbus A320ce
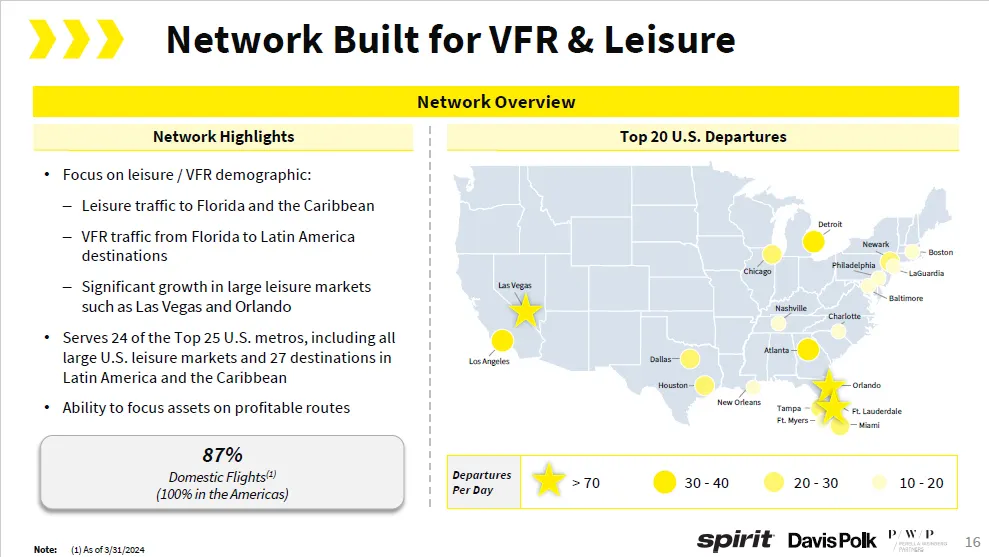
Slide 16: Network Built for VFR & Leisure
16 87% Domestic Flights (1) (100% in the Americas) Network Built for VFR & Leisure • Focus on leisure / VFR demographic: – Leisure traffic to Florida and the Caribbean – VFR traffic from Florida to Latin America destinations – Significant growth in large leisure markets such as Las Vegas and Orlando
Slide 17: Table of Contents
17 Spirit Overview Industry Overview Project Bravo Appendi x 1 Executive Summary 2 3 4 Table of Contents
Slide 18: U.S. Airline Industry Overview
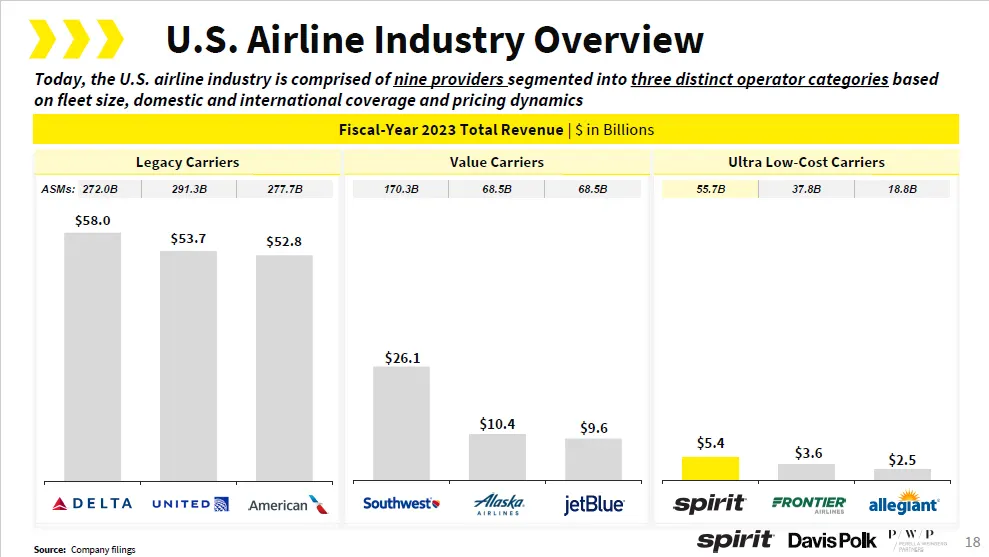
18 A S Ms : $58 . 0 $53 . 7 $52 . 8 U.S. Airline Industry Overview Fiscal - Year 2023 Total Revenue | $ in Billions Today, the U.S. airline industry is comprised of nine providers segmented into three distinct operator categories based on fleet size, domestic and international coverage and pricing d
Slide 19: Legacy Carrier Fare Offerings
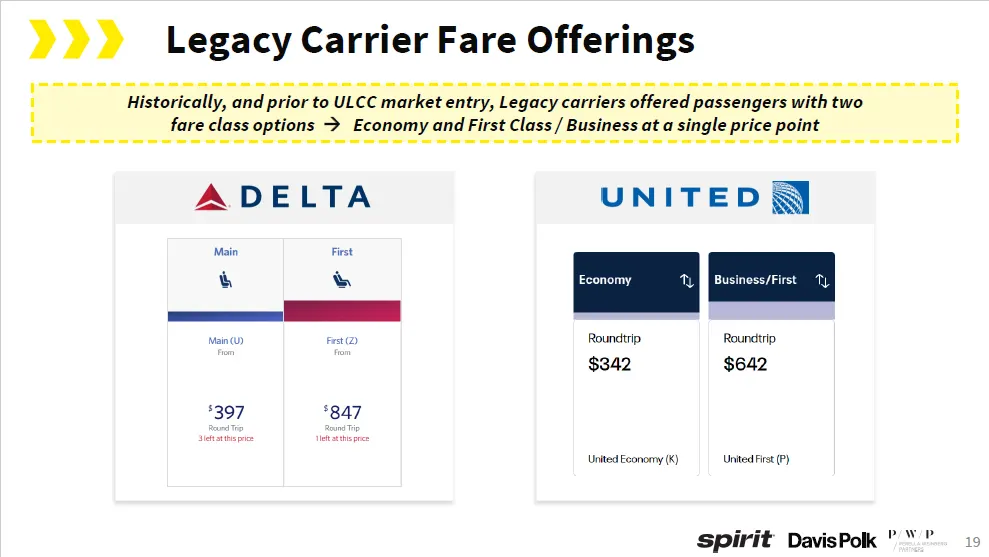
19 Legacy Carrier Fare Offerings Historically, and prior to ULCC market entry, Legacy carriers offered passengers with two fare class options Economy and First Class / Business at a single price point
Slide 20: Spirit's Unbundled Economy Product
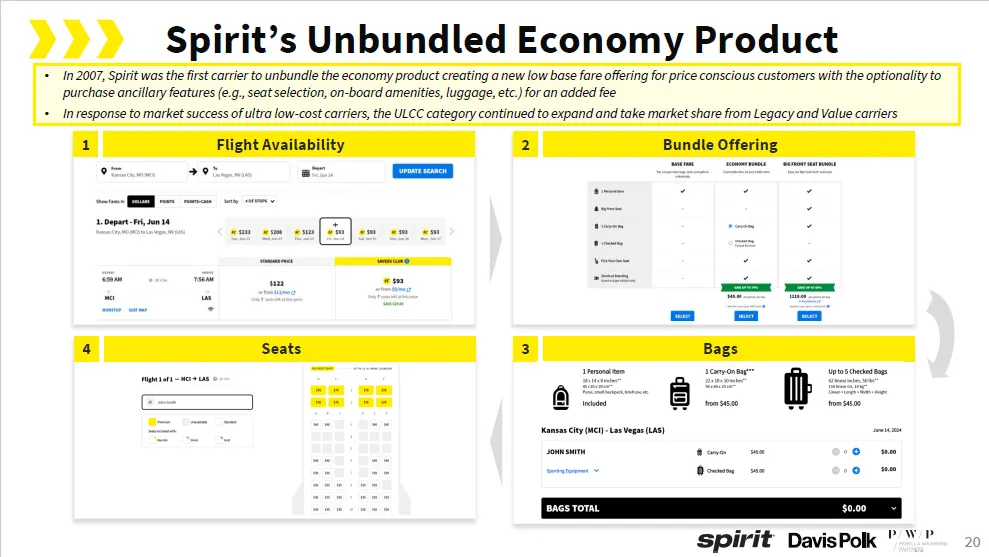
20 Bundle Offering 2 Bags 3 Seats 4 Flight Availability 1 Spirit’s Unbundled Economy Product • In 2007, Spirit was the first carrier to unbundle the economy product creating a new low base fare offering for price conscious customers with the optionality to purchase ancillary features (e.g., seat sel
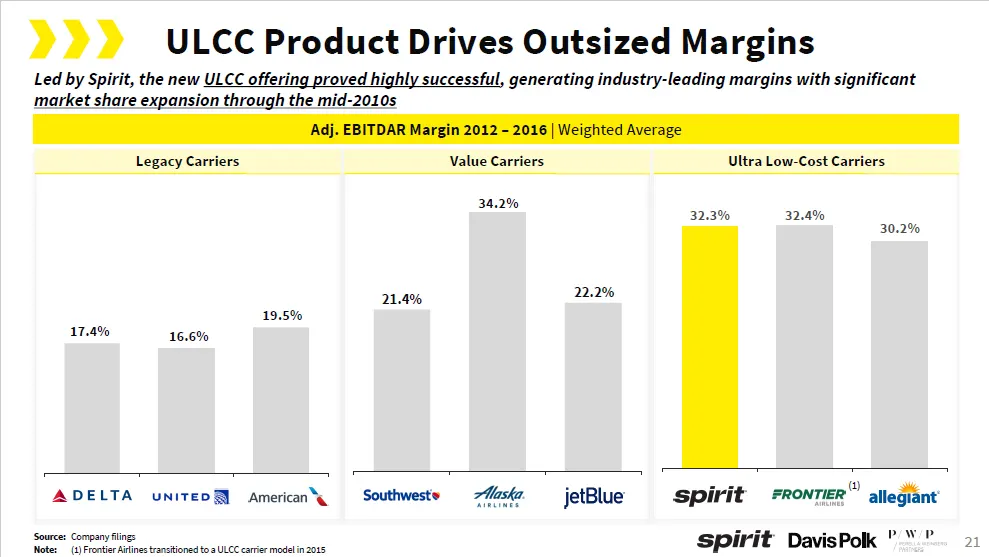
Slide 21: ULCC Product Drives Outsized Margins
21 ULCC Product Drives Outsized Margins Adj. EBITDAR Margin 2012 – 2016 | Weighted Average Led by Spirit, the new ULCC offering proved highly successful , generating industry - leading margins with significant market share expansion through the mid - 2010s Ultra Low - Cost Carriers Value Carriers Le
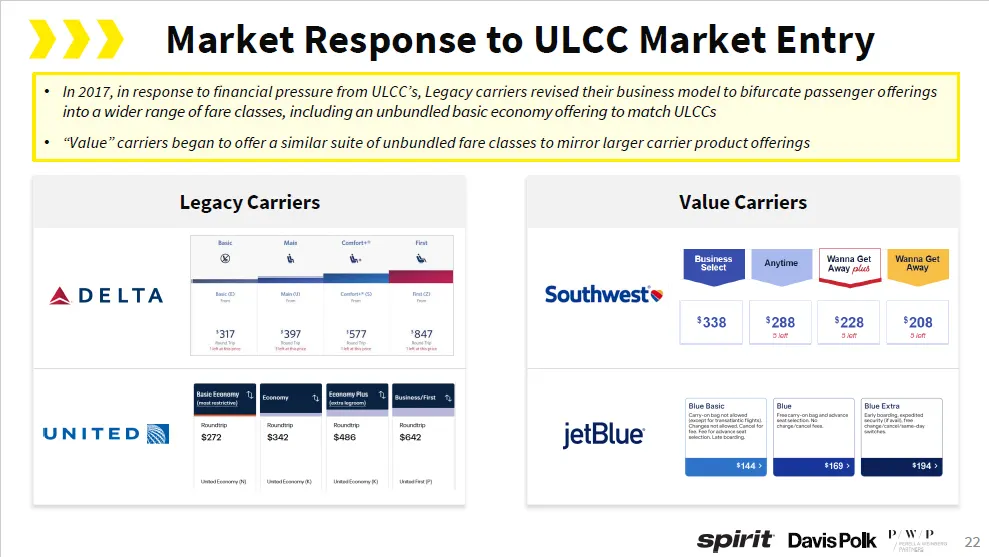
Slide 22: Market Response to ULCC Market Entry
22 Market Response to ULCC Market Entry • In 2017, in response to financial pressure from ULCC’s, Legacy carriers revised their business model to bifurcate passenger o fferings into a wider range of fare classes, including an unbundled basic economy offering to match ULCCs • “Value” carriers began t
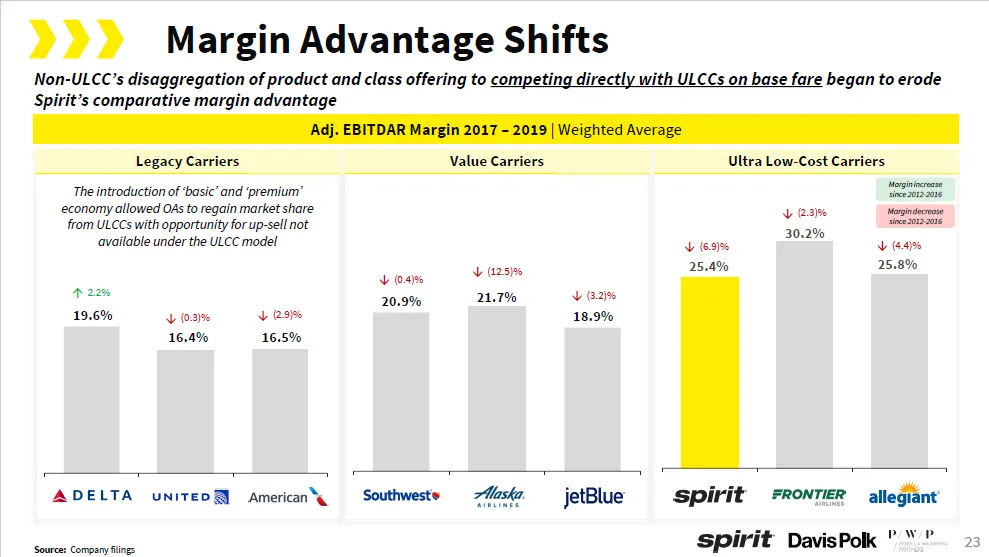
Slide 23: Margin Advantage Shifts
23 Adj. EBITDAR Margin 2017 – 2019 | Weighted Average Non - ULCC’s disaggregation of product and class offering to competing directly with ULCCs on base fare began to erode Spirit’s comparative margin advantage Ultra Low - Cost Carriers Margin Advantage Shifts Legacy Carriers Value Carriers The intr
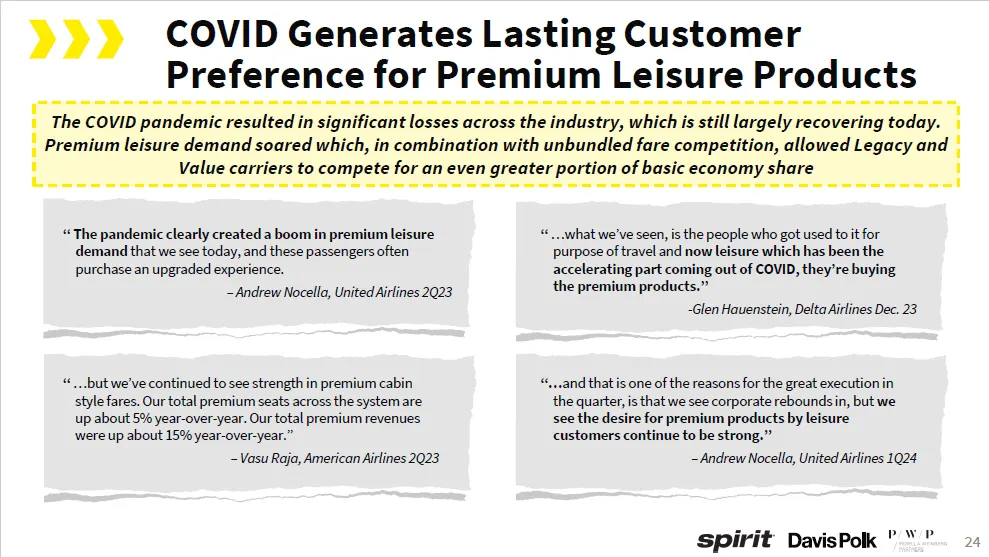
Slide 24: COVID Generates Lasting Customer Preference for Premium Leisure Products
24 COVID Generates Lasting Customer Preference for Premium Leisure Products The COVID pandemic resulted in significant losses across the industry, which is still largely recovering today. Premium leisure demand soared which, in combination with unbundled fare competition, allowed Legacy and Value ca
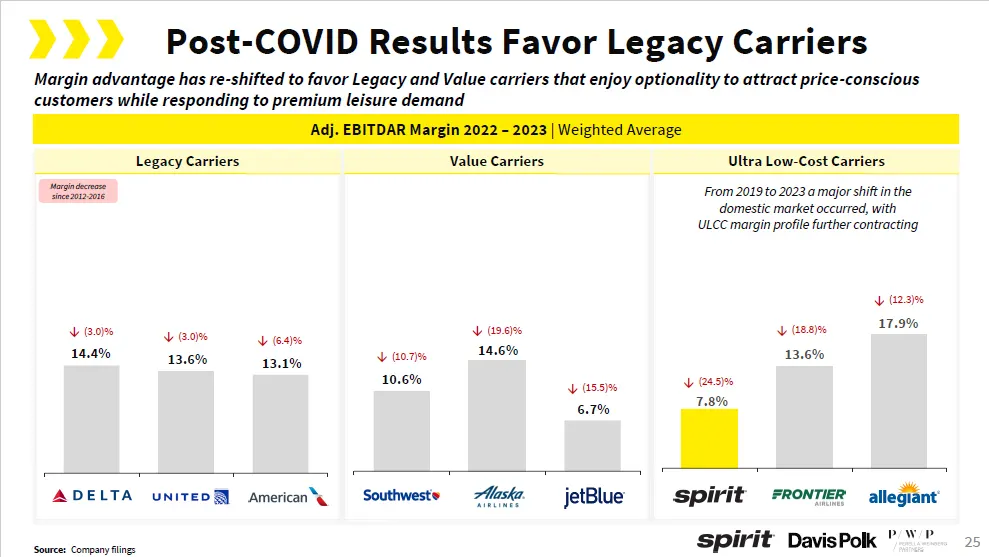
Slide 25: Post-COVID Results Favor Legacy Carriers
25 Post - COVID Results Favor Legacy Carriers Adj. EBITDAR Margin 2022 – 2023 | Weighted Average Legacy Carriers Value Carriers Ultra Low - Cost Carriers 14 . 6 % 17 . 9 % Margin advantage has re - shifted to favor Legacy and Value carriers that enjoy optionality to attract price - conscious custome
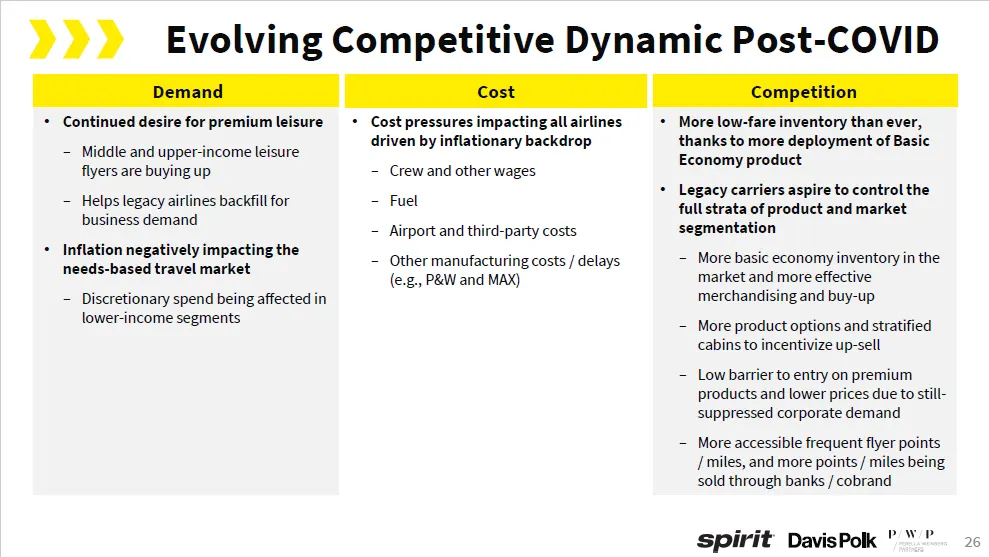
Slide 26: Evolving Competitive Dynamic Post-COVID
26 Evolving Competitive Dynamic Post - COVID Competition Cost Demand • More low - fare inventory than ever, thanks to more deployment of Basic Economy product • Legacy carriers aspire to control the full strata of product and market segmentation – More basic economy inventory in the market and more
Slide 27: Table of Contents
27 Spirit Overview Industry Overview Project Bravo Appendi x 1 Executive Summary 2 3 4 Table of Contents
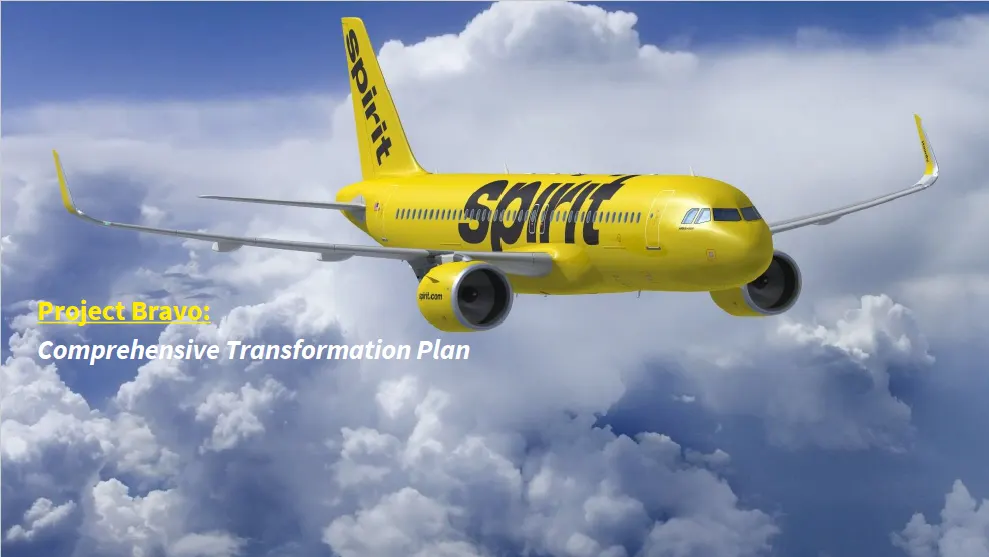
Slide 28: Project Bravo: Comprehensive Transformation Plan
Project Bravo: Comprehensive Transformation Plan
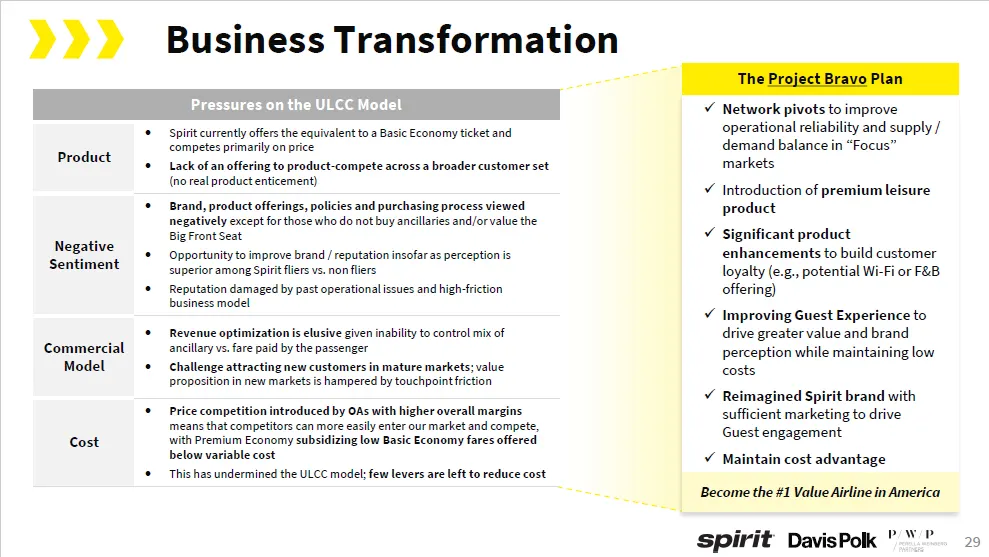
Slide 29: Business Transformation Pressures on the ULCC Model
Business Transformation Pressures on the ULCC Model Spirit currently offers the equivalent to a Basic Economy ticket and competes primarily on price Lack of an offering to product - compete across a broader customer set (no real product enticement) Product Brand, product offerings, policies an
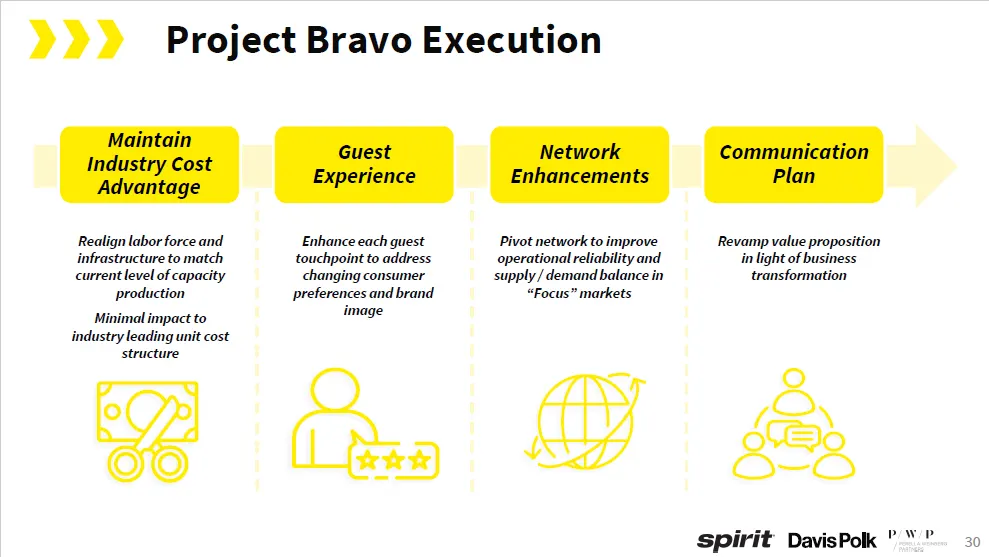
Slide 30: Project Bravo Execution
30 Project Bravo Execution Enhance each guest touchpoint to address changing consumer preferences and brand image Revamp value proposition in light of business transformation Guest Experien ce Comm u n ica t ion Plan Maintain Industry Cost Advantage Realign labor force and infrastructure to match cu
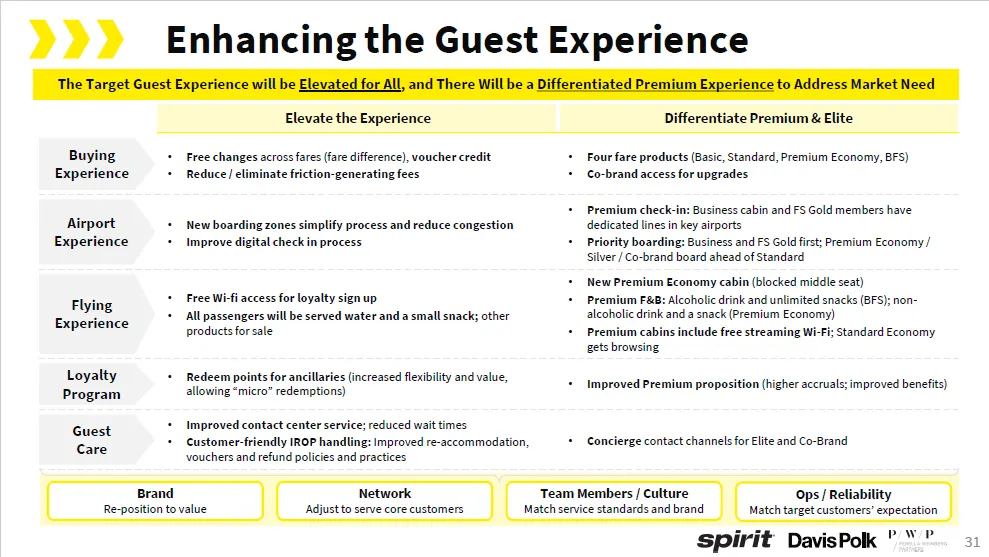
Slide 31: Enhancing the Guest Experience
31 Enhancing the Guest Experience The Target Guest Experience will be Elevated for All , and There Will be a Differentiated Premium Experience to Address Market Need Differentiate Premium & Elite Elevate the Experience • Four fare products (Basic, Standard, Premium Economy, BFS) • Co - brand access
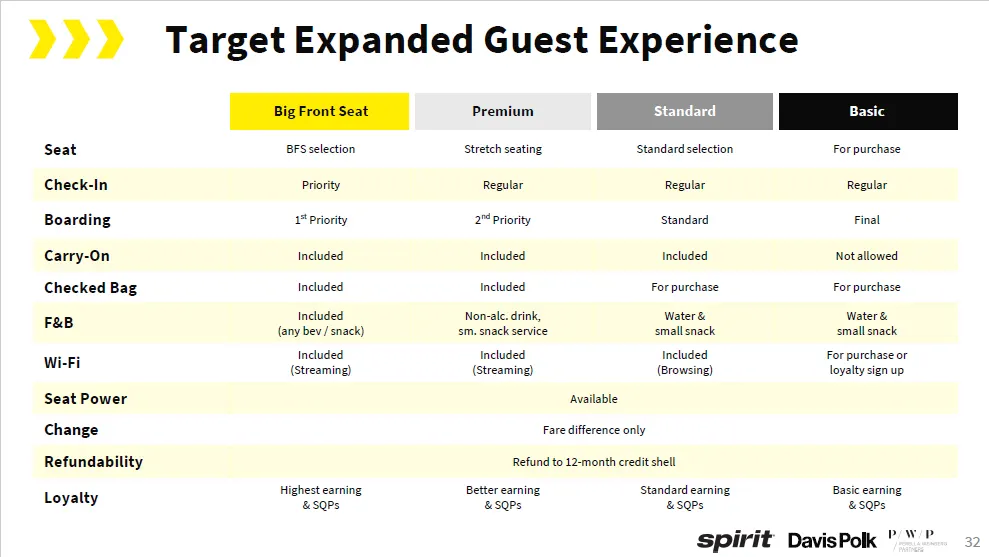
Slide 32: Target Expanded Guest Experience
32 Basic Standard Premium Big Front Seat For purchase Standard selection Stretch seating BFS selection Seat Regular Regular Regular Priority Check - In Final Standard 2 nd Priority 1 st Priority Boarding Not allowed Included Included Included Carry - On For purchase For purchase Included Included Ch
Slide 33: The Journey to Becoming the #1 Value Carrier
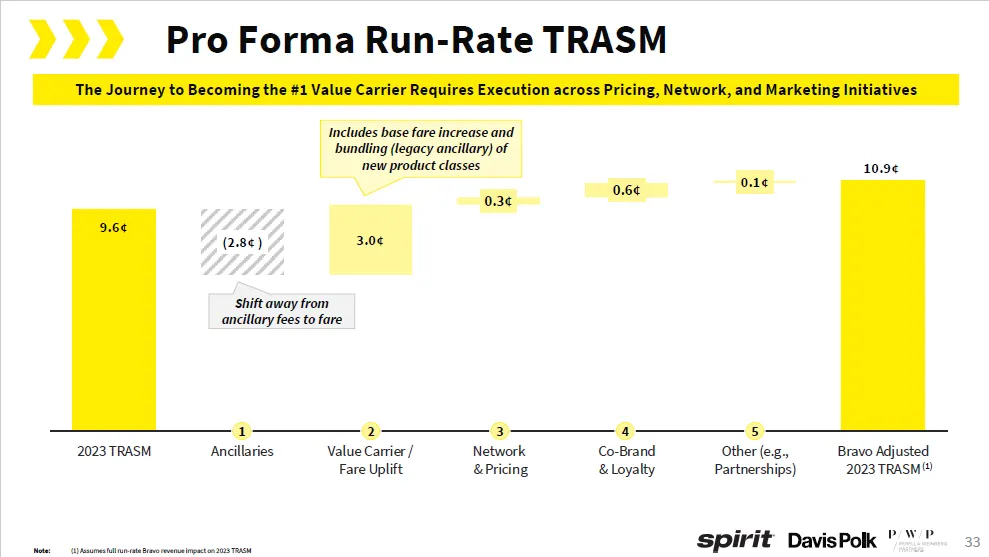
33 9 . 6 ¢ 10 . 9 ¢ (2.8¢ ) 3.0¢ 0.3¢ 0.6¢ 0.1¢ 2023 TRASM Ancillaries Value Carrier / Fare Uplift Network & Pricing C o - B r a n d & Loyalty Other (e.g., P a r t n e r s h i p s ) Pro Forma Run - Rate TRASM The Journey to Becoming the #1 Value Carrier Requires Execution across Pricing, Network, an
Slide 34: Summary of TRASM Assumptions
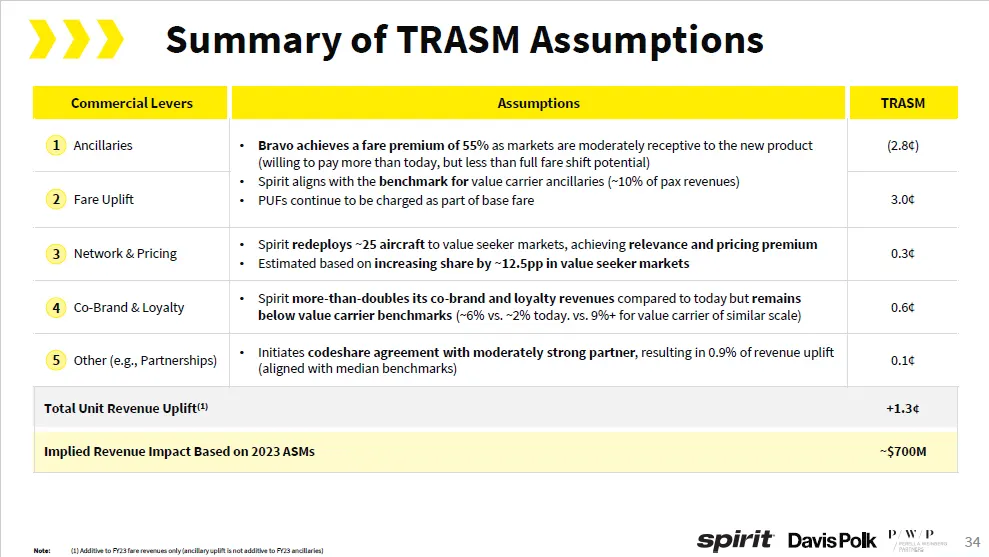
34 Summary of TRASM Assumptions TRASM Assumptions Commercial Levers (2.8¢) • Bravo achieves a fare premium of 55% as markets are moderately receptive to the new product (willing to pay more than today, but less than full fare shift potential) • Spirit aligns with the benchmark for value carrier anci
Slide 35: Bravo Modestly Increases CASMx but Maintains Company Advantage
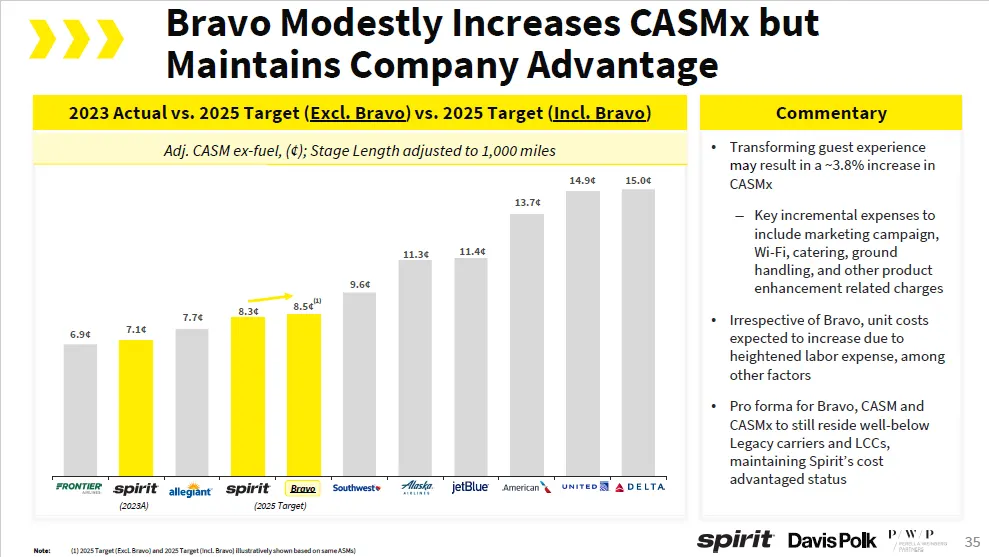
Commentary • Transforming guest experience may result in a ~3.8% increase in CASMx – Key incremental expenses to include marketing campaign, Wi - Fi, catering, ground handling, and other product enhancement related charges • Irrespective of Bravo, unit costs expected to increase due to heightened la
Slide 36: Implementation Timeline
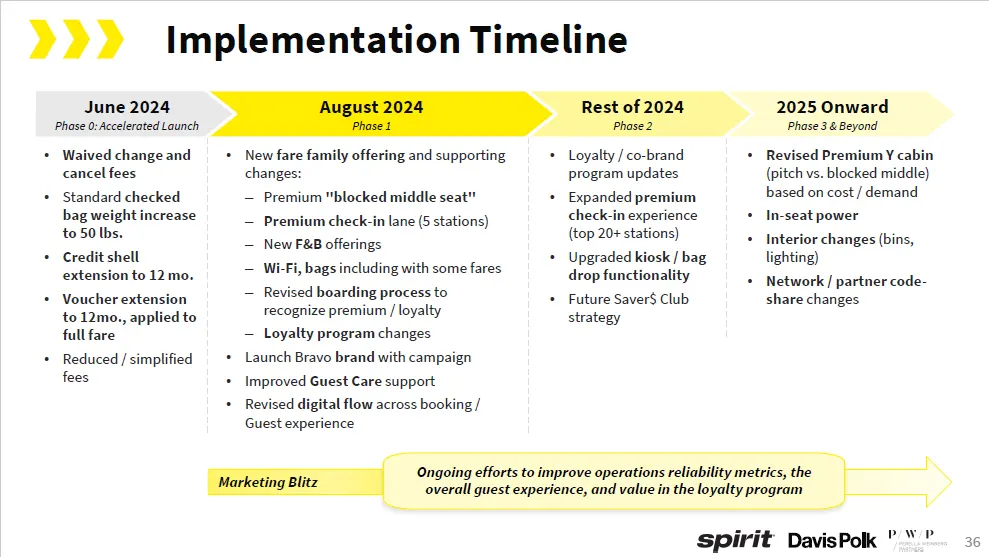
36 Implementation Timeline • Waived change and cancel fees • Standard checked bag weight increase to 50 lbs. • Credit shell extension to 12 mo. • Voucher extension to 12mo., applied to full fare • Reduced / simplified fees • New fare family offering and supporting changes: – Premium "blocked middle
Slide 37: The New Spirit Model
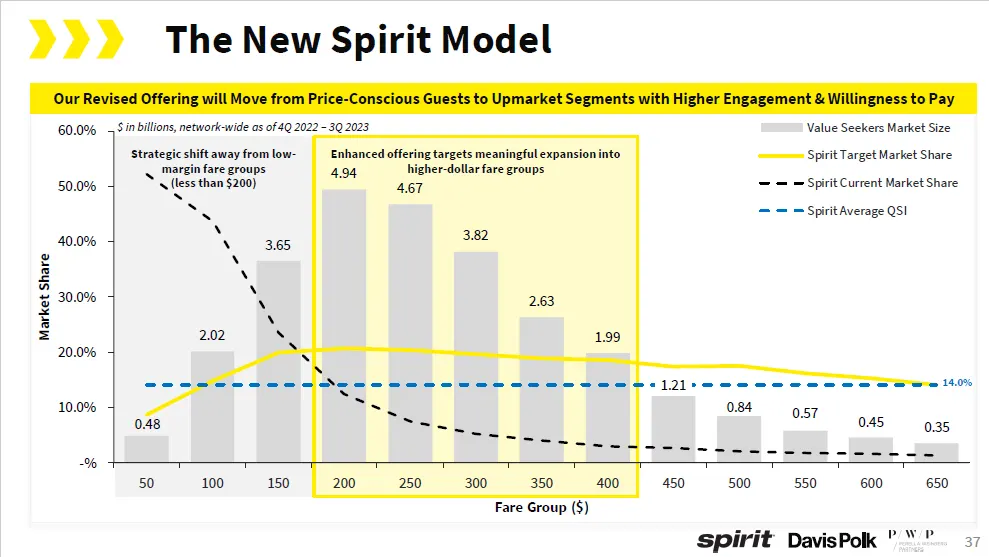
37 The New Spirit Model Market Share Our Revised Offering will Move from Price - Conscious Guests to Upmarket Segments with Higher Engagement & Willingness to Pay Value Seekers Market Size Spirit Target Market Share Spirit Current Market Share Spirit Average QSI 14 . 0 % 0.57 0.45 0.35 550 600 650 $
Slide 38: The New Spirit Model (Cont'd)
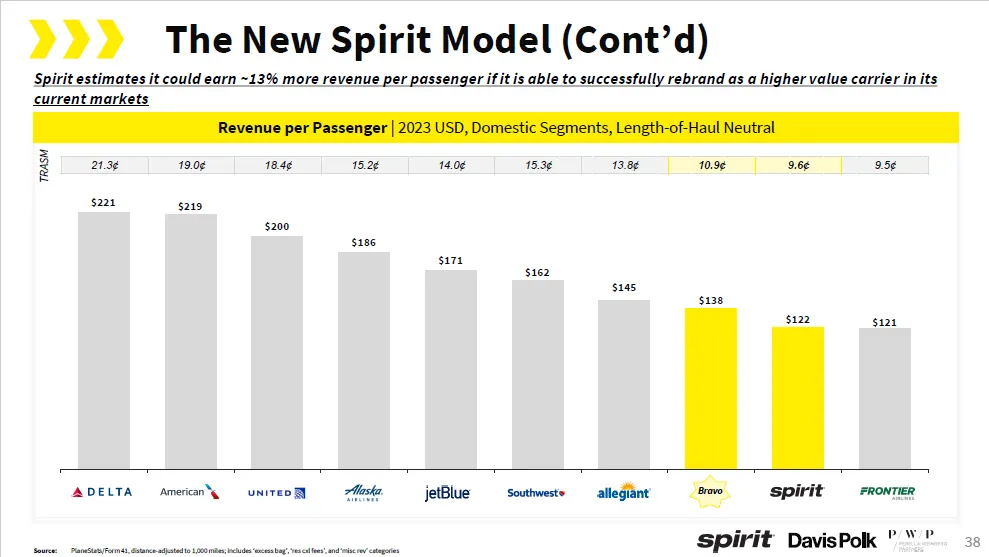
38 The New Spirit Model (Cont’d) Spirit estimates it could earn ~13% more revenue per passenger if it is able to successfully rebrand as a higher value carrier in its current markets Revenue per Passenger | 2023 USD, Domestic Segments, Length - of - Haul Neutral $219 $221 $200 $186 $171 $162 $145 $1
Slide 39: Network Enhancements
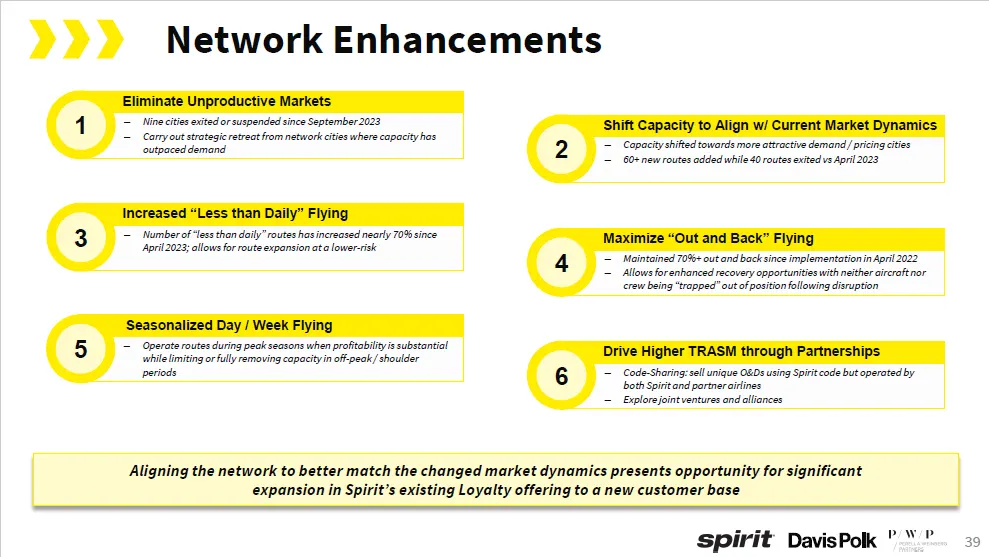
39 Eliminate Unproductive Markets 1 – Nine cities exited or suspended since September 2023 – Carry out strategic retreat from network cities where capacity has outpaced demand Increased “Less than Daily” Flying 3 – Number of “less than daily” routes has increased nearly 70% since April 2023; allows
Slide 40: Comprehensive Network Realignment Overview
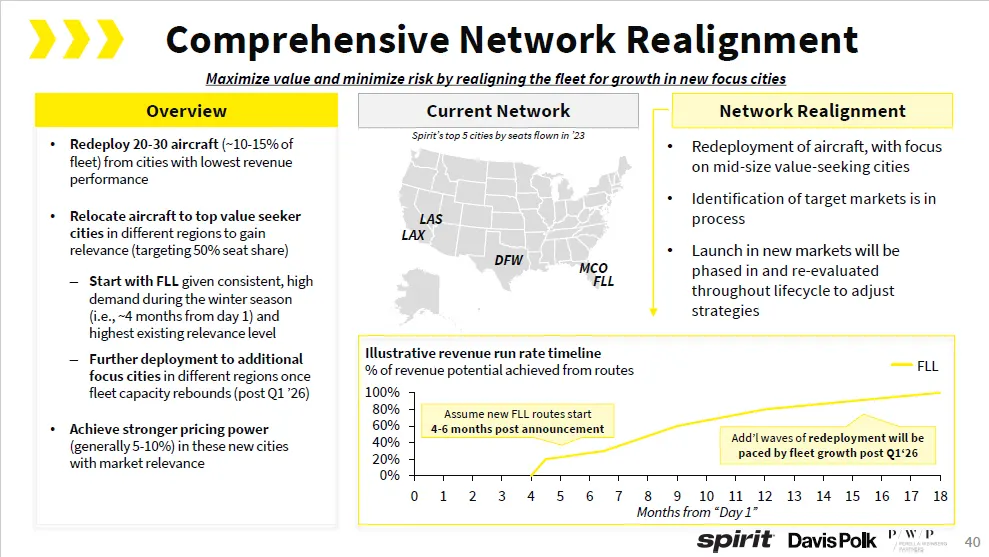
Comprehensive Network Realignment Overview • Redeploy 20 - 30 aircraft (~ 10 - 15 % of fleet) from cities with lowest revenue performance • Relocate aircraft to top value seeker cities in different regions to gain relevance (targeting 50% seat share) – Start with FLL given consistent, high demand du
Slide 41: Loyalty Could Drive ~4-9% Revenue Uplift
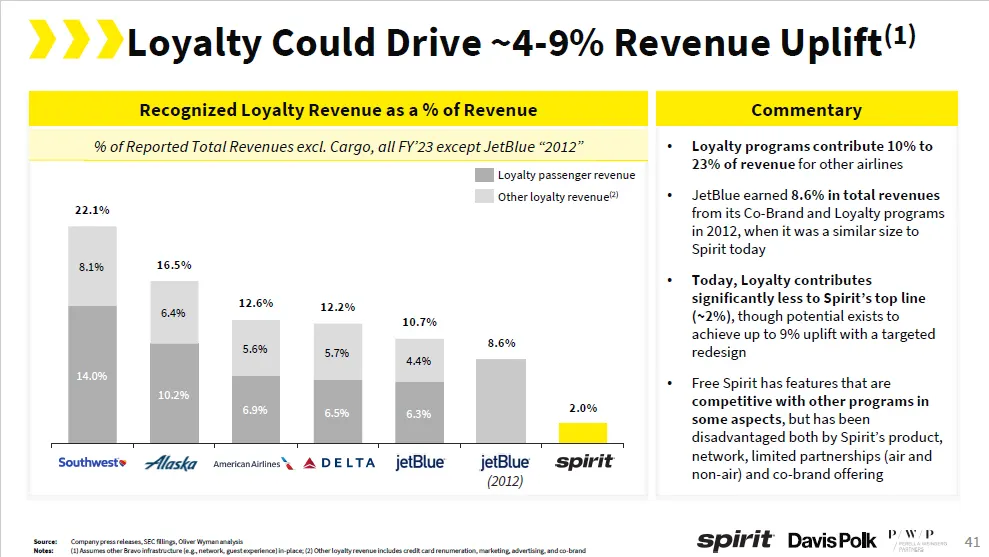
41 Loyalty Could Drive ~4 - 9% Revenue Uplift (1) • Loyalty programs contribute 10% to 23% of revenue for other airlines • JetBlue earned 8.6% in total revenues from its Co - Brand and Loyalty programs in 2012, when it was a similar size to Spirit today • Today, Loyalty contributes significantly les
Slide 42: Redesign of Spirit's Loyalty Program
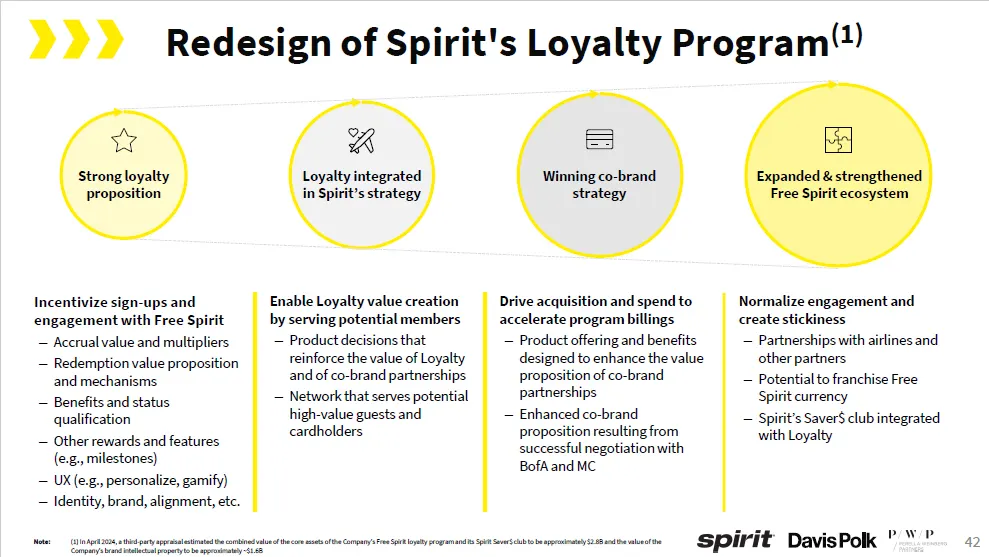
42 Redesign of Spirit's Loyalty Program (1) Loyalty integrated in Spirit’s strategy Strong loyalty proposition Winning co - brand strategy Expanded & strengthened Free Spirit ecosystem Drive acquisition and spend to accelerate program billings – Product offering and benefits designed to enhance the
Slide 43: Benefits of Partnership
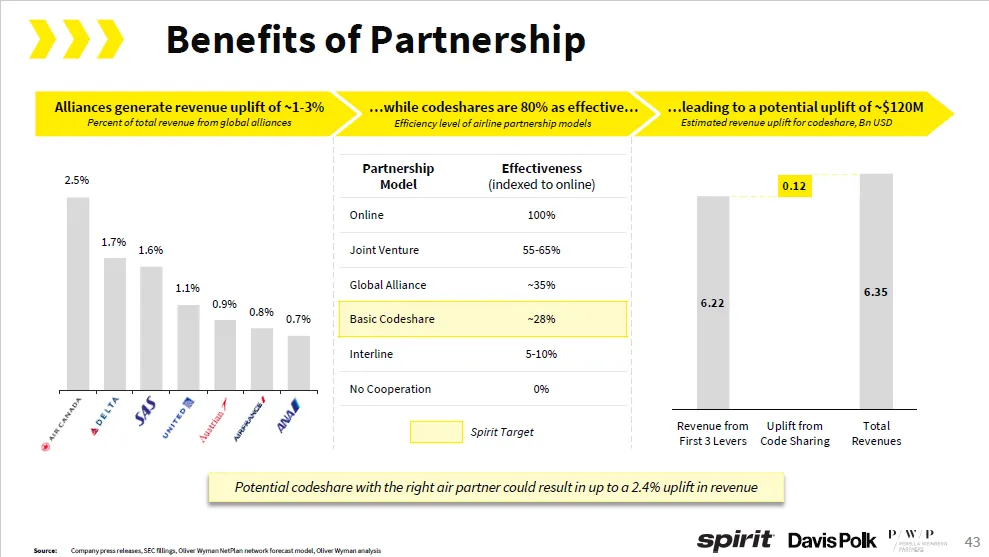
43 Benefits of Partnership …leading to a potential uplift of ~$120M Estimated revenue uplift for codeshare, Bn USD …while codeshares are 80% as effective… Efficiency level of airline partnership models Alliances generate revenue uplift of ~1 - 3% Percent of total revenue from global alliances Potent
Slide 44: Business Outlook
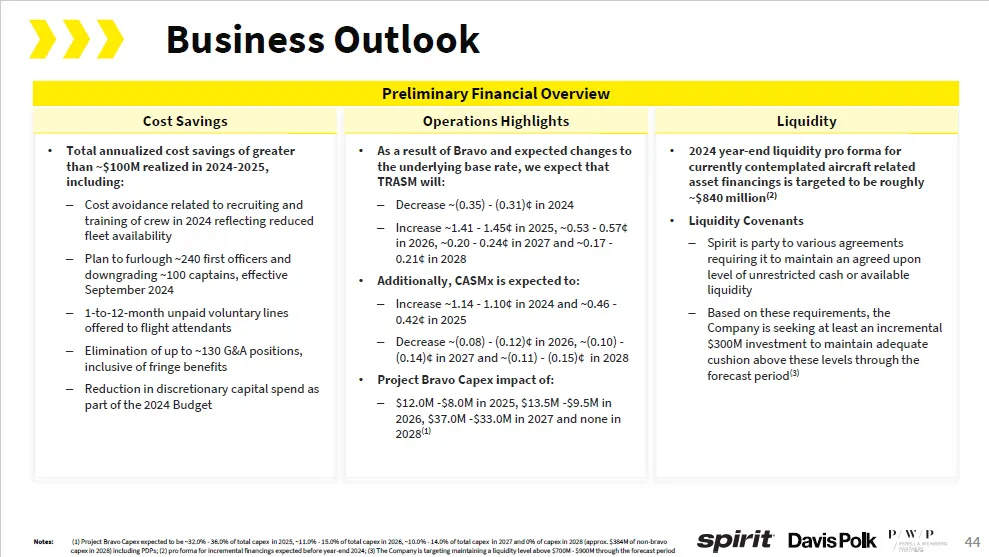
44 Business Outlook Preliminary Financial Overview Liquidity Operations Highlights • As a result of Bravo and expected changes to the underlying base rate, we expect that TRASM will: – Decrease ~(0.35) - (0.31)¢ in 2024 – Increase ~1.41 - 1.45¢ in 2025, ~0.53 - 0.57¢ in 2026, ~0.20 - 0.24¢ in 2027 a
Slide 45: Appendix: Other Company Information
Appendix: Other Company Information
Slide 46: Utilization and Seat Density Benchmarking
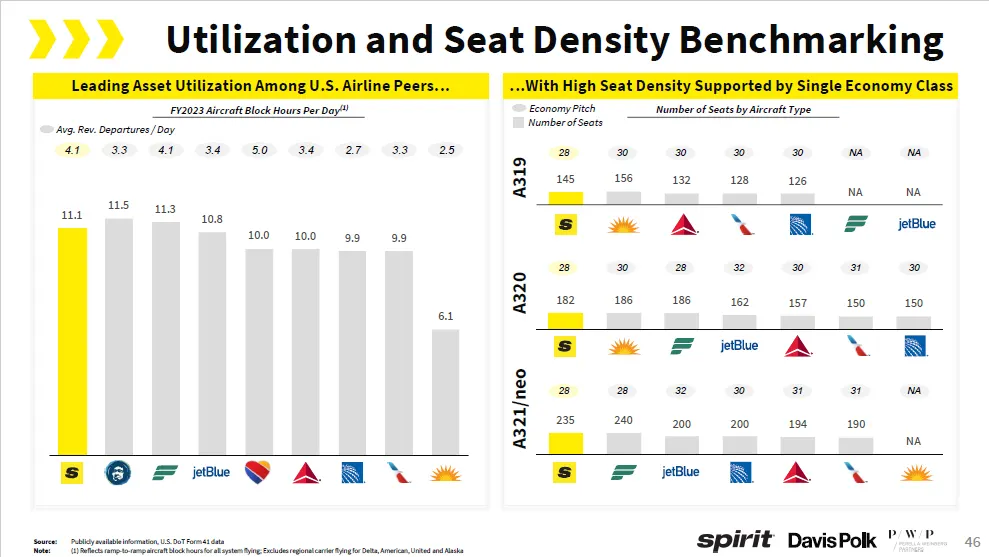
46 11 . 1 11 . 5 11 . 3 10 . 8 10 . 0 10 . 0 9 . 9 Utilization and Seat Density Benchmarking 3 .3 2 .5 FY2023 Aircraft Block Hours Per Day (1) Avg. Rev. Departures / Day 4.1 3.3 4.1 3.4 5.0 3.4 2.7 A319 A320 A321/neo 0 NA NA 30 30 30 30 28 30 31 30 32 28 30 28 NA 31 31 30 32 28 28 Leading Asset Util
Slide 47: Historical P&L 2019-2023
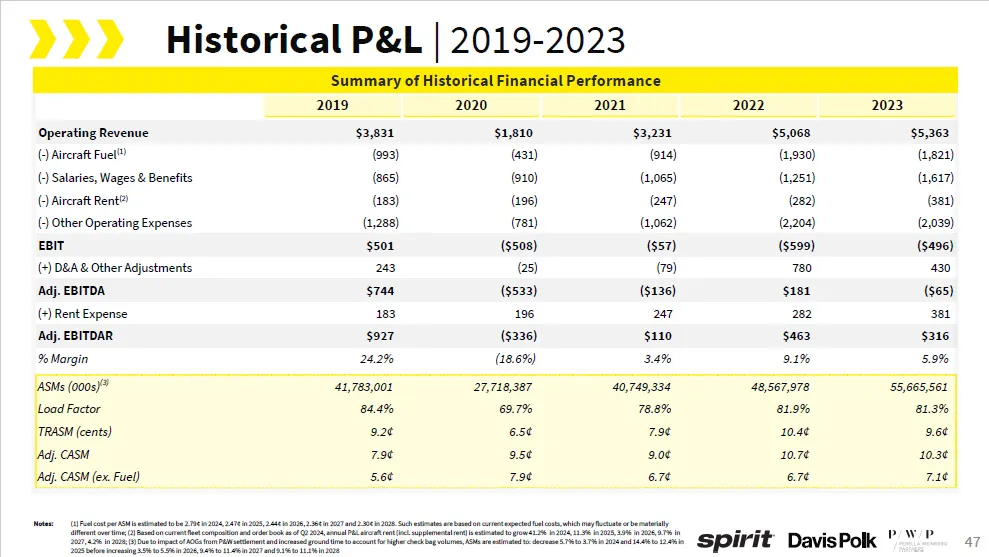
47 Historical P&L | 2019 - 2023 N o t e s : (1) Fuel cost per ASM is estimated to be 2.79¢ in 2024, 2.47¢ in 2025, 2.44¢ in 2026, 2.36¢ in 2027 and 2.30¢ in 2028. Such estimates are based on current expected fuel costs, which may fluctuate or be materially different over time; (2) Based on current f
Slide 48: Capital Structure (as of Q2 2024)
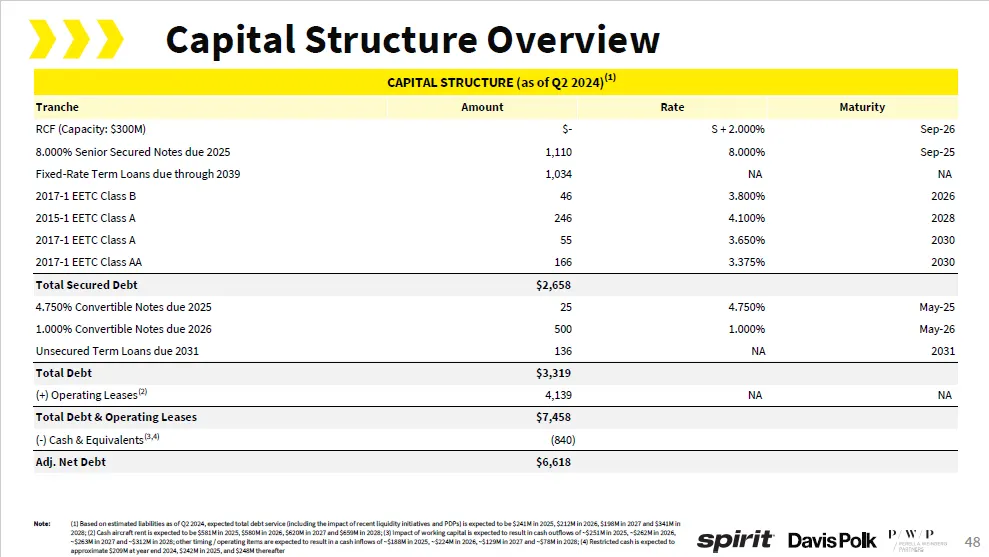
48 2023 - 2023 - 2023 - 2023 - CAPITAL STRUCTURE (as of Q2 2024) (1) Maturity Rate Amount Tranche Se p - 26 S + 2.000% $ - RCF (Capacity: $300M) Se p - 25 8.000% 1,110 8.000% Senior Secured Notes due 2025 NA NA 1,034 Fixed - Rate Term Loans due through 2039 2026 3.800% 46 2017 - 1 EETC Class B 2028
Slide 49: Unencumbered Assets
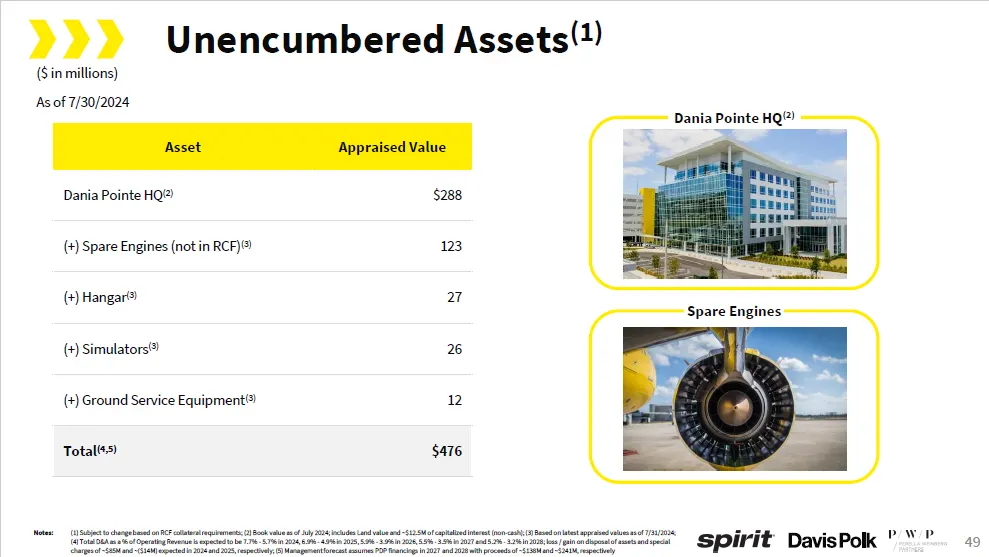
49 Unencumbered Assets (1) ($ in millions) As of 7/30/2024 Appraised Value Asset $288 Dania Pointe HQ (2) 123 (+) Spare Engines (not in RCF) (3) 27 (+) Hangar (3) 26 (+) Simulators (3) 12 (+) Ground Service Equipment (3) $476 Total (4,5) Dania Pointe HQ (2) Spare Engines N o te s : (1) Subject to ch
Slide 50: Organizational Structure
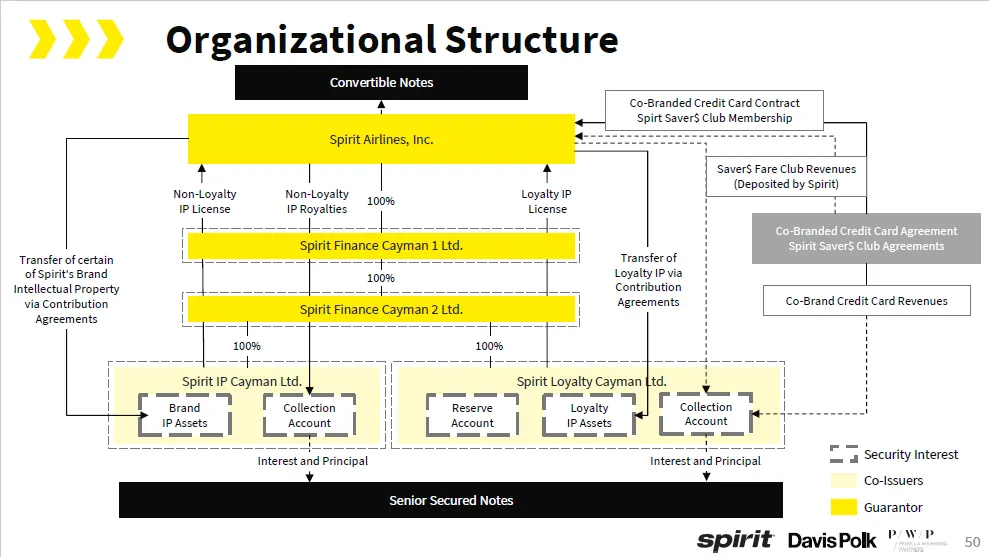
50 Organizational Structure Spirit Airlines, Inc. Spirit IP Cayman Ltd. Spirit Loyalty Cayman Ltd. Brand IP Assets C o l le c t i on Account R e ser ve Account Loyalty IP Assets C o l le c t i on Account Senior Secured Notes Security Interest C o - Is suers G u ar an t or Spirit Finance Cayman 1 Ltd
Slide 51: Appendix: DS Projections
Appendix: DS Projections
Slide 52: Income Statement
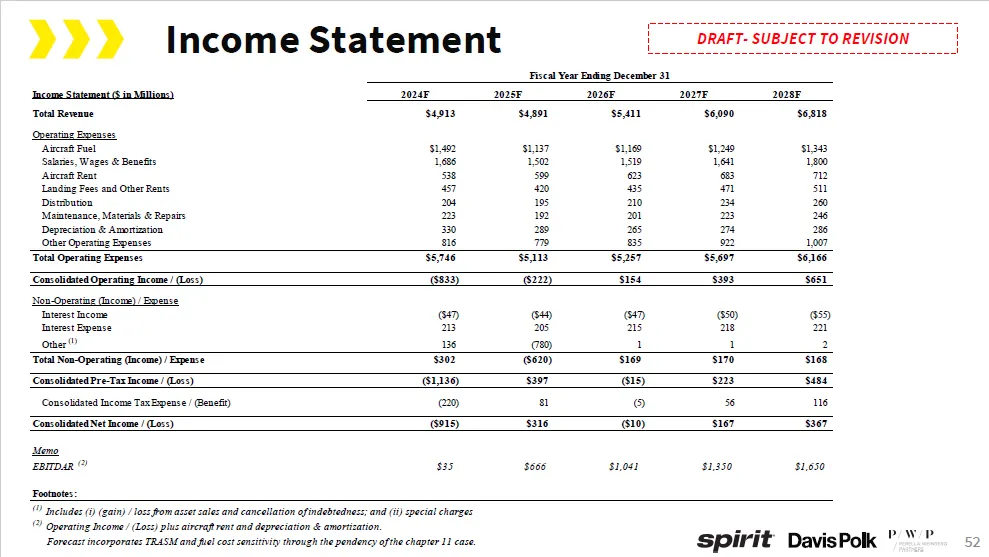
52 Income Statement DRAFT - SUBJECT TO REVISION Income Statement ($ in Millions) $6 , 81 8 $6 , 09 0 $5,411 $4 , 89 1 $4 , 91 3 Total Revenue $1 , 34 3 $1 , 24 9 $1,169 $1 , 13 7 $1 , 49 2 Operating Expenses Aircraft Fuel 1 , 80 0 1 , 64 1 1,519 1 , 50 2 1 , 68 6 Salaries, Wages & Benefits 712 683 6
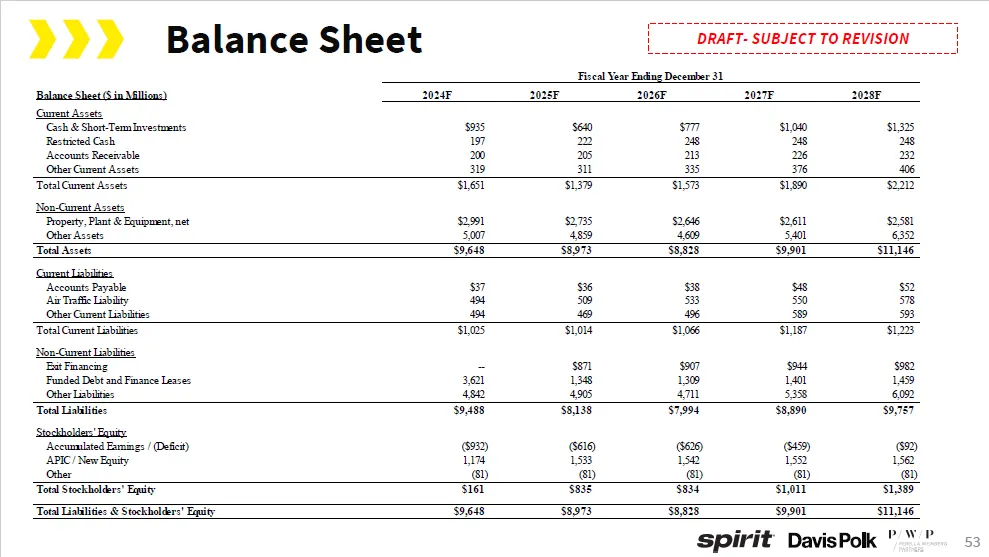
Slide 53: Balance Sheet
2028F 2027F 2026F 2025F 2024F Balance Sheet ($ in Millions) $1 , 32 5 $1,040 $777 $640 $935 Current Assets Cash & Short - Term Investments 248 248 248 222 197 Restricted Cash 232 226 213 205 200 Accounts Receivable 406 376 335 311 319 Other Current Assets $2 , 21 2 $1,890 $1 , 57 3 $1,379 $1 , 65 1
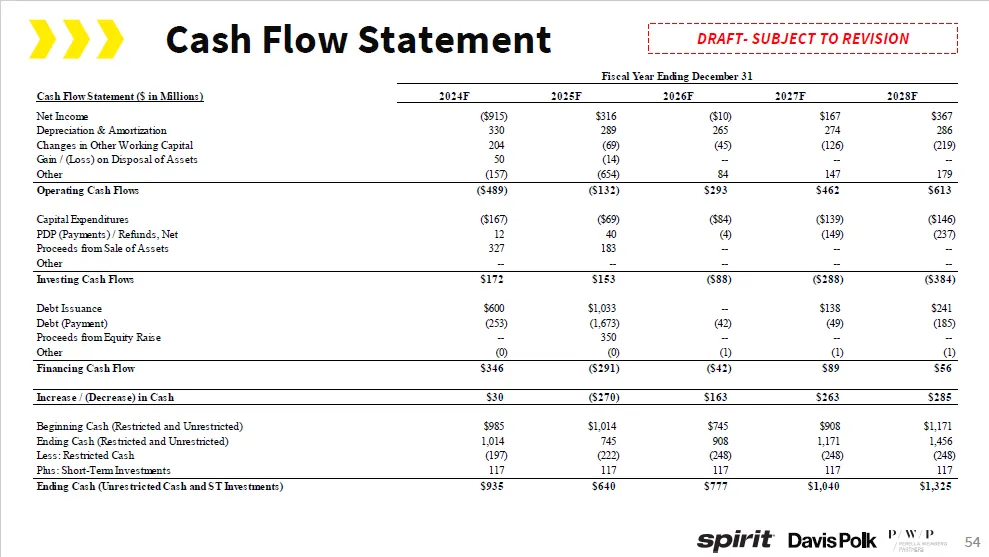
Slide 54: Cash Flow Statement
54 Cash Flow Statement DRAFT - SUBJECT TO REVISION Fiscal Year Ending December 31 2028F 2027F 2026F 2025F 2024F Cash Flow Statement ($ in Millions) $367 $167 ( $10 ) $316 ($915) Net Income 286 274 265 289 330 Depreciation & Amortization ( 219 ) ( 126 ) ( 45 ) ( 69 ) 204 Changes in Other Working Capi
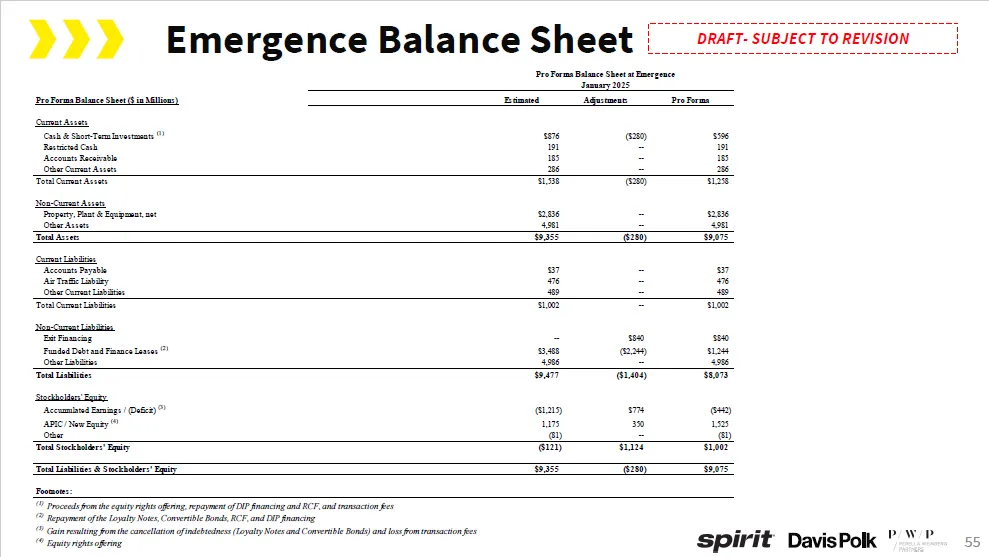
Slide 55: Emergence Balance Sheet
55 Emergence Balance Sheet DRAFT - SUBJECT TO REVISION Pro Forma Balance Sheet ($ in Millions) Pro Forma Balance Sheet at Emergence January 2025 Estimated Adjustments Pro Forma Current Assets $596 ( $280 ) $876 Cash & Short - Term Investments (1) 191 -- 191 Restricted Cash 185 -- 185 Accounts Receiv
Slide 56: sp ir i t ®
sp ir i t ®
Source: SEC EDGAR · 8-K filed Nov 18, 2024
More decks from Spirit Airlines Inc
 Merger or Acquisition (January 2025)18 slides · Jan 29, 2025
 Merger or Acquisition (January 2025)8 slides · Jan 29, 2025
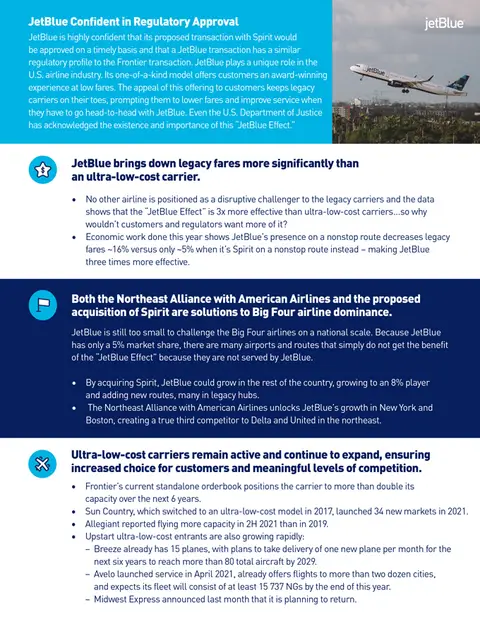 Merger or Acquisition (July 2022)43 slides · Jul 28, 2022
 Proxy Contest (June 2022)18 slides · Jun 27, 2022
 Proxy Contest (June 2022)41 slides · Jun 7, 2022
 Proxy Contest (May 2022)30 slides · May 25, 2022