Fauquier Bankshares — Investor Presentation (August 2016)
29 slides from Fauquier Bankshares's investor presentation, Aug 10, 2016
Slide 1: Fauquier Bankshares, Inc. August 2016
FAUQUIER BANKSHARES, INC. August 2016 NASDAQ: FBSS
Slide 2: Safe Harbor Statement
Safe Harbor Statement Certain statements in this presentation may constitute “forward-looking statements” within the meaning of the Private Securities Litigation Reform Act of 1995. Forward-looking statements are statements that include projections, predictions, expectations, or beliefs about future
Slide 3: Table of Contents
Table of Contents VisionManagementMarket OpportunitiesFinancial PerformanceBuilding Shareholder Value * FAUQUIER BANKSHARES, INC.
Slide 4: TFB's Guiding Principles
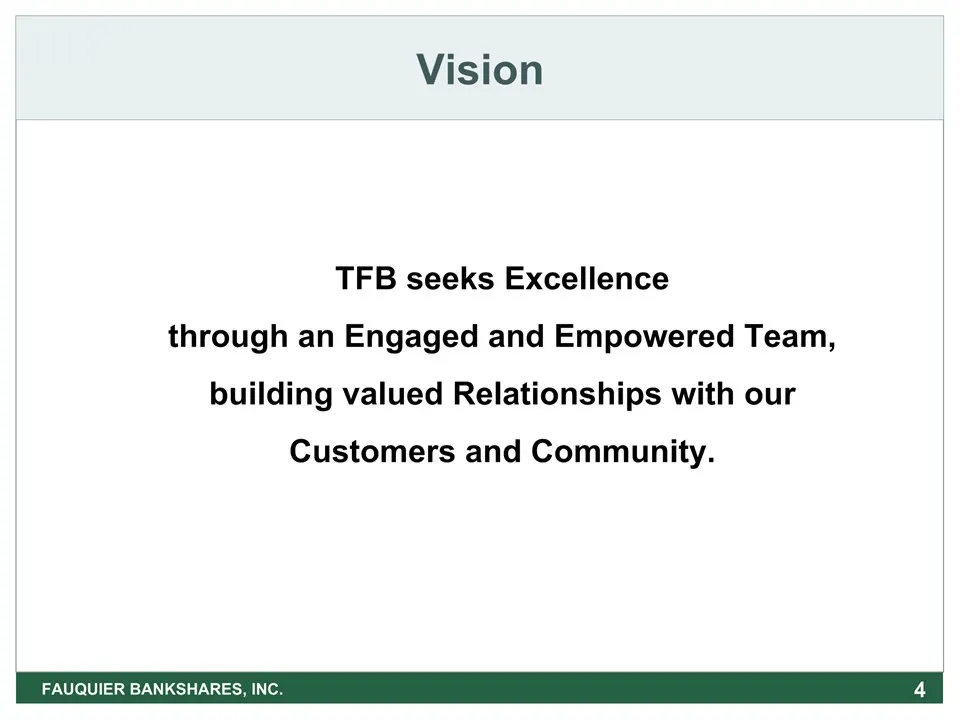
TFB’s Guiding Principles Vision TFB seeks Excellencethrough an Engaged and Empowered Team, building valued Relationships with our Customers and Community. FAUQUIER BANKSHARES, INC. *
Slide 5: Management
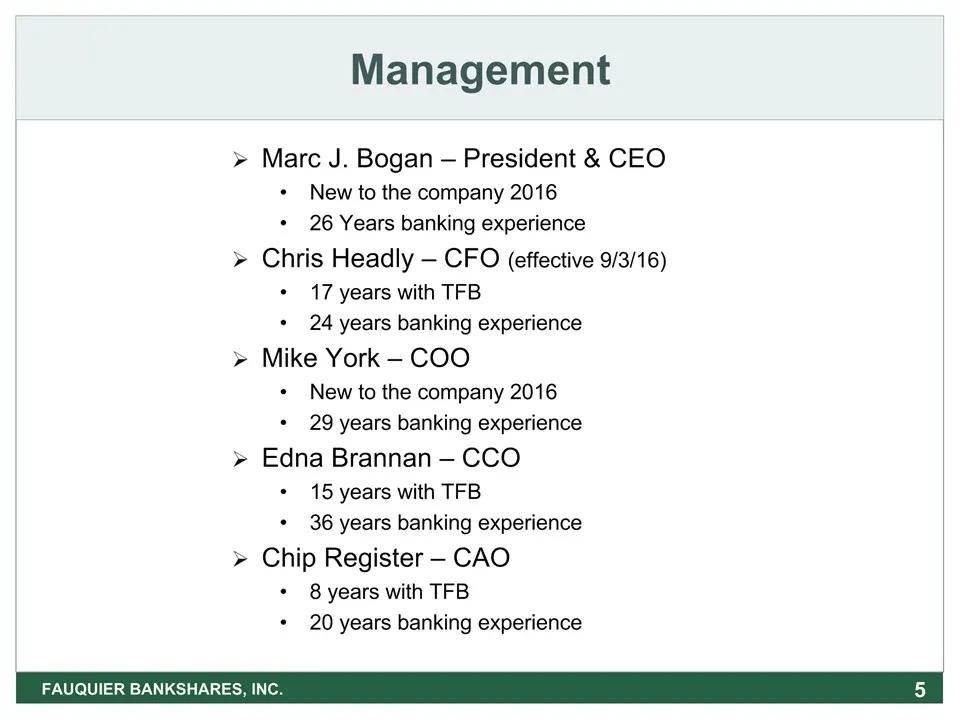
Management Marc J. Bogan – President & CEONew to the company 201626 Years banking experienceChris Headly – CFO (effective 9/3/16)17 years with TFB24 years banking experienceMike York – COONew to the company 201629 years banking experienceEdna Brannan – CCO15 years with TFB36 years banking experience
Slide 6: Summary Statistics
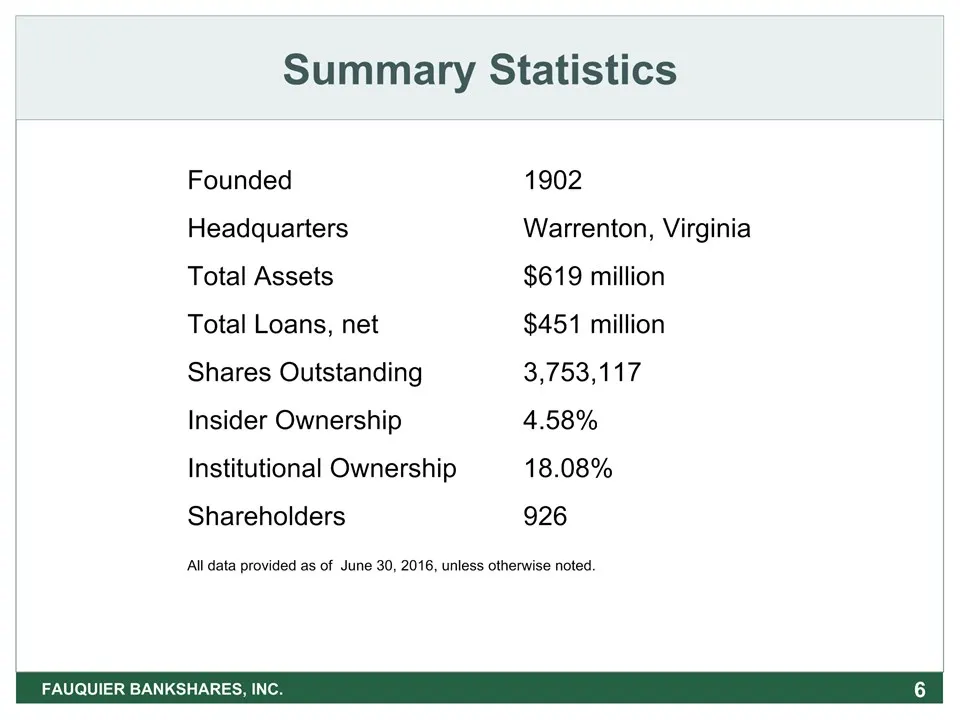
Summary Statistics Founded 1902Headquarters Warrenton, VirginiaTotal Assets $619 millionTotal Loans, net $451 millionShares Outstanding 3,753,117Insider Ownership 4.58%Institutional Ownership 18.08% Shareholders 926All data provided as of June 30, 2016, unless otherwise noted. * FAUQUIER BANKSHARES,
Slide 7: Northern Virginia Marketplace
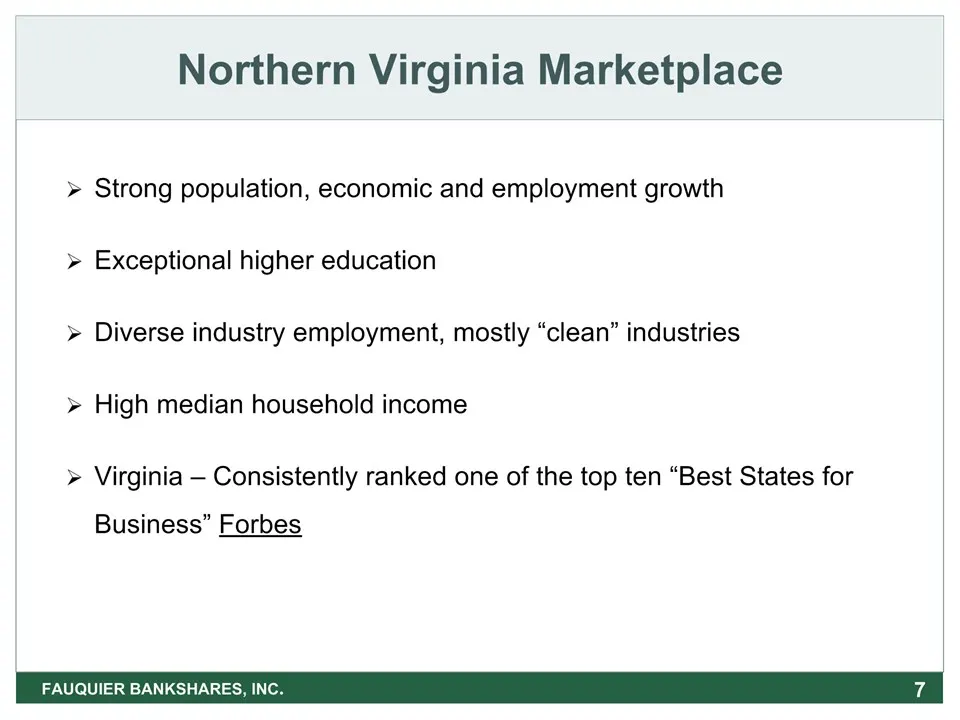
Northern Virginia Marketplace Strong population, economic and employment growthExceptional higher education Diverse industry employment, mostly “clean” industriesHigh median household incomeVirginia – Consistently ranked one of the top ten “Best States for Business” Forbes * FAUQUIER BANKSHARES, INC
Slide 8: Deposit Market Share
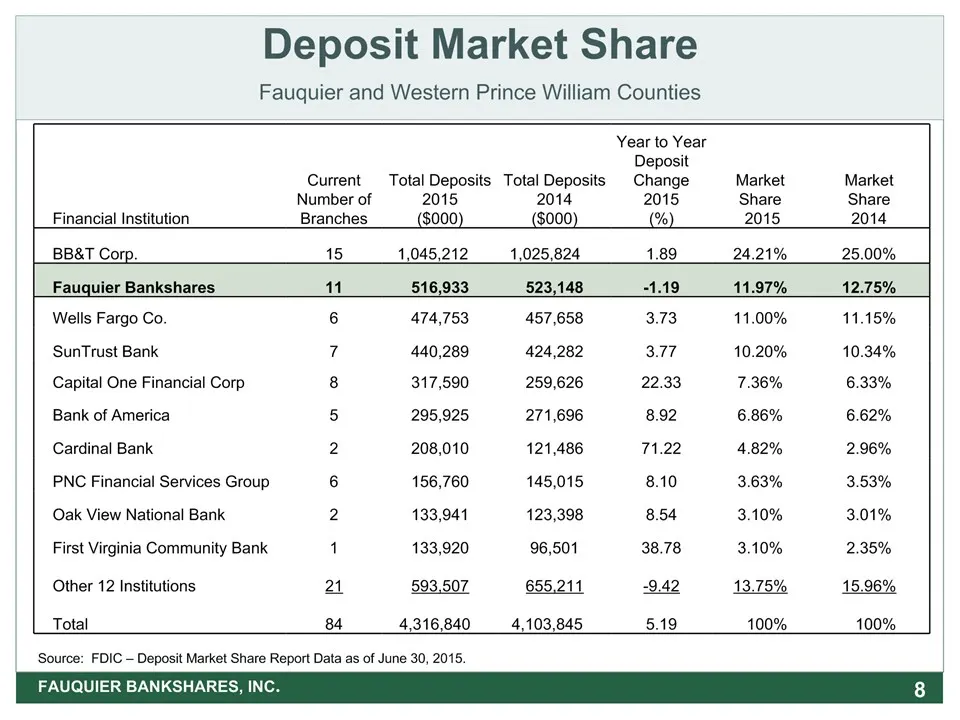
Deposit Market ShareFauquier and Western Prince William Counties Financial Institution Current Number ofBranches Total Deposits 2015($000) Total Deposits 2014($000) Year to Year Deposit Change 2015(%) MarketShare 2015 MarketShare2014 BB&T Corp. 15 1,045,212 1,025,824 1.89 24.21% 25.00% Fauquier Bank
Slide 9: Market Opportunities
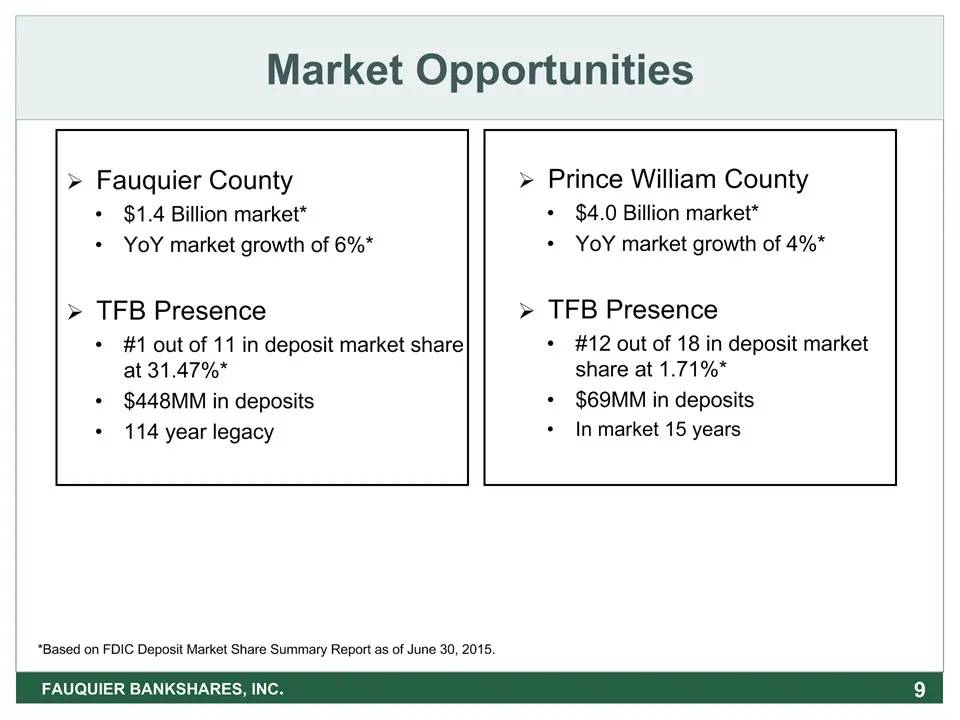
Market Opportunities * Fauquier County$1.4 Billion market*YoY market growth of 6%*TFB Presence#1 out of 11 in deposit market share at 31.47%*$448MM in deposits114 year legacy Prince William County$4.0 Billion market*YoY market growth of 4%*TFB Presence#12 out of 18 in deposit market share at 1.71%*$
Slide 10: Sustainable Growth Demographics
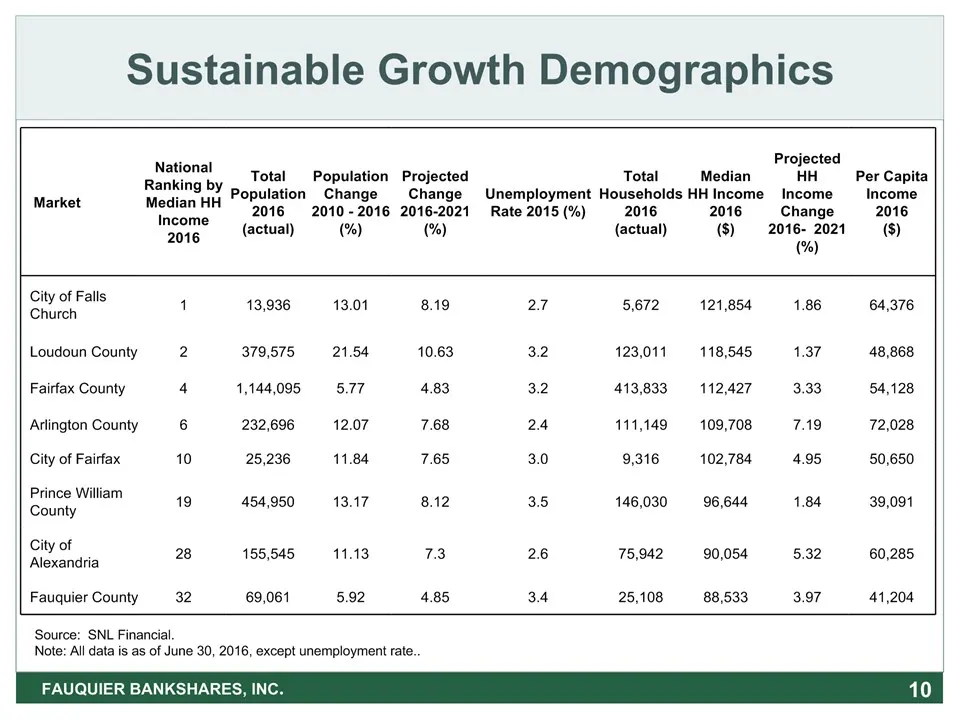
Sustainable Growth Demographics * FAUQUIER BANKSHARES, INC. Market National Ranking by Median HH Income 2016 TotalPopulation2016(actual) PopulationChange2010 - 2016(%) ProjectedChange2016-2021(%) Unemployment Rate 2015 (%) TotalHouseholds2016(actual) MedianHH Income2016($) Projected HHIncome Change2
Slide 11: Q2 and YTD Highlights
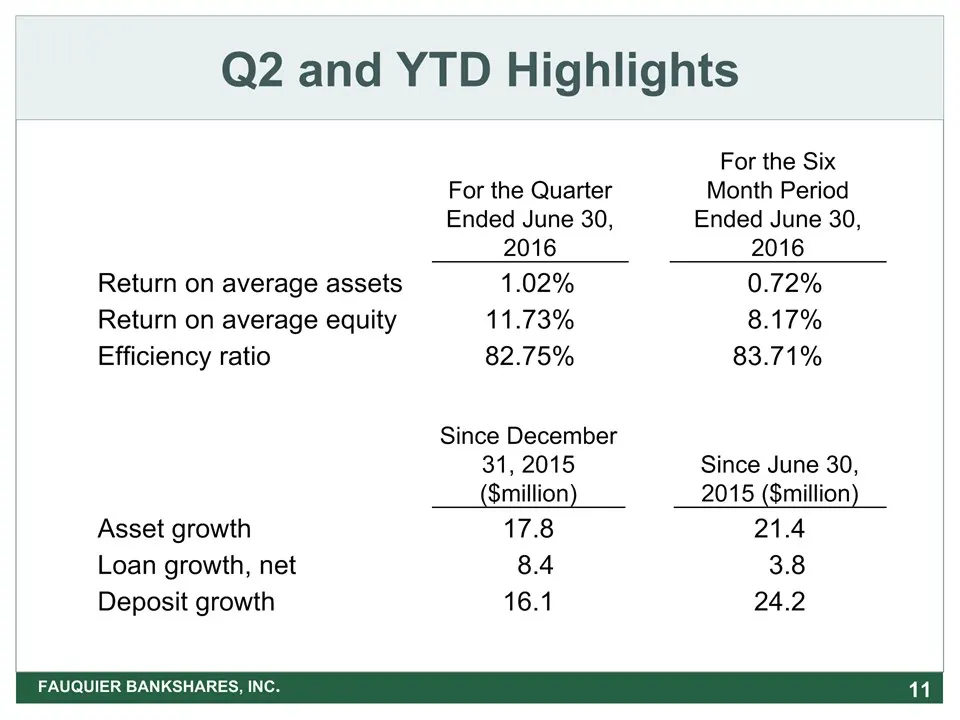
Q2 and YTD Highlights * For the Quarter Ended June 30, 2016 For the Six Month Period Ended June 30, 2016 Return on average assets 1.02% 0.72% Return on average equity 11.73% 8.17% Efficiency ratio 82.75% 83.71% Since December 31, 2015 ($million) Since June 30, 2015 ($million) Asset growth 17.8 21.4
Slide 12: Total Assets
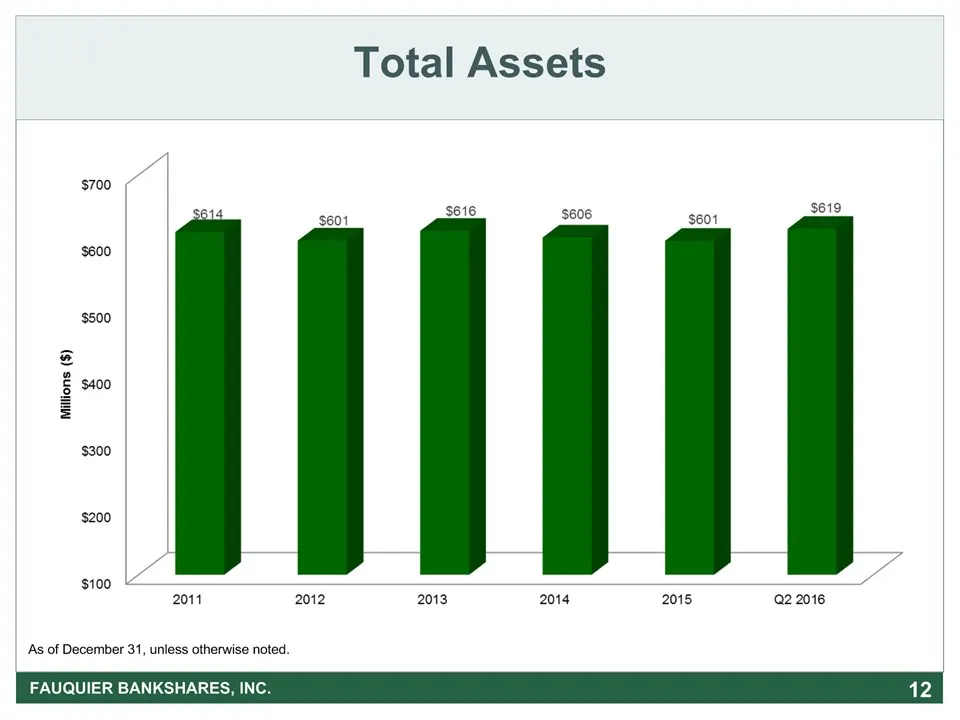
* Total Assets FAUQUIER BANKSHARES, INC. As of December 31, unless otherwise noted.
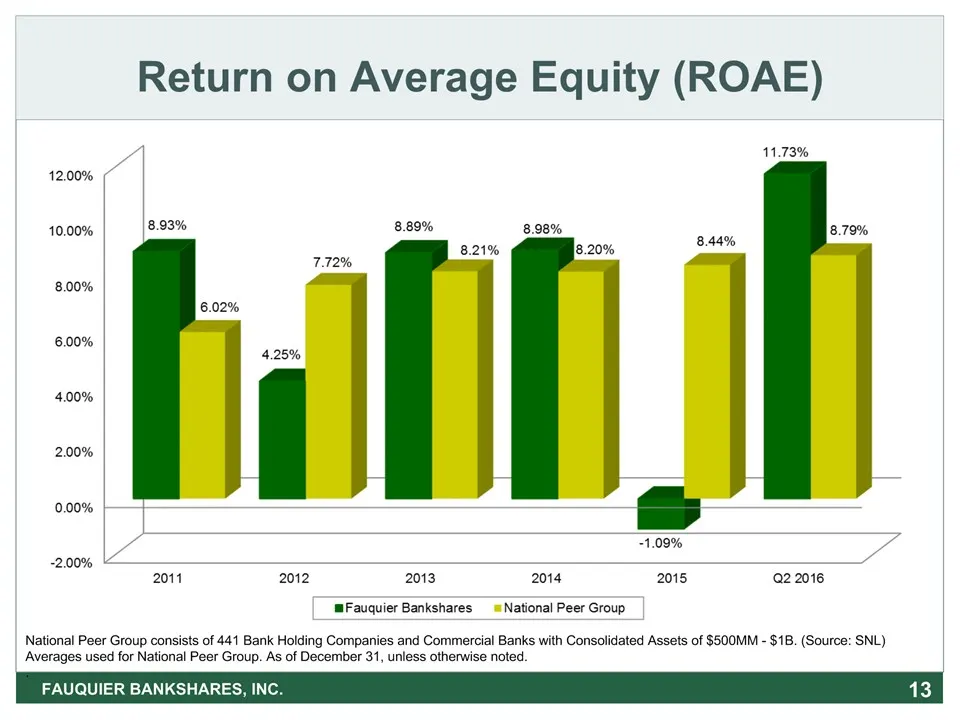
Slide 13: Return on Average Equity (ROAE)
Return on Average Equity (ROAE) FAUQUIER BANKSHARES, INC. * National Peer Group consists of 441 Bank Holding Companies and Commercial Banks with Consolidated Assets of $500MM - $1B. (Source: SNL)Averages used for National Peer Group. As of December 31, unless otherwise noted..
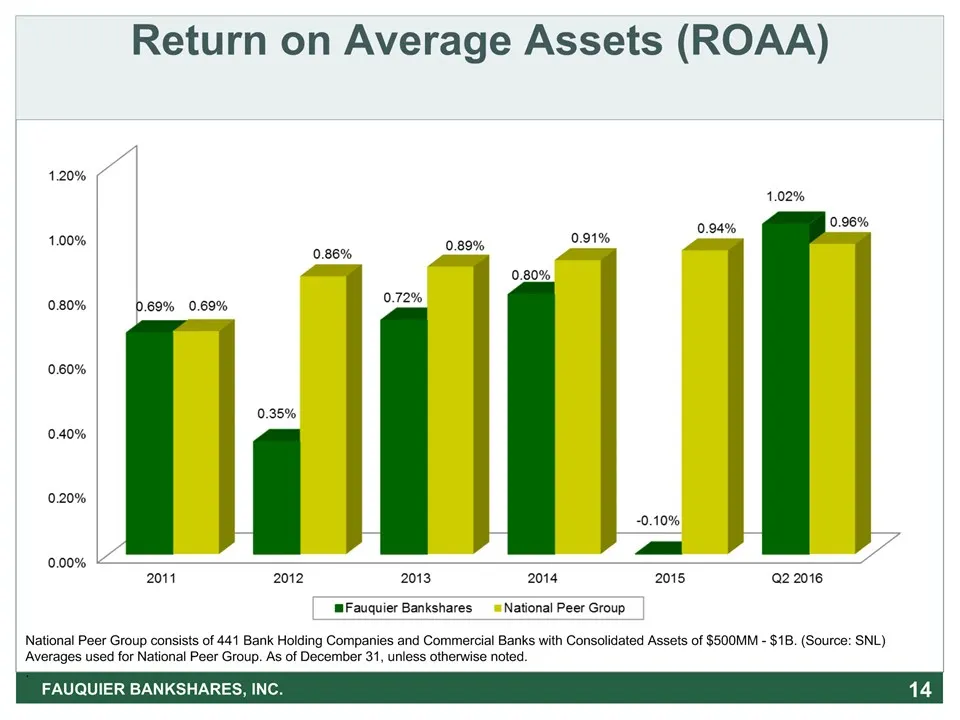
Slide 14: Return on Average Assets (ROAA)
* Return on Average Assets (ROAA) FAUQUIER BANKSHARES, INC. National Peer Group consists of 441 Bank Holding Companies and Commercial Banks with Consolidated Assets of $500MM - $1B. (Source: SNL)Averages used for National Peer Group. As of December 31, unless otherwise noted..
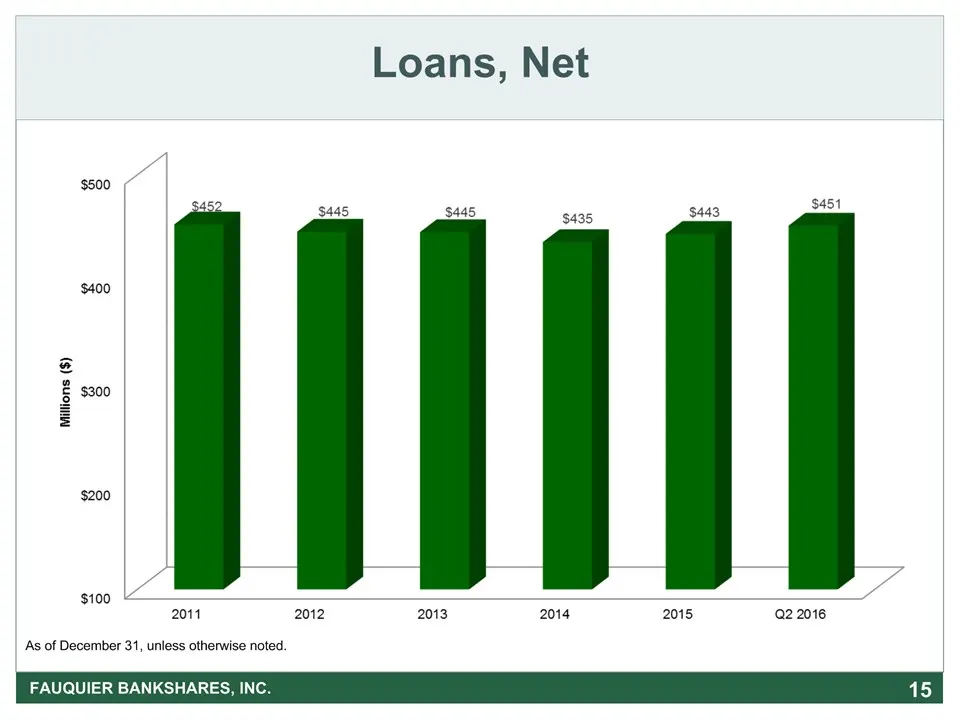
Slide 15: Loans, Net
* Loans, Net FAUQUIER BANKSHARES, INC. As of December 31, unless otherwise noted.
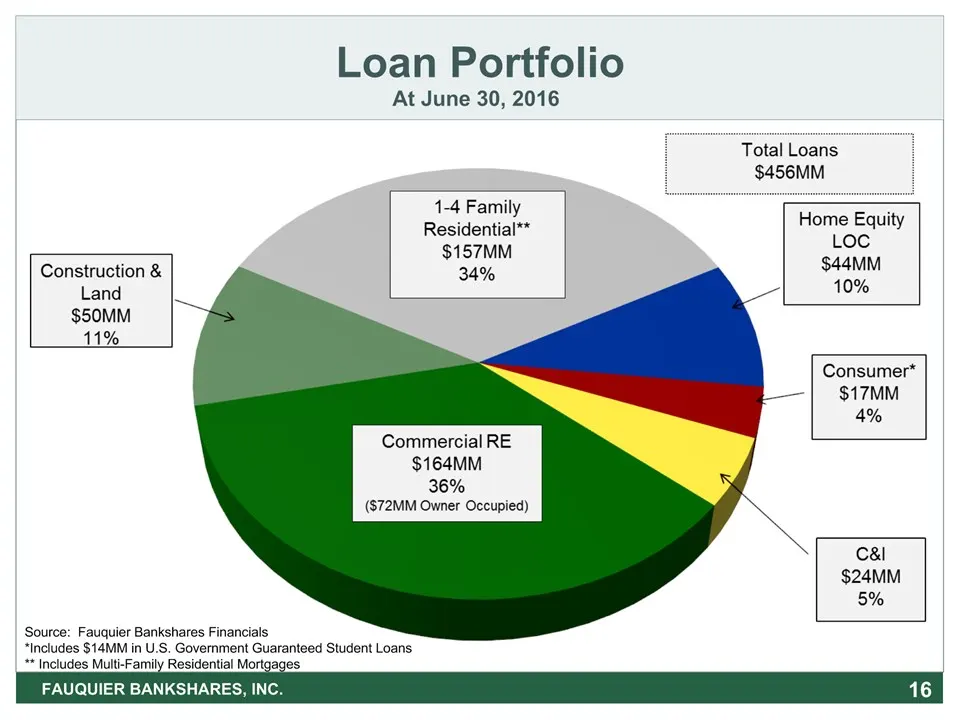
Slide 16: Loan Portfolio
* Loan Portfolio Loan Portfolio At June 30, 2016 FAUQUIER BANKSHARES, INC. Source: Fauquier Bankshares Financials *Includes $14MM in U.S. Government Guaranteed Student Loans** Includes Multi-Family Residential Mortgages
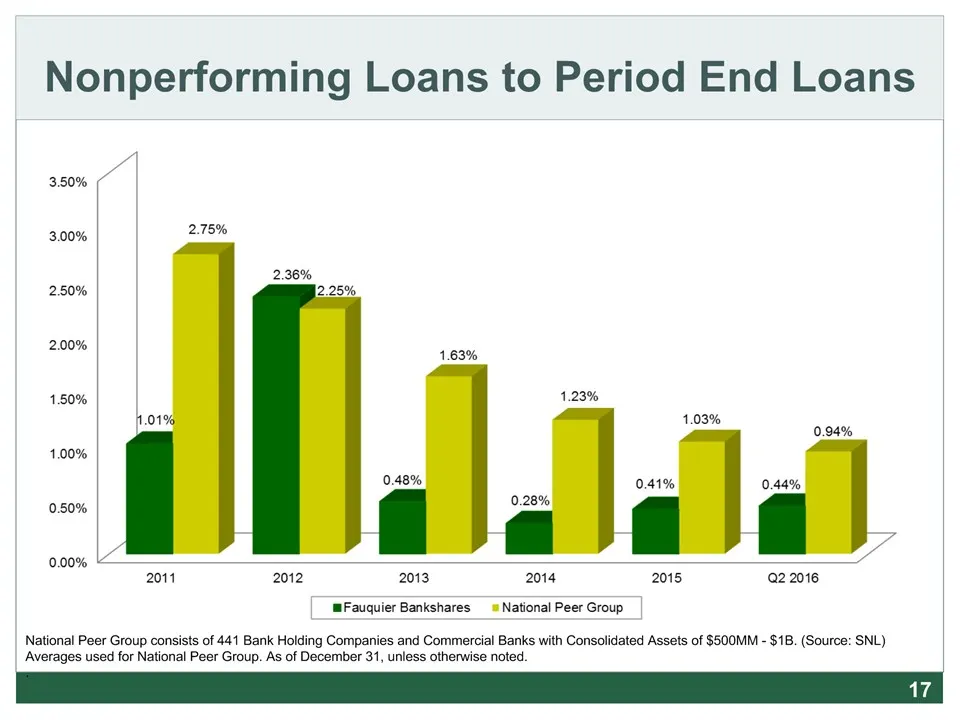
Slide 17: Nonperforming Loans to Period End Loans
* Nonperforming Loans to Period End Loans Nonperforming Loans to Period End Loans National Peer Group consists of 441 Bank Holding Companies and Commercial Banks with Consolidated Assets of $500MM - $1B. (Source: SNL)Averages used for National Peer Group. As of December 31, unless otherwise noted..
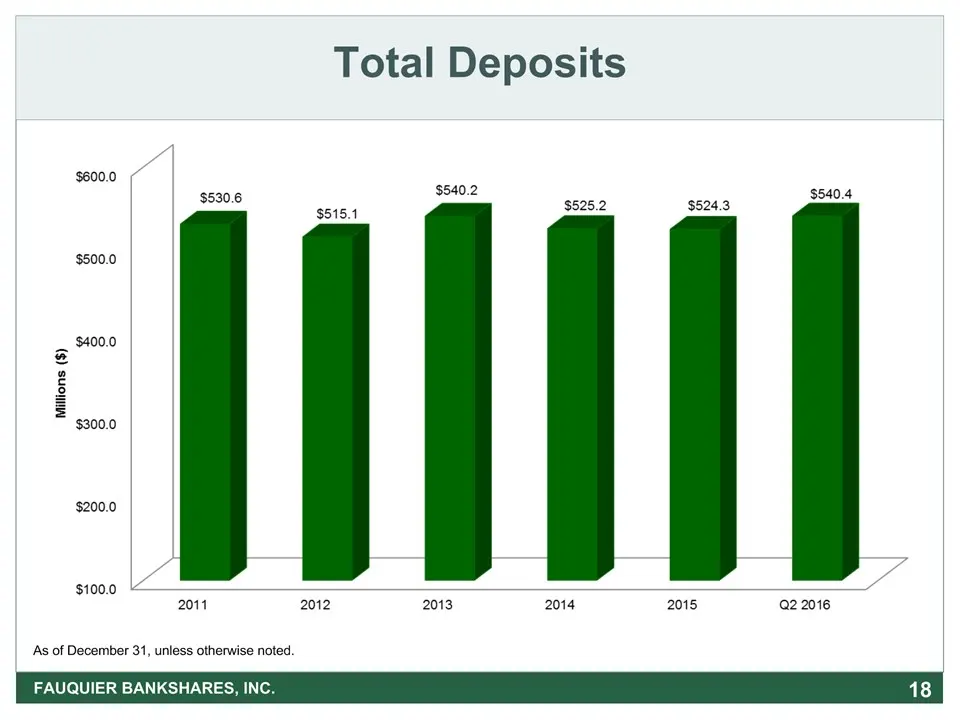
Slide 18: Total Deposits
* Total Deposits FAUQUIER BANKSHARES, INC. As of December 31, unless otherwise noted.
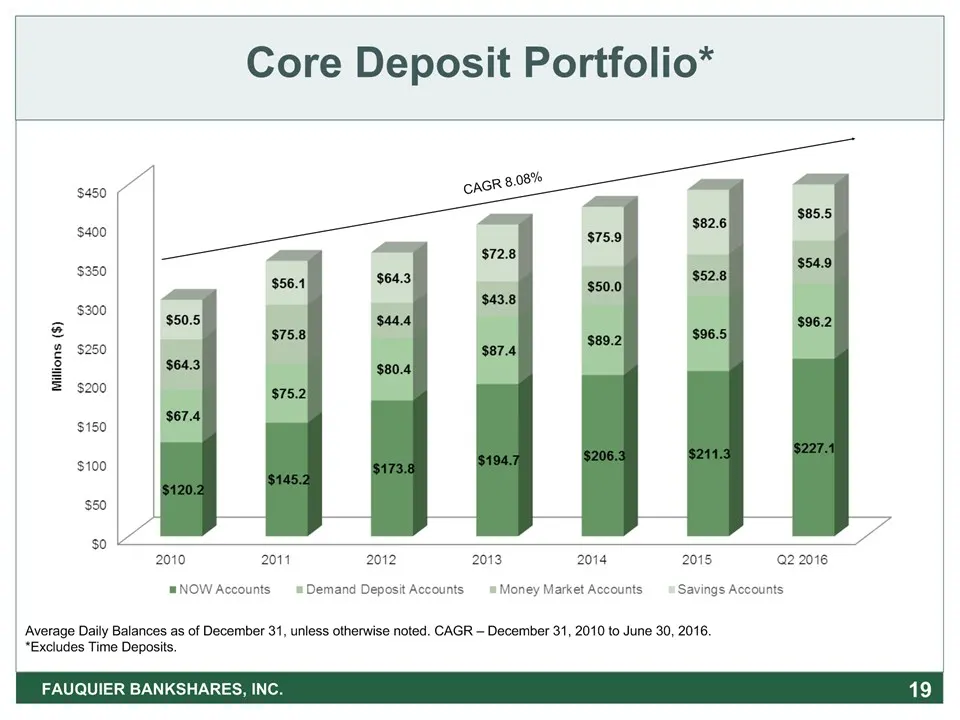
Slide 19: Core Deposit Portfolio
Core Deposit Portfolio* FAUQUIER BANKSHARES, INC. * Average Daily Balances as of December 31, unless otherwise noted. CAGR – December 31, 2010 to June 30, 2016.*Excludes Time Deposits. CAGR 8.08%
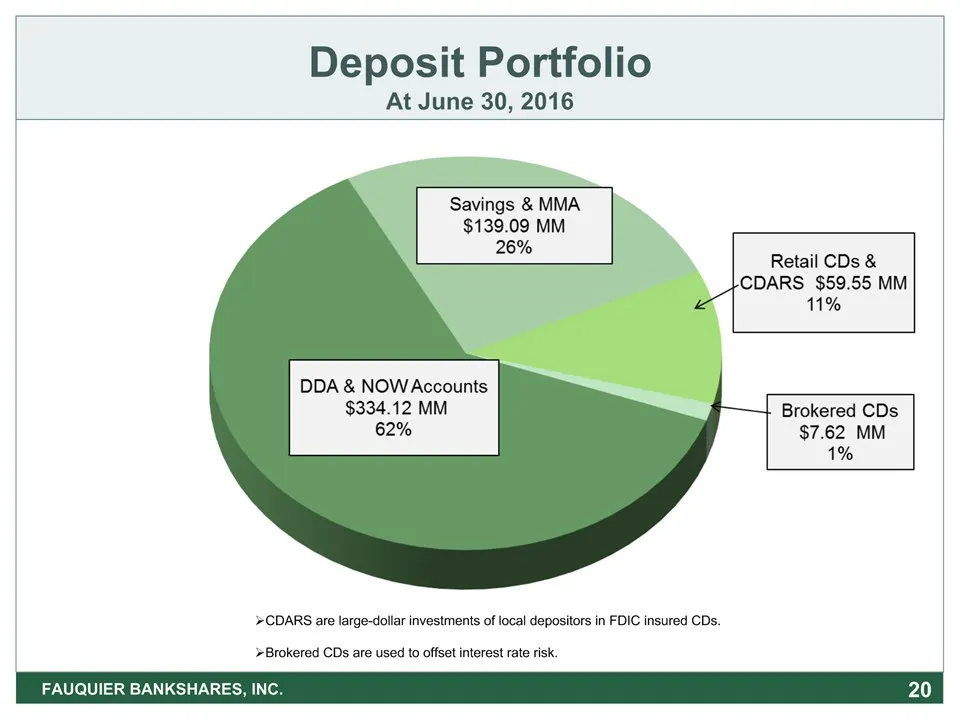
Slide 20: Deposit Portfolio
Deposit PortfolioAt June 30, 2016 FAUQUIER BANKSHARES, INC. CDARS are large-dollar investments of local depositors in FDIC insured CDs.Brokered CDs are used to offset interest rate risk. *
Slide 21: Cost of Funds
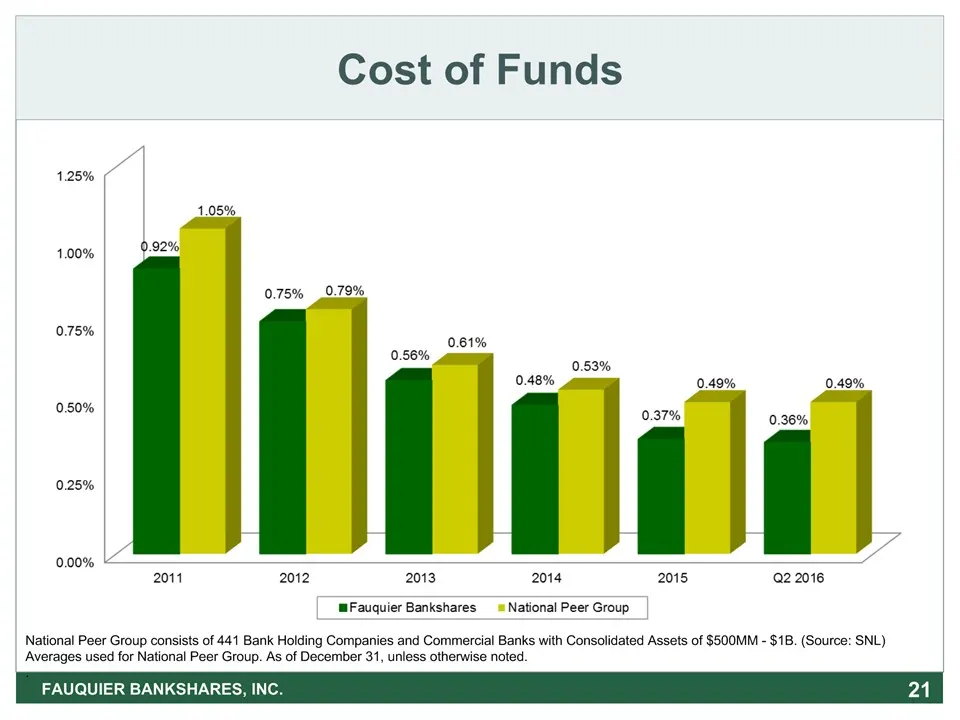
Cost of Funds * FAUQUIER BANKSHARES, INC. National Peer Group consists of 441 Bank Holding Companies and Commercial Banks with Consolidated Assets of $500MM - $1B. (Source: SNL)Averages used for National Peer Group. As of December 31, unless otherwise noted..
Slide 22: Net Interest Margin
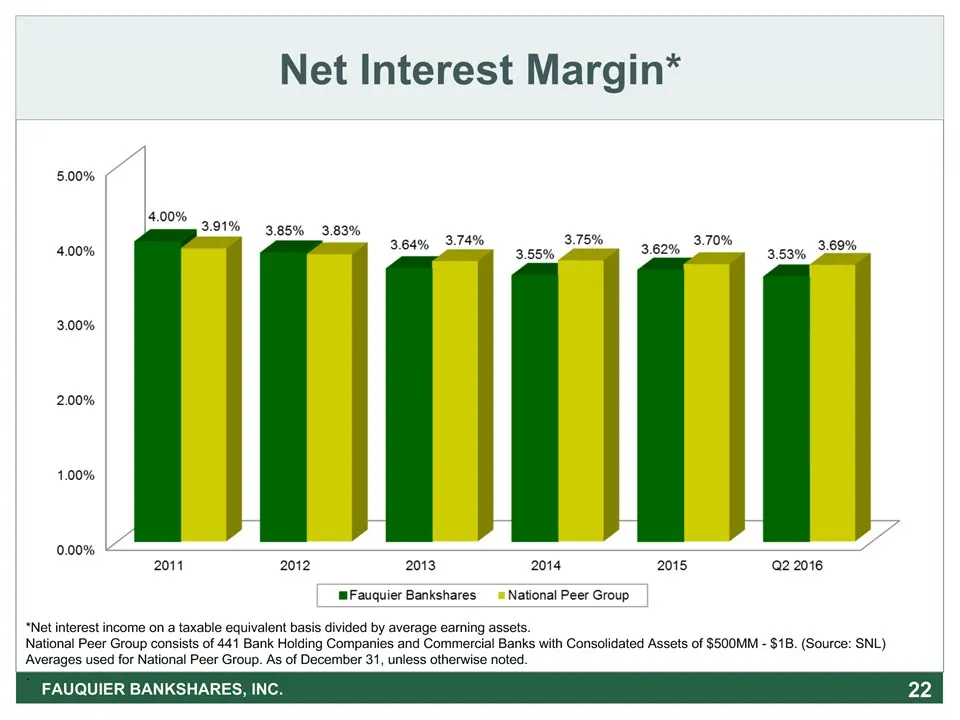
Net Interest Margin* * FAUQUIER BANKSHARES, INC. *Net interest income on a taxable equivalent basis divided by average earning assets.National Peer Group consists of 441 Bank Holding Companies and Commercial Banks with Consolidated Assets of $500MM - $1B. (Source: SNL)Averages used for National Peer
Slide 23: Tangible Equity to Assets Ratio
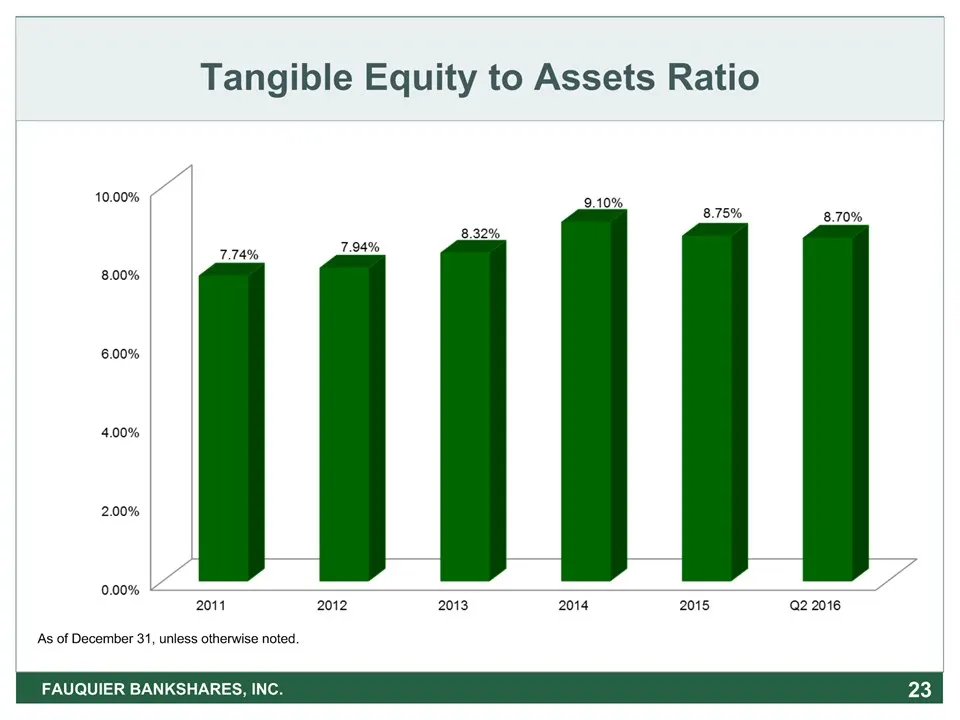
* FAUQUIER BANKSHARES, INC. Tangible Equity to Assets Ratio As of December 31, unless otherwise noted.
Slide 24: Total Non-Interest Income as a Percent of Average Assets
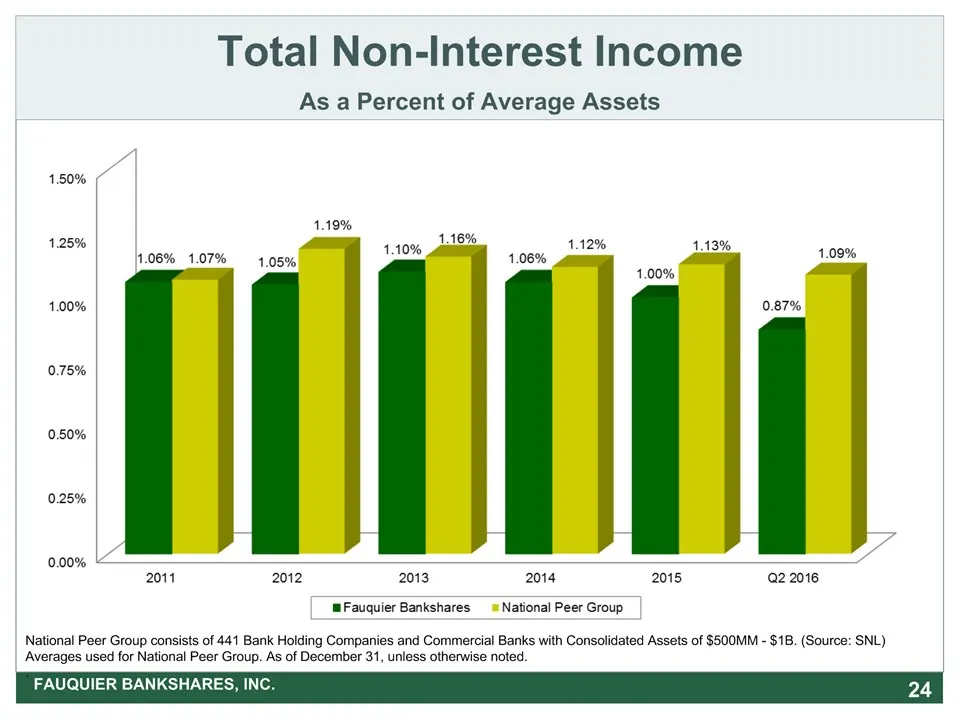
Total Non-Interest IncomeAs a Percent of Average Assets FAUQUIER BANKSHARES, INC. * National Peer Group consists of 441 Bank Holding Companies and Commercial Banks with Consolidated Assets of $500MM - $1B. (Source: SNL)Averages used for National Peer Group. As of December 31, unless otherwise noted.
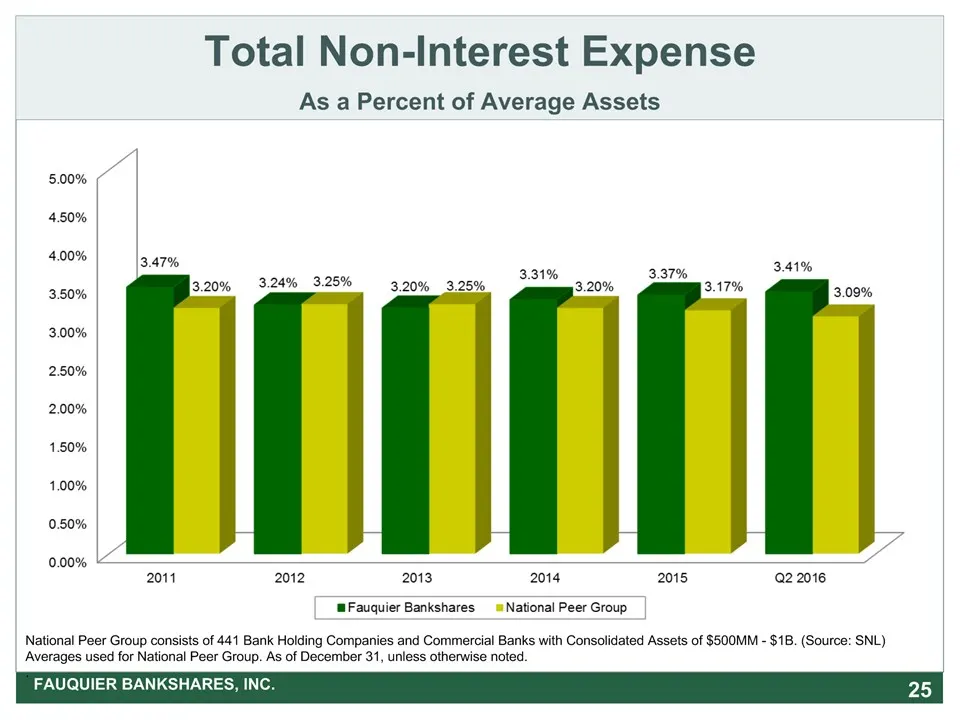
Slide 25: Total Non-Interest Expense as a Percent of Average Assets
Total Non-Interest ExpenseAs a Percent of Average Assets FAUQUIER BANKSHARES, INC. * National Peer Group consists of 441 Bank Holding Companies and Commercial Banks with Consolidated Assets of $500MM - $1B. (Source: SNL)Averages used for National Peer Group. As of December 31, unless otherwise noted
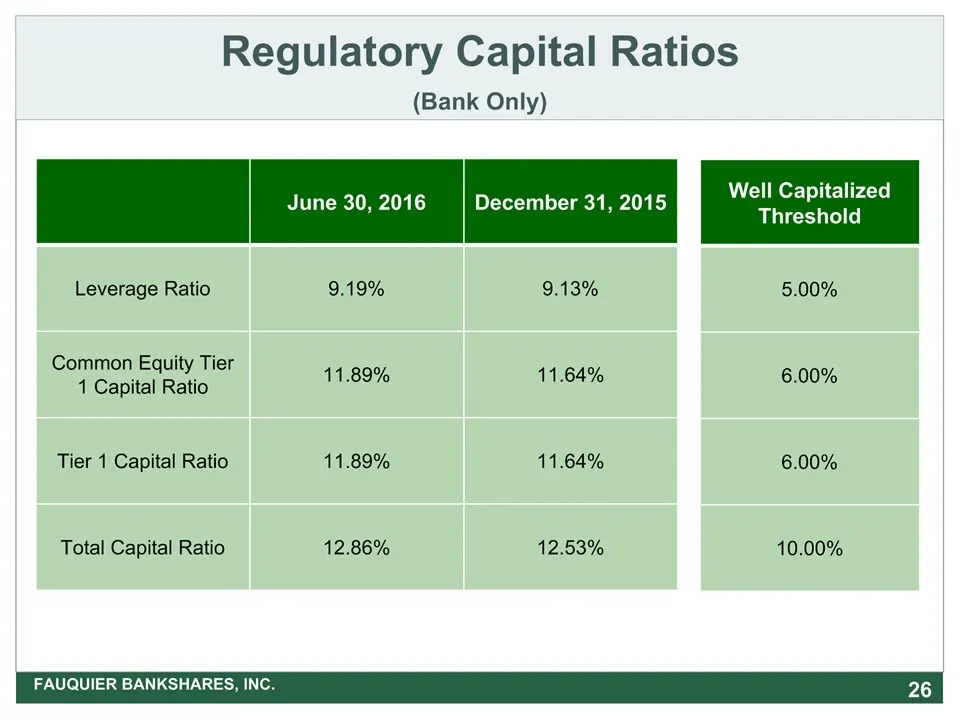
Slide 26: Regulatory Capital Ratios (Bank Only)
Regulatory Capital Ratios(Bank Only) FAUQUIER BANKSHARES, INC. * June 30, 2016 December 31, 2015 Leverage Ratio 9.19% 9.13% Common Equity Tier 1 Capital Ratio 11.89% 11.64% Tier 1 Capital Ratio 11.89% 11.64% Total Capital Ratio 12.86% 12.53% Well Capitalized Threshold 5.00% 6.00% 6.00% 10.00%
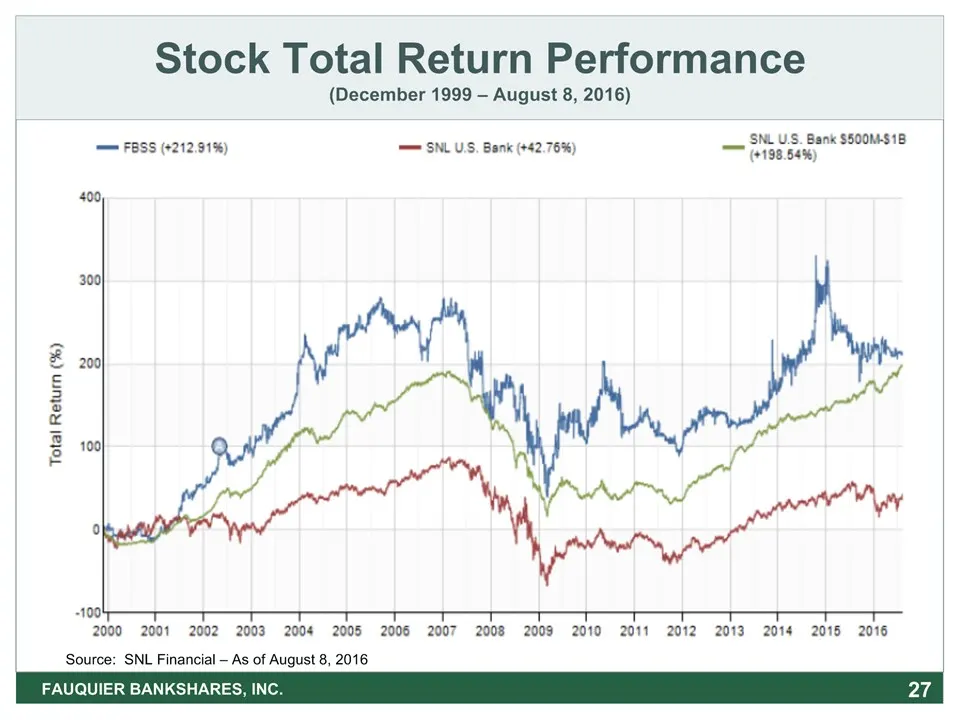
Slide 27: Stock Total Return Performance
* Stock Total Return Performance(December 1999 – August 8, 2016) FAUQUIER BANKSHARES, INC. Source: SNL Financial – As of August 8, 2016
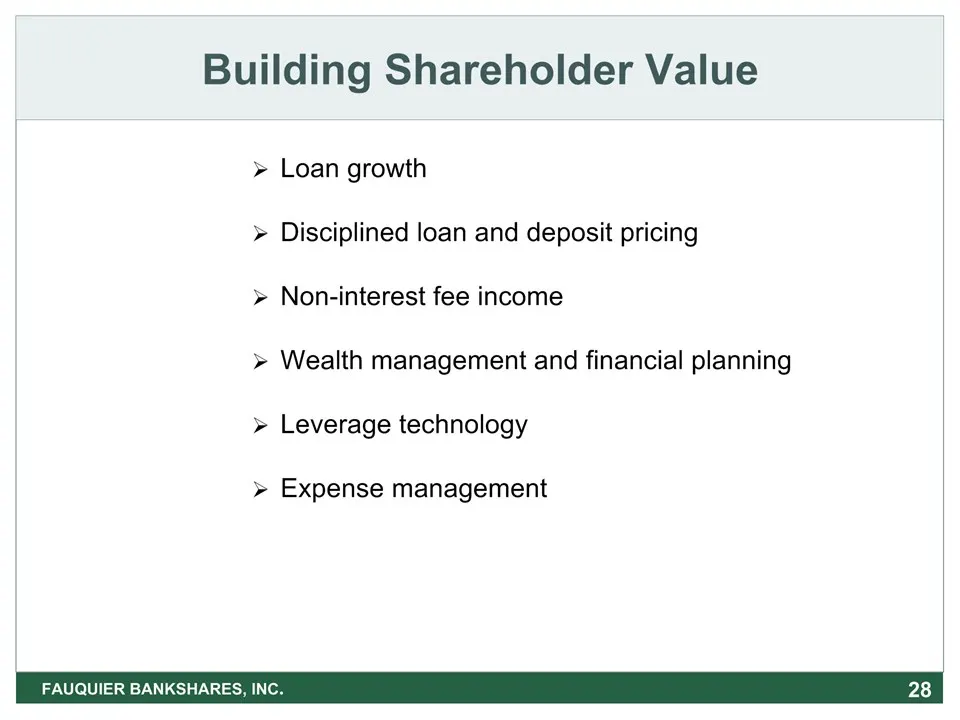
Slide 28: Building Shareholder Value
Building Shareholder Value * FAUQUIER BANKSHARES, INC. Loan growth Disciplined loan and deposit pricing Non-interest fee incomeWealth management and financial planningLeverage technologyExpense management
Slide 29: Contact Information
Contact Information Investor Relations ContactsMarc J. BoganPresident & Chief Executive [email protected] HeadlyExecutive Vice President& Chief Financial [email protected] JenkinsShareholder Relations [email protected] FAUQUIER BANKS
Source: SEC EDGAR · 8-K filed Aug 10, 2016
More decks from Fauquier Bankshares Inc
 Merger or Acquisition (October 2020)20 slides · Oct 1, 2020
 Shareholder Meeting (May 2020)30 slides · May 19, 2020
 Investor Presentation (August 2019)20 slides · Aug 7, 2019
 Shareholder Meeting (May 2019)31 slides · May 21, 2019
 Investor Presentation (October 2018)18 slides · Oct 22, 2018
 Shareholder Meeting (May 2018)33 slides · May 15, 2018