Pinnacle Foods — Debt Investor Presentation (January 2016)
48 slides from Pinnacle Foods's debt investor presentation, Jan 6, 2016
Slide 1: Lender Presentation
Exhibit 99.1 Lender Presentation January 6, 2016
Slide 2: Forward-Looking Statements & Non-GAAP Financial Measures
Forward-Looking Statements & Non-GAAP Financial Measures This presentation contains “forward-looking statements” within the meaning of U.S. federal securities laws. Forward-looking statements are not historical facts, and are based upon management’s current expectations, beliefs, projections and tar
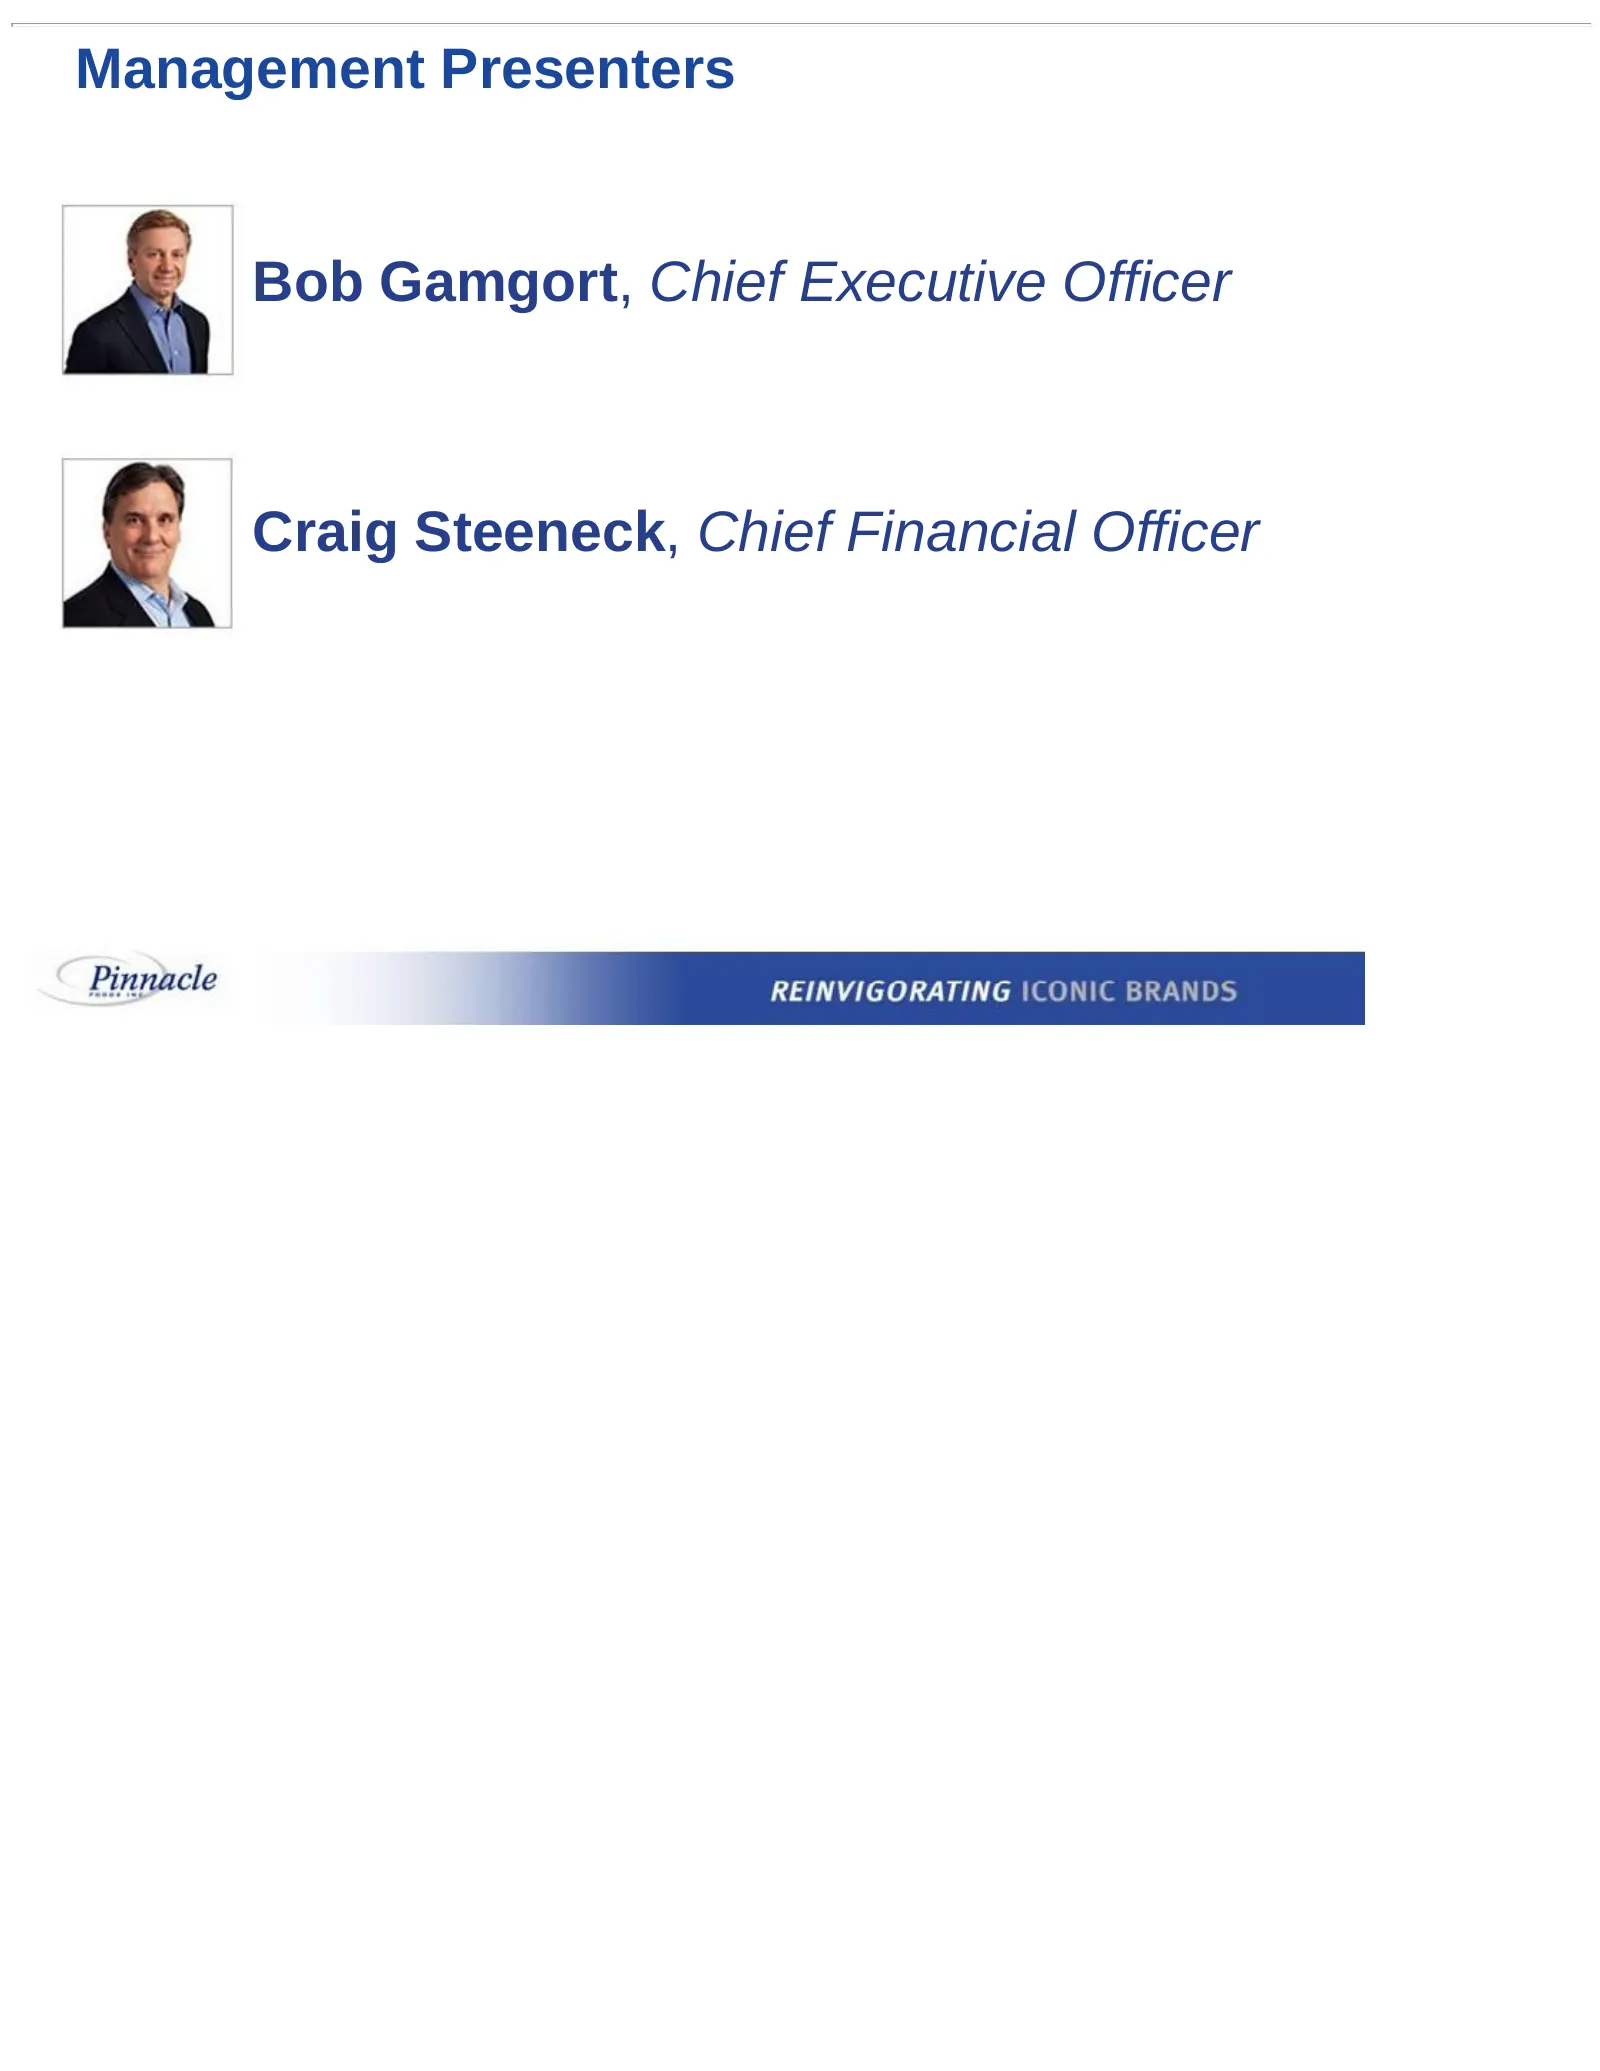
Slide 3: Management Presenters
Management Presenters Bob Gamgort, Chief Executive Officer Craig Steeneck, Chief Financial Officer
Slide 4: Agenda
Agenda Transaction Overview Credit Highlights Pinnacle Business Update Boulder Brands Opportunity
Slide 5: Transaction Rationale
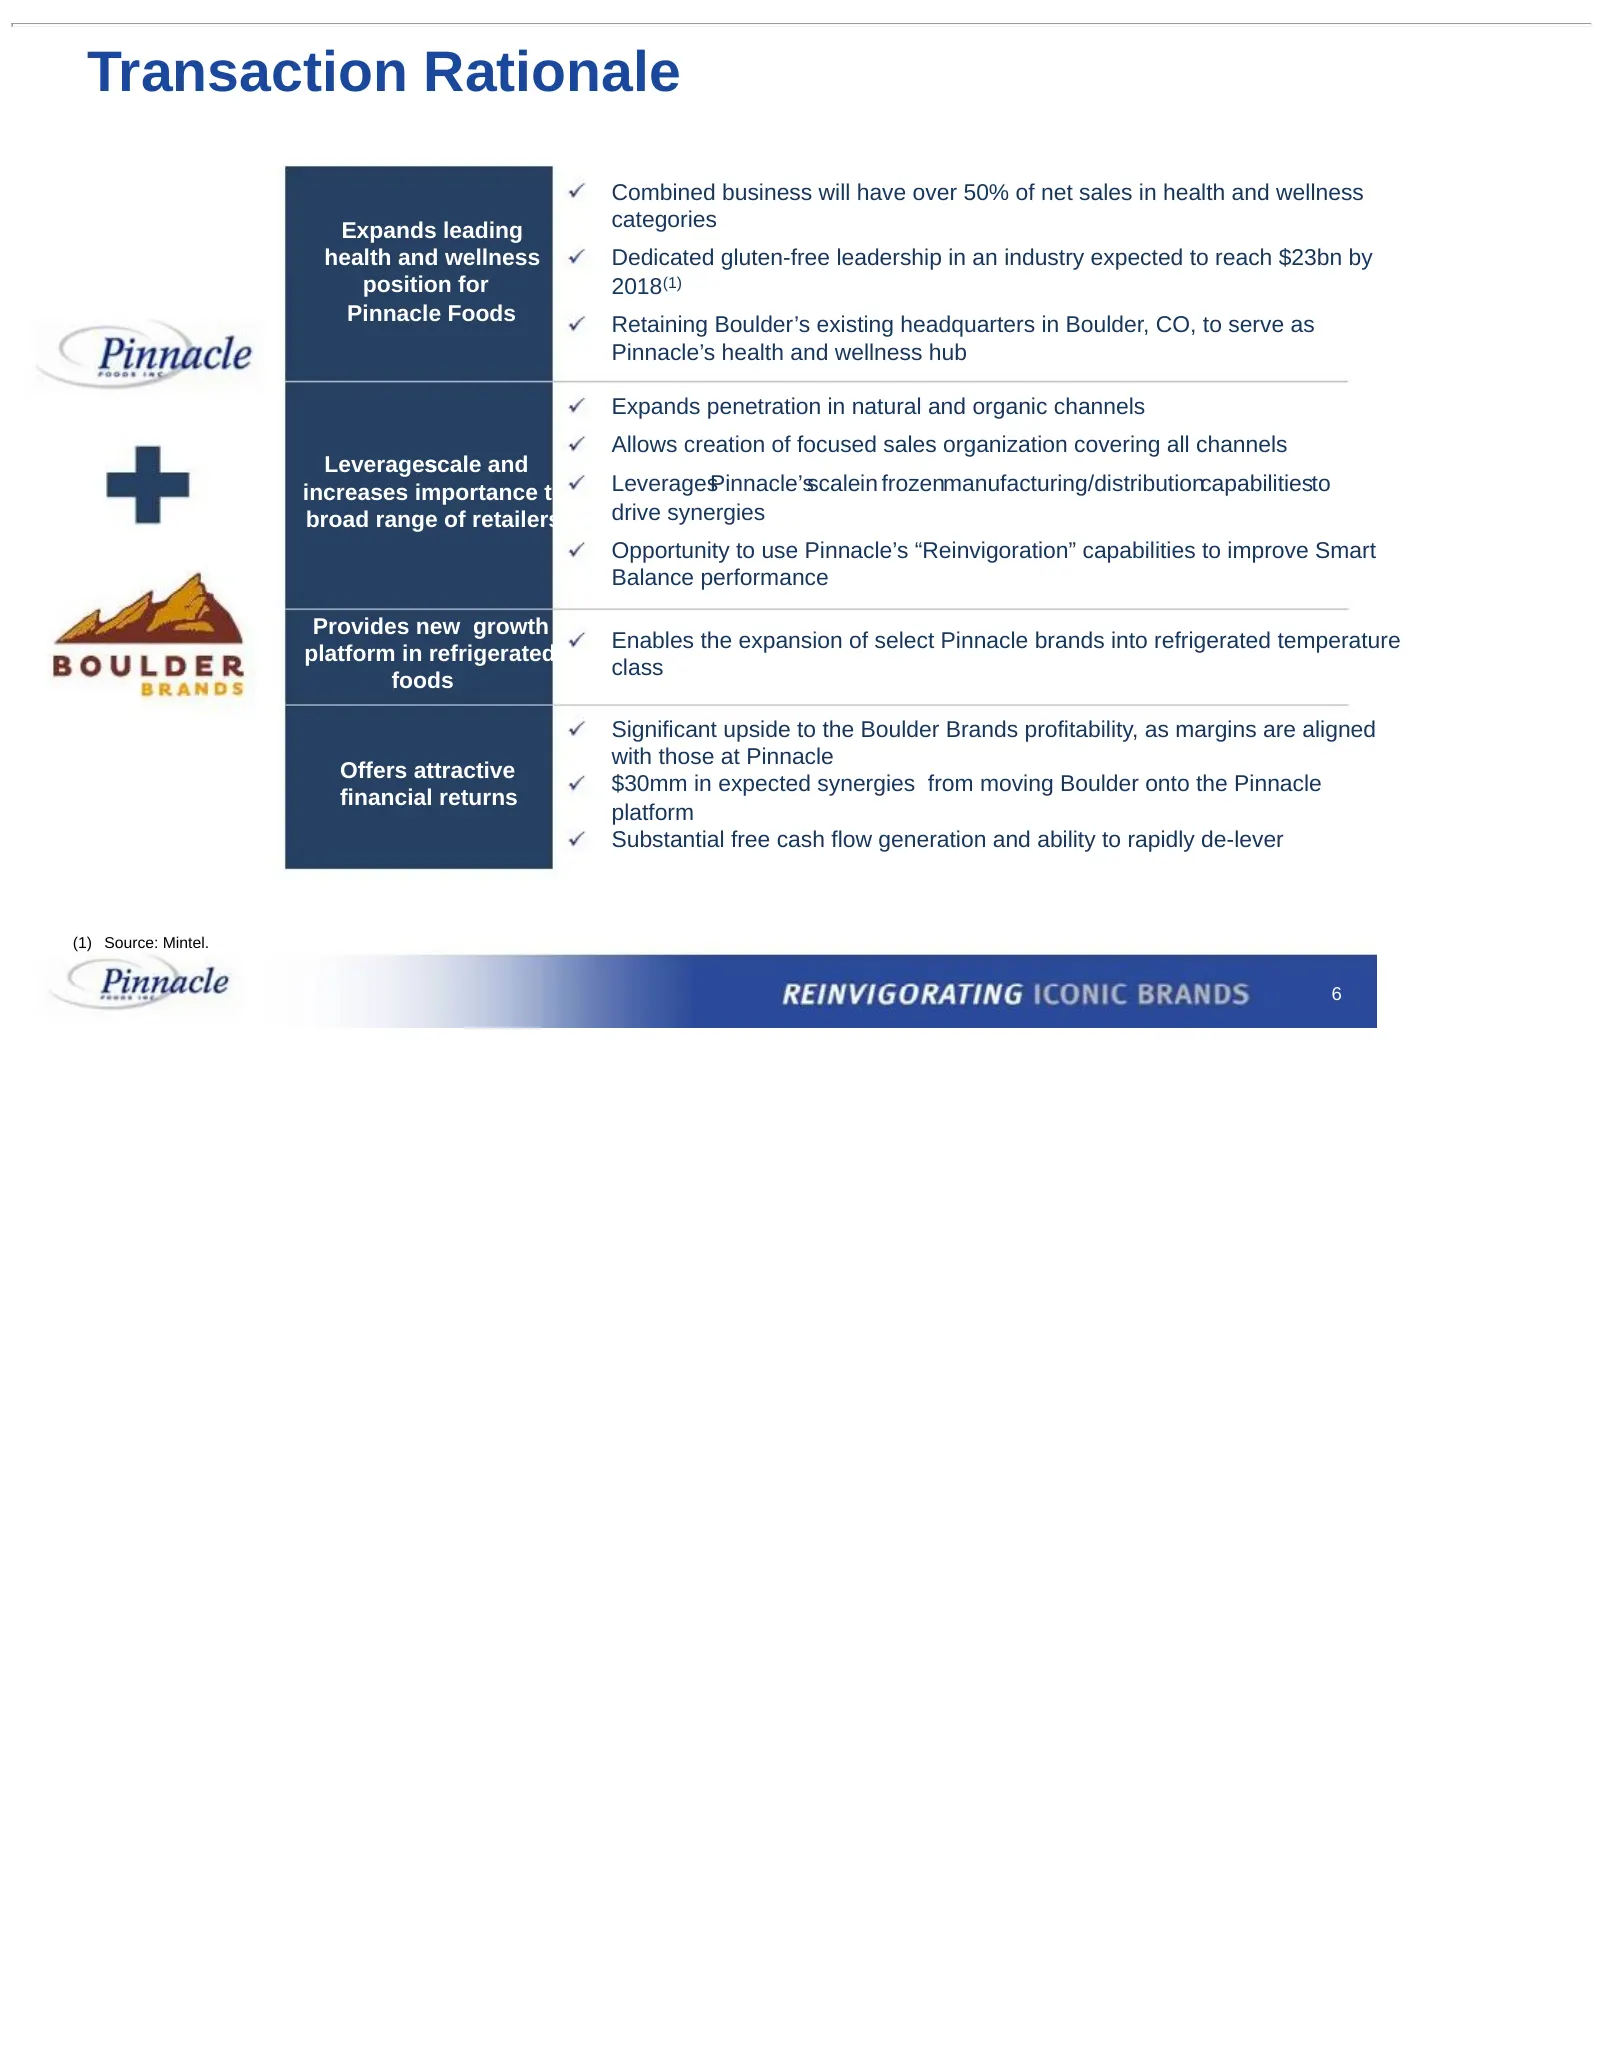
Transaction Rationale Combined business will have over 50% of net sales in health and wellness categories Expands leading health and wellness Dedicated gluten-free leadership in an industry expected to reach $23bn by position for 2018(1) Pinnacle Foods Retaining Boulder’s existing headquarters in Bo
Slide 6: Credit Highlights
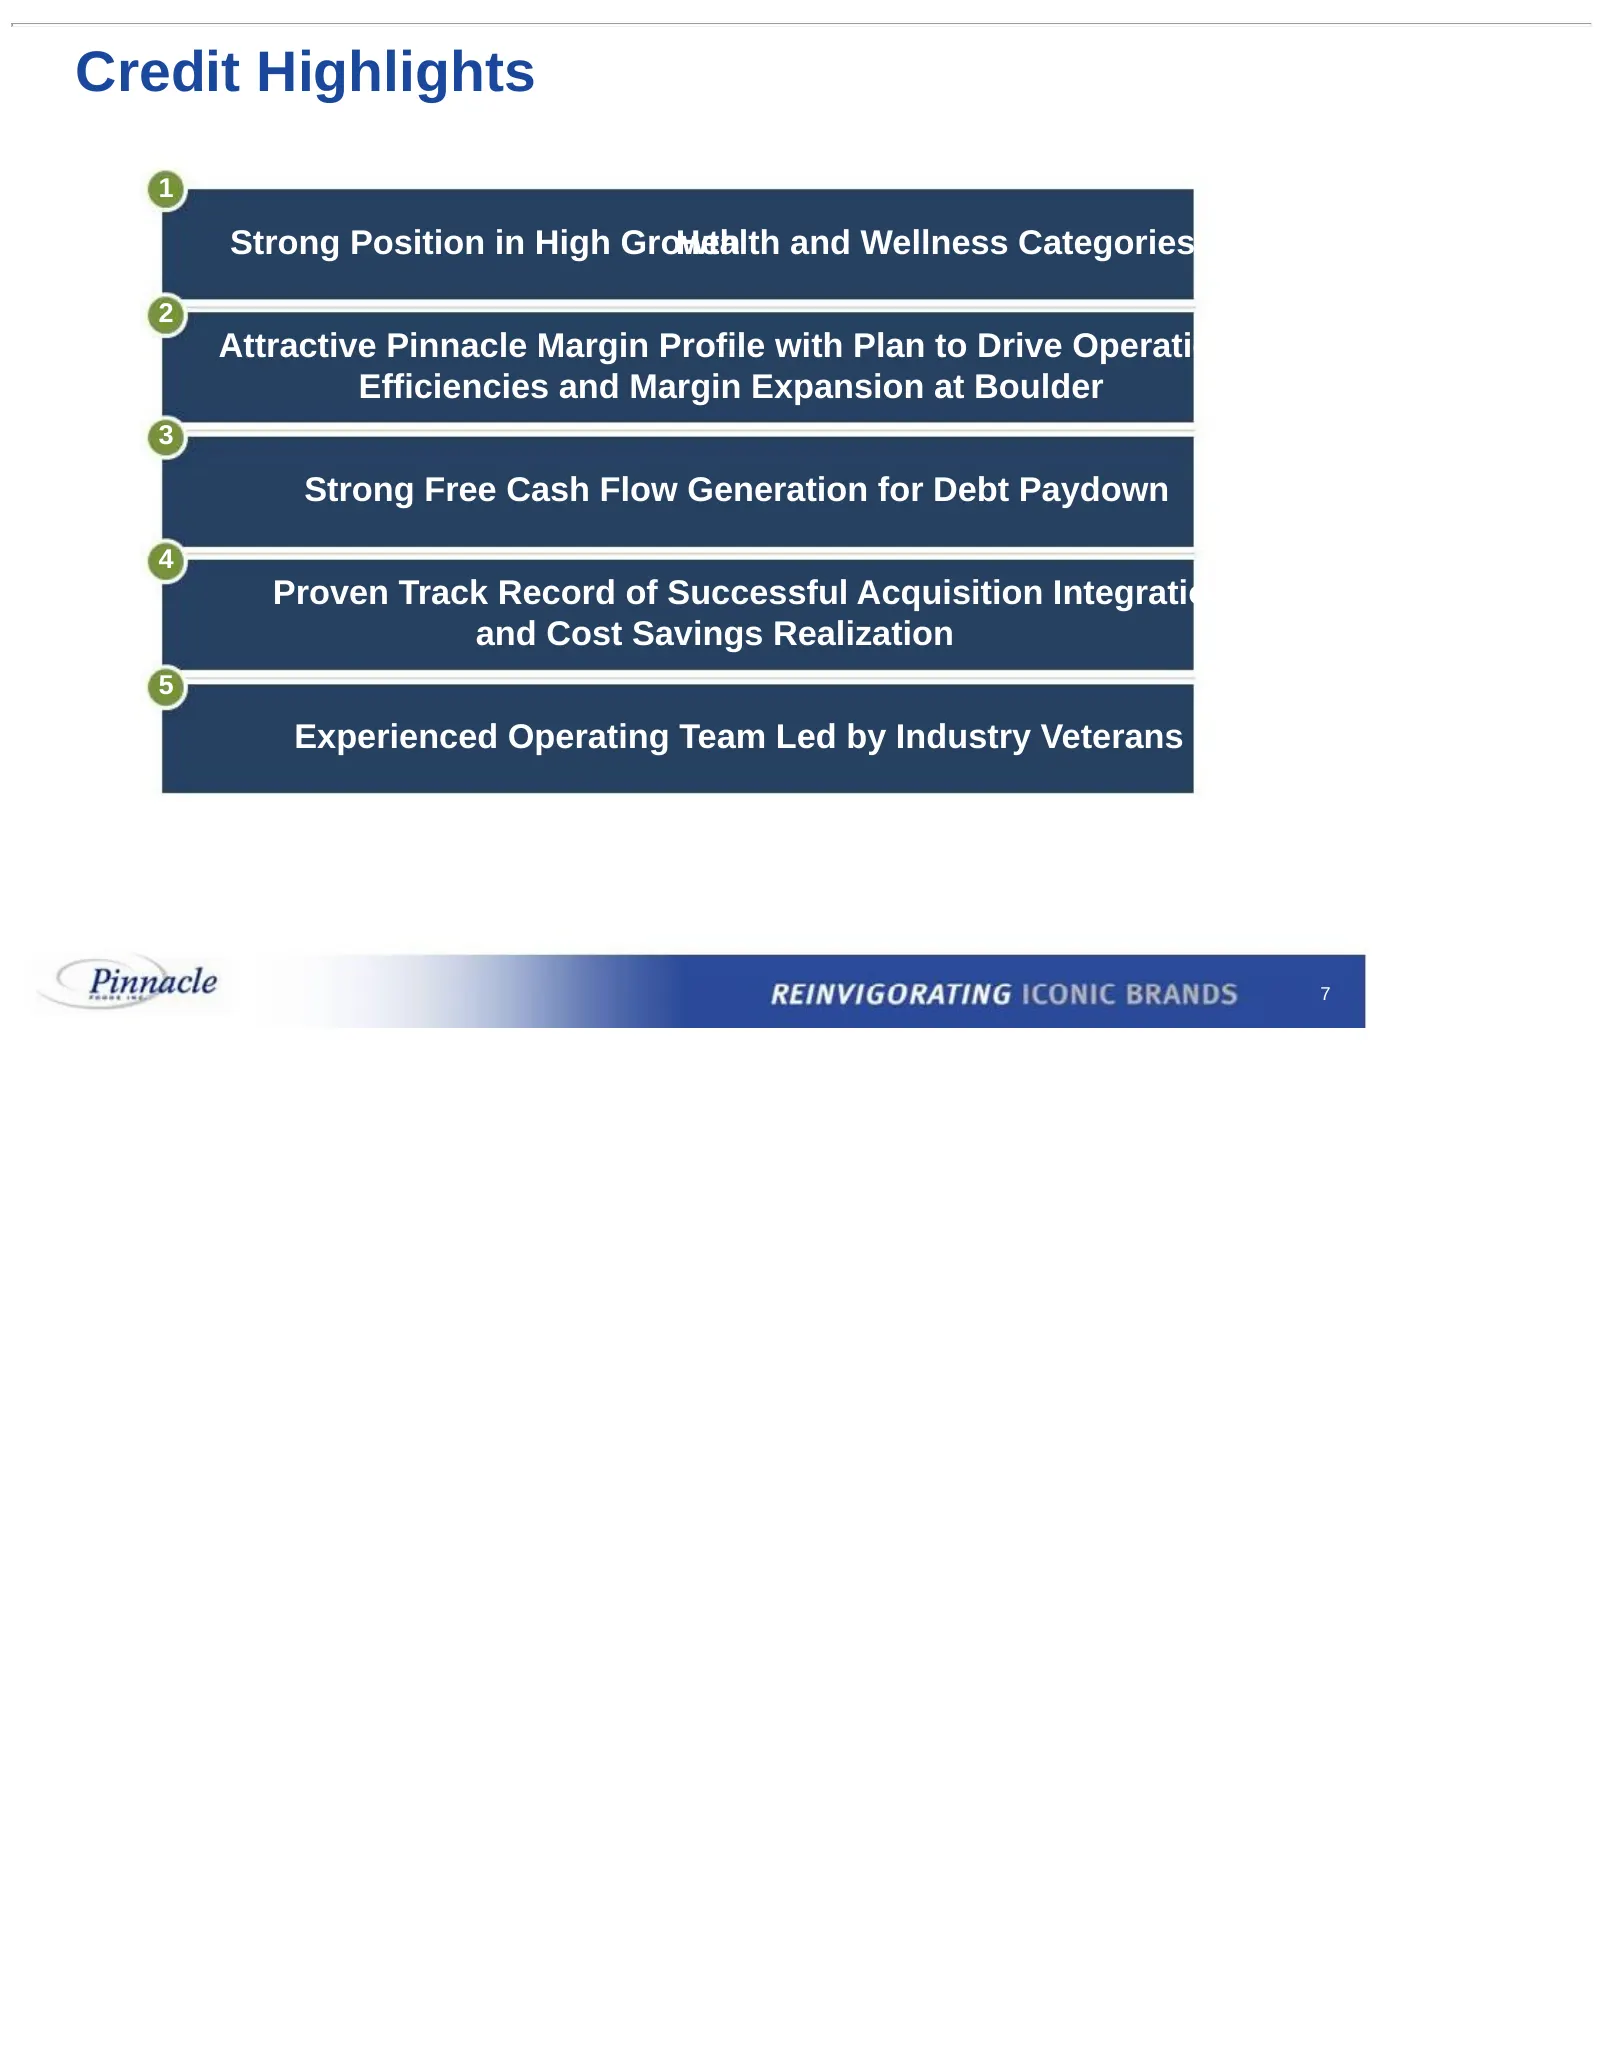
Credit Highlights 1 Strong Position in High Growth Health and Wellness Categories 2 Attractive Pinnacle Margin Profile with Plan to Drive Operational Efficiencies and Margin Expansion at Boulder 3 Strong Free Cash Flow Generation for Debt Paydown 4 Proven Track Record of Successful Acquisition Integ
Slide 7: Strong Position in High Growth Health & Wellness Categories
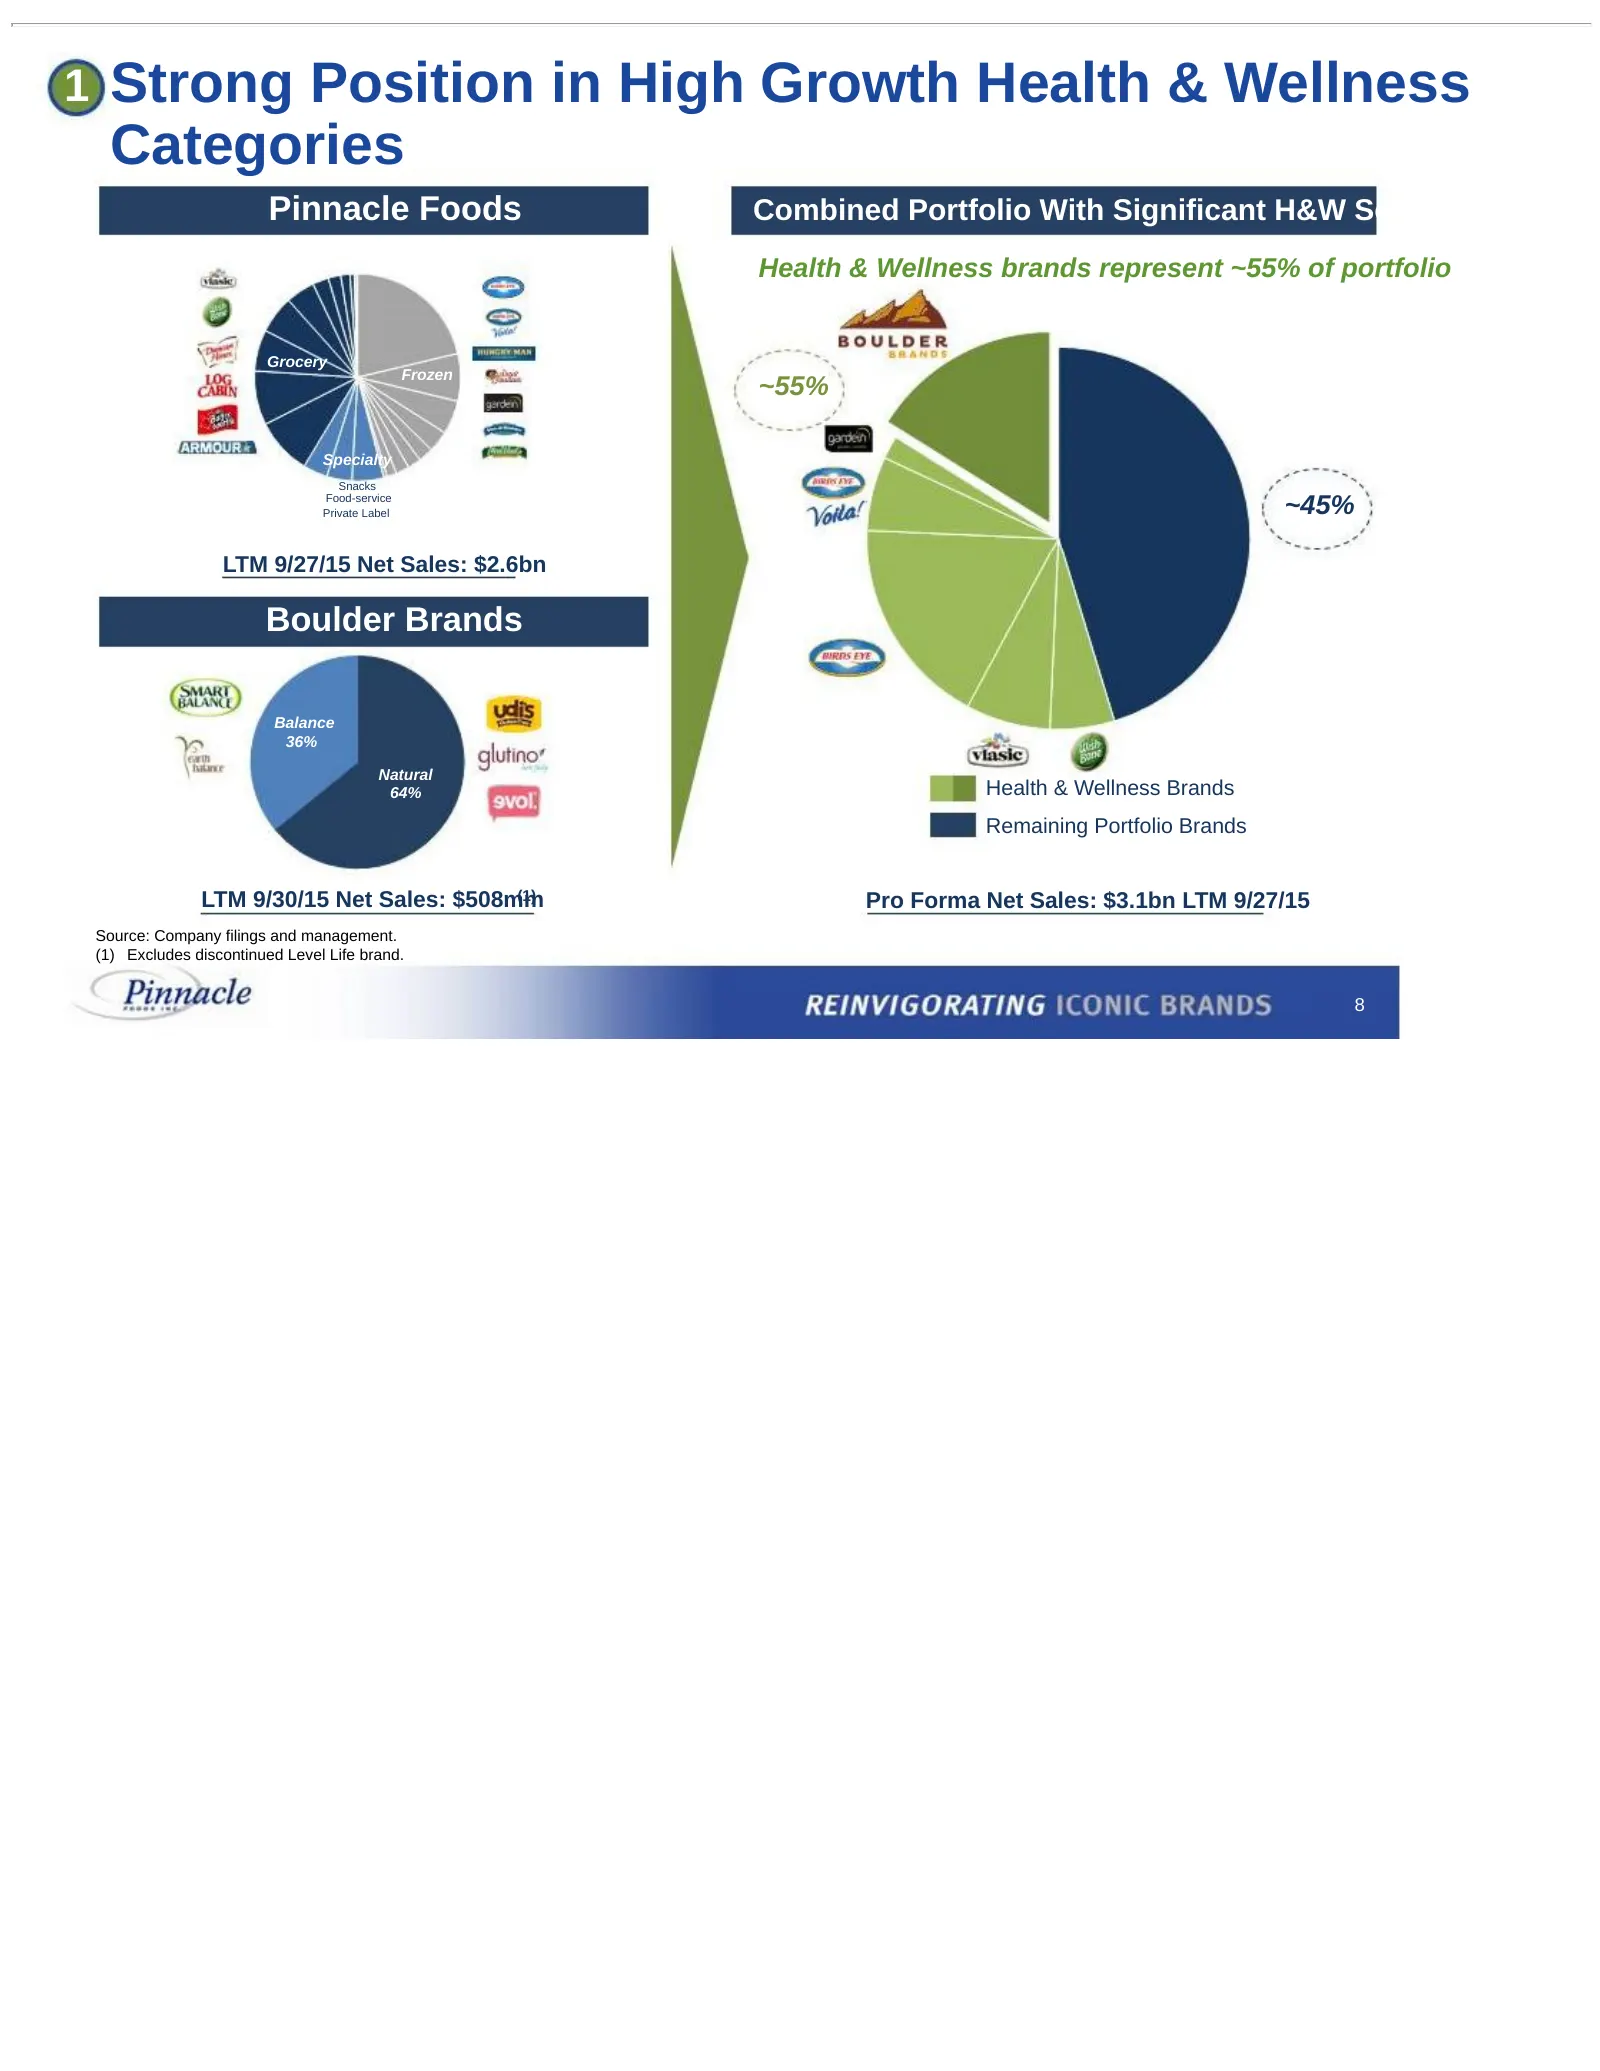
1 Strong Position in High Growth Health & Wellness Categories Pinnacle Foods Combined Portfolio With Significant H&W Scale Health & Wellness brands represent ~55% of portfolio Grocery Frozen ~55% Specialty Snacks Food-service Private Label ~45% LTM 9/27/15 Net Sales: $2.6bn Boulder Brands Balance 36
Slide 8: Strong Position in High Growth Health & Wellness Categories
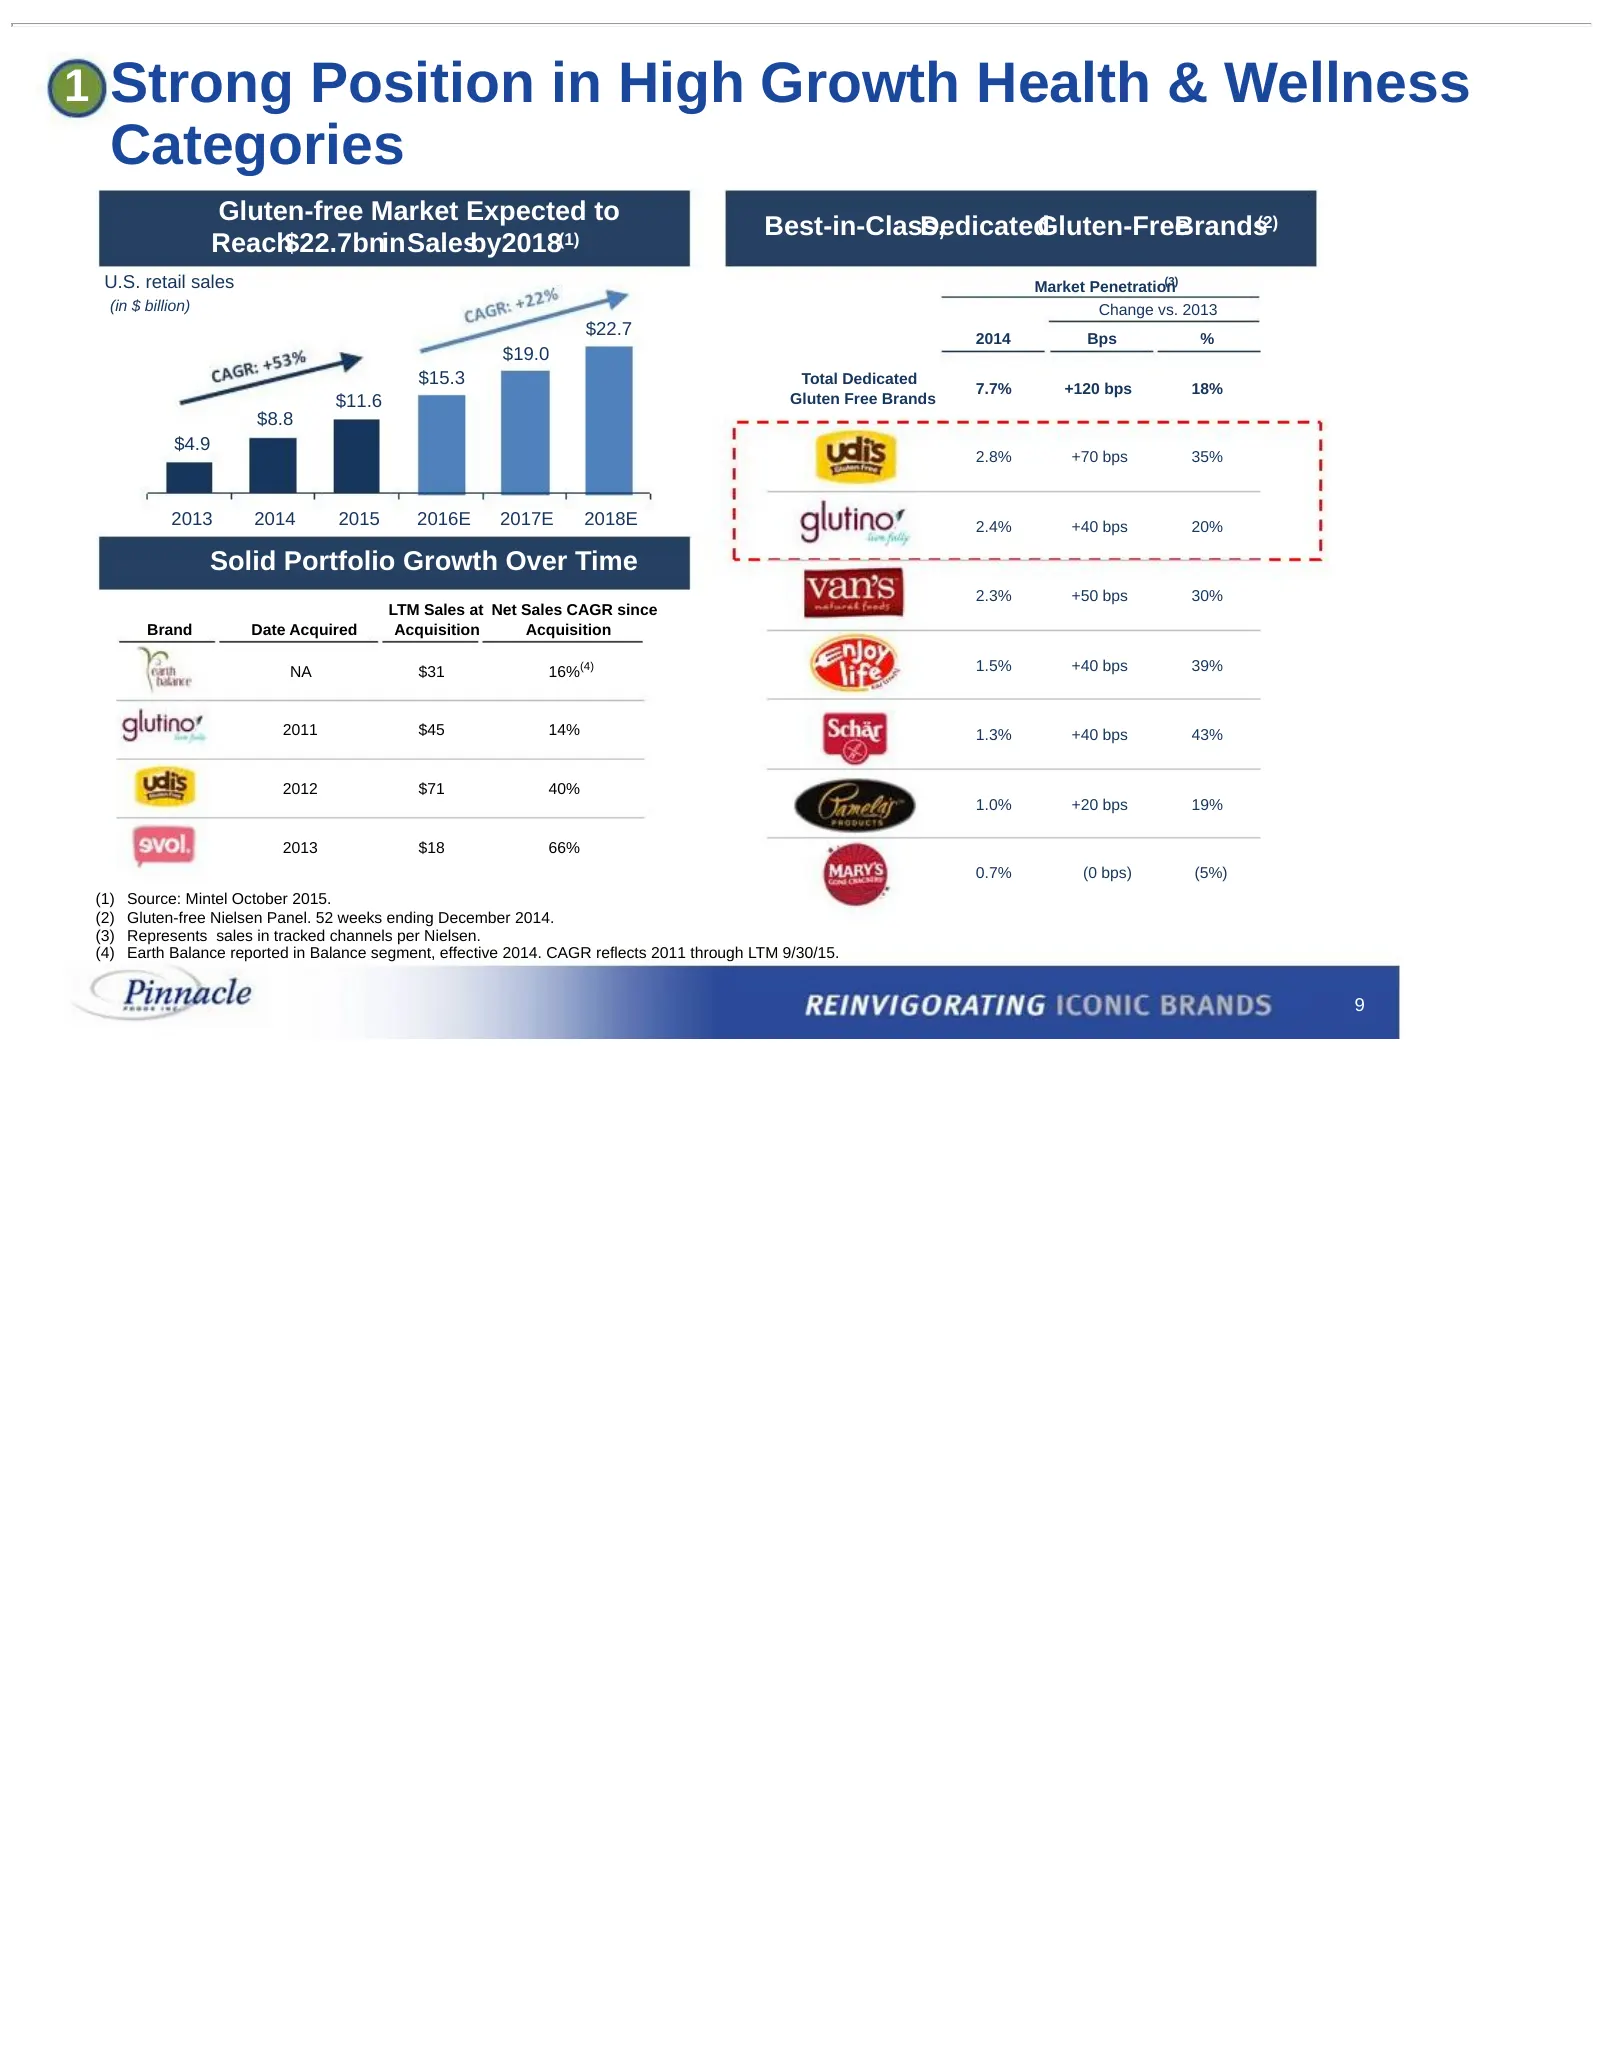
1 Strong Position in High Growth Health & Wellness Categories Gluten-free Market Expected to Best-in-Class, DedicatedGluten-Free Brands(2) Reach$22.7bninSalesby2018(1) U.S. retail sales (3) Market Penetration (in $ billion) Change vs. 2013 $22.7 2014 Bps % $19.0 $15.3 Total Dedicated 7.7% +120 bps 1
Slide 9: Attractive Pinnacle Margin Profile with Plan to Drive Operational Efficiencies
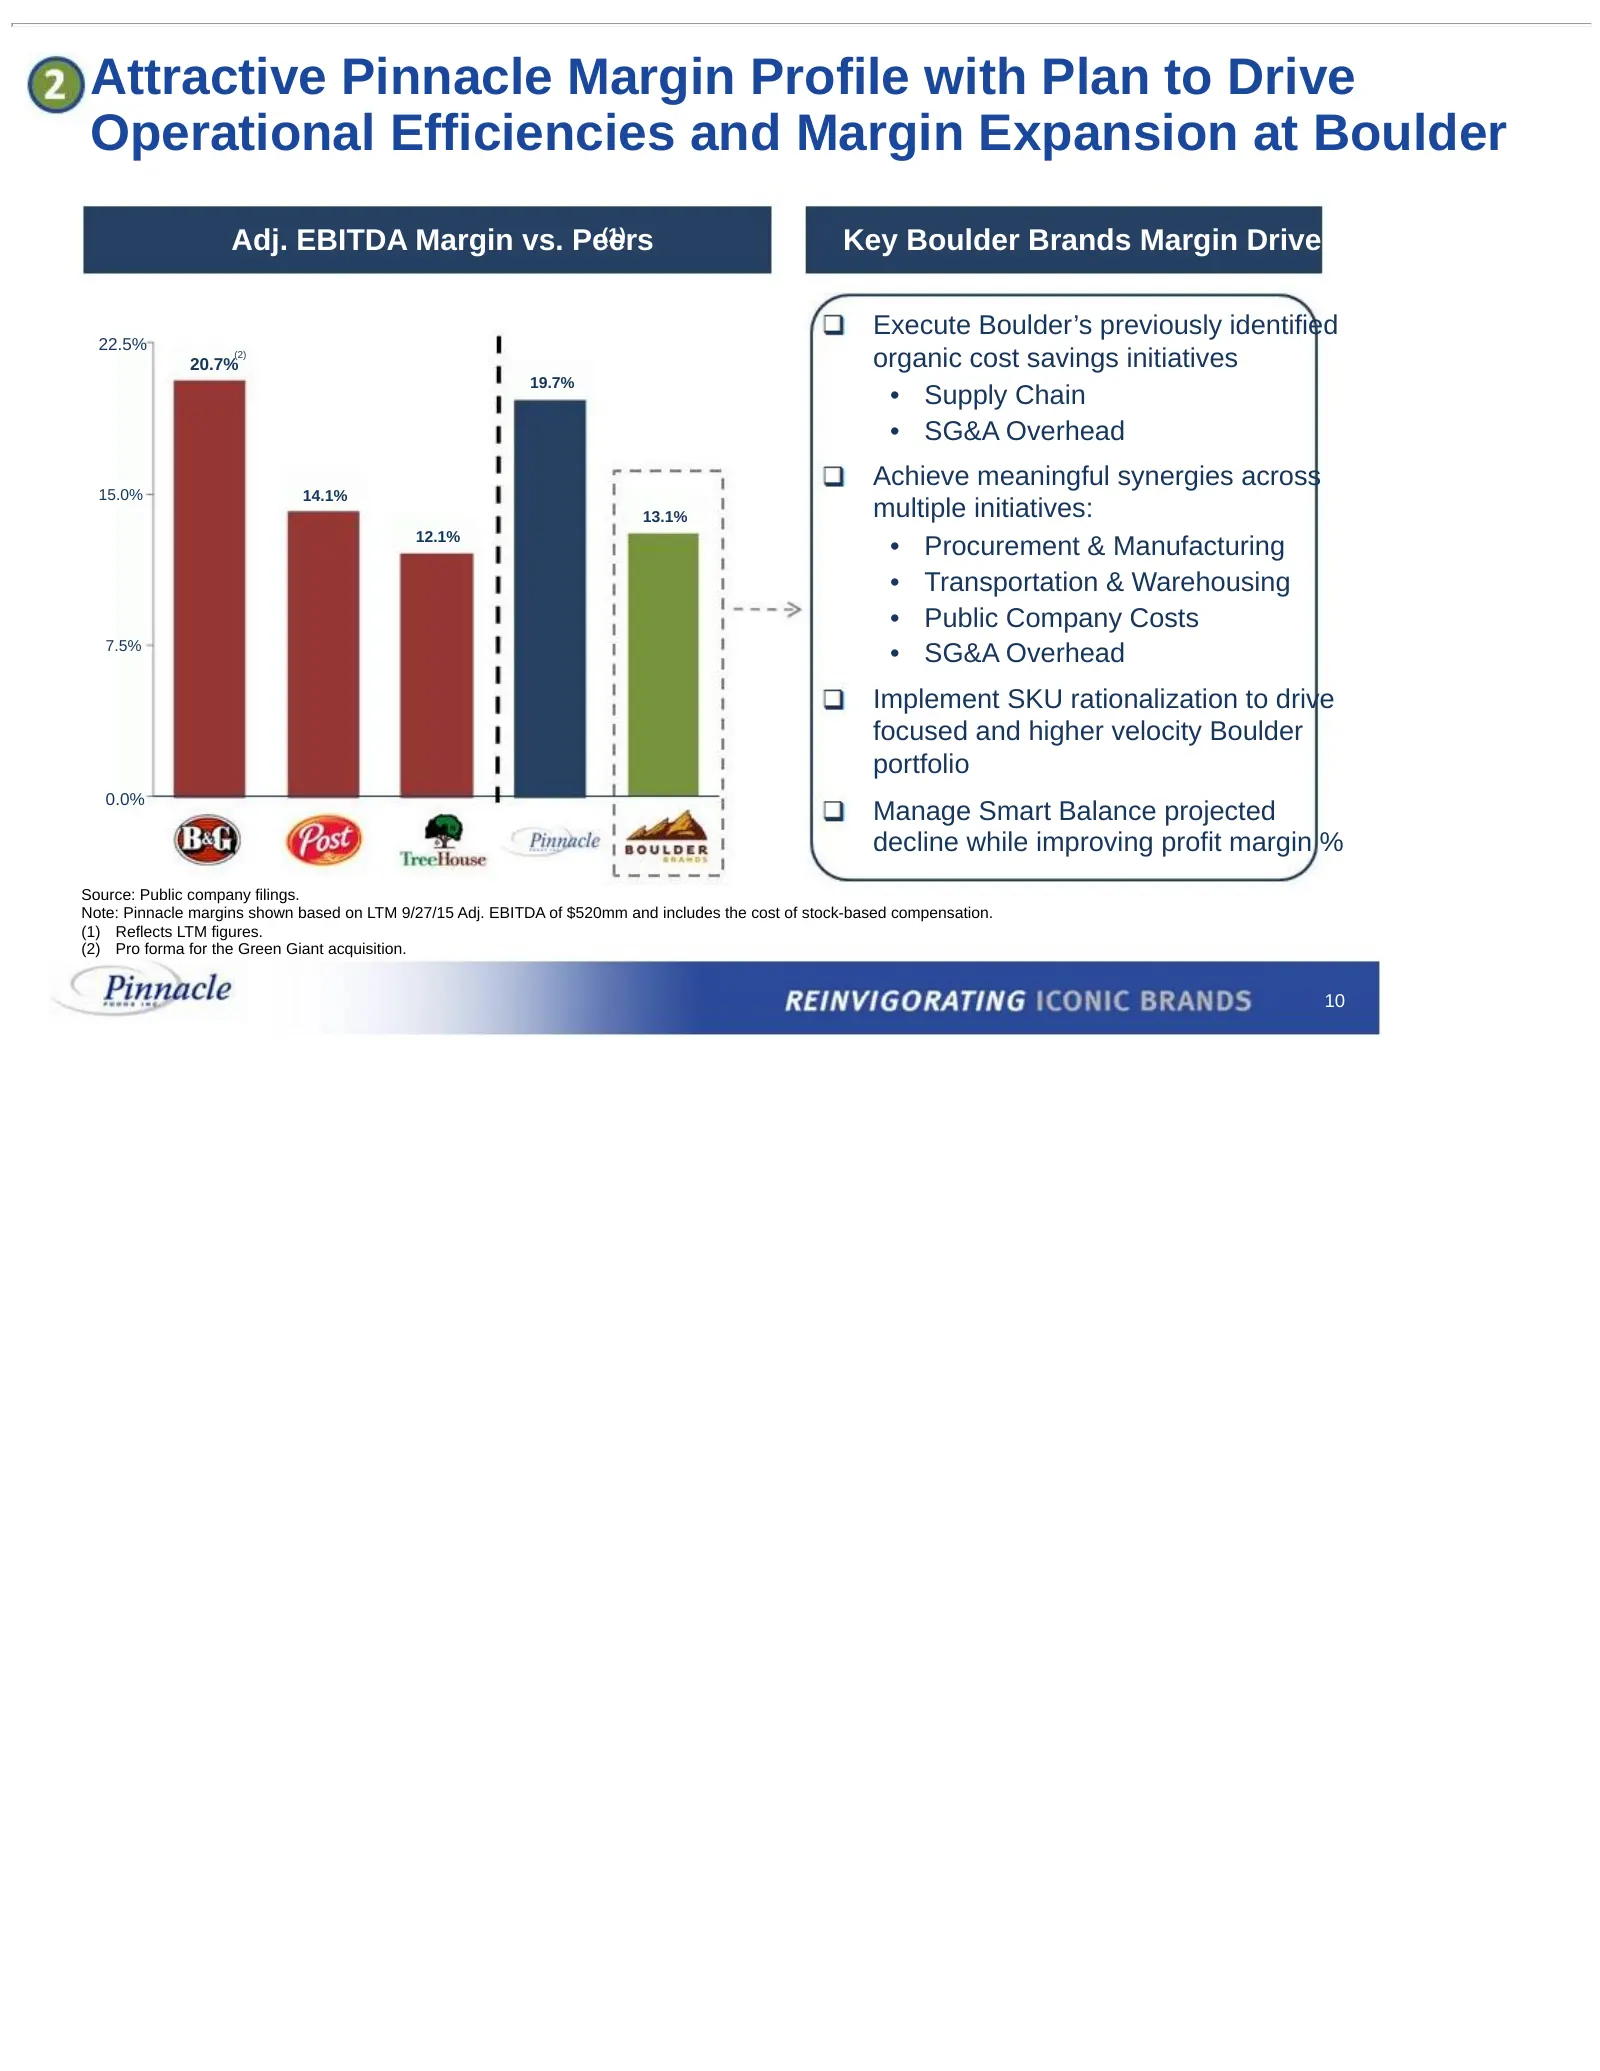
Attractive Pinnacle Margin Profile with Plan to Drive Operational Efficiencies and Margin Expansion at Boulder Adj. EBITDA Margin vs. Peers (1) Key Boulder Brands Margin Drivers Execute Boulder’s previously identified 22.5% 20.7% (2) organic cost savings initiatives 19.7% • Supply Chain • SG&A Overh
Slide 10: Boulder Integration Opportunity
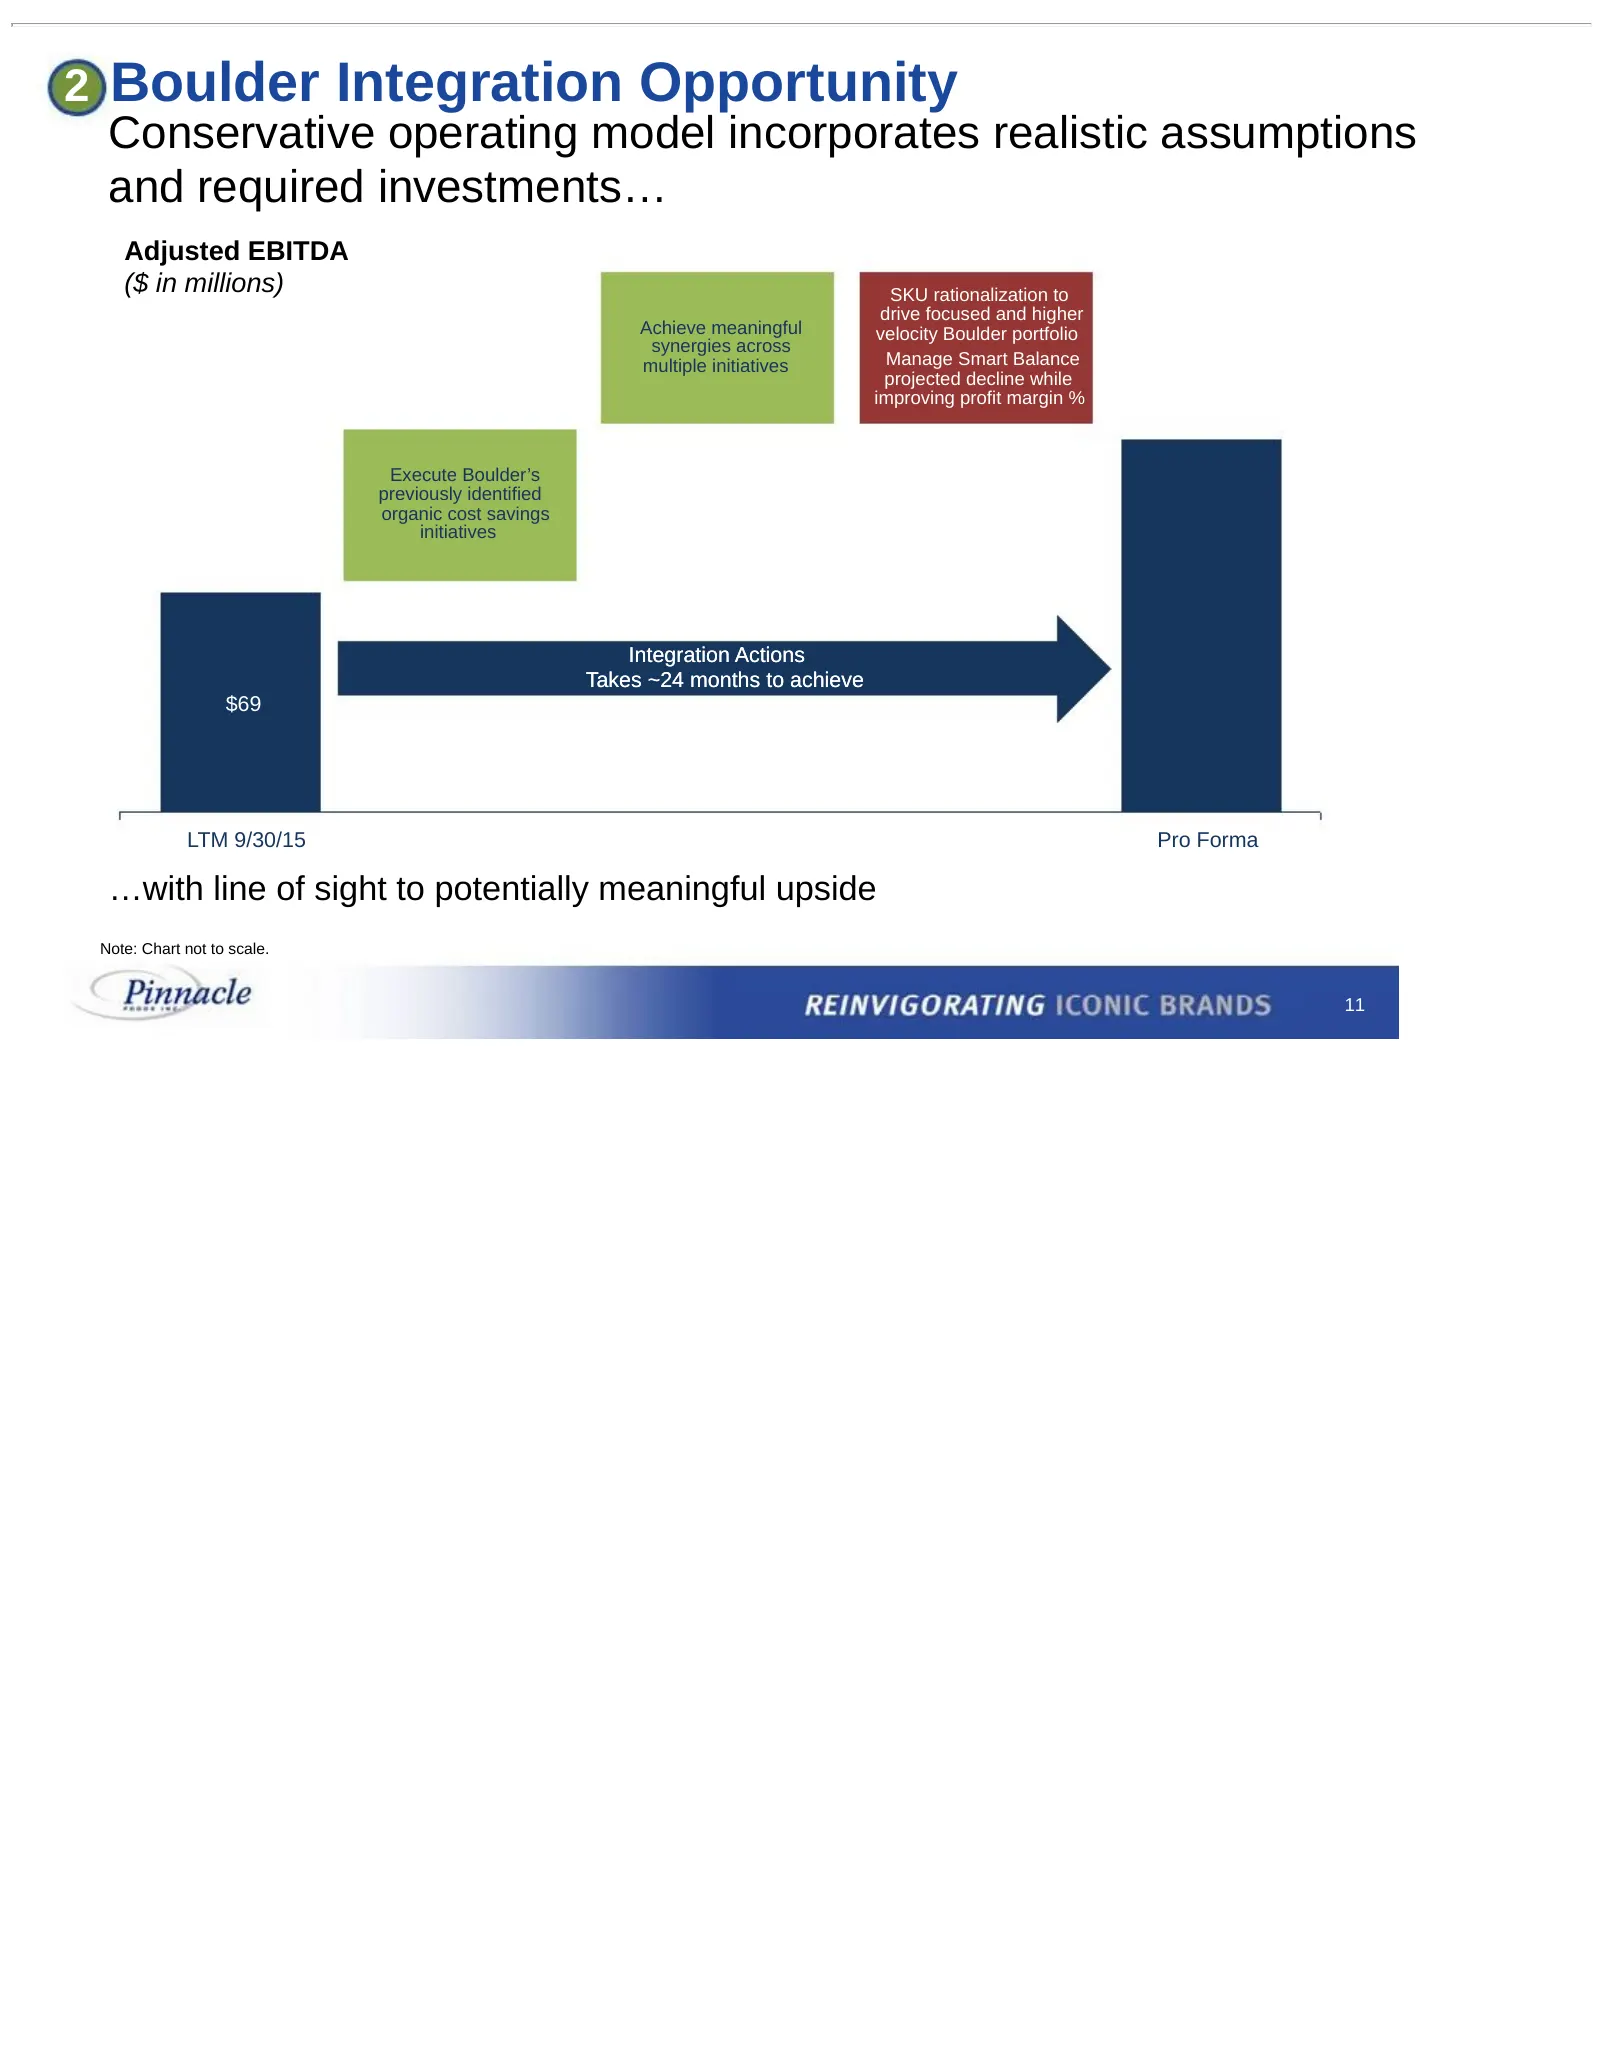
2 Boulder Integration Opportunity Conservative operating model incorporates realistic assumptions and required investments… Adjusted EBITDA ($ in millions) SKU rationalization to drive focused and higher Achieve meaningful velocity Boulder portfolio synergies across multiple initiatives Manage Smart
Slide 11: Strong Free Cash Flow Generation for Debt Paydown
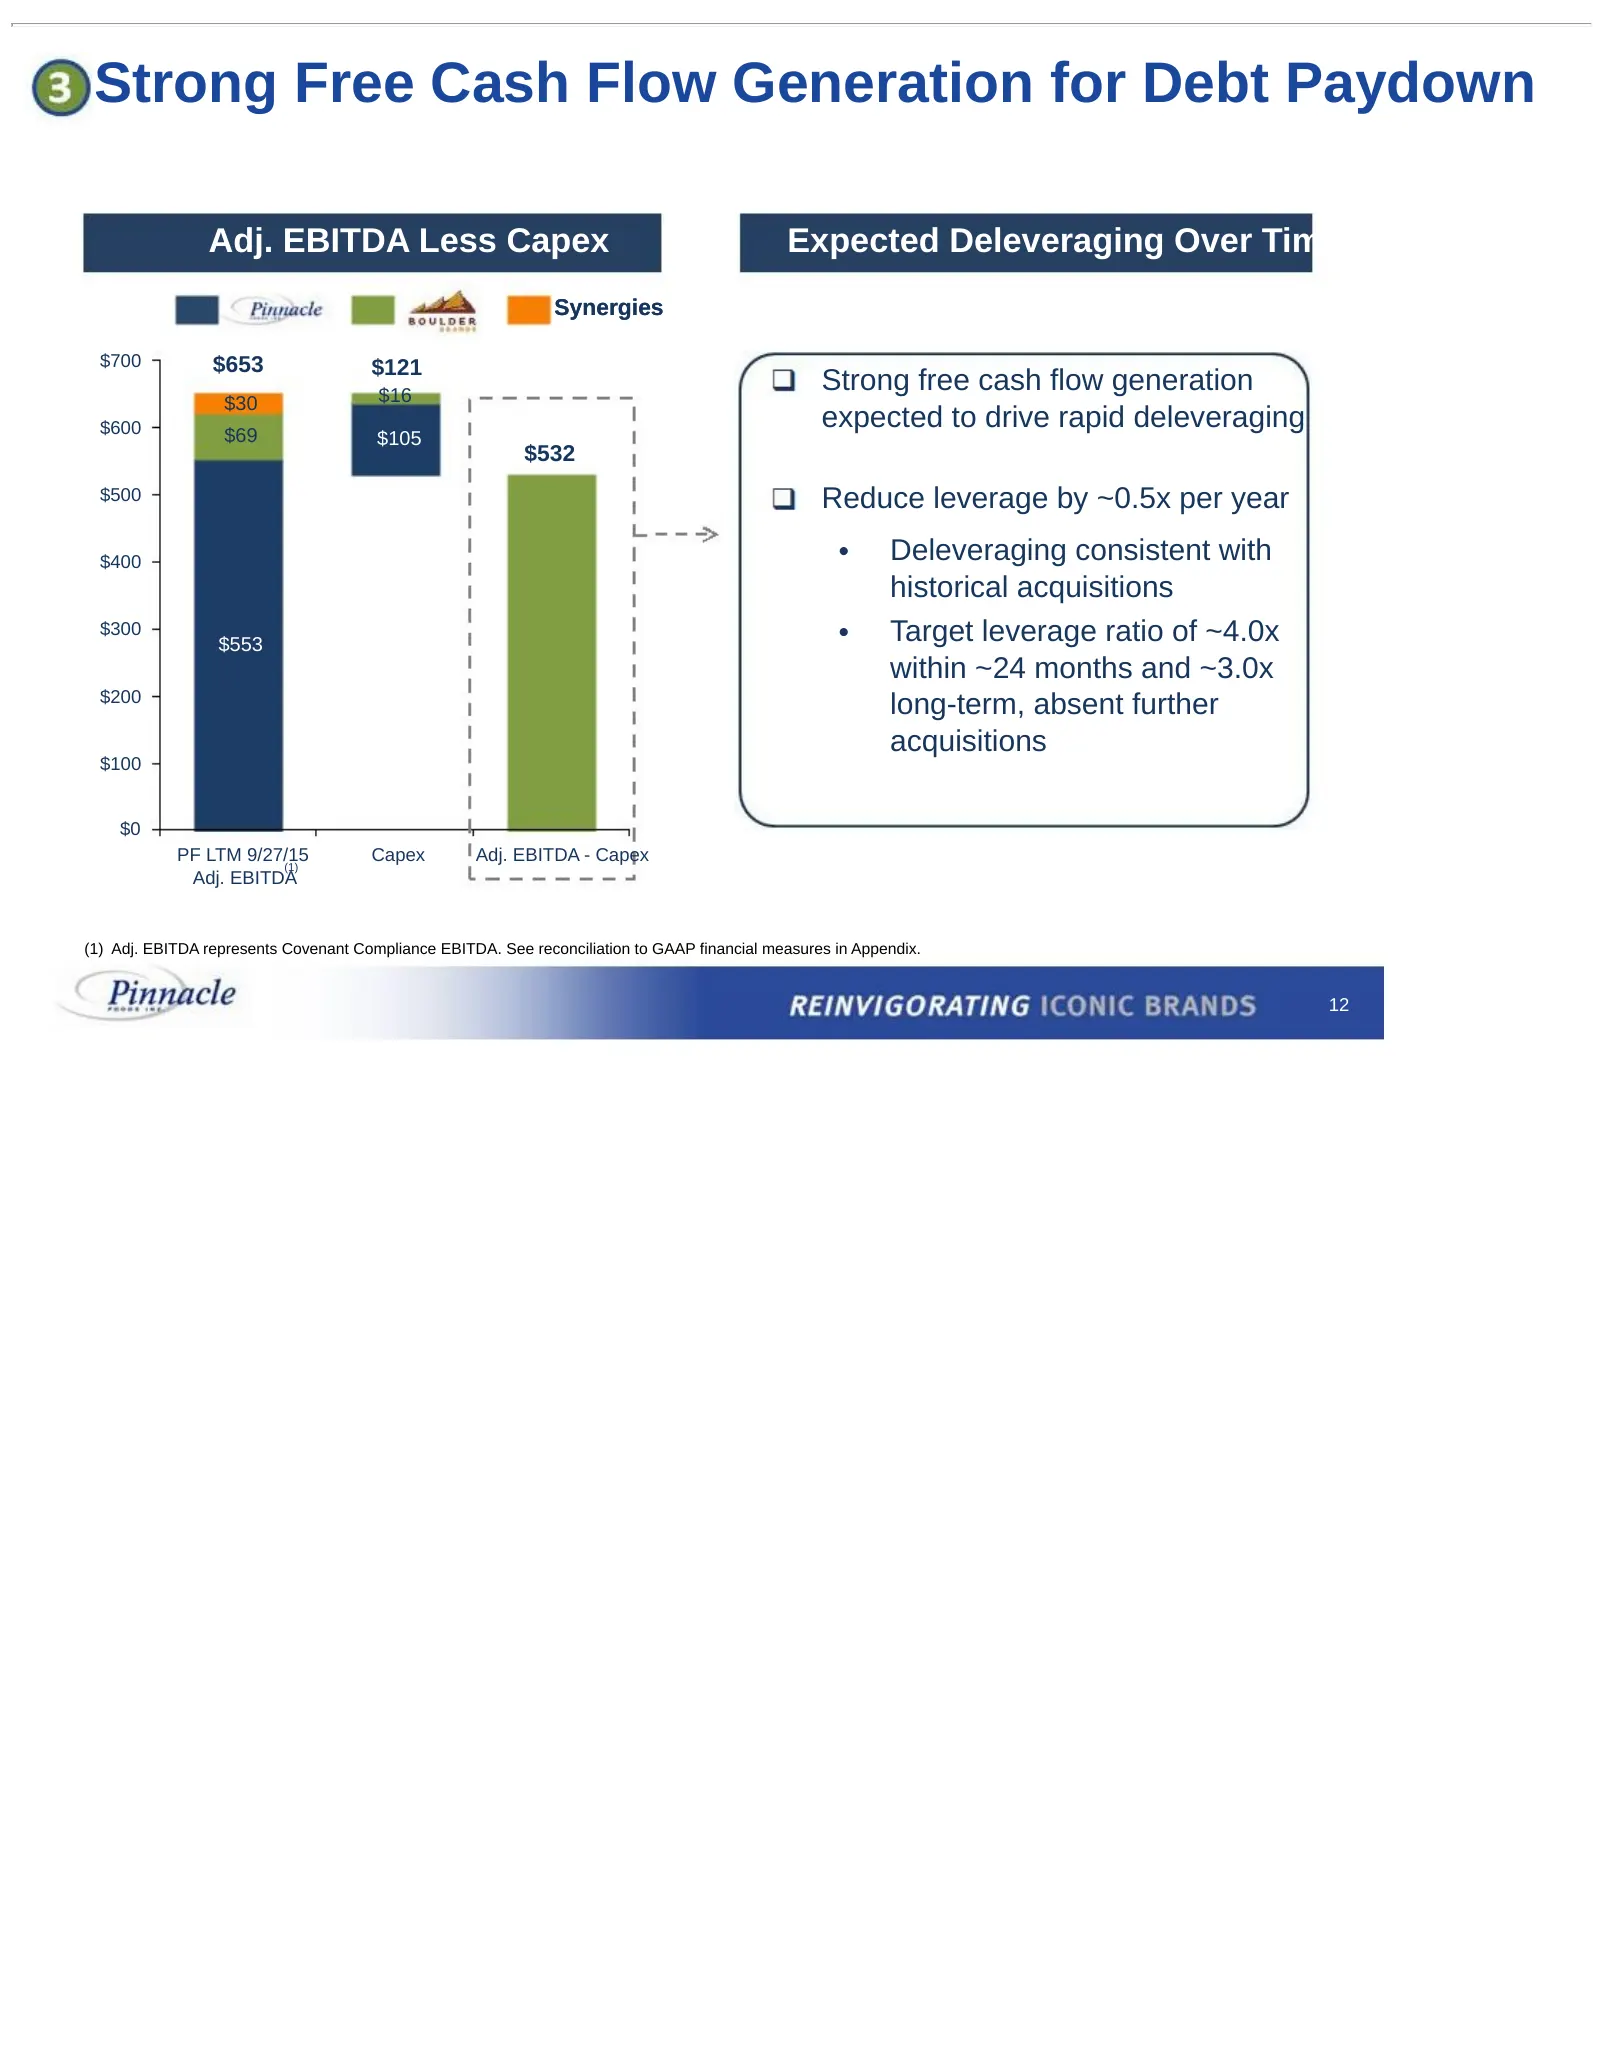
Strong Free Cash Flow Generation for Debt Paydown Adj. EBITDA Less Capex Expected Deleveraging Over Time Synergies $700 $653 $121 $16 Strong free cash flow generation $30 $600 expected to drive rapid deleveraging $69 $105 $532 $500 Reduce leverage by ~0.5x per year $400 • Deleveraging consistent wit
Slide 12: Pinnacle Has a History of Successful Deleveraging
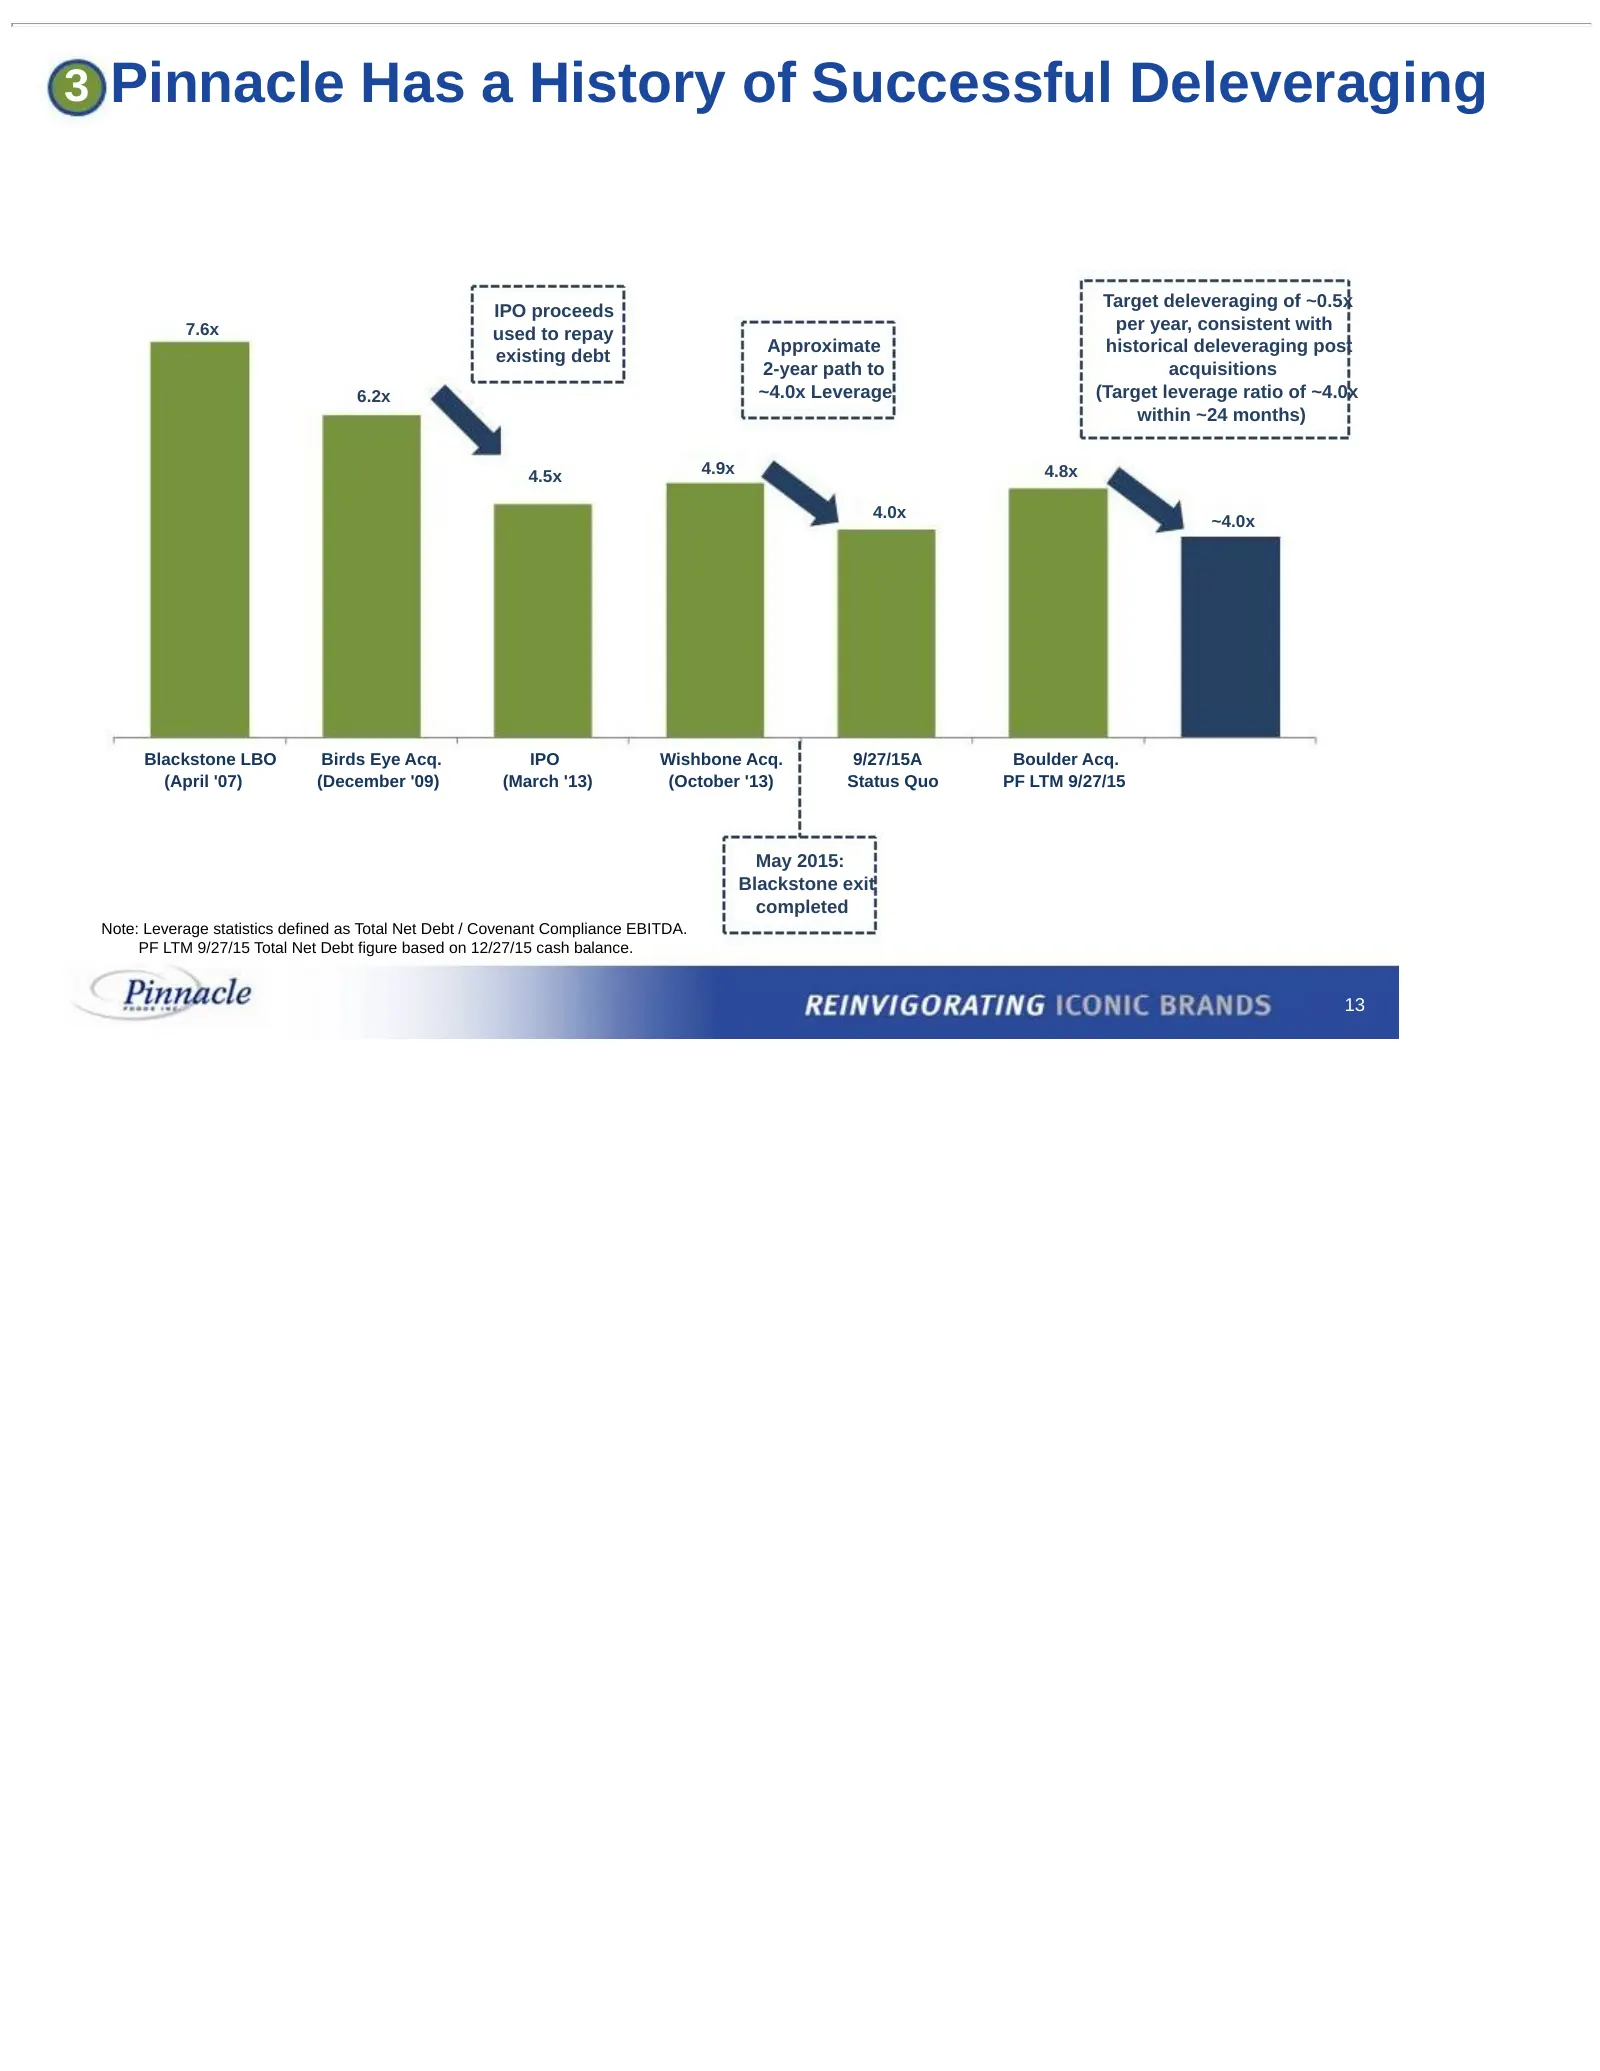
3 Pinnacle Has a History of Successful Deleveraging Target deleveraging of ~0.5x IPO proceeds 7.6x per year, consistent with used to repay Approximate historical deleveraging post existing debt 2-year path to acquisitions 6.2x ~4.0x Leverage (Target leverage ratio of ~4.0x within ~24 months) 4.9x 4.
Slide 13: Proven Execution Expertise
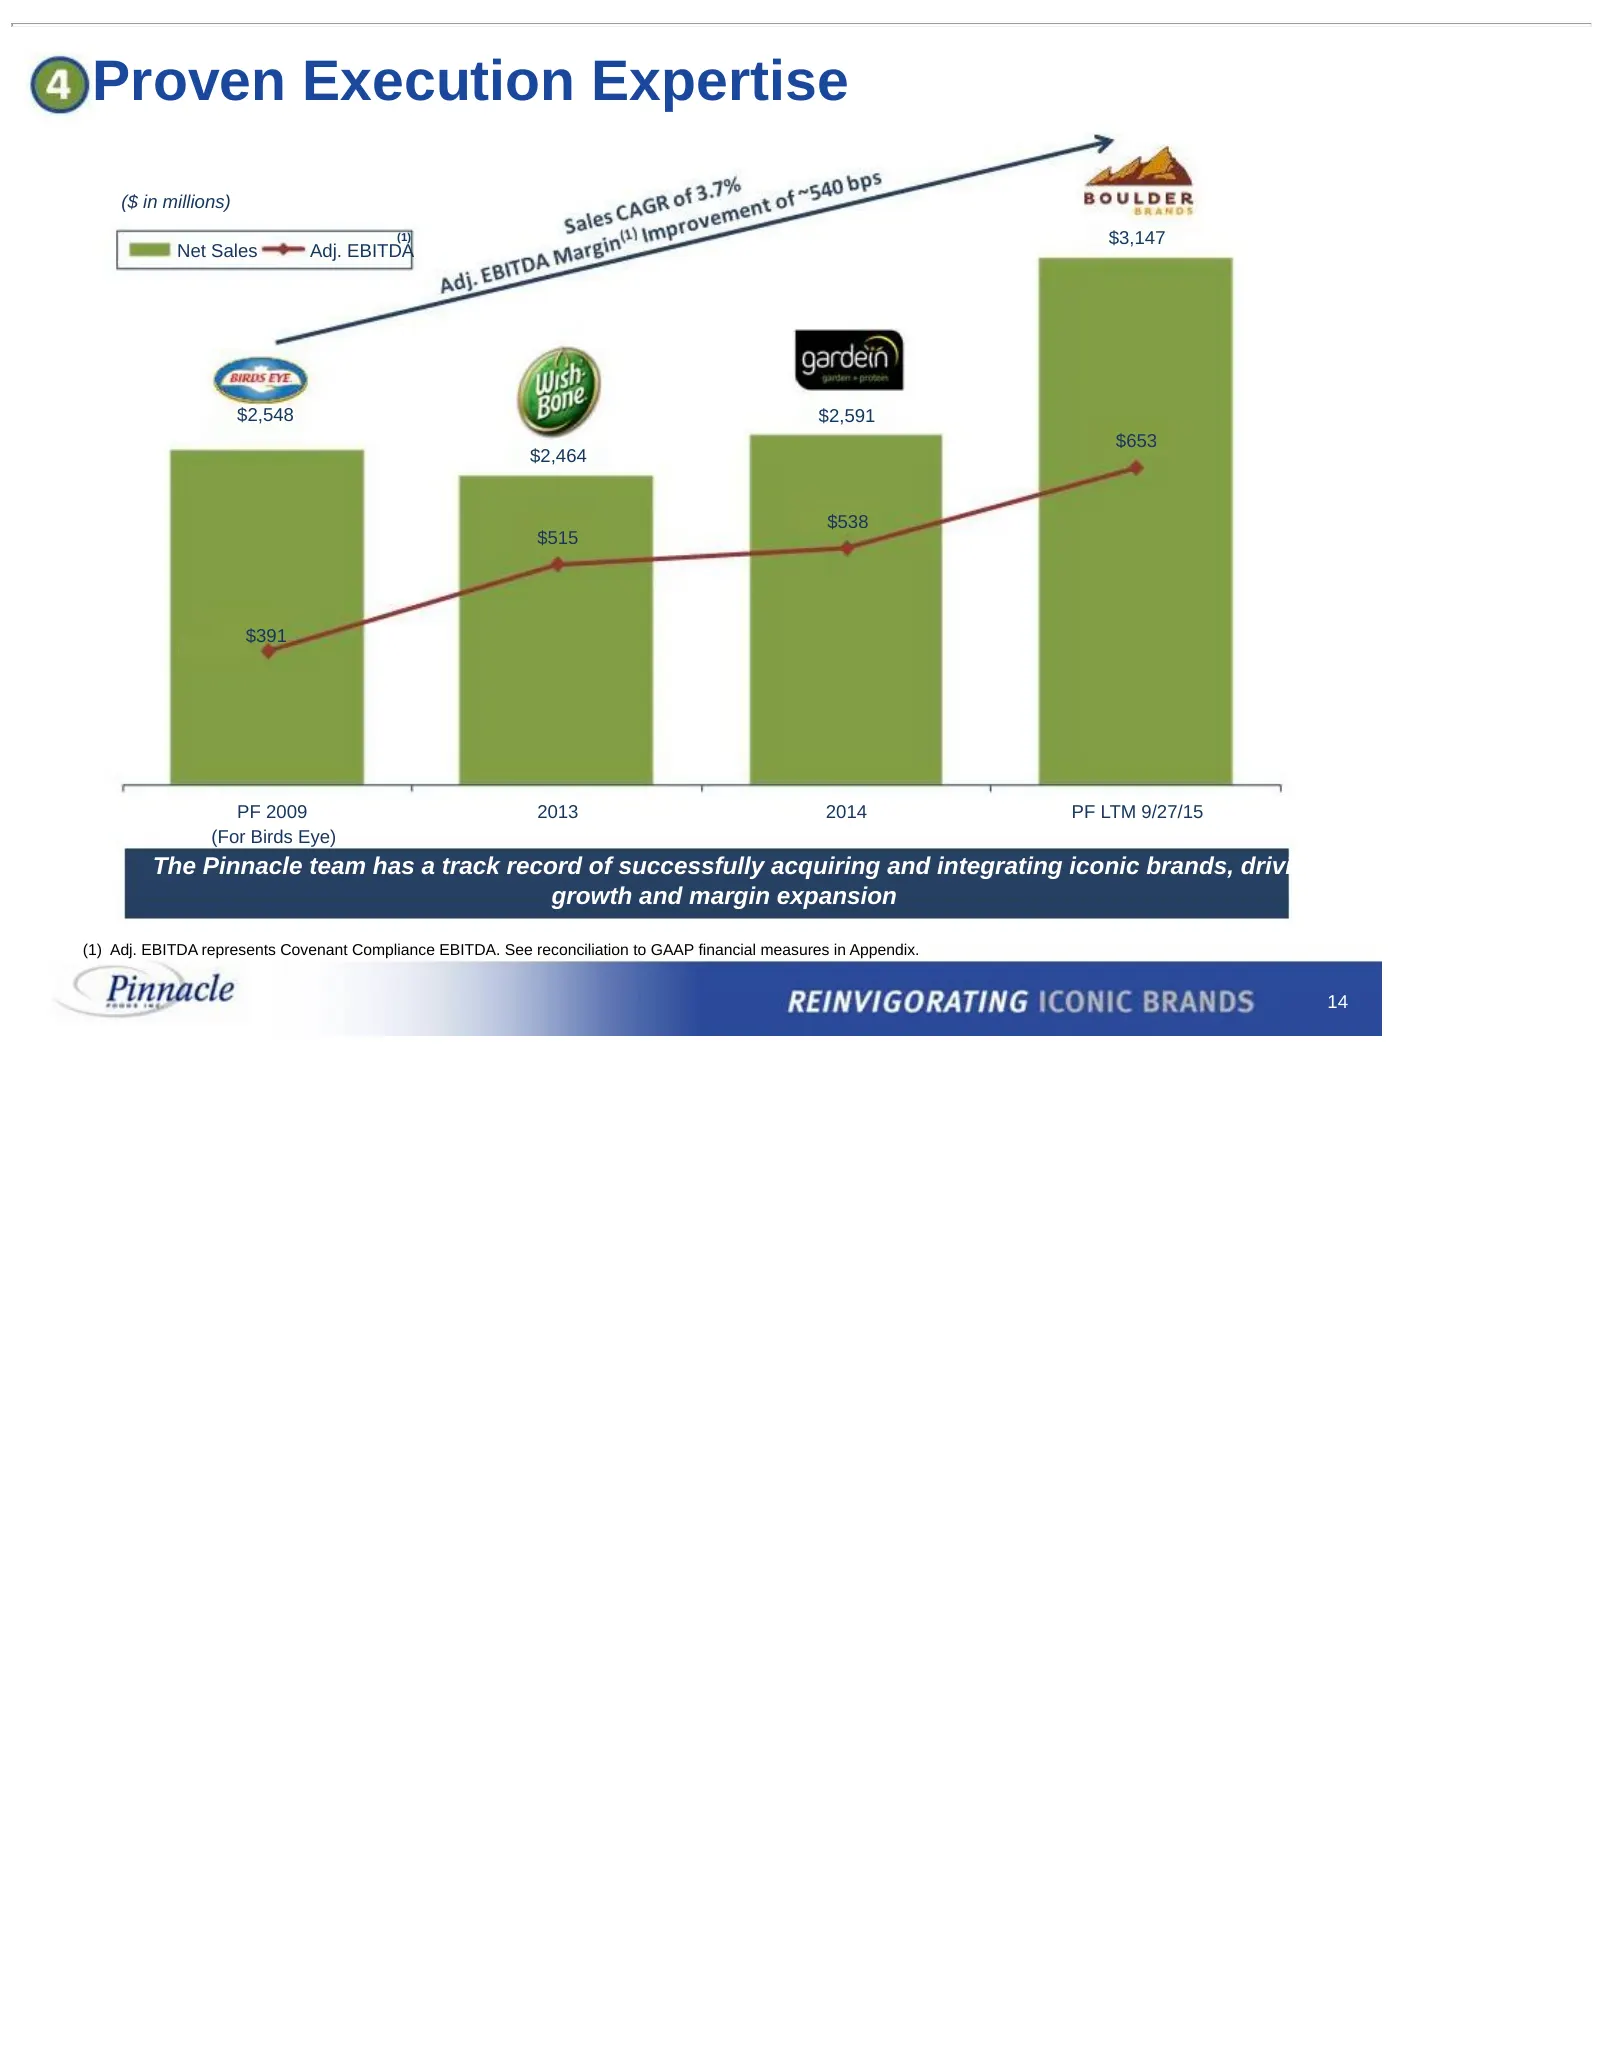
Proven Execution Expertise ($ in millions) (1) $3,147 Net Sales Adj. EBITDA $2,548 $2,591 $653 $2,464 $538 $515 $391 PF 2009 2013 2014 PF LTM 9/27/15 (For Birds Eye) The Pinnacle team has a track record of successfully acquiring and integrating iconic brands, driving top line growth and margin expan
Slide 14: Proven Track Record of Successful Integration and Cost Savings Realization
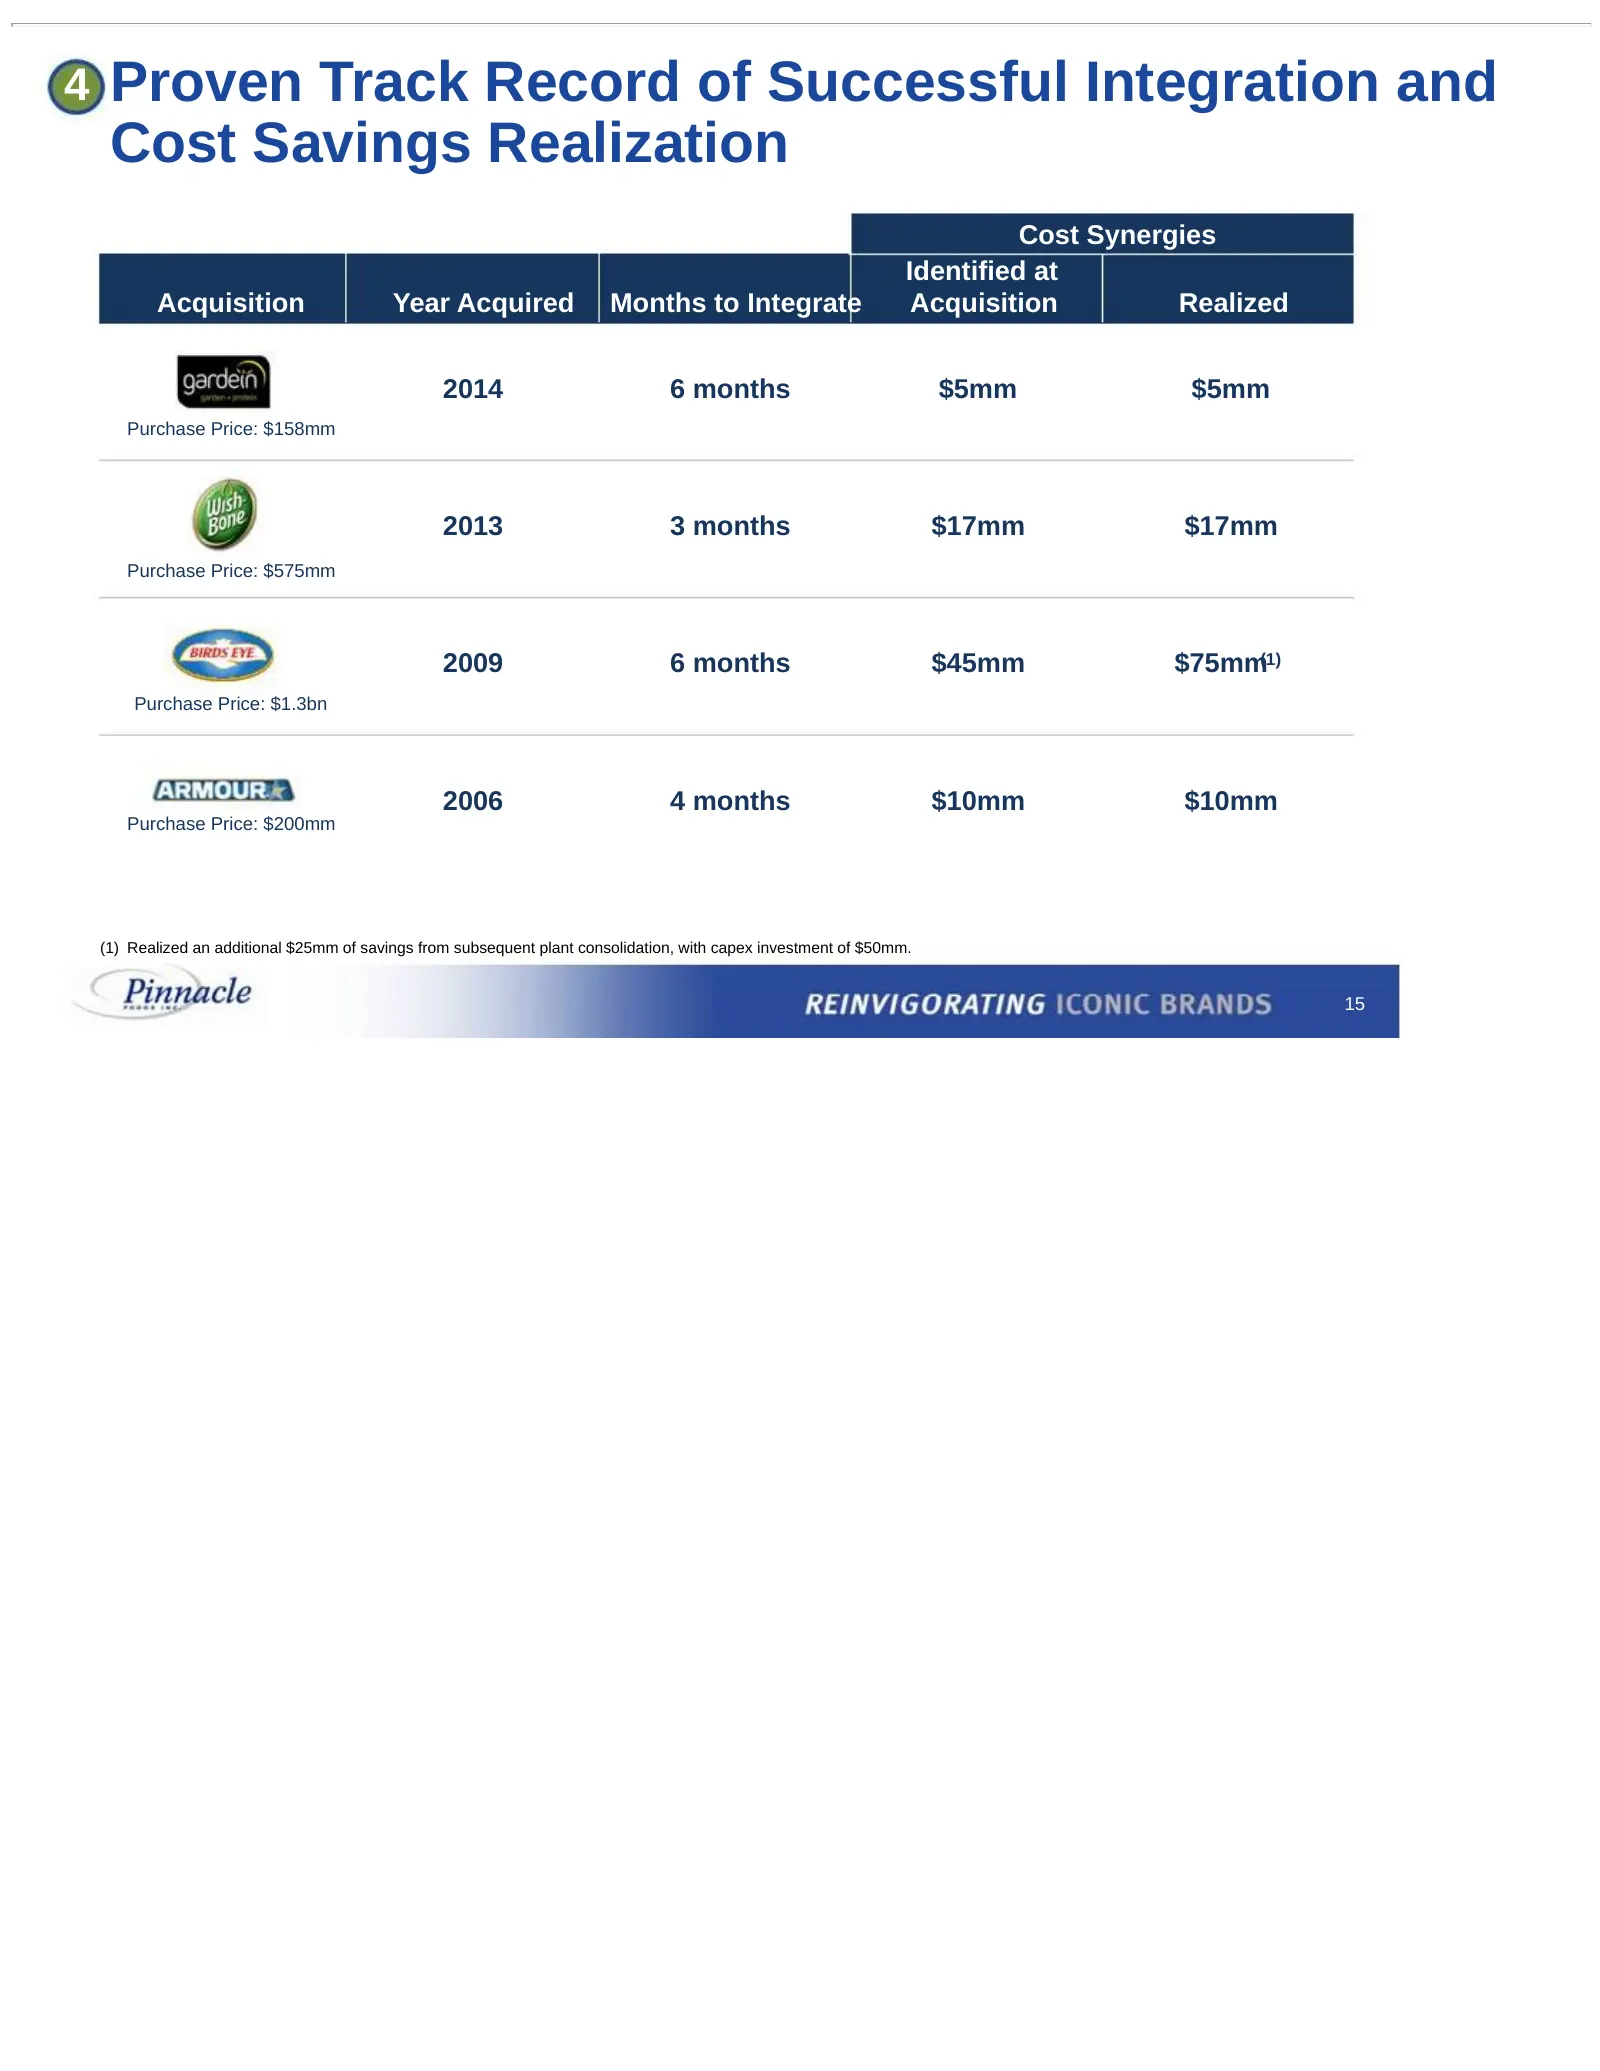
4 Proven Track Record of Successful Integration and Cost Savings Realization Cost Synergies Identified at Acquisition Year Acquired Months to Integrate Acquisition Realized 2014 6 months $5mm $5mm Purchase Price: $158mm 2013 3 months $17mm $17mm Purchase Price: $575mm 2009 6 months $45mm $75mm(1) Pu
Slide 15: Wish-Bone Case Study: Identified & Achieved Synergies
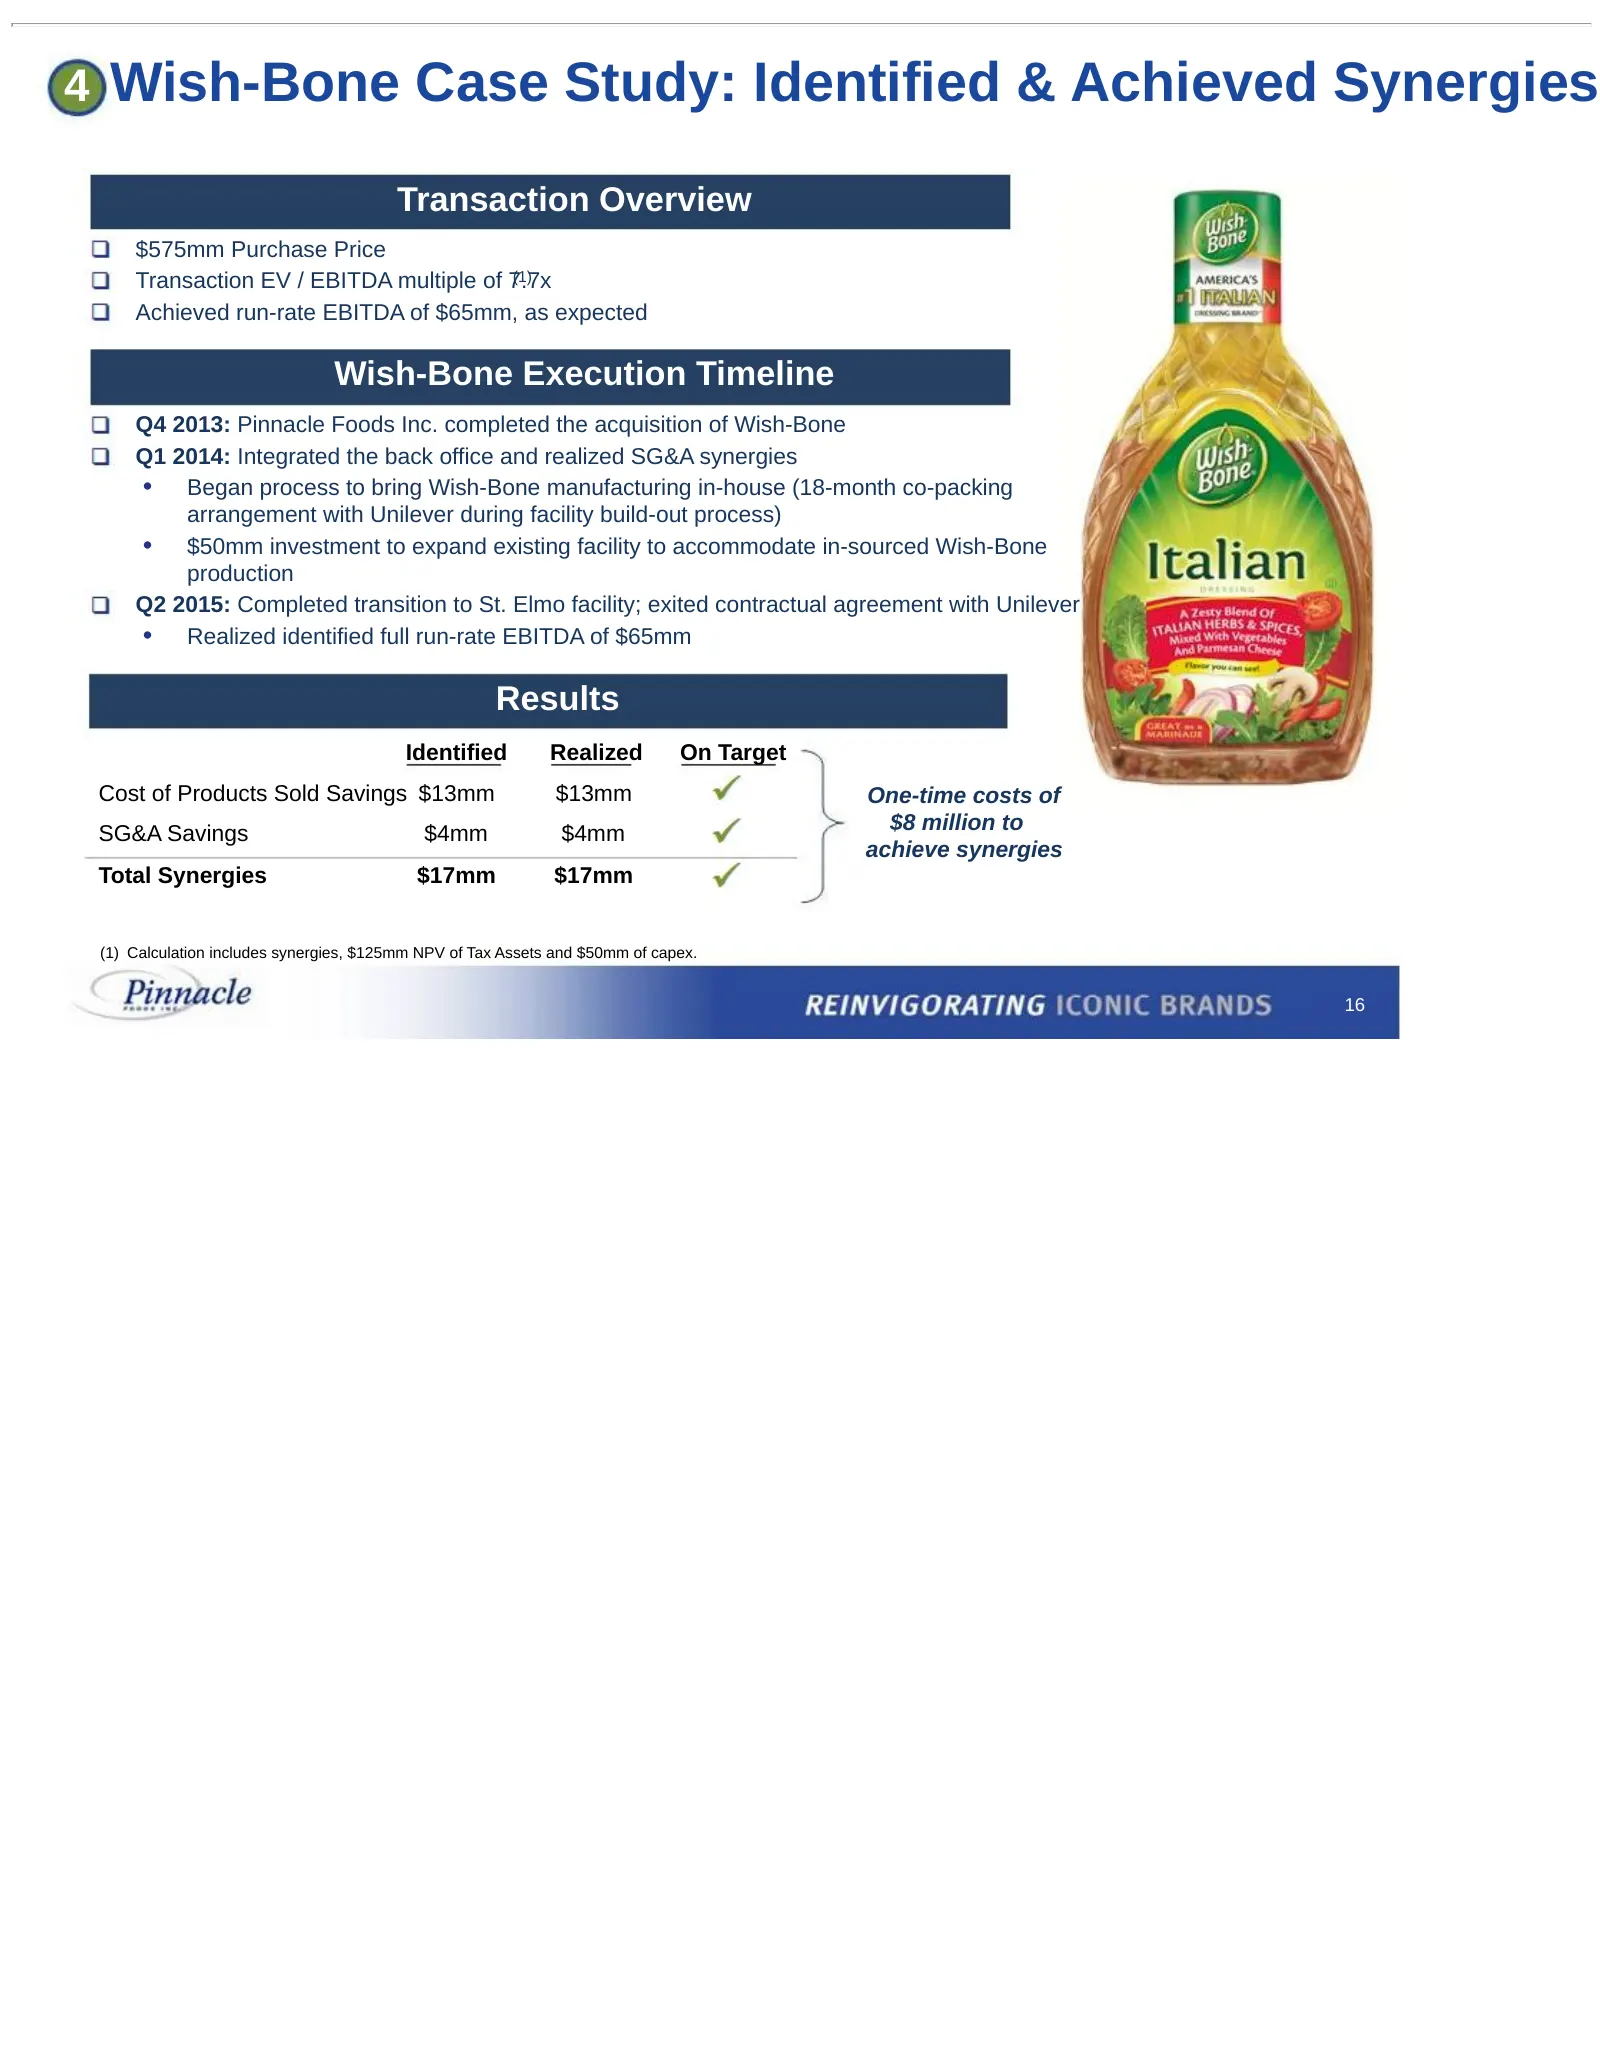
4 Wish-Bone Case Study: Identified & Achieved Synergies Transaction Overview $575mm Purchase Price Transaction EV / EBITDA multiple of 7.7x (1) Achieved run-rate EBITDA of $65mm, as expected Wish-Bone Execution Timeline Q4 2013: Pinnacle Foods Inc. completed the acquisition of Wish-Bone Q1 2014: Int
Slide 16: Pinnacle's Integration Playbook
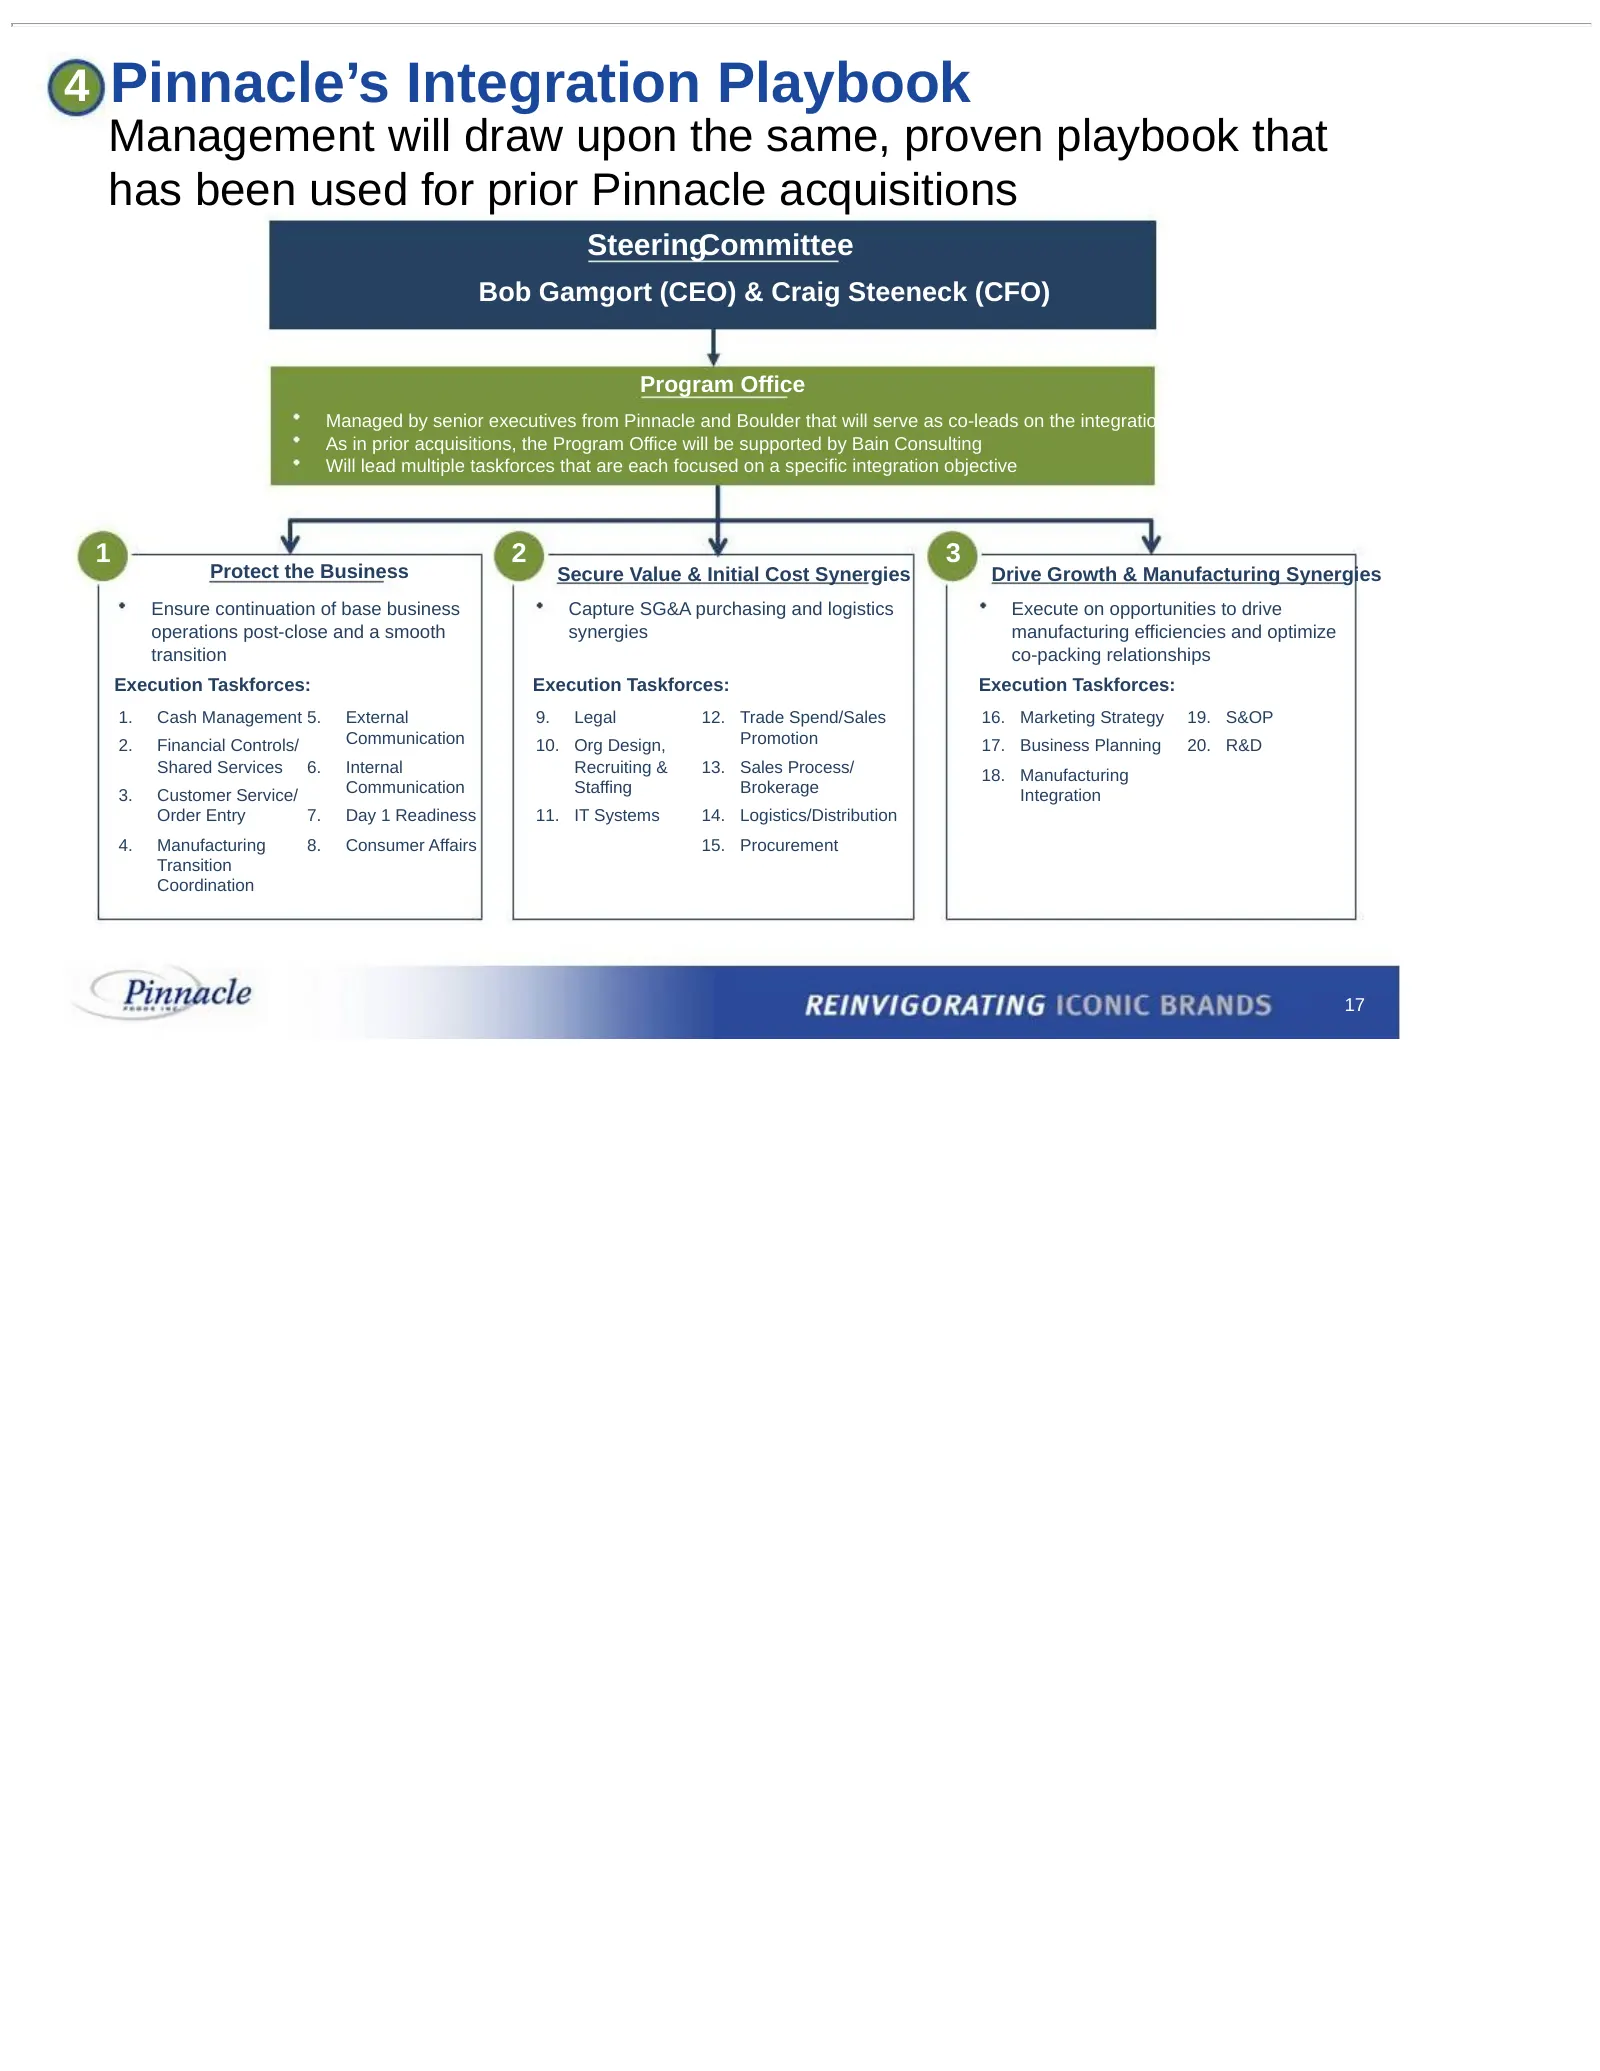
4 Pinnacle’s Integration Playbook Management will draw upon the same, proven playbook that has been used for prior Pinnacle acquisitions SteeringCommittee Bob Gamgort (CEO) & Craig Steeneck (CFO) Program Office Managed by senior executives from Pinnacle and Boulder that will serve as co-leads on the
Slide 17: Experienced Operating Team Led by Industry Veterans
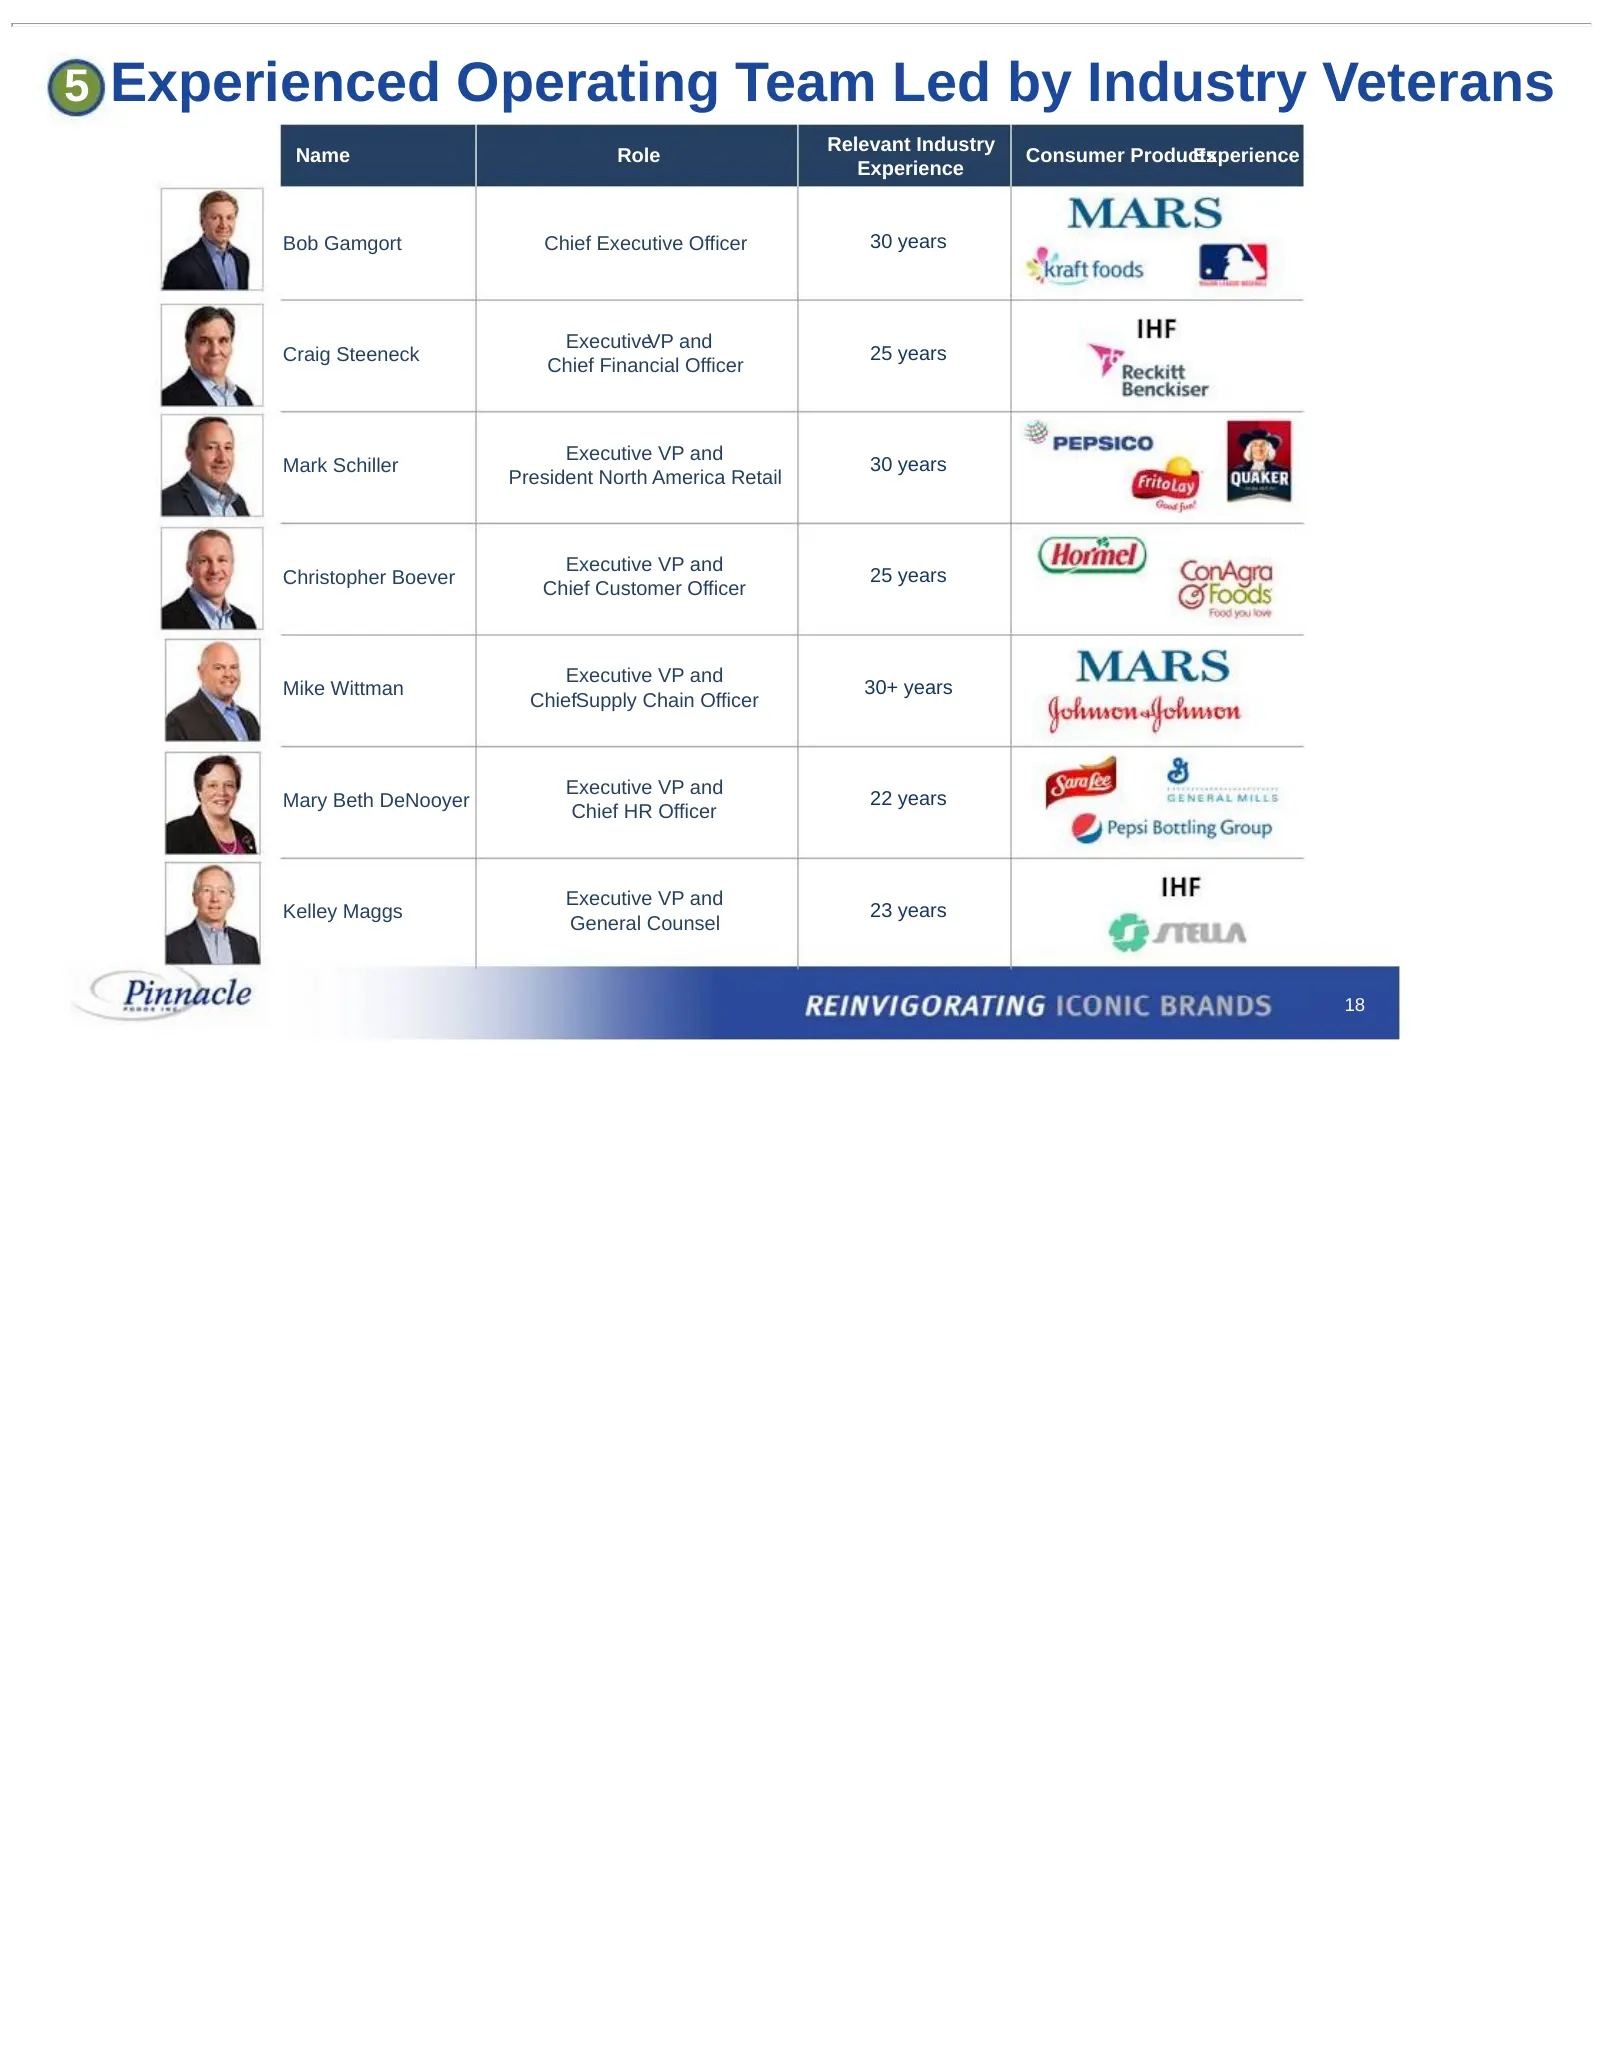
5 Experienced Operating Team Led by Industry Veterans Relevant Industry Name Role Consumer Products Experience Experience Bob Gamgort Chief Executive Officer 30 years ExecutiveVP and Craig Steeneck 25 years Chief Financial Officer Executive VP and Mark Schiller 30 years President North America Retai
Slide 18: Agenda
Agenda Transaction Overview Credit Highlights Pinnacle Business Update Boulder Brands Opportunity
Slide 19: Attractive Value Creation Results Since IPO
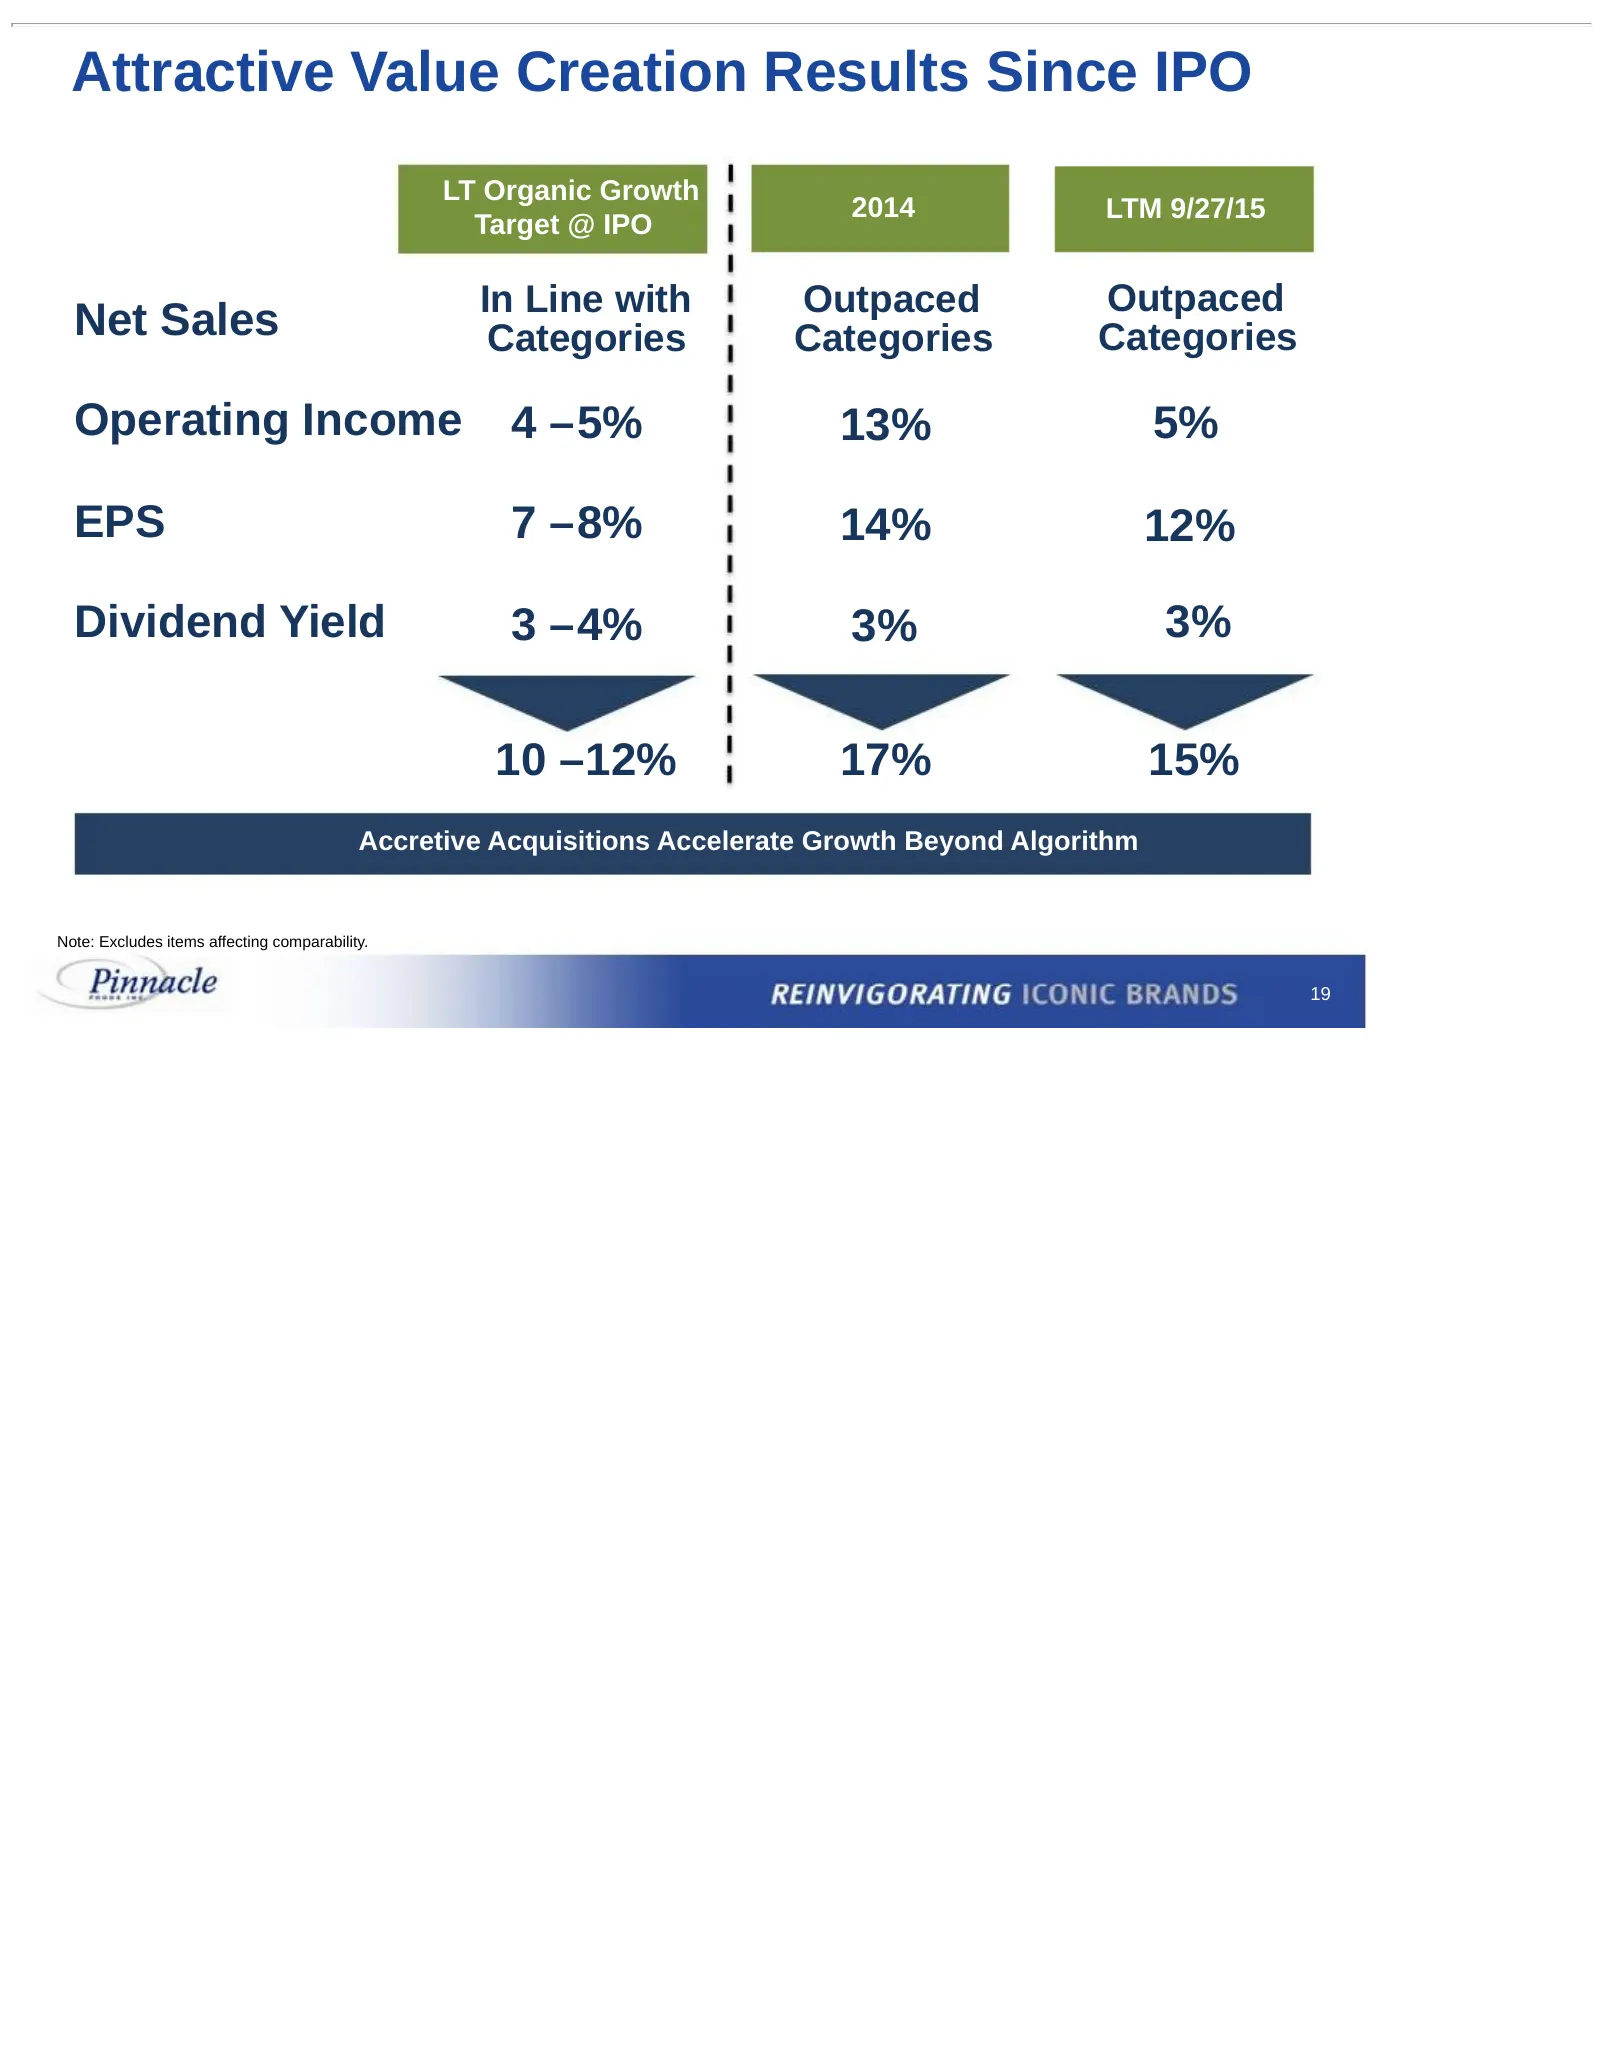
Attractive Value Creation Results Since IPO LT Organic Growth 2014 LTM 9/27/15 Target @ IPO In Line with Outpaced Outpaced Net Sales Categories Categories Categories Operating Income 4 –5% 13% 5% EPS 7 –8% 14% 12% Dividend Yield 3 –4% 3% 3% 10 –12% 17% 15% Accretive Acquisitions Accelerate Growth Be
Slide 20: Pinnacle's Portfolio Management Strategy
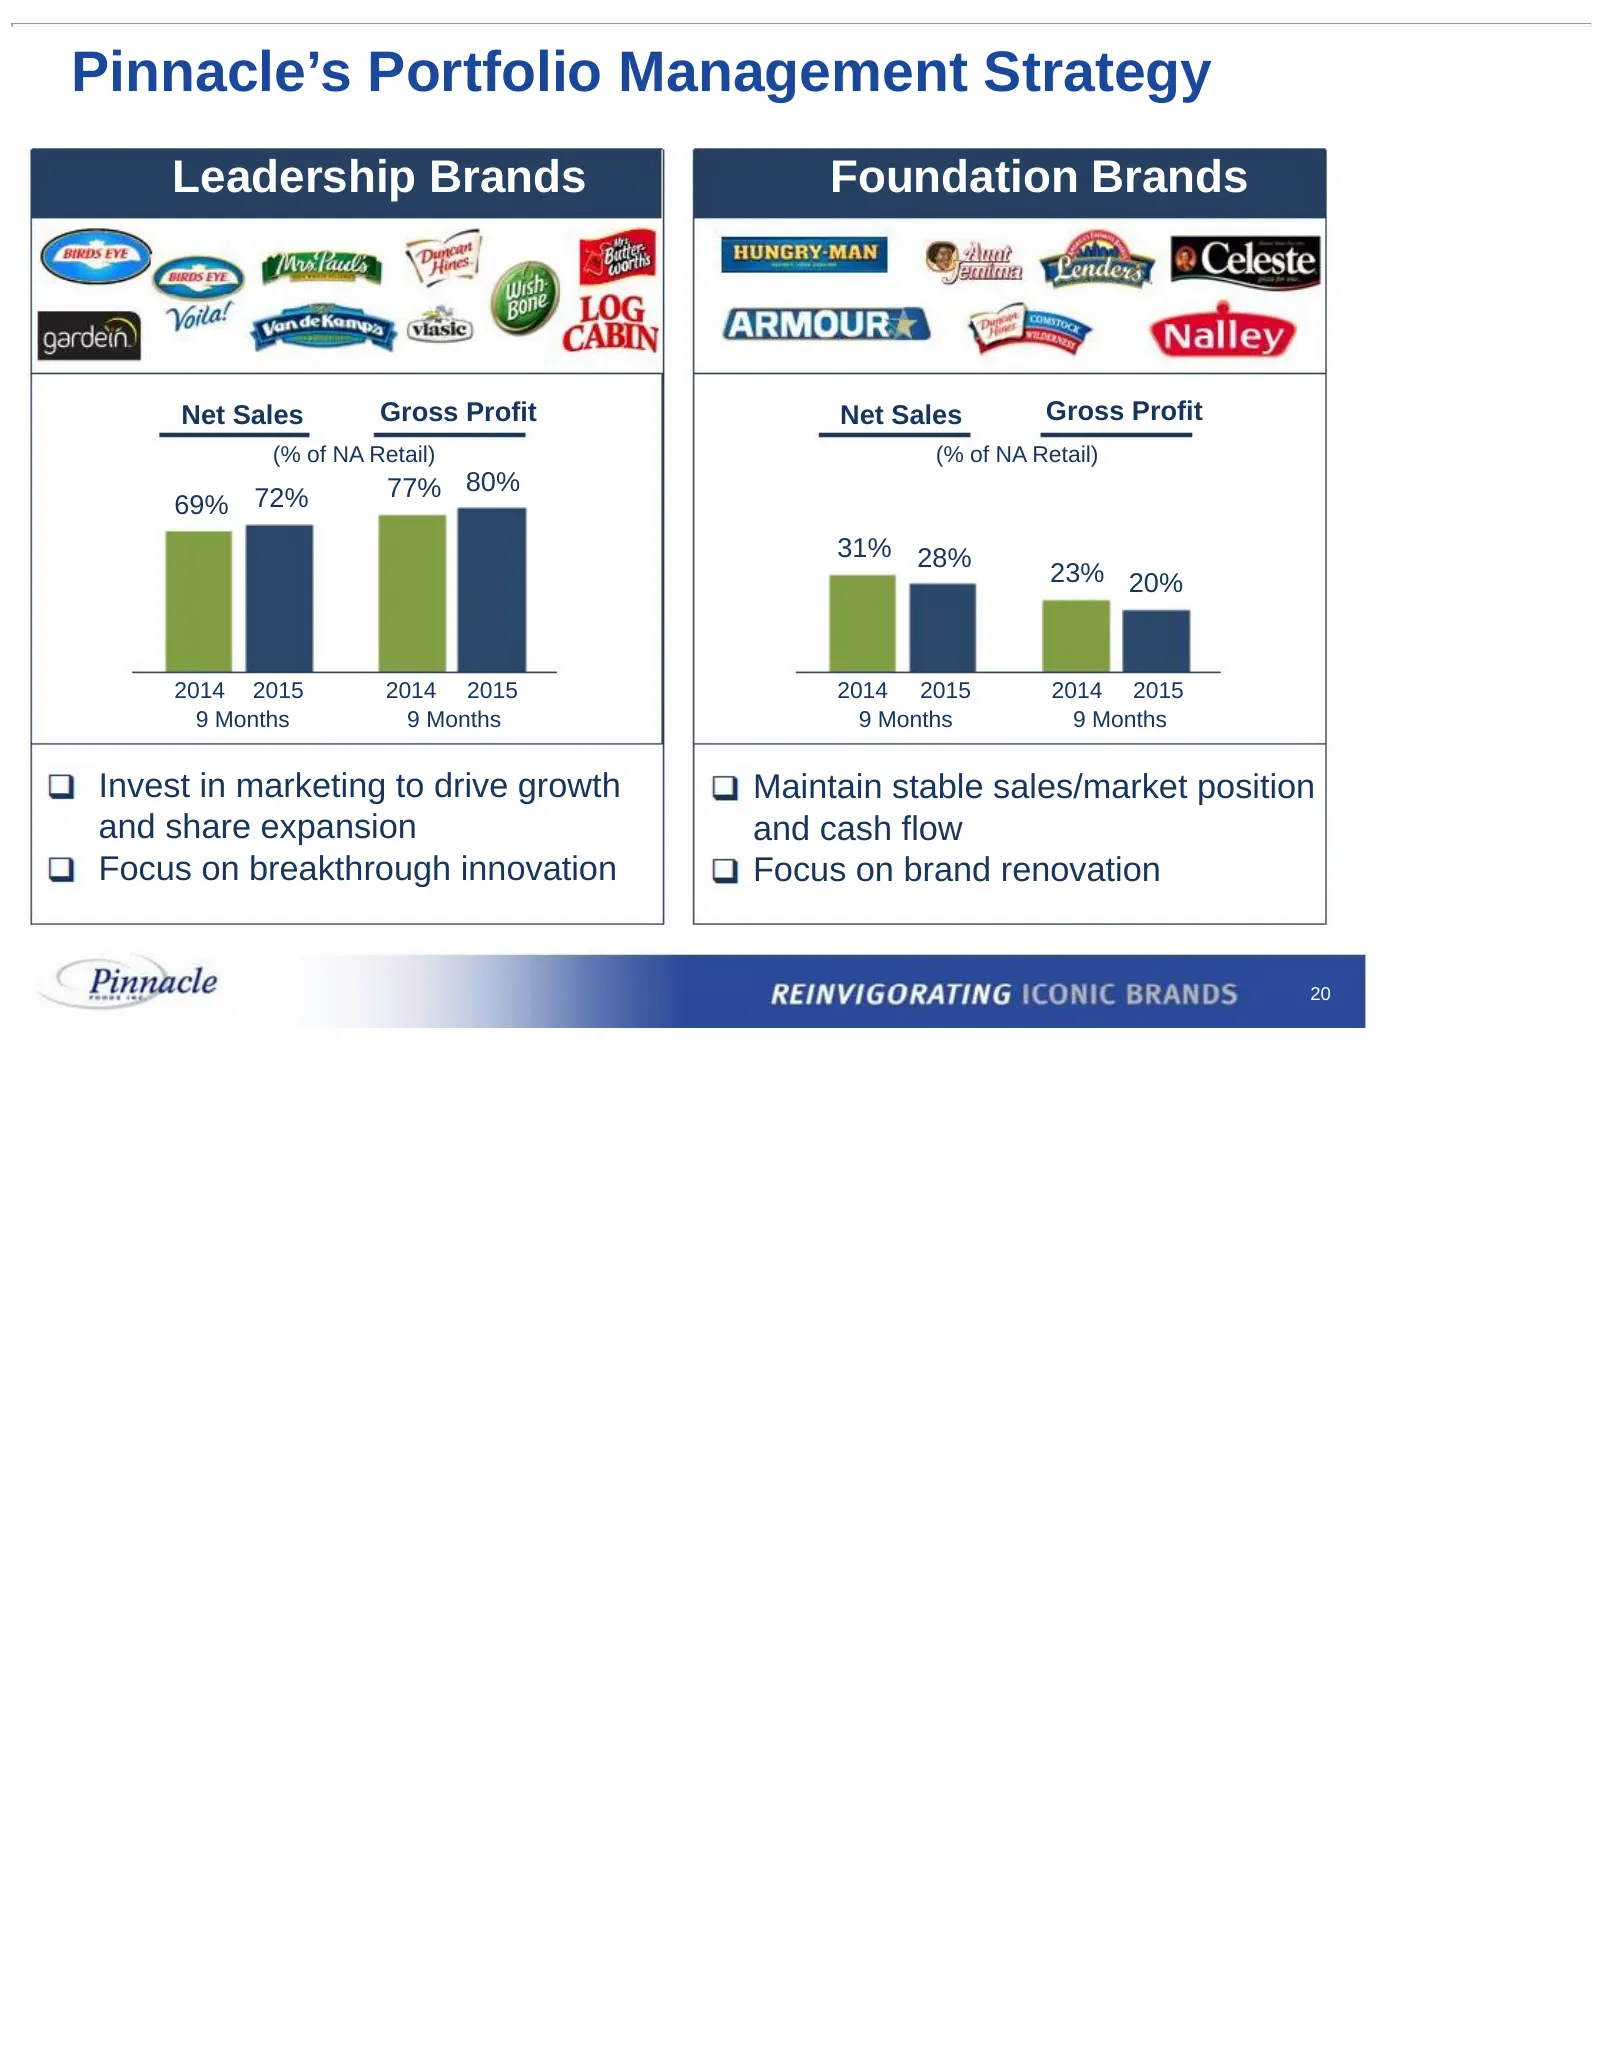
Pinnacle’s Portfolio Management Strategy Leadership Brands Foundation Brands Net Sales Gross Profit Net Sales Gross Profit (% of NA Retail) (% of NA Retail) 77% 80% 69% 72% 31% 28% 23% 20% 2014 2015 2014 2015 2014 2015 2014 2015 9 Months 9 Months 9 Months 9 Months Invest in marketing to drive growth
Slide 21: Driving Growth Through Innovation
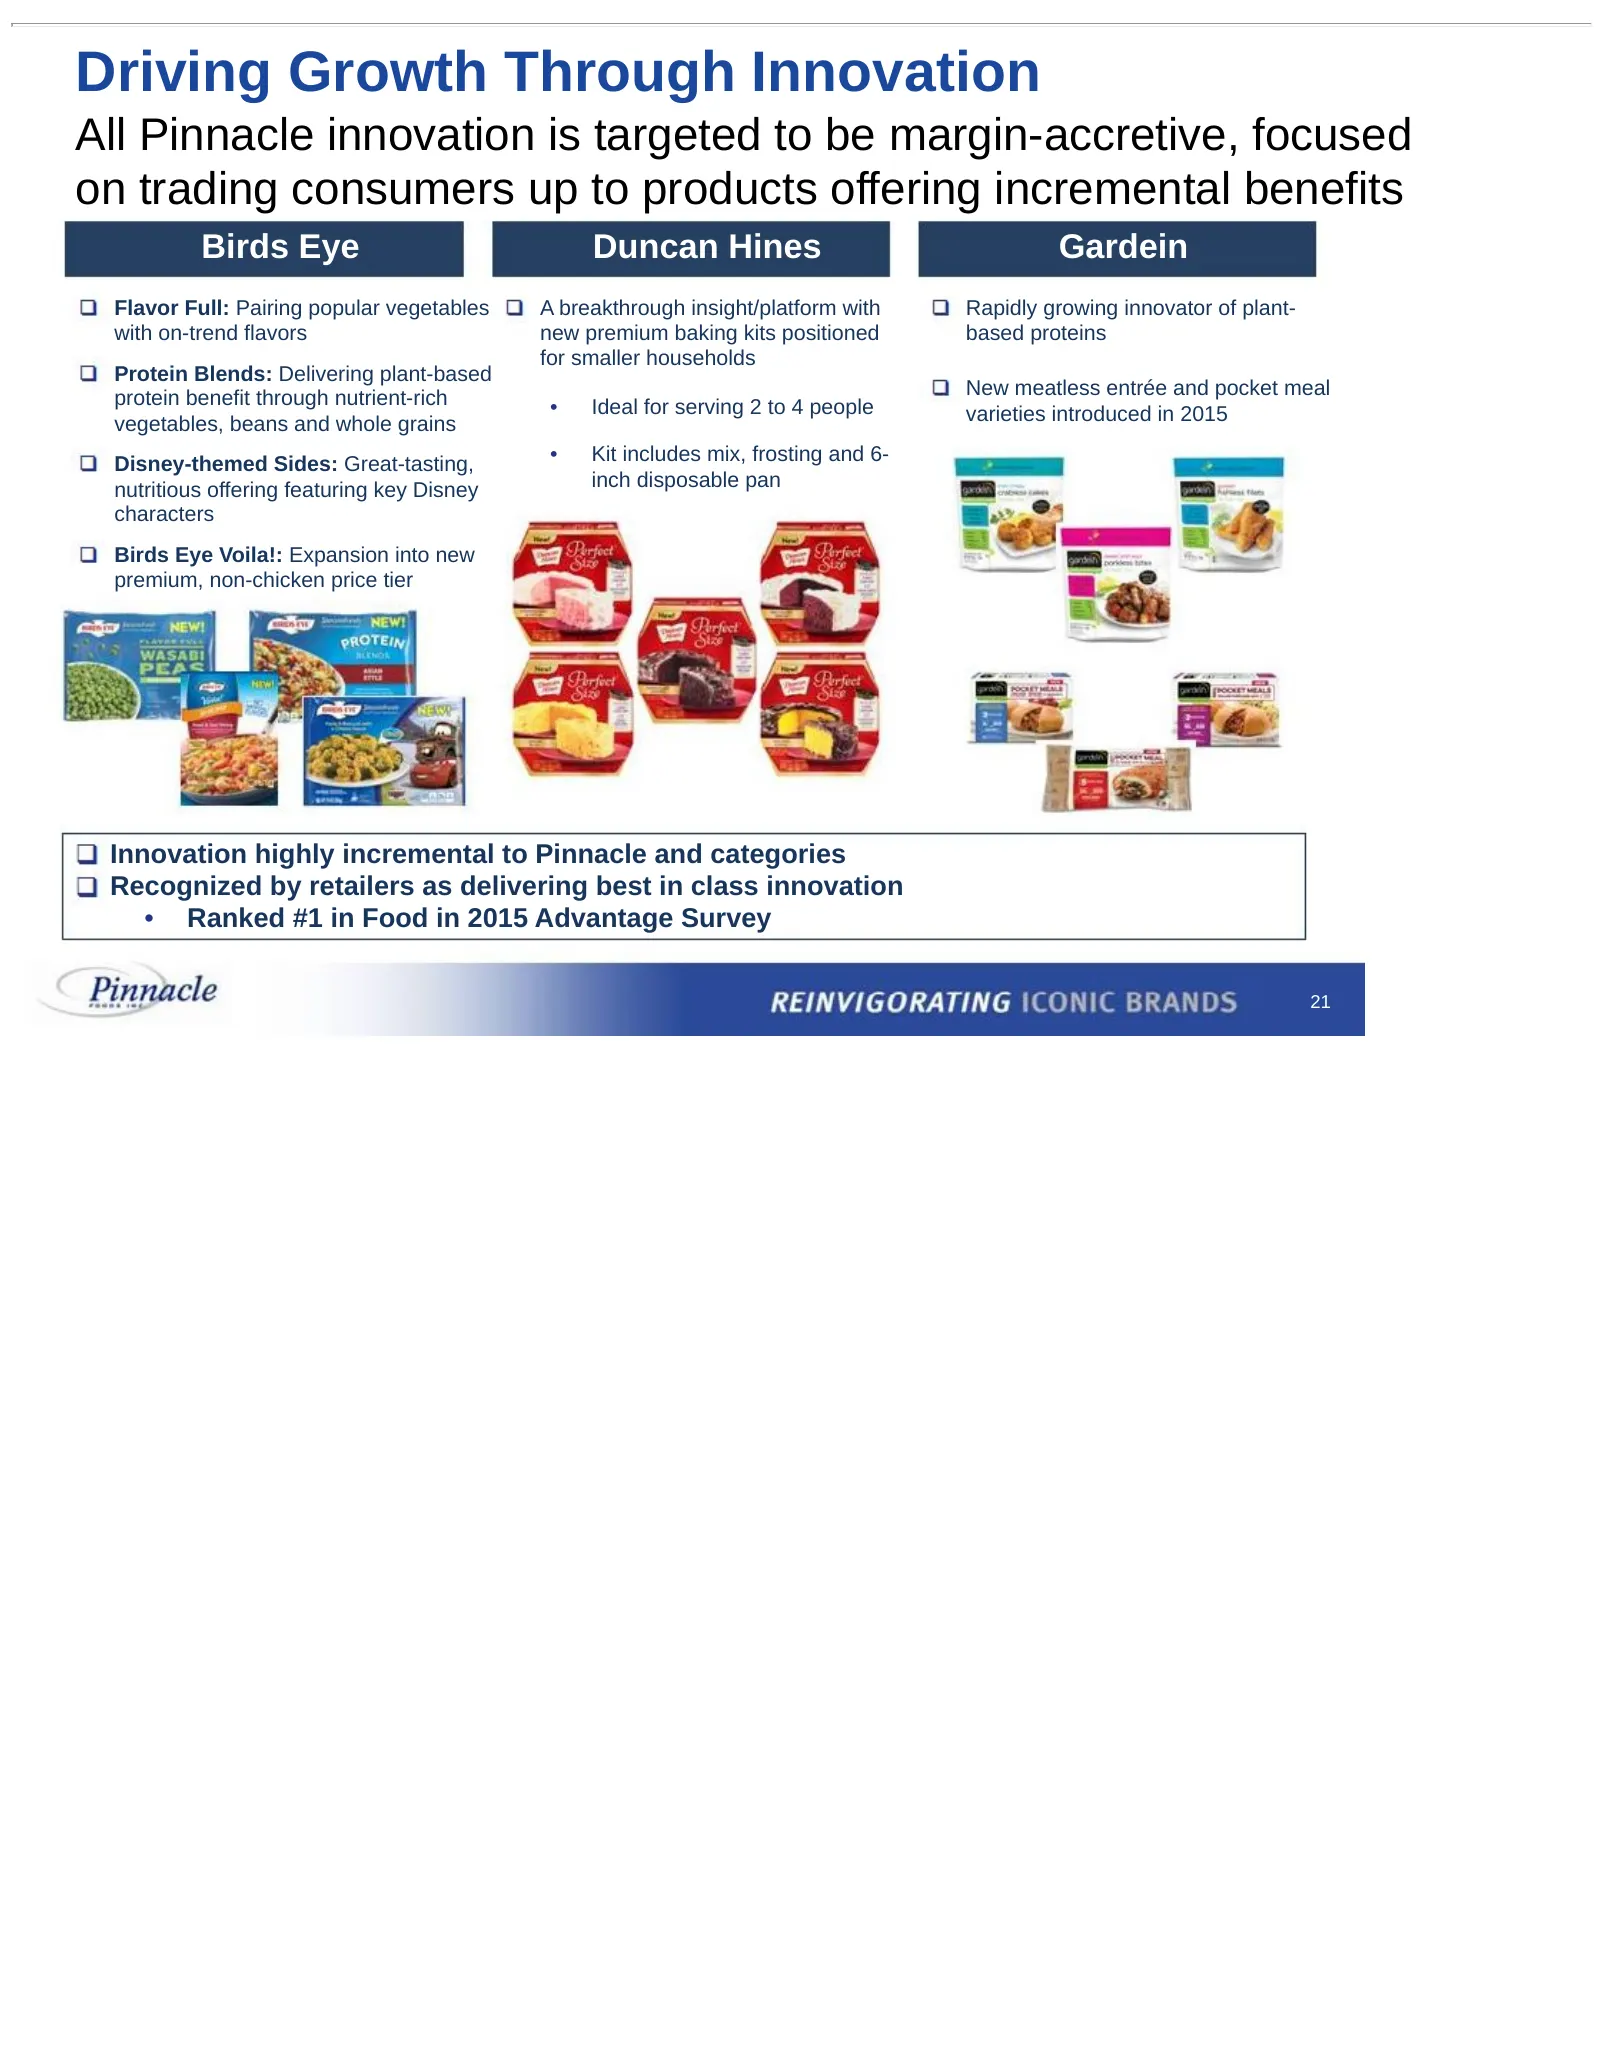
Driving Growth Through Innovation All Pinnacle innovation is targeted to be margin-accretive, focused on trading consumers up to products offering incremental benefits Birds Eye Duncan Hines Gardein Flavor Full: Pairing popular vegetables A breakthrough insight/platform with Rapidly growing innovato
Slide 22: Pinnacle Foods Composite Market Share
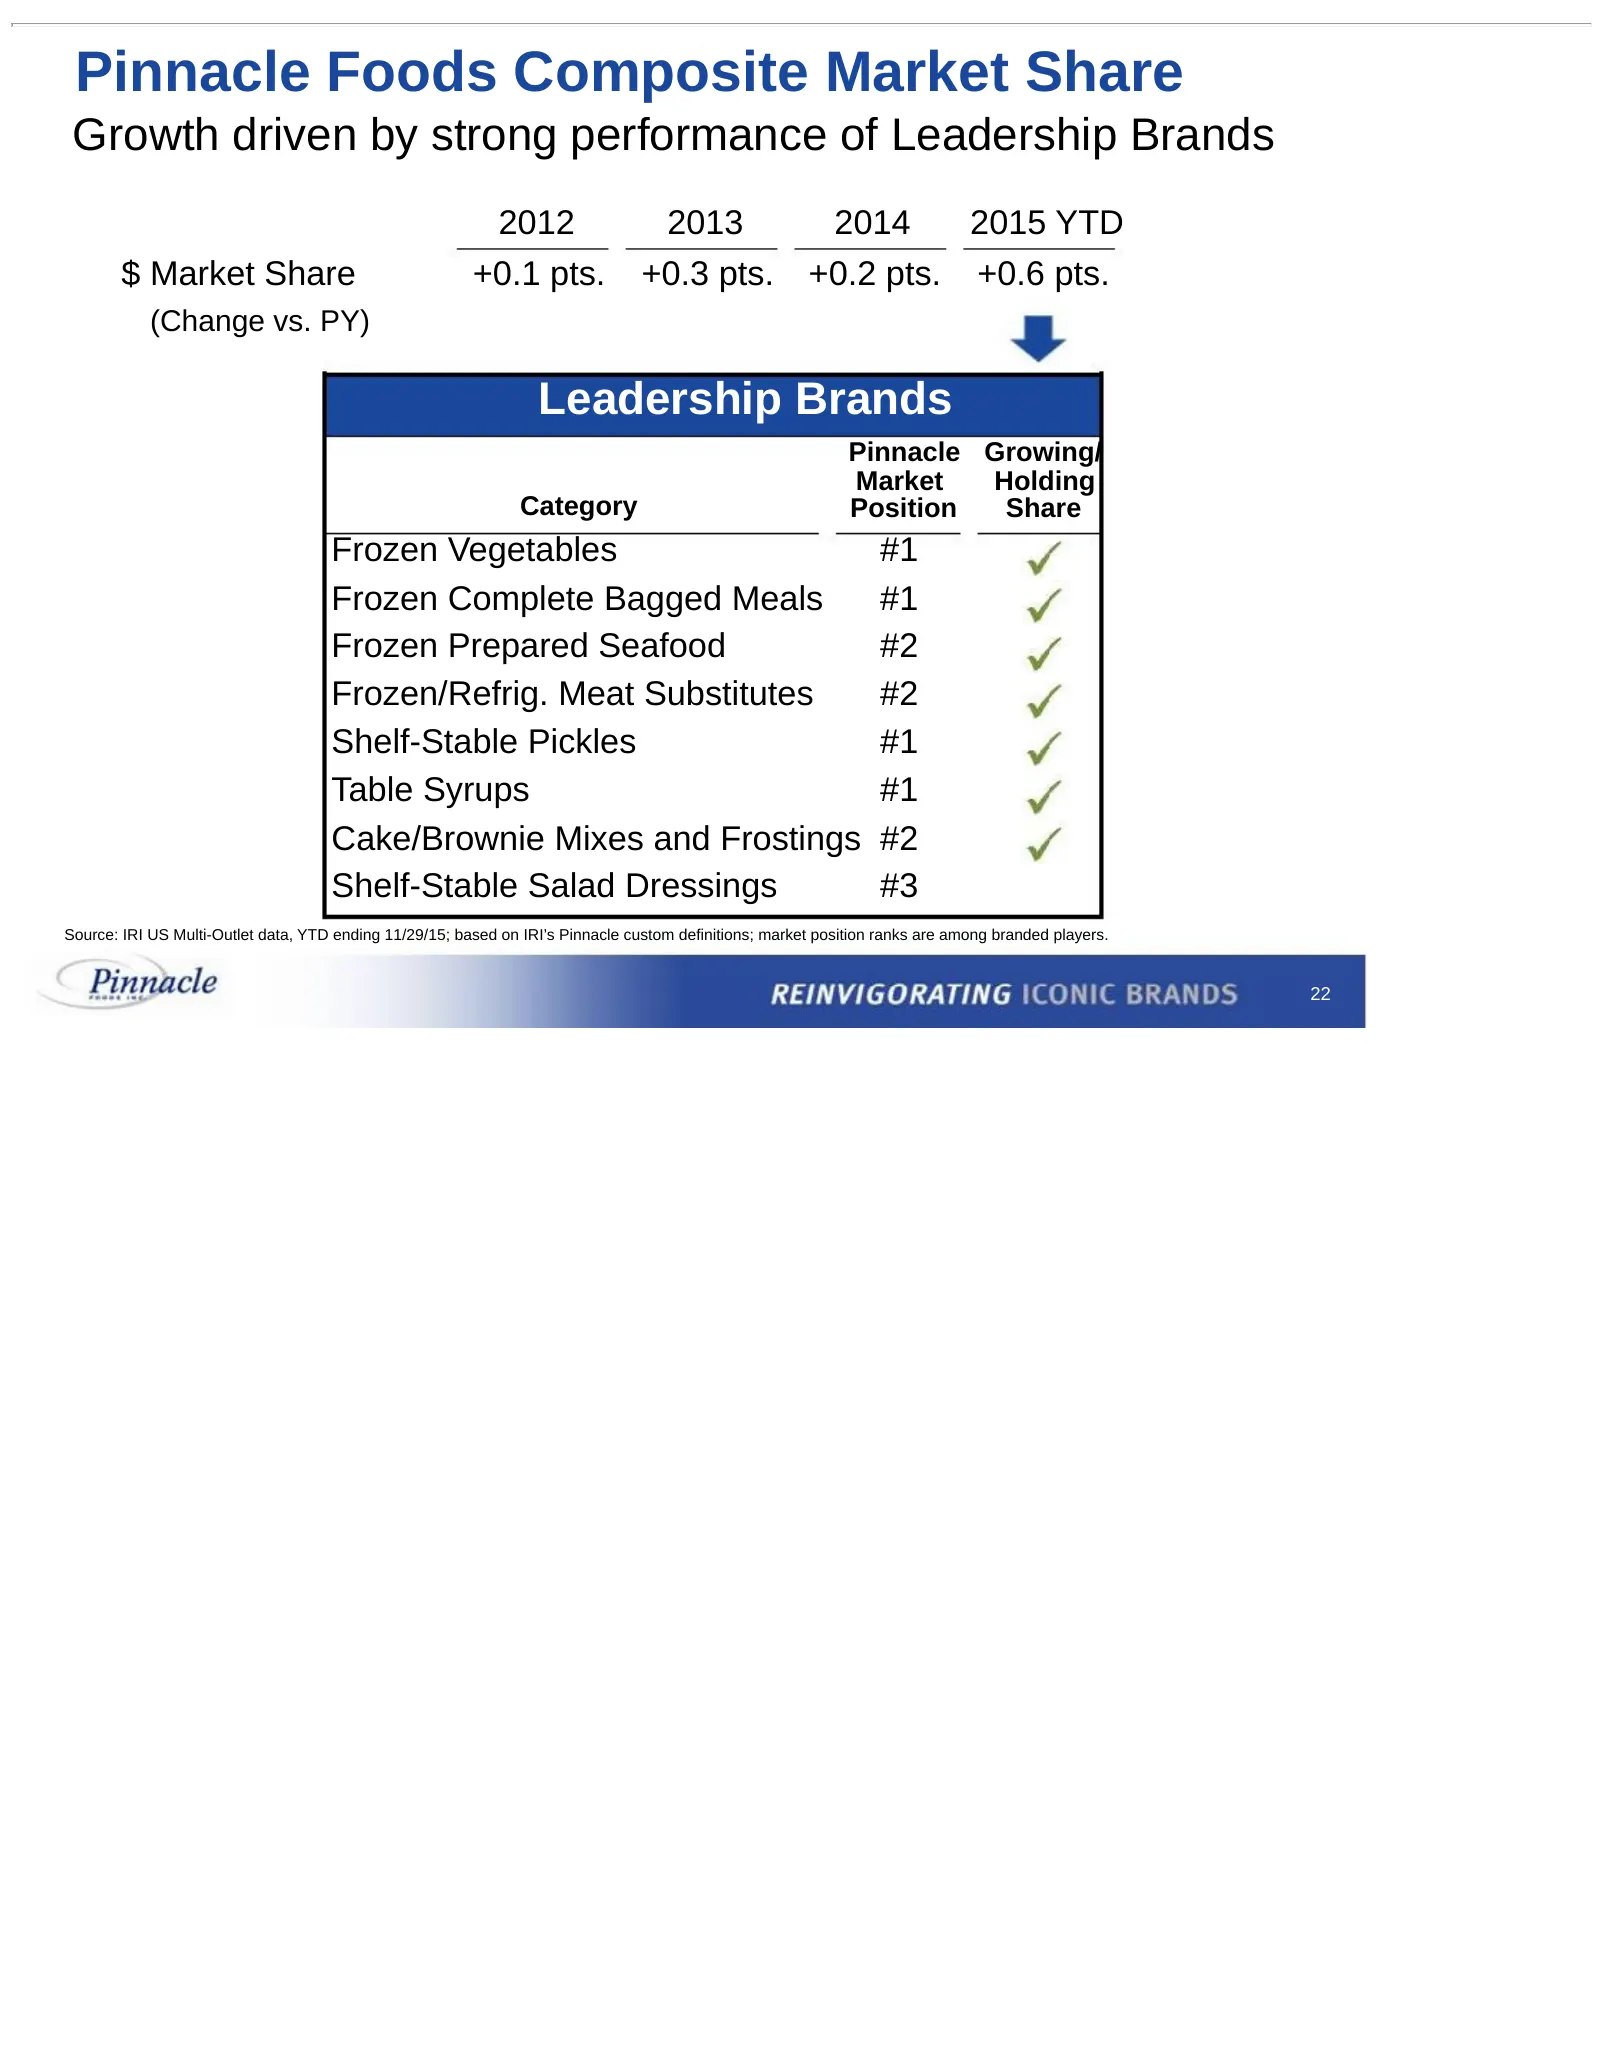
Pinnacle Foods Composite Market Share Growth driven by strong performance of Leadership Brands 2012 2013 2014 2015 YTD $ Market Share +0.1 pts. +0.3 pts. +0.2 pts. +0.6 pts. (Change vs. PY) Leadership Brands Pinnacle Growing/ Market Holding Category Position Share Frozen Vegetables #1 Frozen Complet
Slide 23: Maximizing Value Through Productivity at Pinnacle
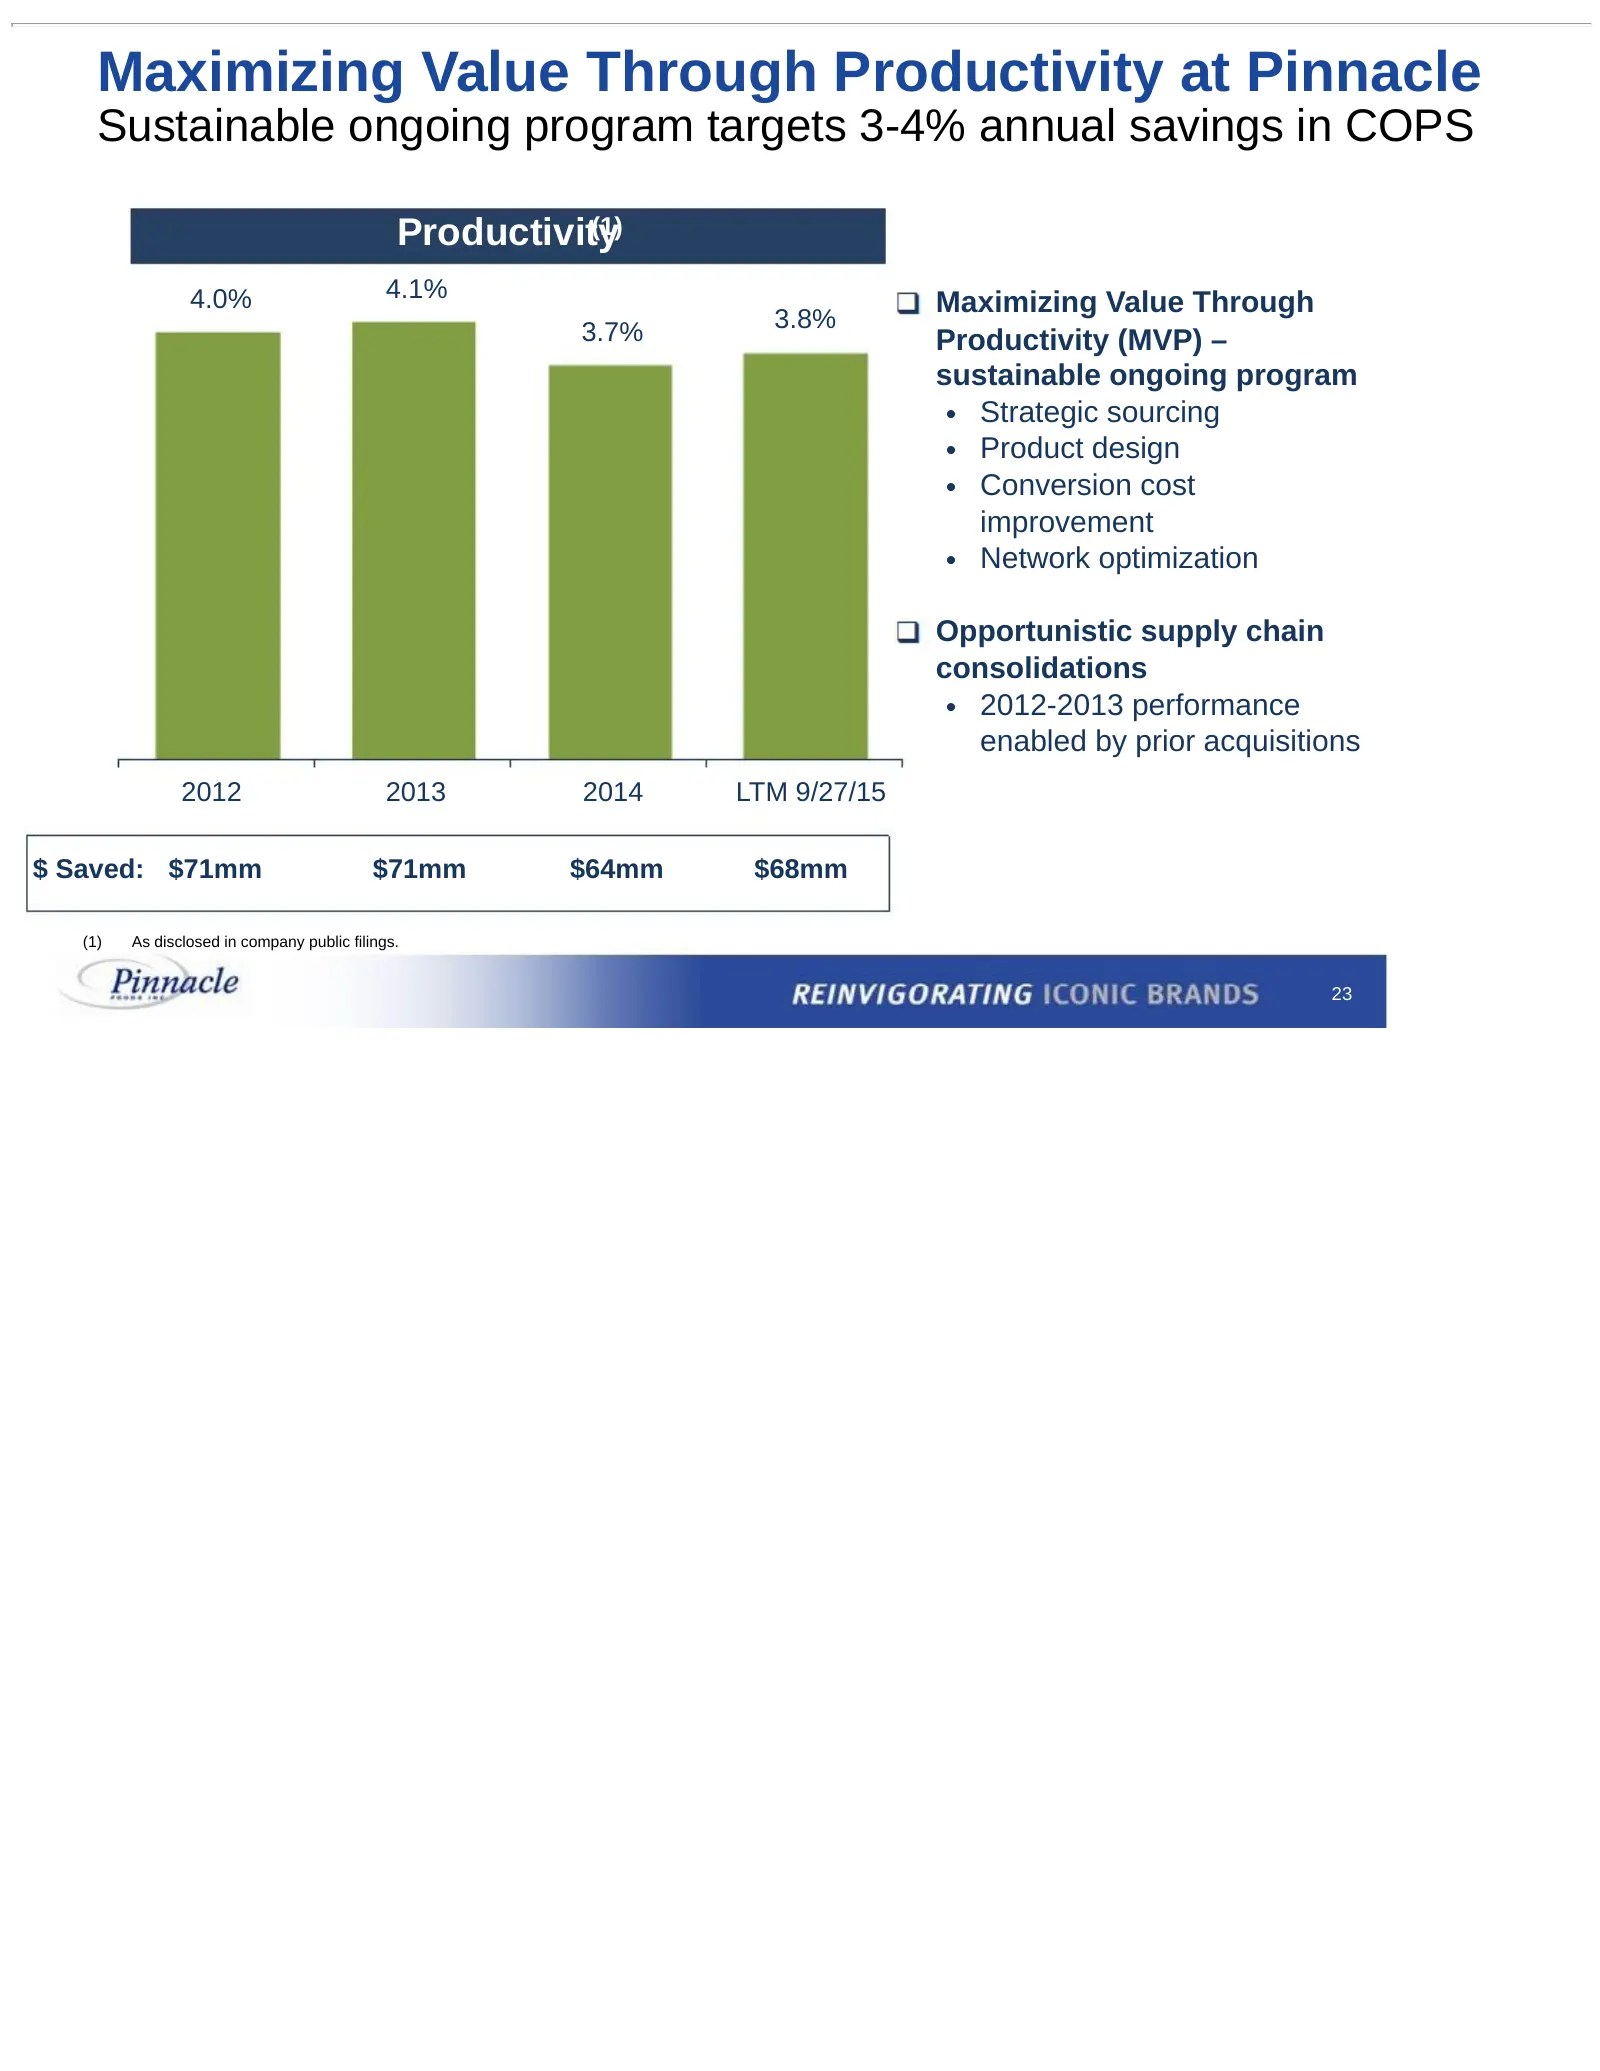
Maximizing Value Through Productivity at Pinnacle Sustainable ongoing program targets 3-4% annual savings in COPS Productivity (1) 4.0% 4.1% Maximizing Value Through 3.7% 3.8% Productivity (MVP) – sustainable ongoing program • Strategic sourcing • Product design • Conversion cost improvement • Netwo
Slide 24: Pinnacle's Input Cost Breakdown
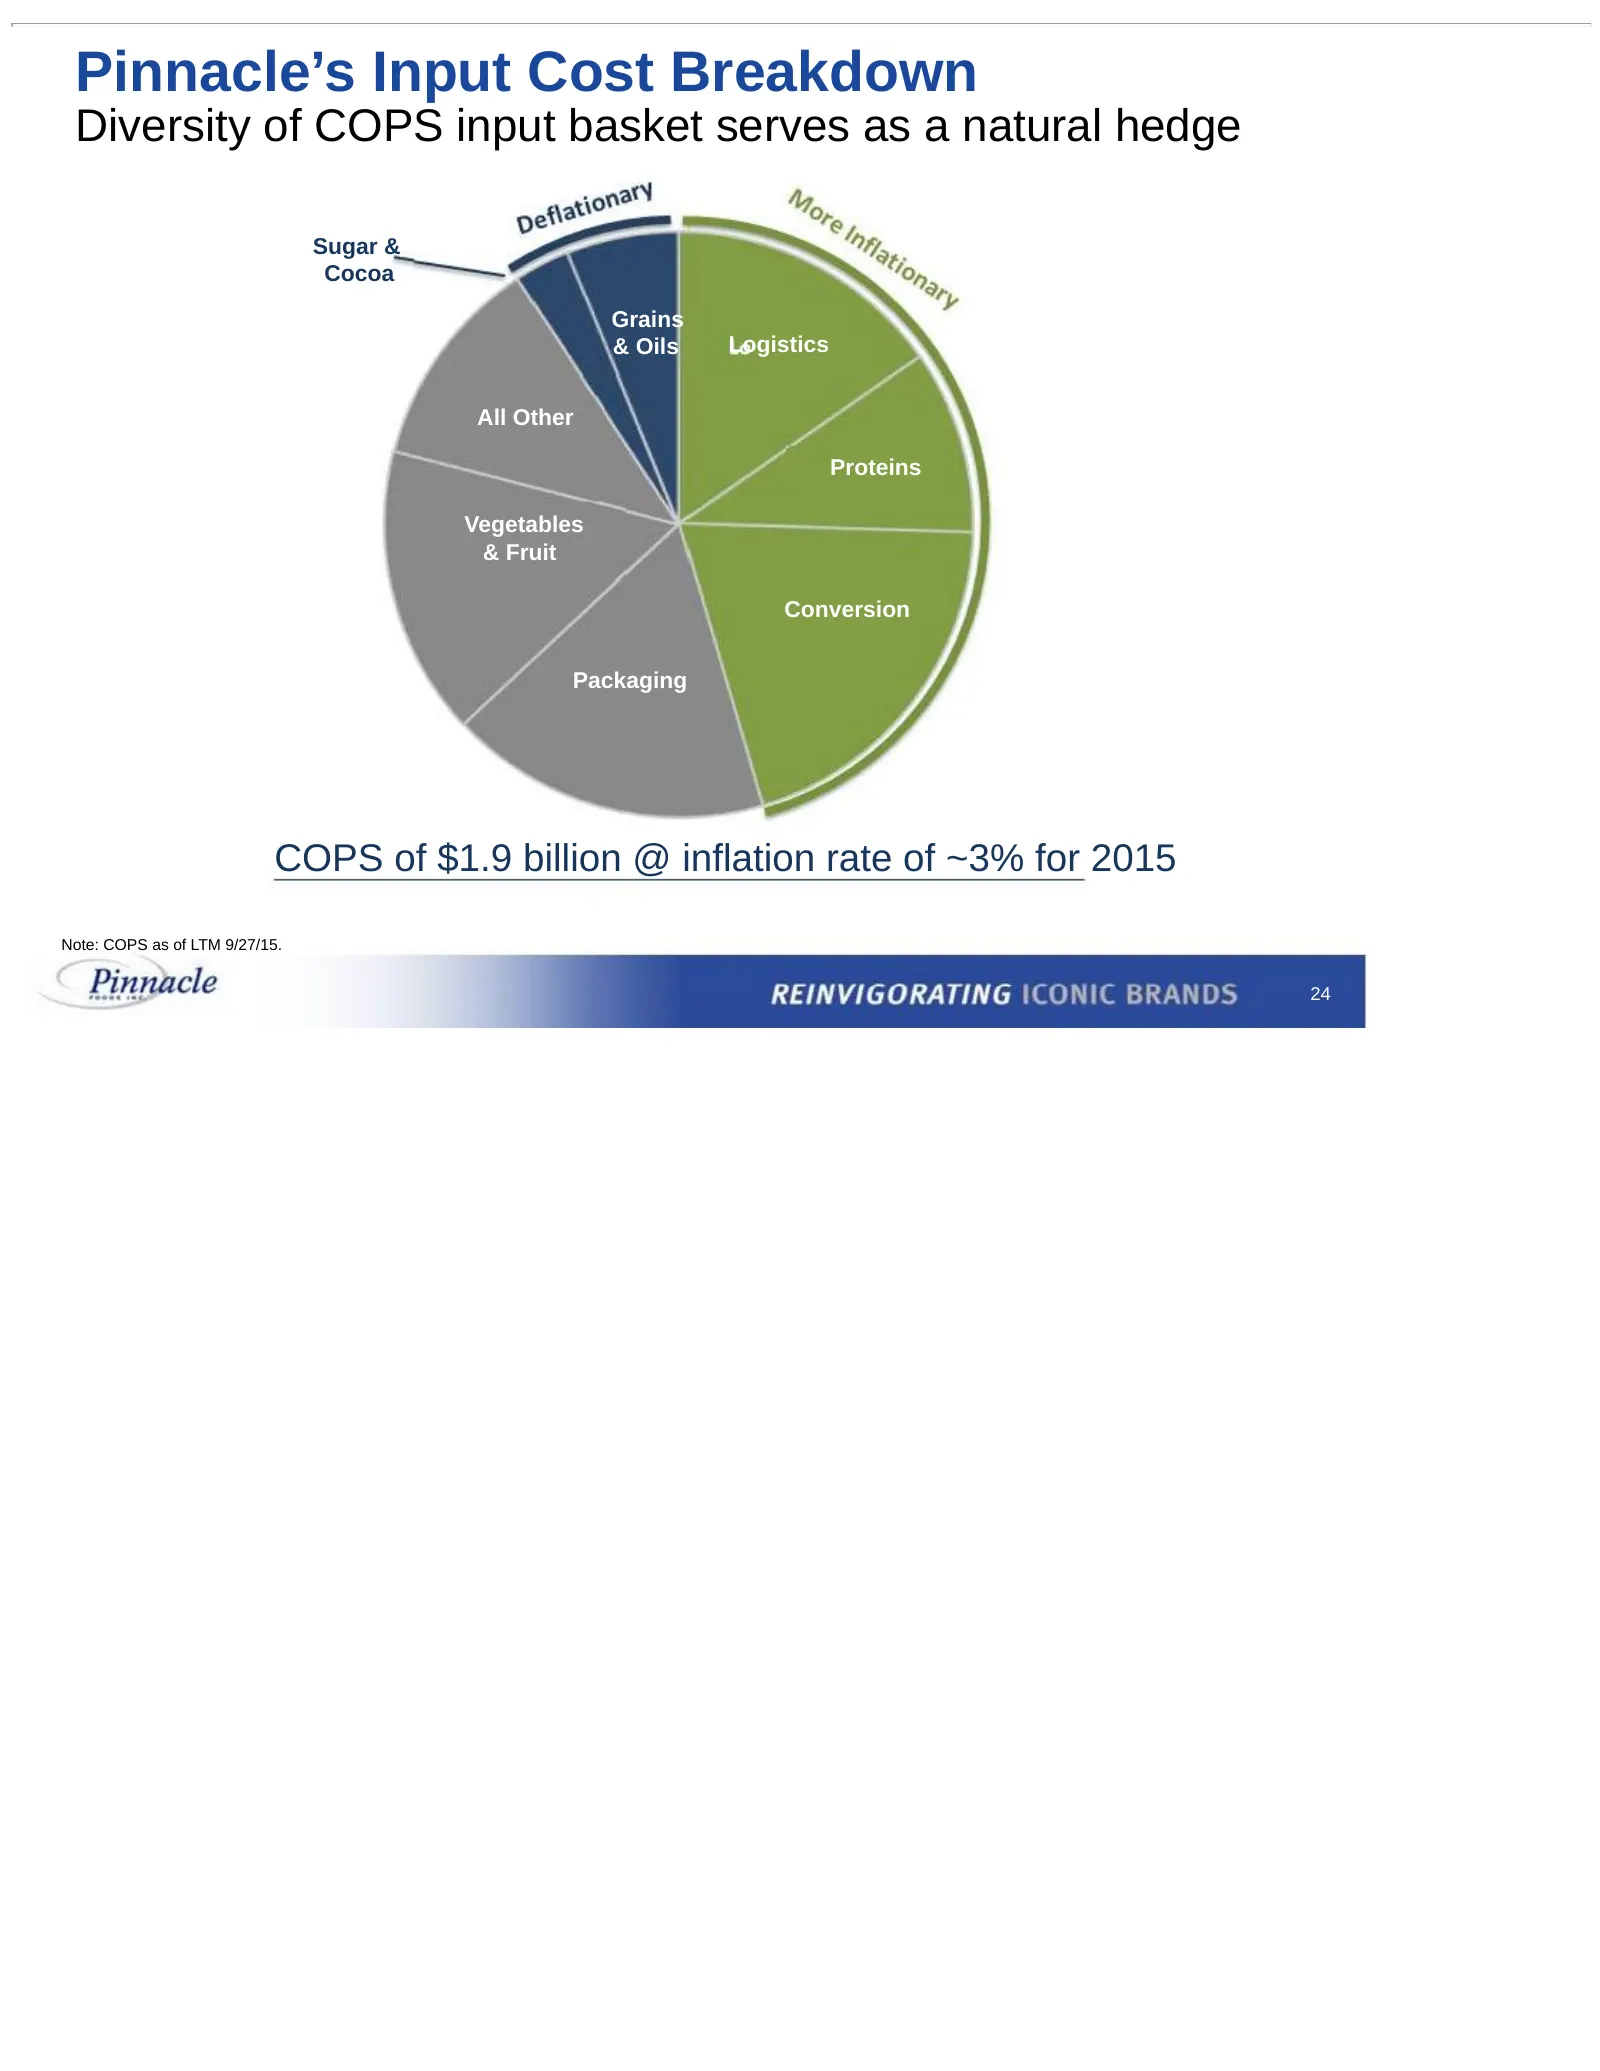
Pinnacle’s Input Cost Breakdown Diversity of COPS input basket serves as a natural hedge Sugar & Cocoa Grains & Oils Logistics All Other Proteins Vegetables & Fruit Conversion Packaging COPS of $1.9 billion @ inflation rate of ~3% for 2015 Note: COPS as of LTM 9/27/15. 24
Slide 25: Lean Overhead
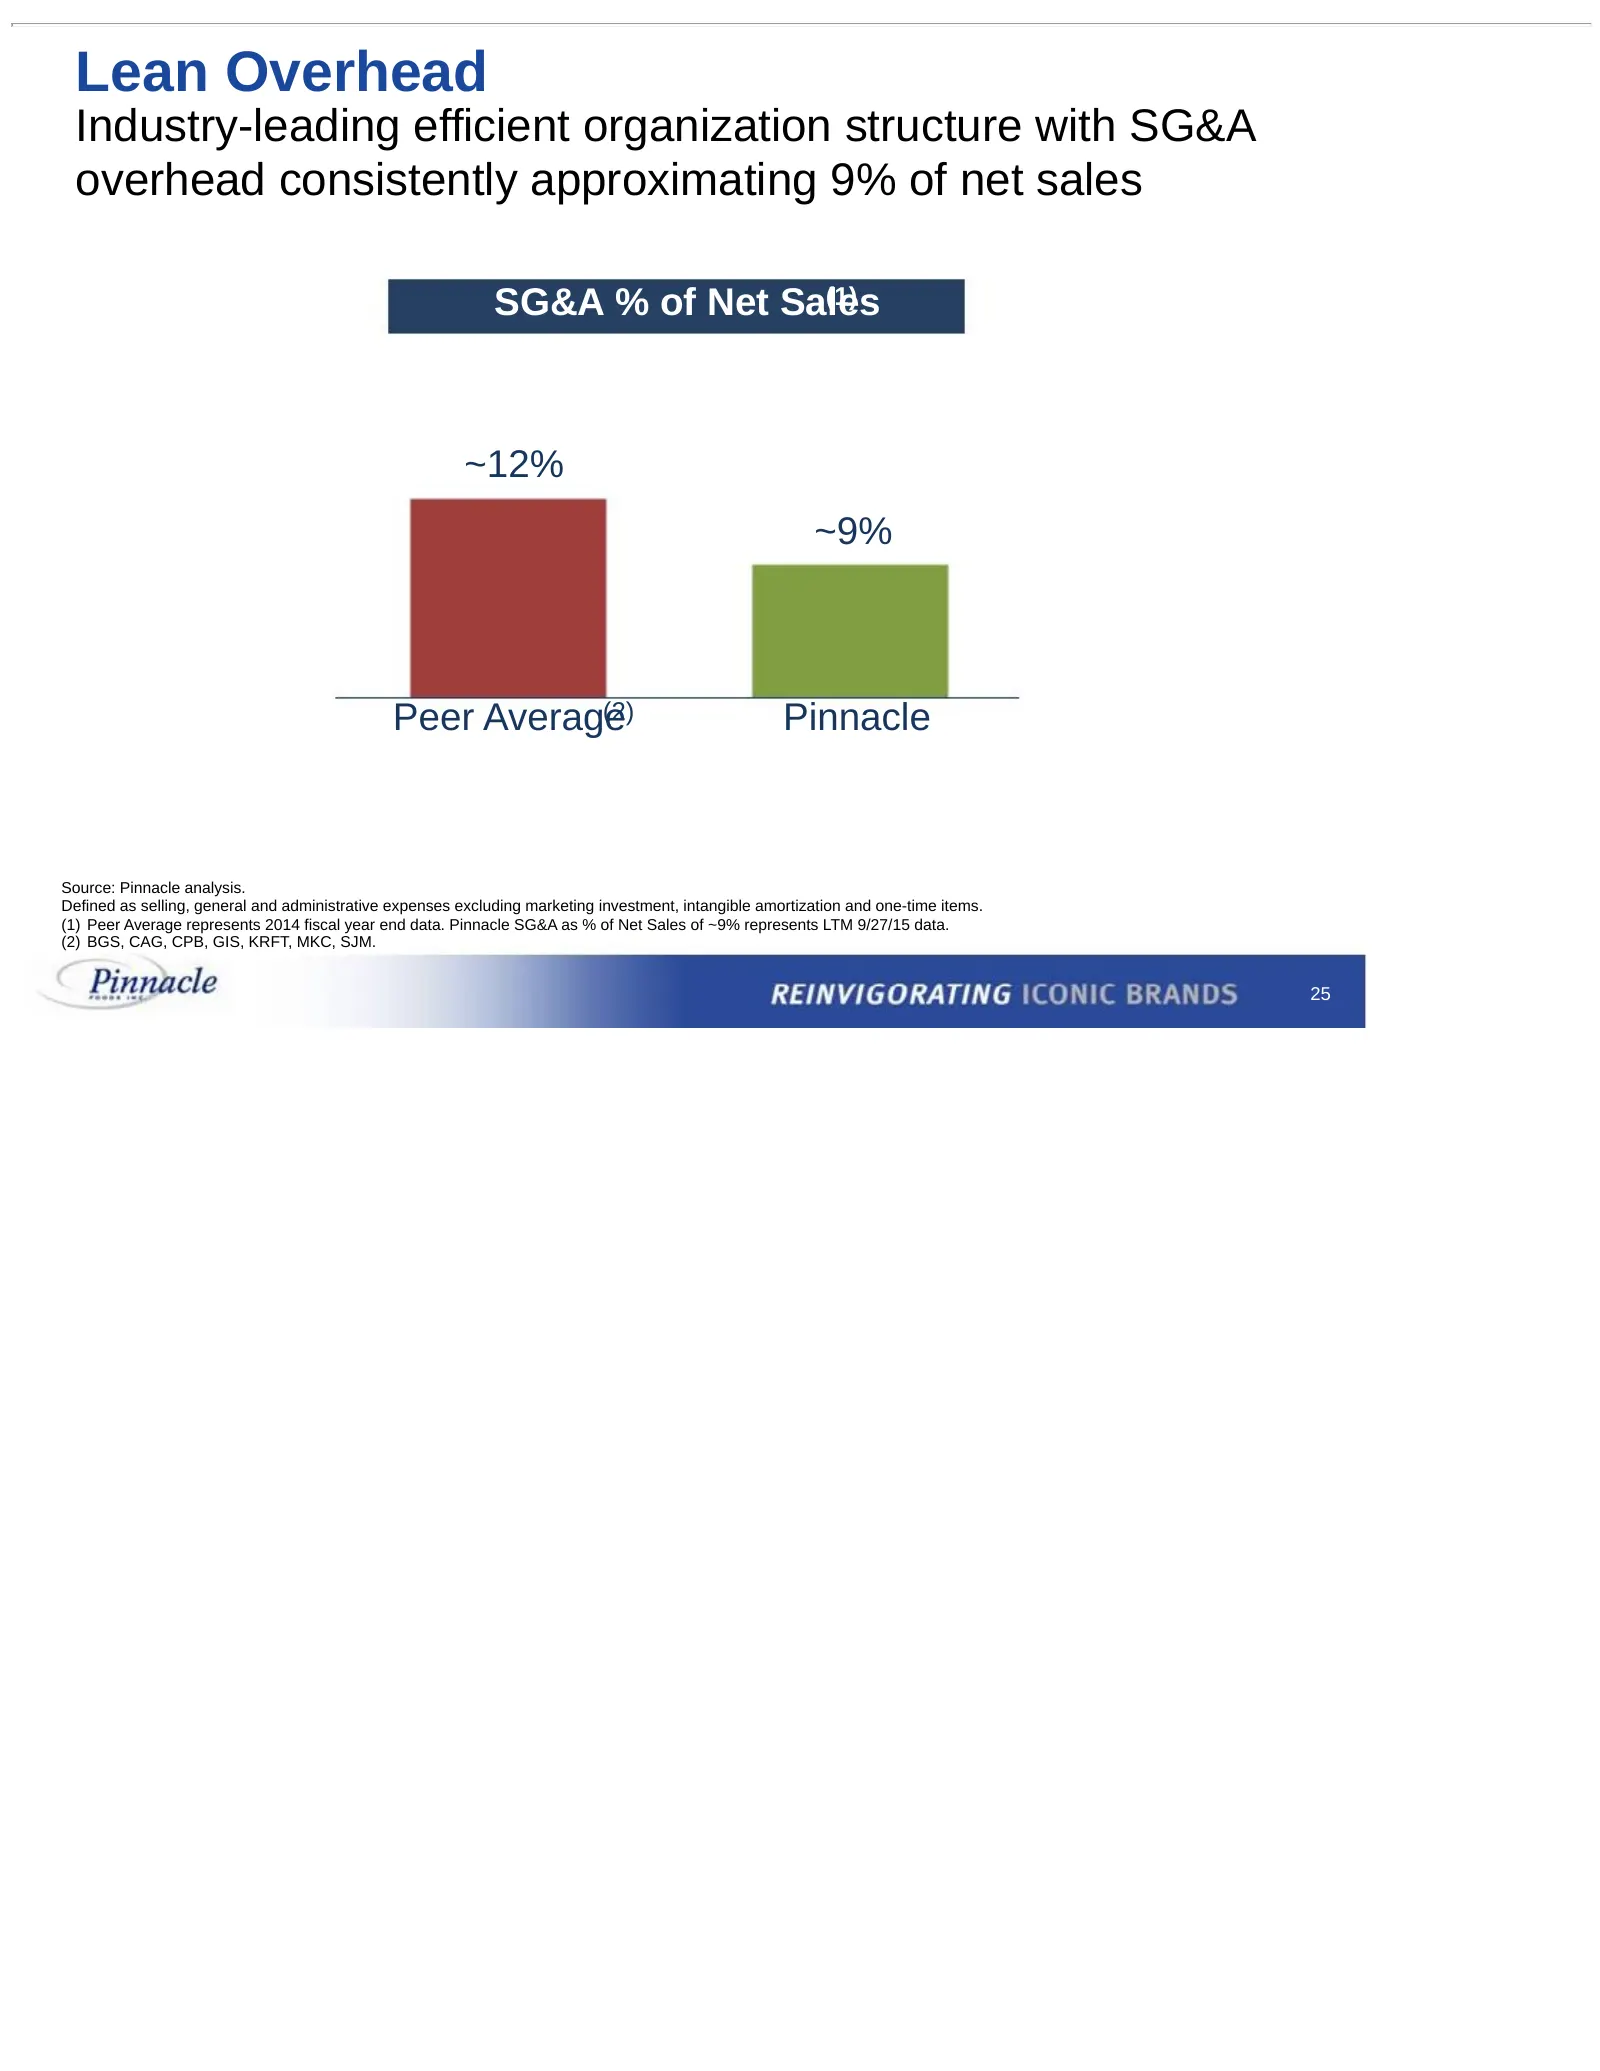
Lean Overhead Industry-leading efficient organization structure with SG&A overhead consistently approximating 9% of net sales SG&A % of Net Sales (1) ~12% ~9% Peer Average (2) Pinnacle Source: Pinnacle analysis. Defined as selling, general and administrative expenses excluding marketing investment,
Slide 26: Pinnacle's Gross Margin Improvement Translates to EBITDA Margin Expansion
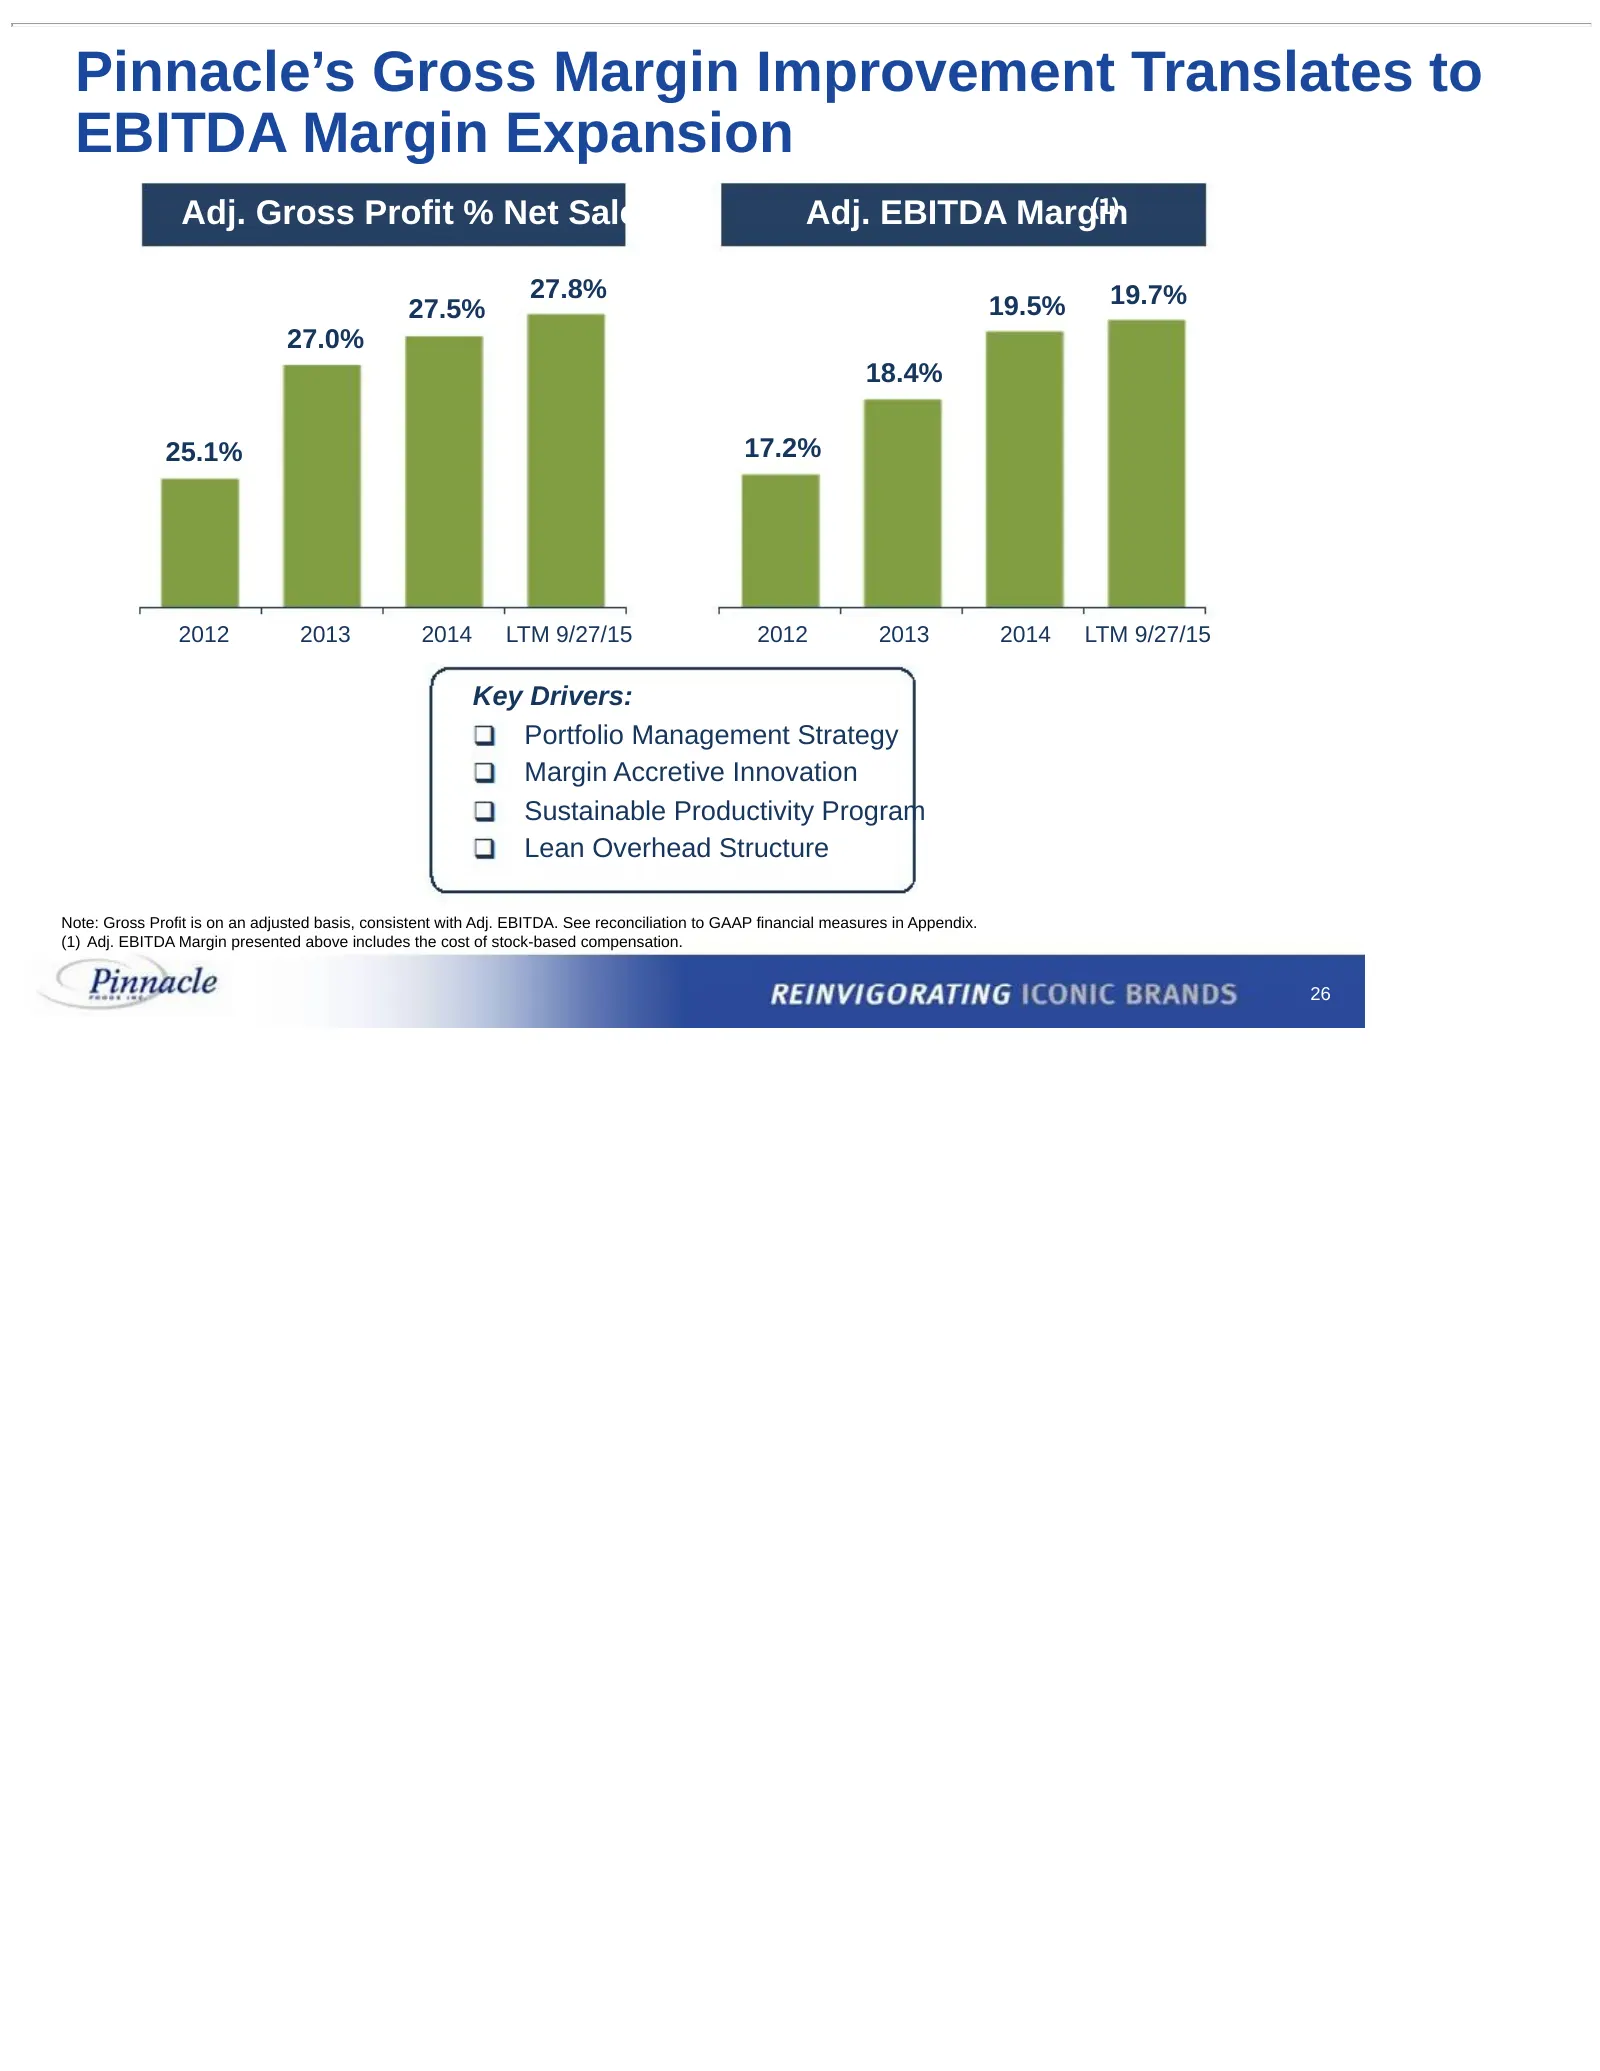
Pinnacle’s Gross Margin Improvement Translates to EBITDA Margin Expansion Adj. Gross Profit % Net Sales Adj. EBITDA Margin (1) 27.8% 19.7% 27.5% 19.5% 27.0% 18.4% 25.1% 17.2% 2012 2013 2014 LTM 9/27/15 2012 2013 2014 LTM 9/27/15 Key Drivers: Portfolio Management Strategy Margin Accretive Innovation
Slide 27: Superior Free Cash Flow Generation
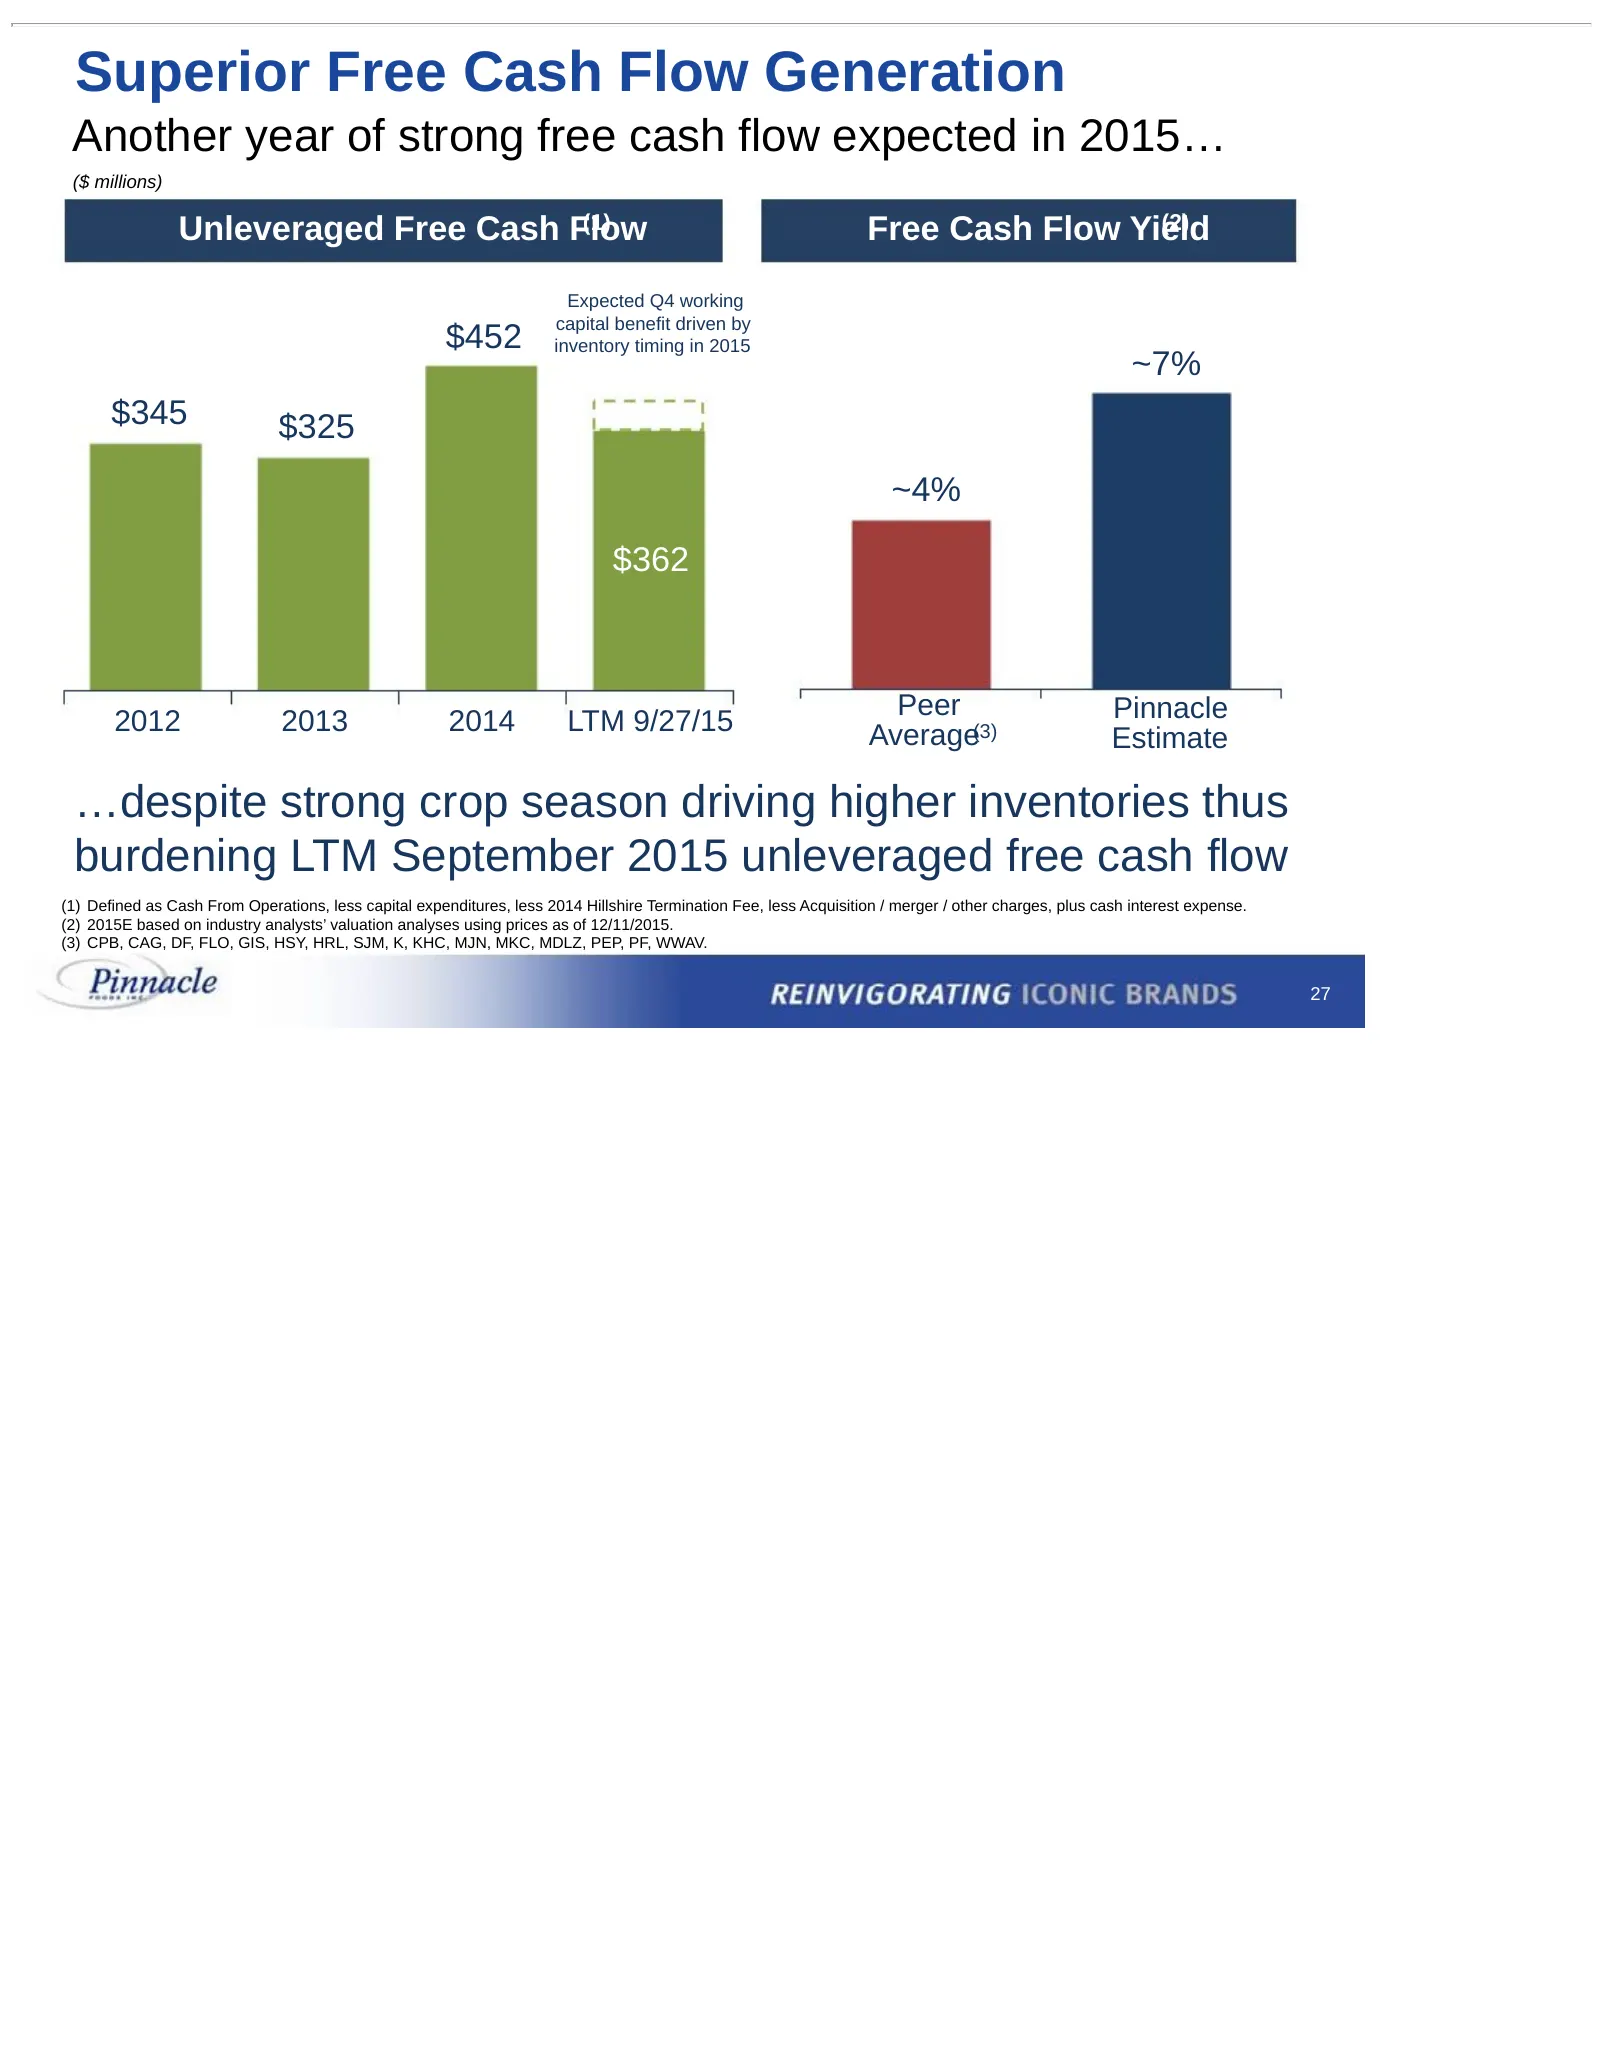
Superior Free Cash Flow Generation Another year of strong free cash flow expected in 2015… ($ millions) Unleveraged Free Cash Flow (1) Free Cash Flow Yield (2) Expected Q4 working capital benefit driven by $452 inventory timing in 2015 ~7% $345 $325 ~4% $362 Peer Pinnacle 2012 2013 2014 LTM 9/27/15
Slide 28: Capital Expenditures
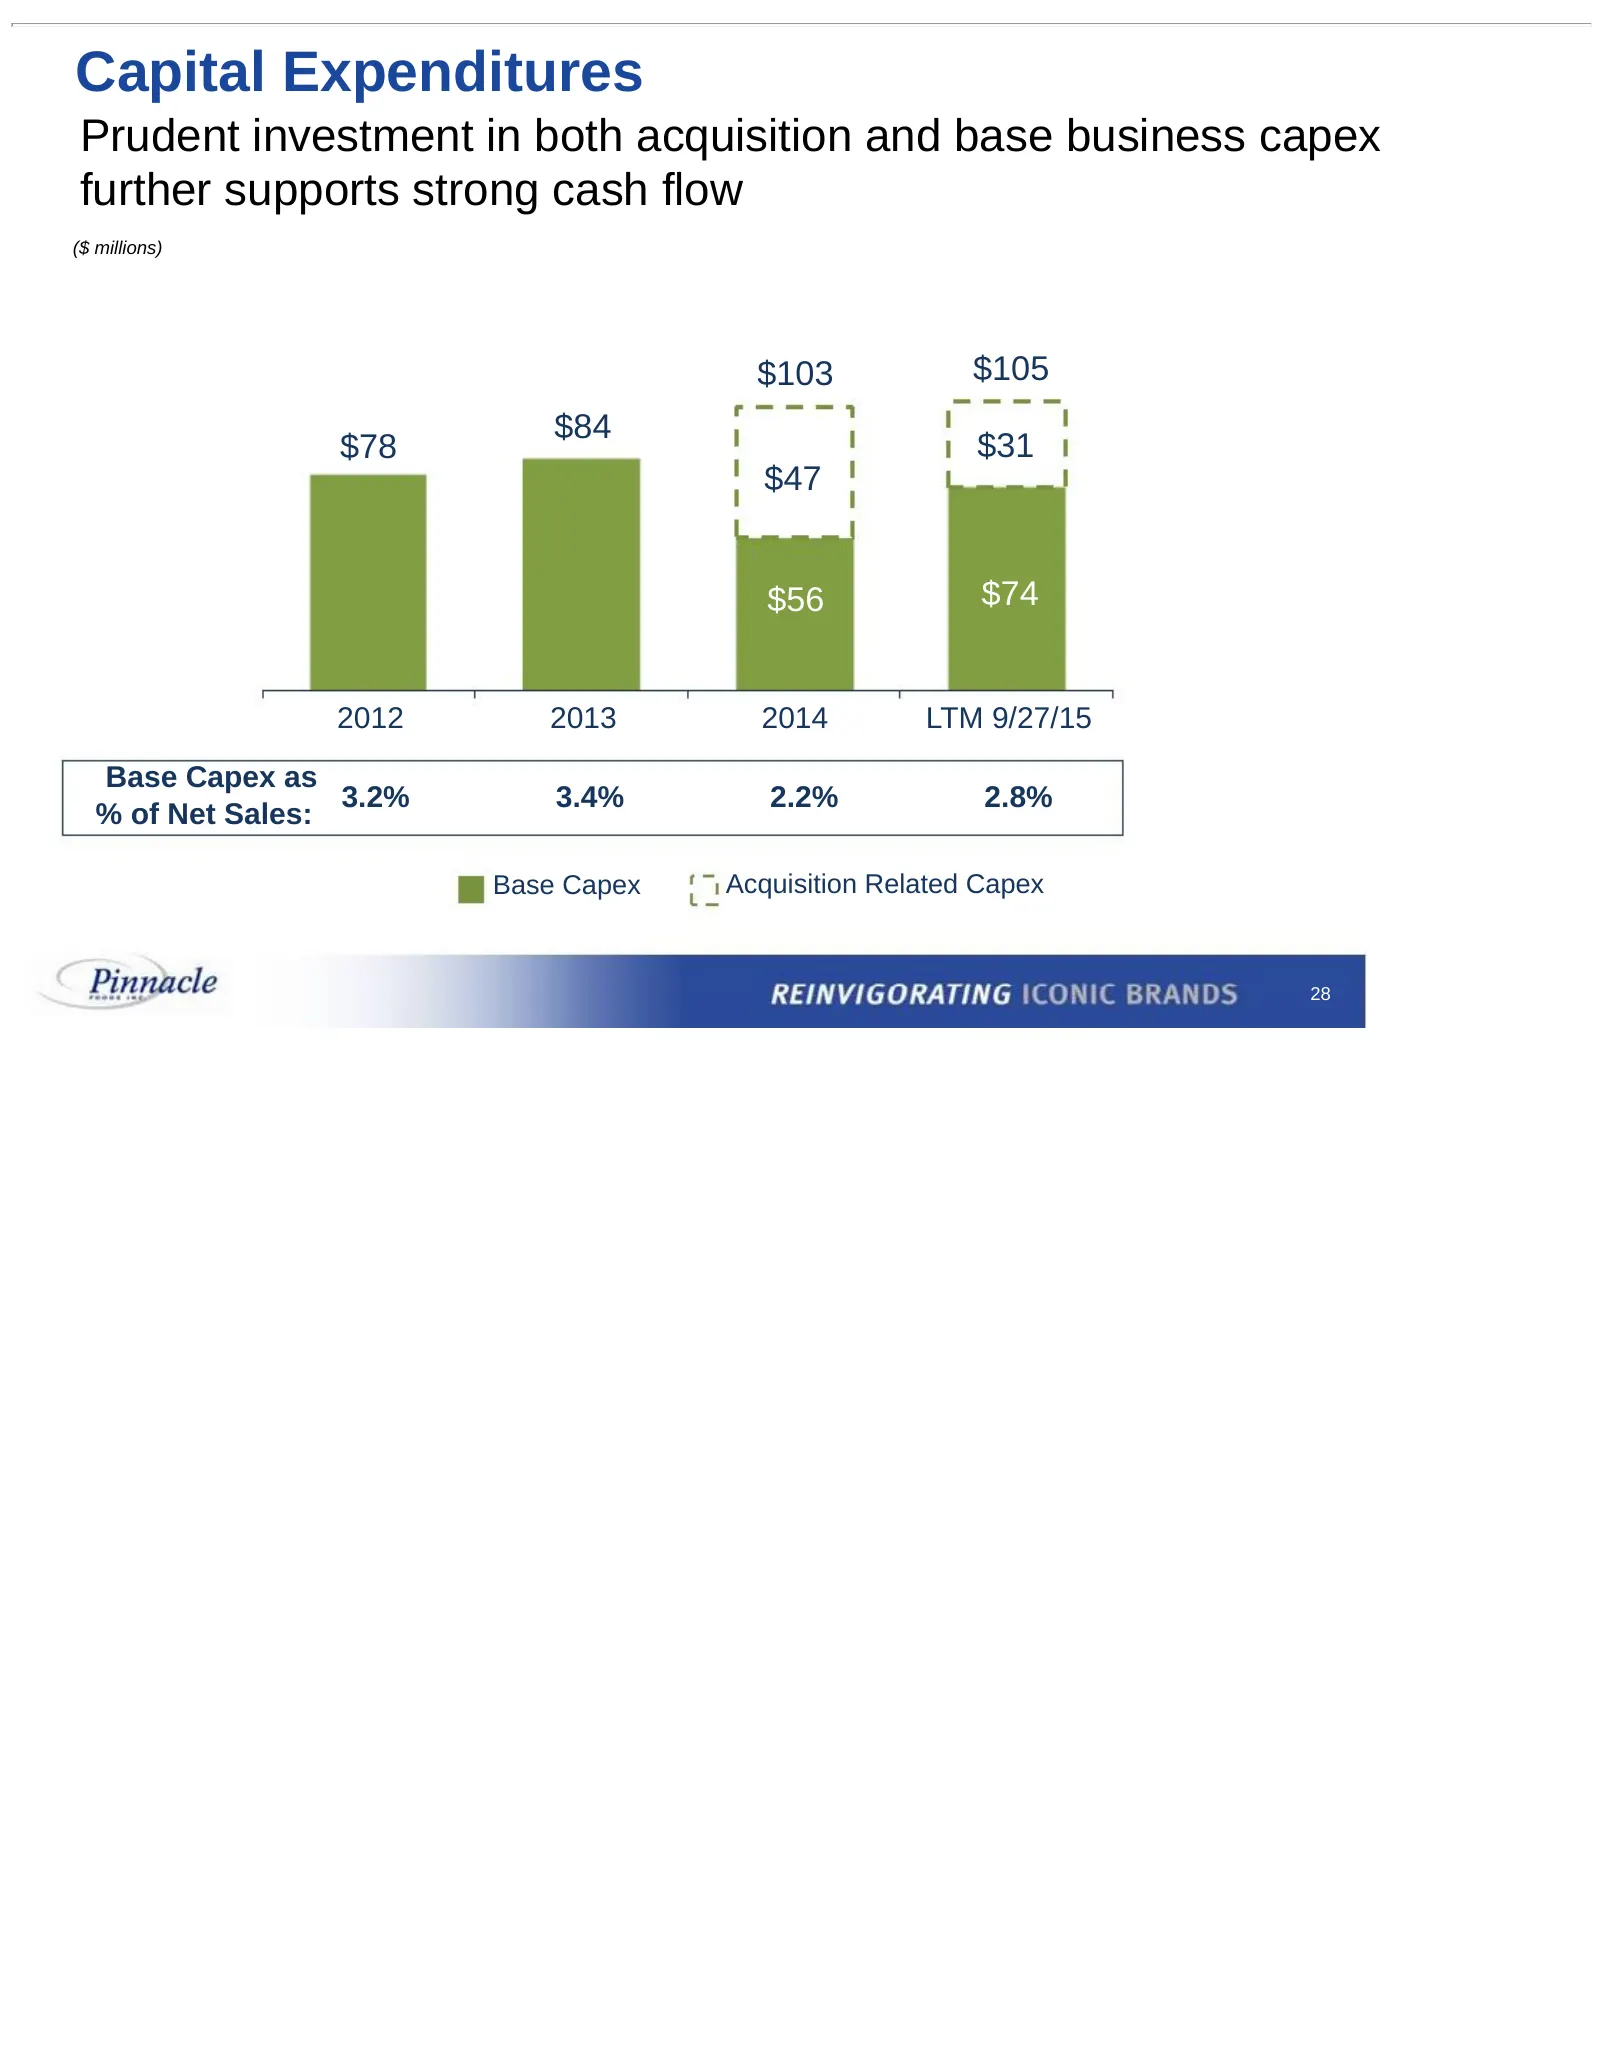
Capital Expenditures Prudent investment in both acquisition and base business capex further supports strong cash flow ($ millions) $103 $105 $84 $78 $31 $47 $TBD $56 $74 2012 2013 2014 LTM 9/27/15 Base Capex as 3.2% 3.4% 2.2% 2.8% % of Net Sales: Base Capex Acquisition Related Capex 28
Slide 29: Historical Pinnacle Financial Performance
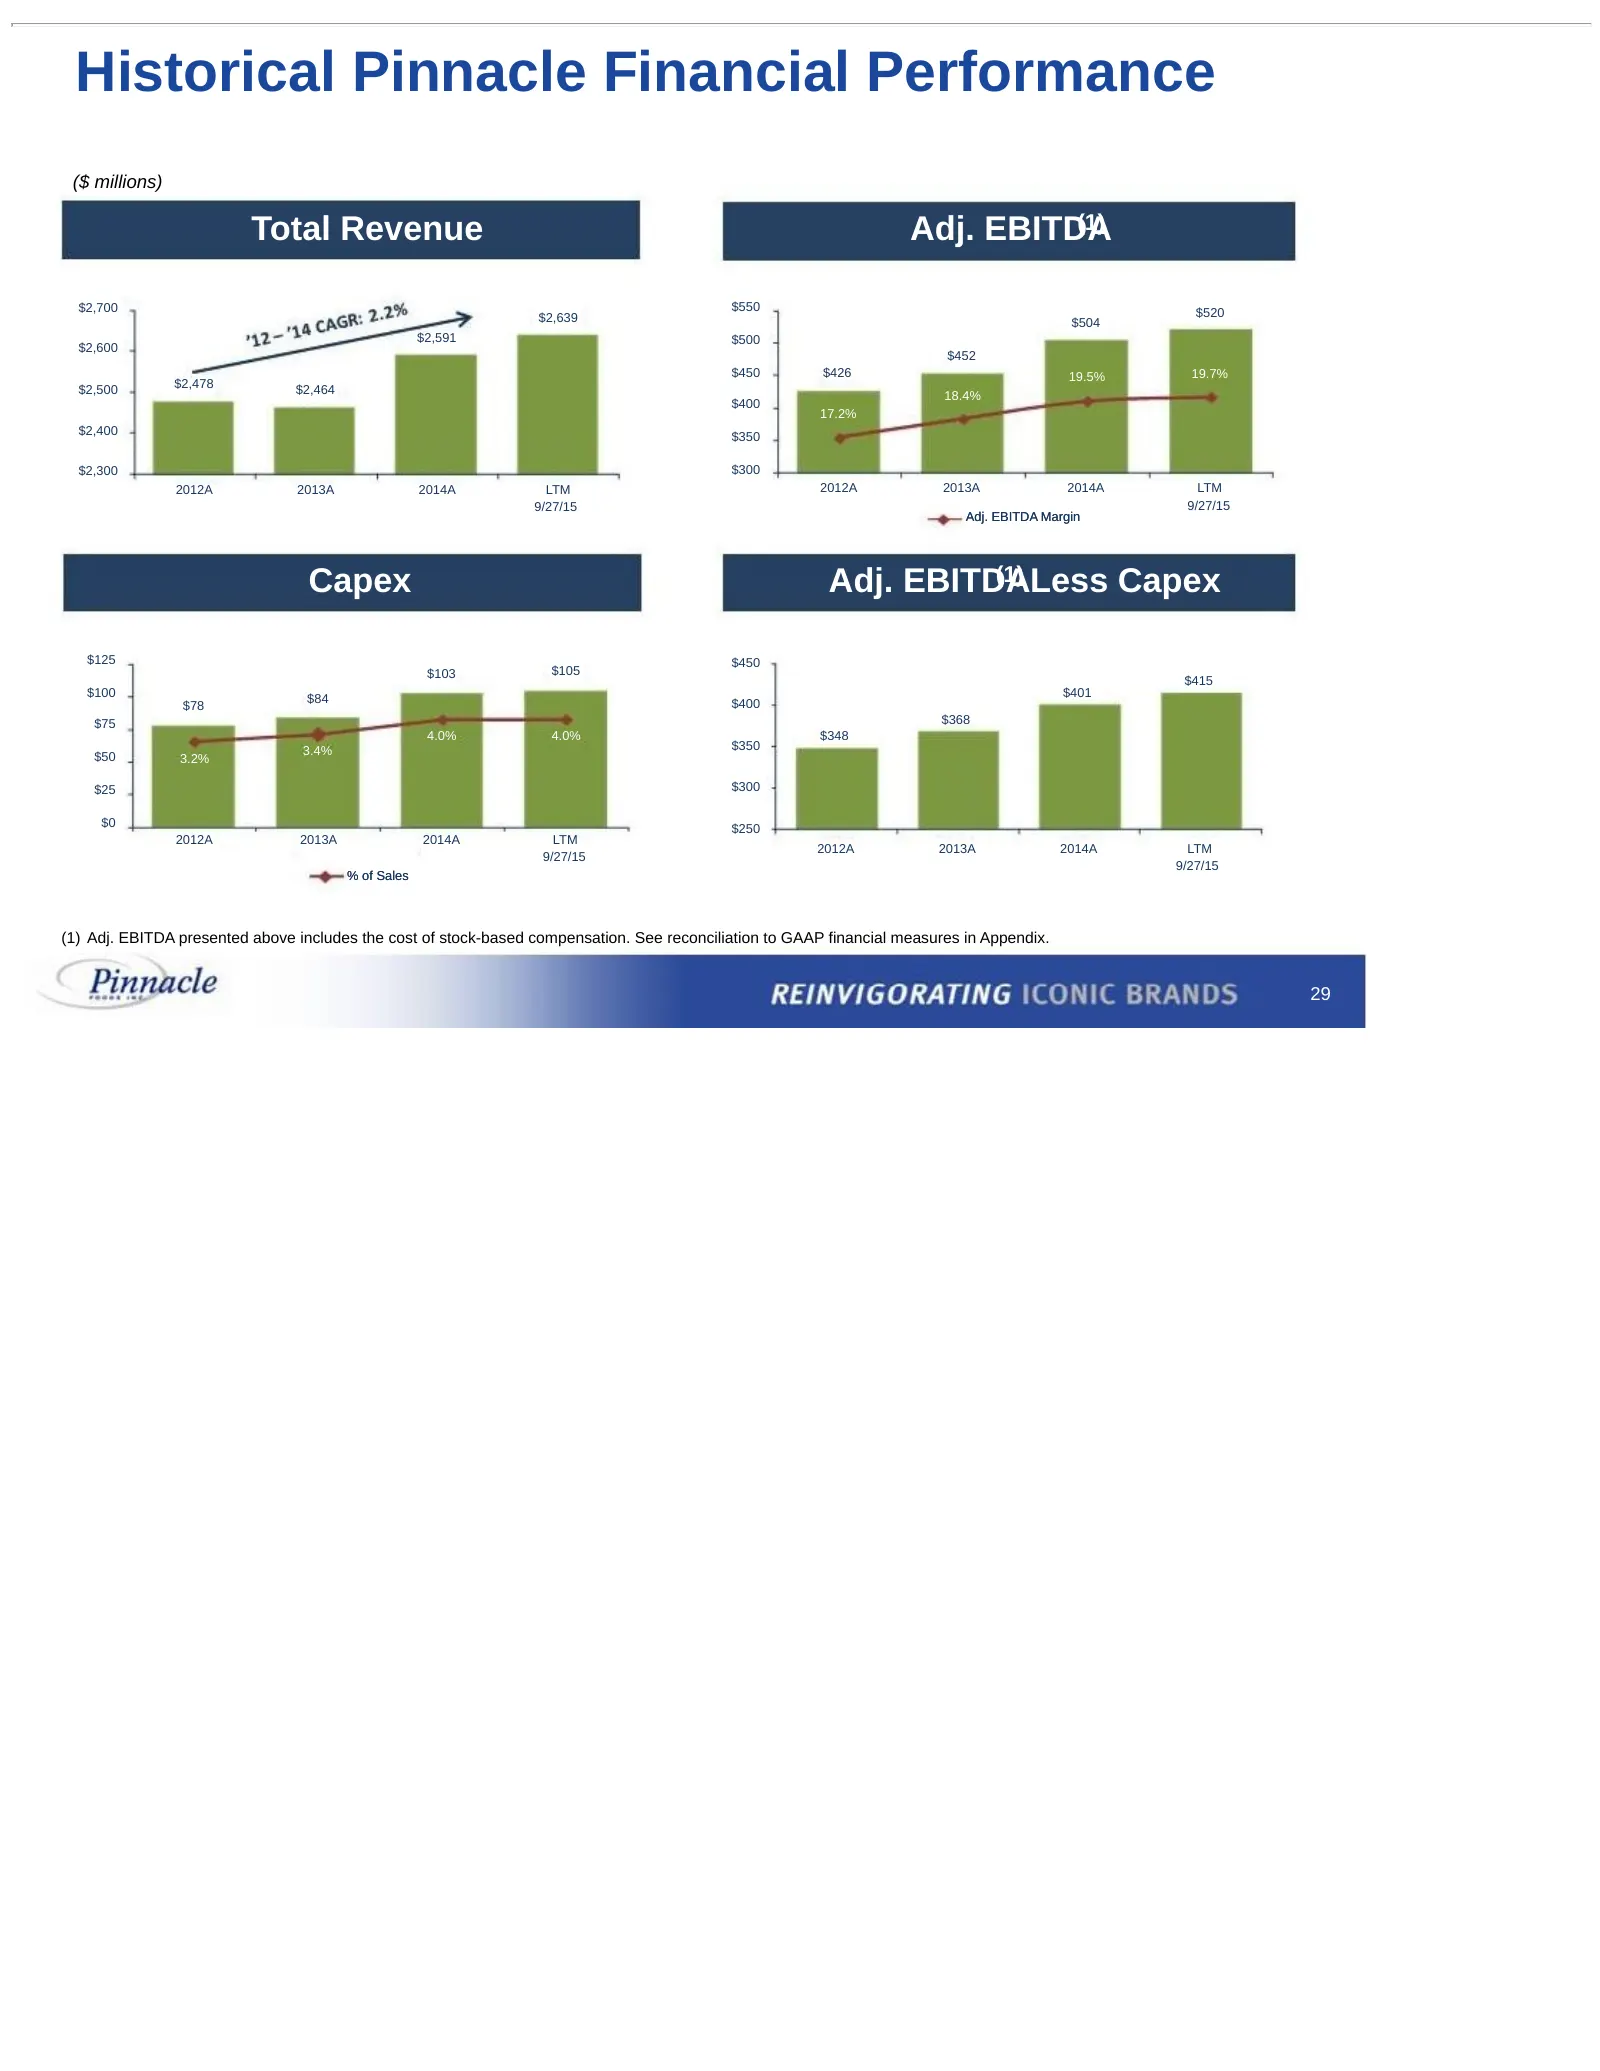
Historical Pinnacle Financial Performance ($ millions) Total Revenue Adj. EBITDA (1) $2,700 $550 $520 $2,639 $504 $2,591 $500 $2,600 $452 $450 $426 19.5% 19.7% $2,500 $2,478 $2,464 18.4% $400 17.2% $2,400 $350 $2,300 $300 2012A 2013A 2014A LTM 2012A 2013A 2014A LTM 9/27/15 9/27/15 Adj. EBITDA Margin
Slide 30: Recent Pinnacle Performance
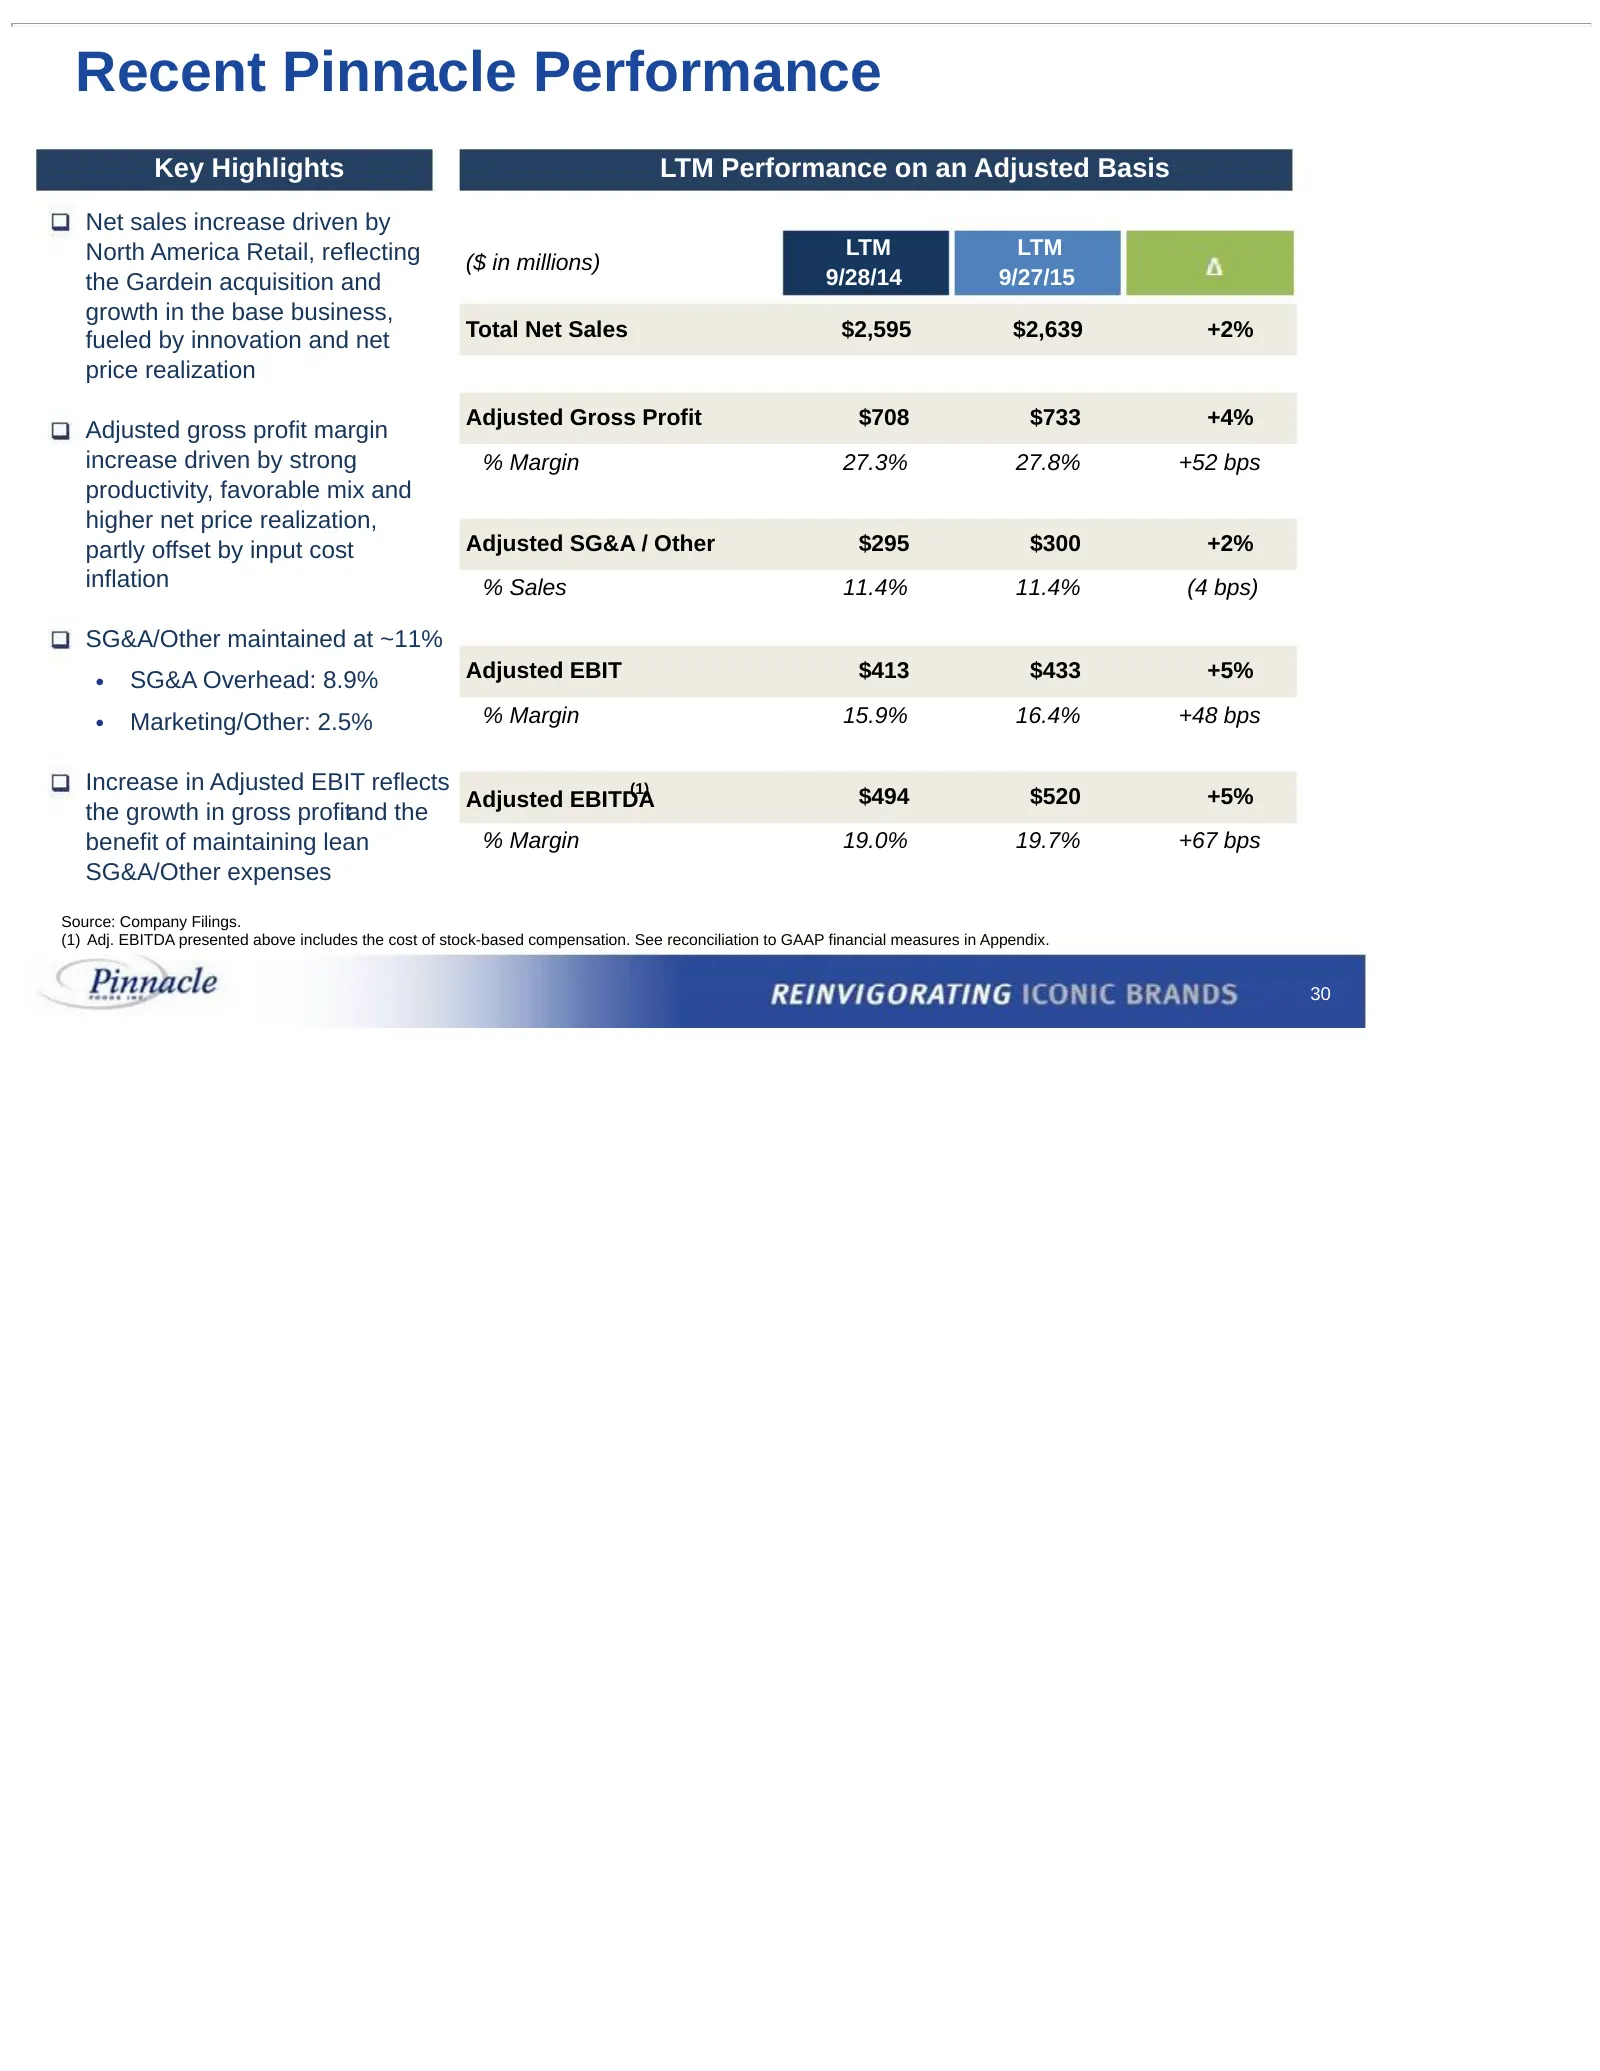
Recent Pinnacle Performance Key Highlights LTM Performance on an Adjusted Basis Net sales increase driven by North America Retail, reflecting LTM LTM ($ in millions) the Gardein acquisition and 9/28/14 9/27/15 growth in the base business, Total Net Sales $2,595 $2,639 +2% fueled by innovation and ne
Slide 31: Acquisition Strategy
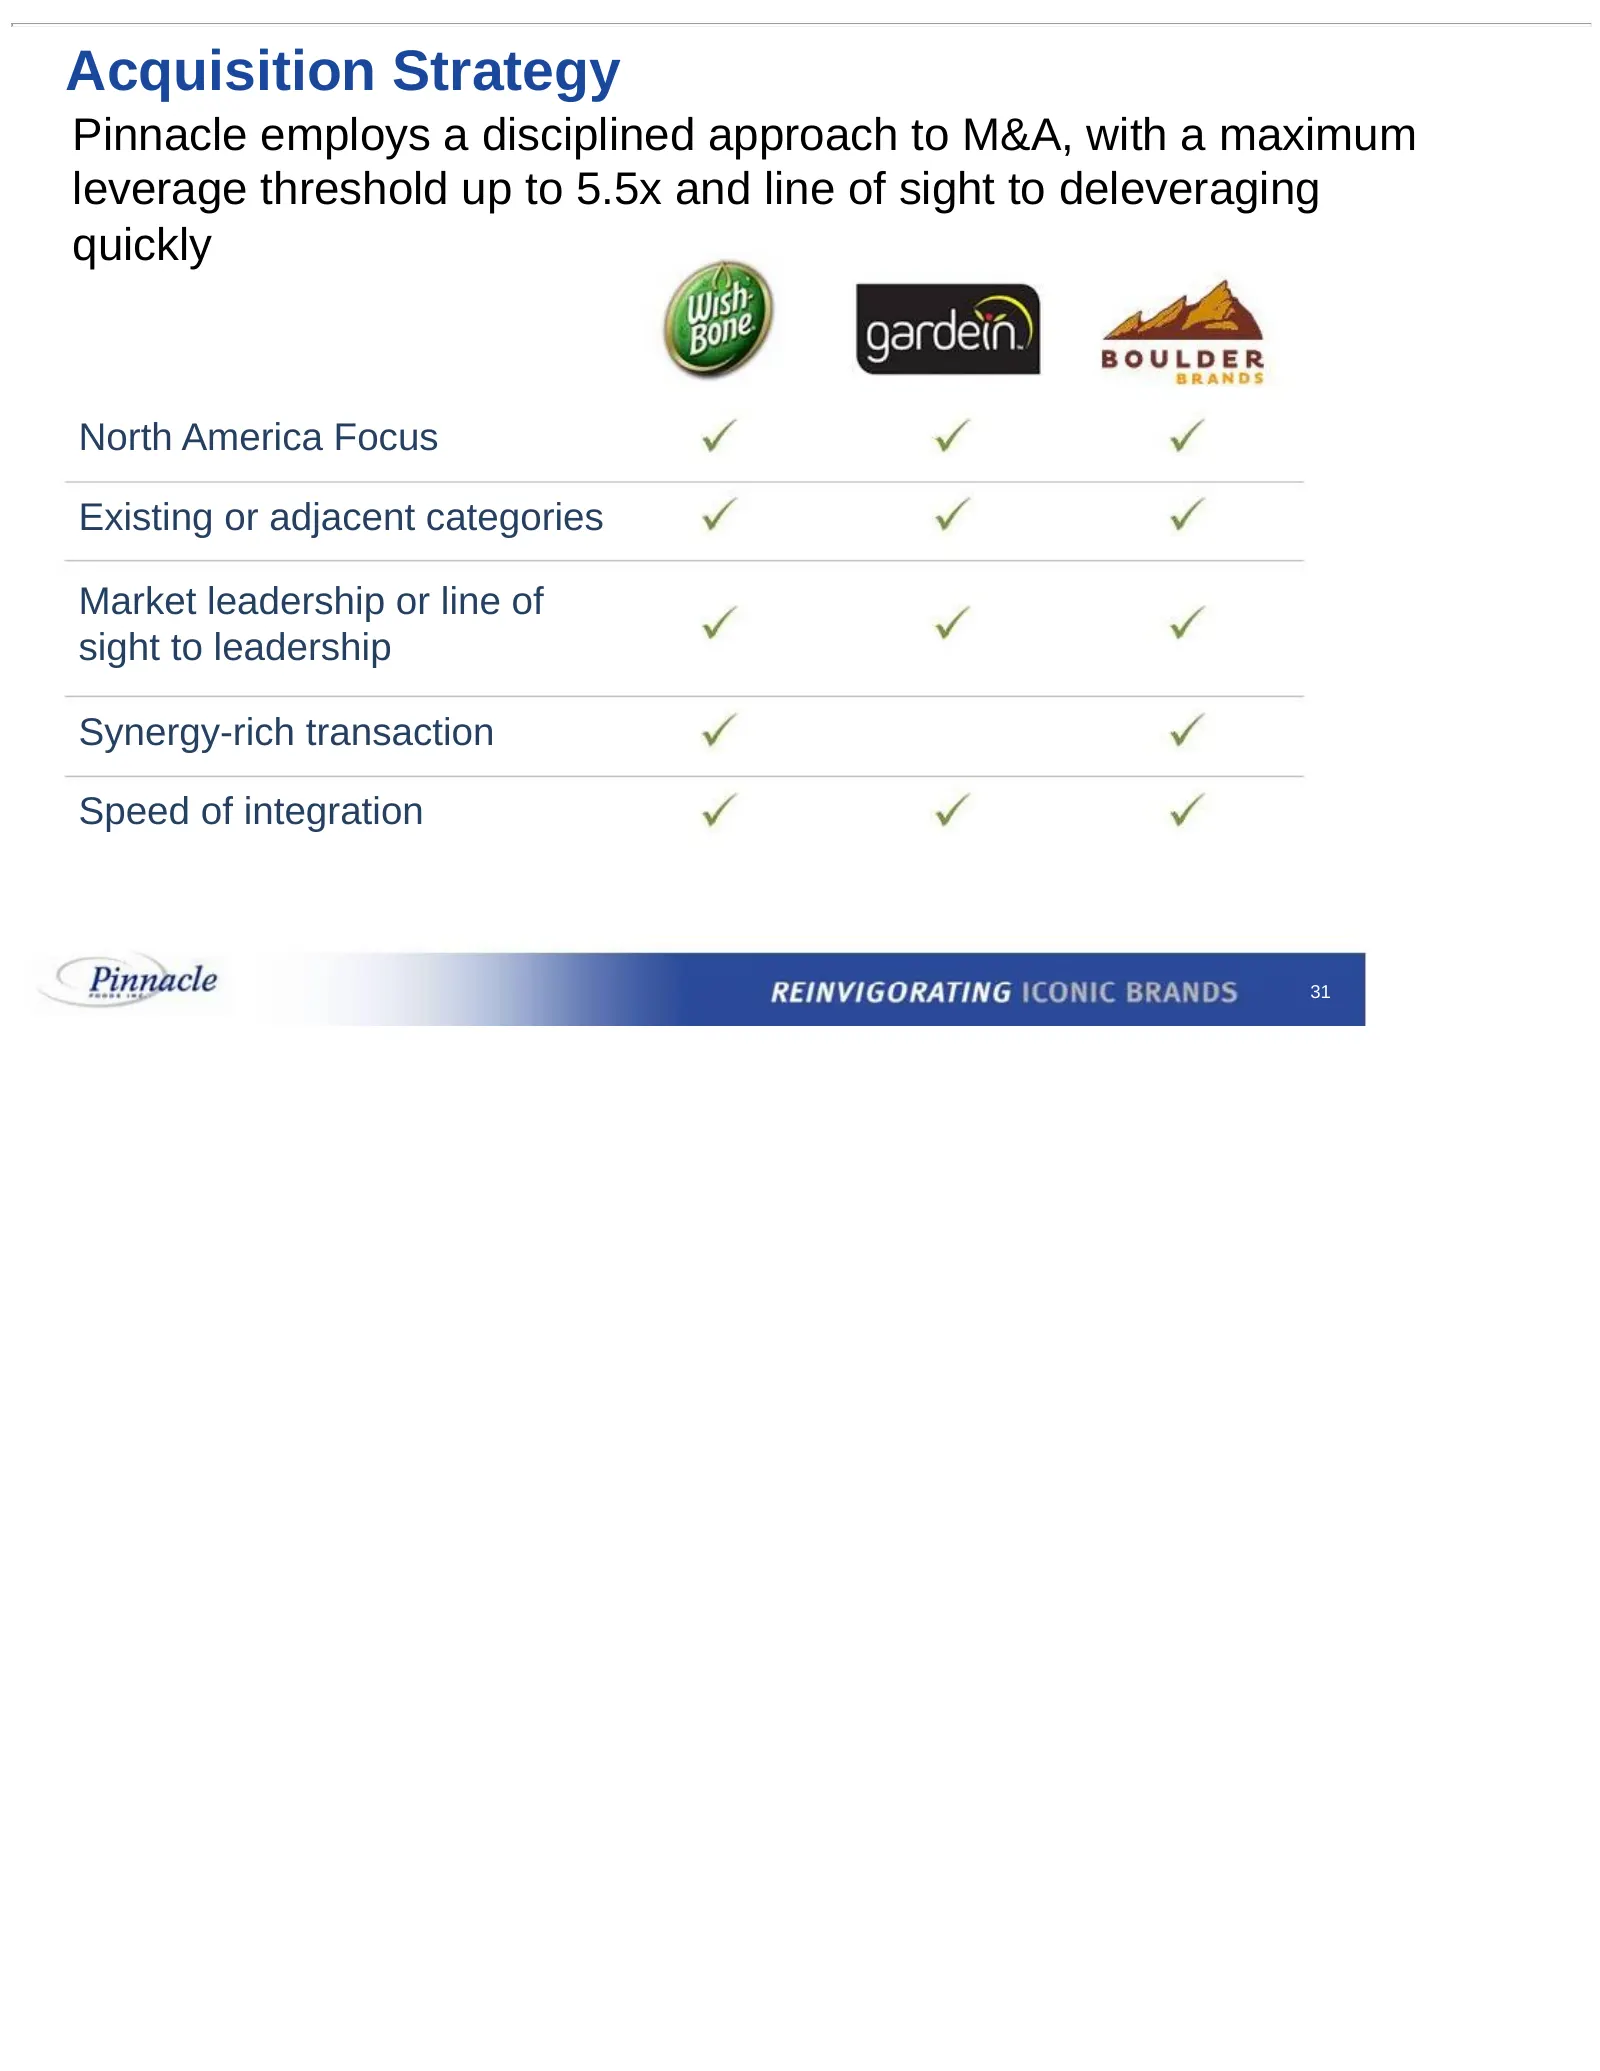
Acquisition Strategy Pinnacle employs a disciplined approach to M&A, with a maximum leverage threshold up to 5.5x and line of sight to deleveraging quickly North America Focus Existing or adjacent categories Market leadership or line of sight to leadership Synergy-rich transaction Speed of integrati
Slide 32: Disciplined Financial Policies
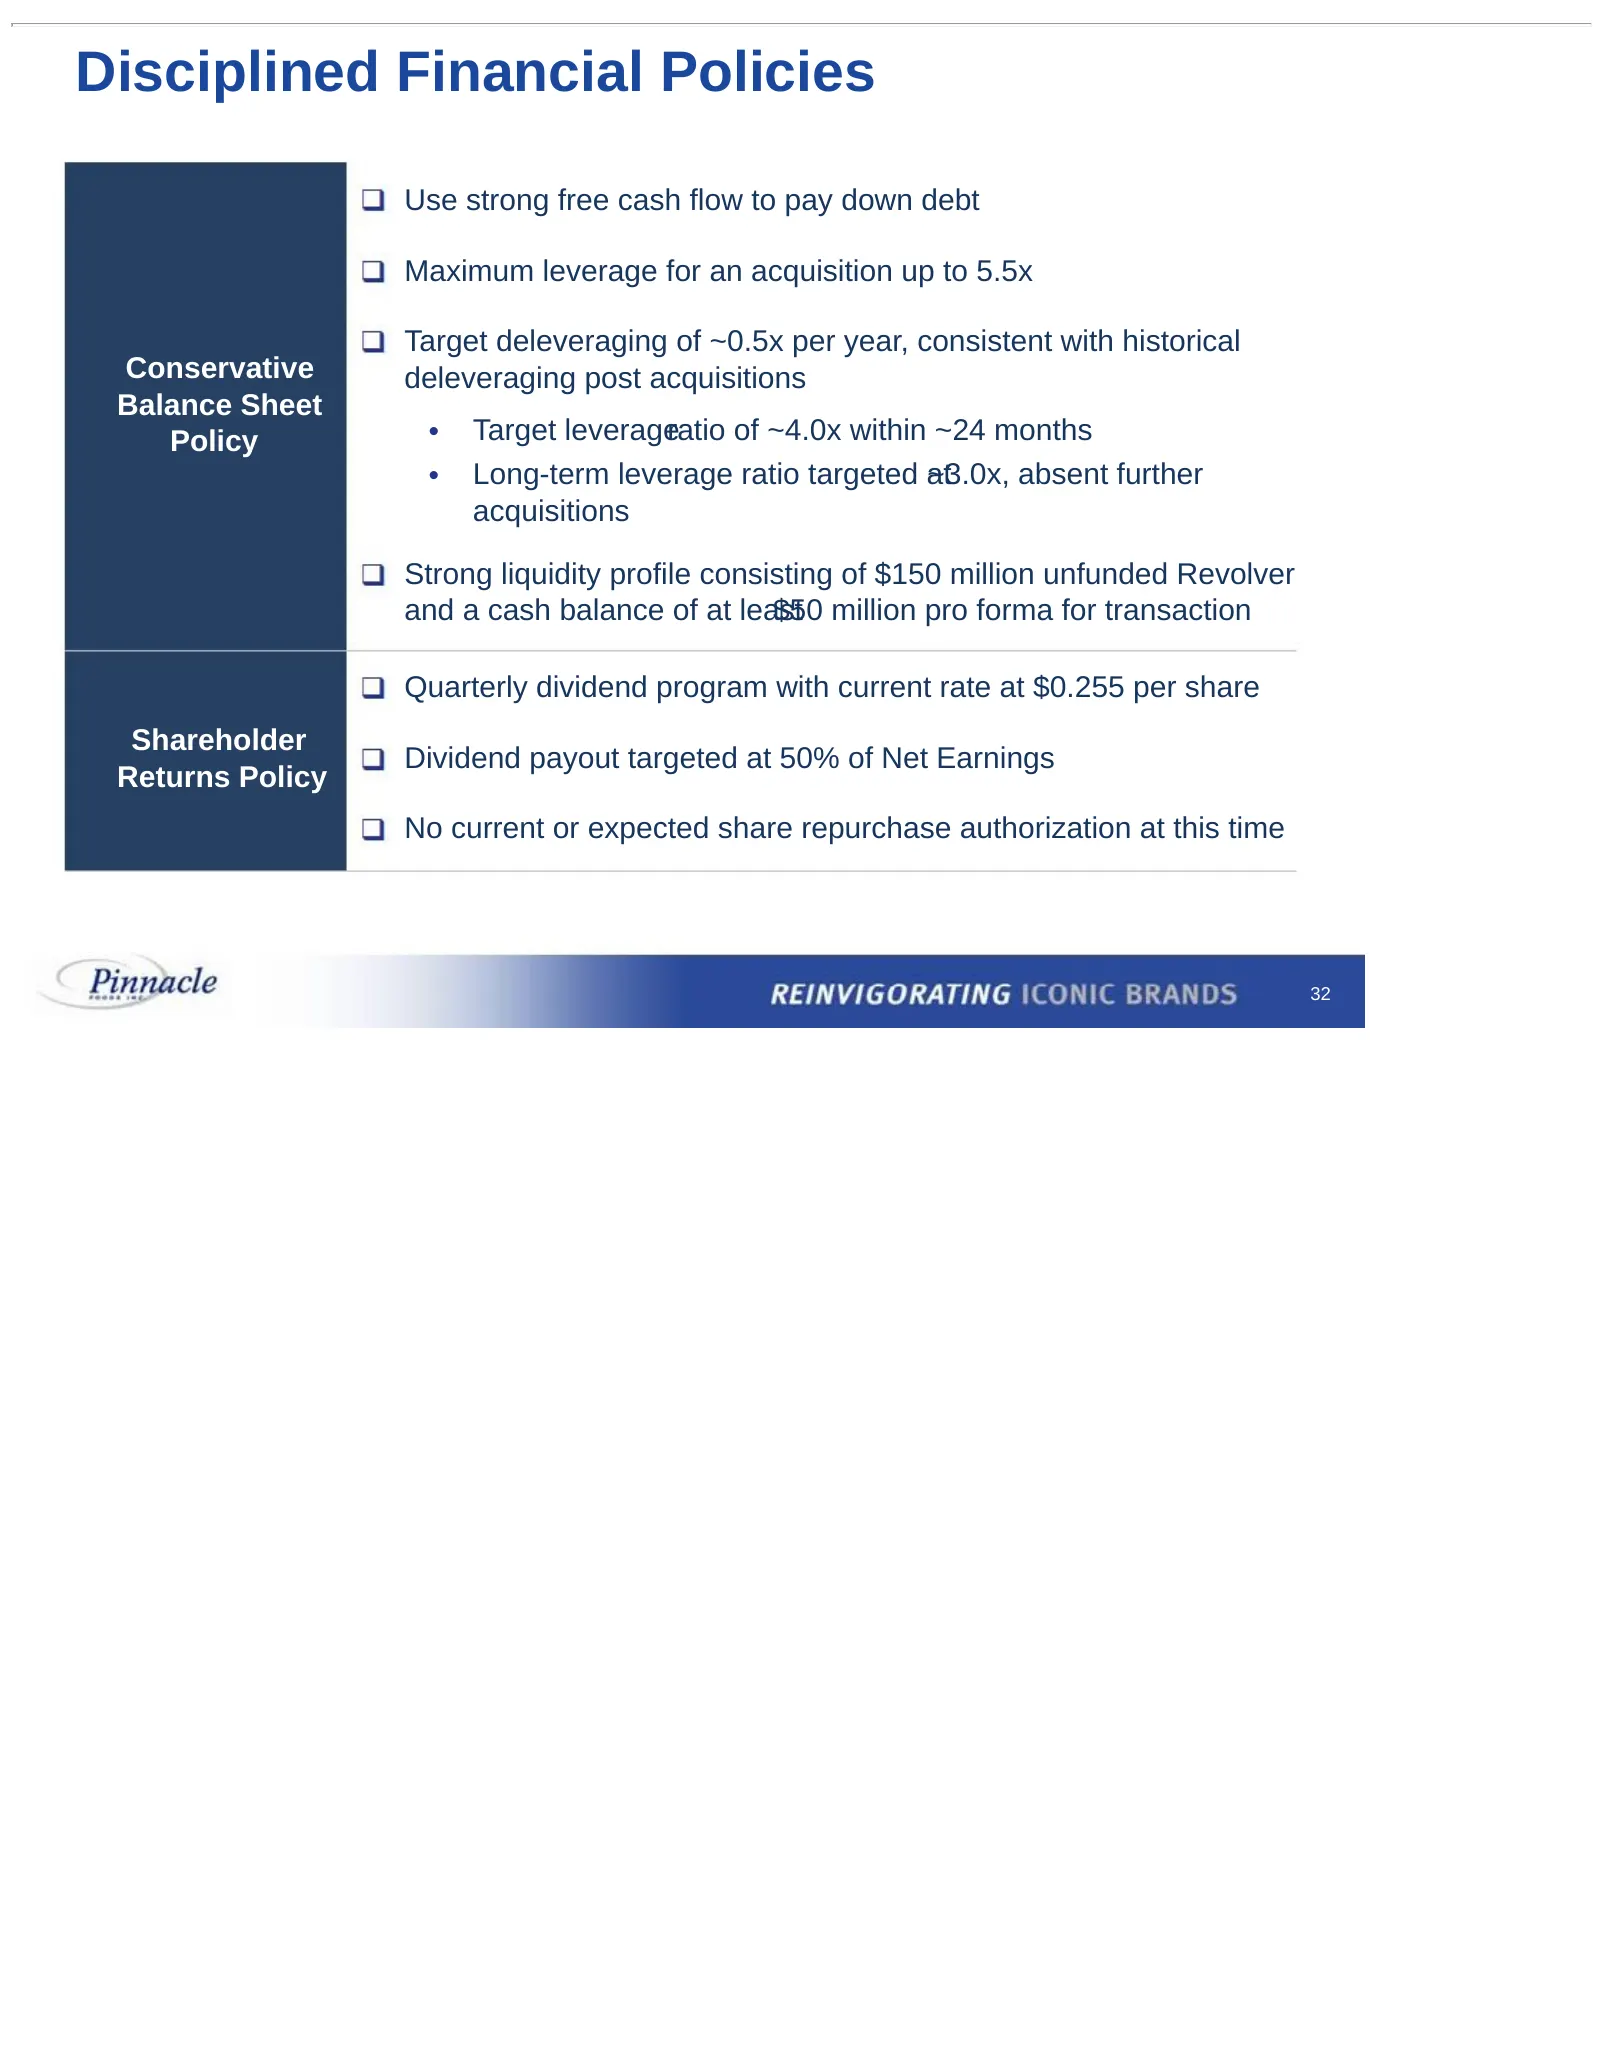
Disciplined Financial Policies Use strong free cash flow to pay down debt Maximum leverage for an acquisition up to 5.5x Target deleveraging of ~0.5x per year, consistent with historical Conservative deleveraging post acquisitions Balance Sheet Policy • Target leverageratio of ~4.0x within ~24 month
Slide 33: Agenda
Agenda Transaction Overview Credit Highlights Pinnacle Business Update Boulder Brands Opportunity
Slide 34: Boulder Brands: A Strong Brand Portfolio…
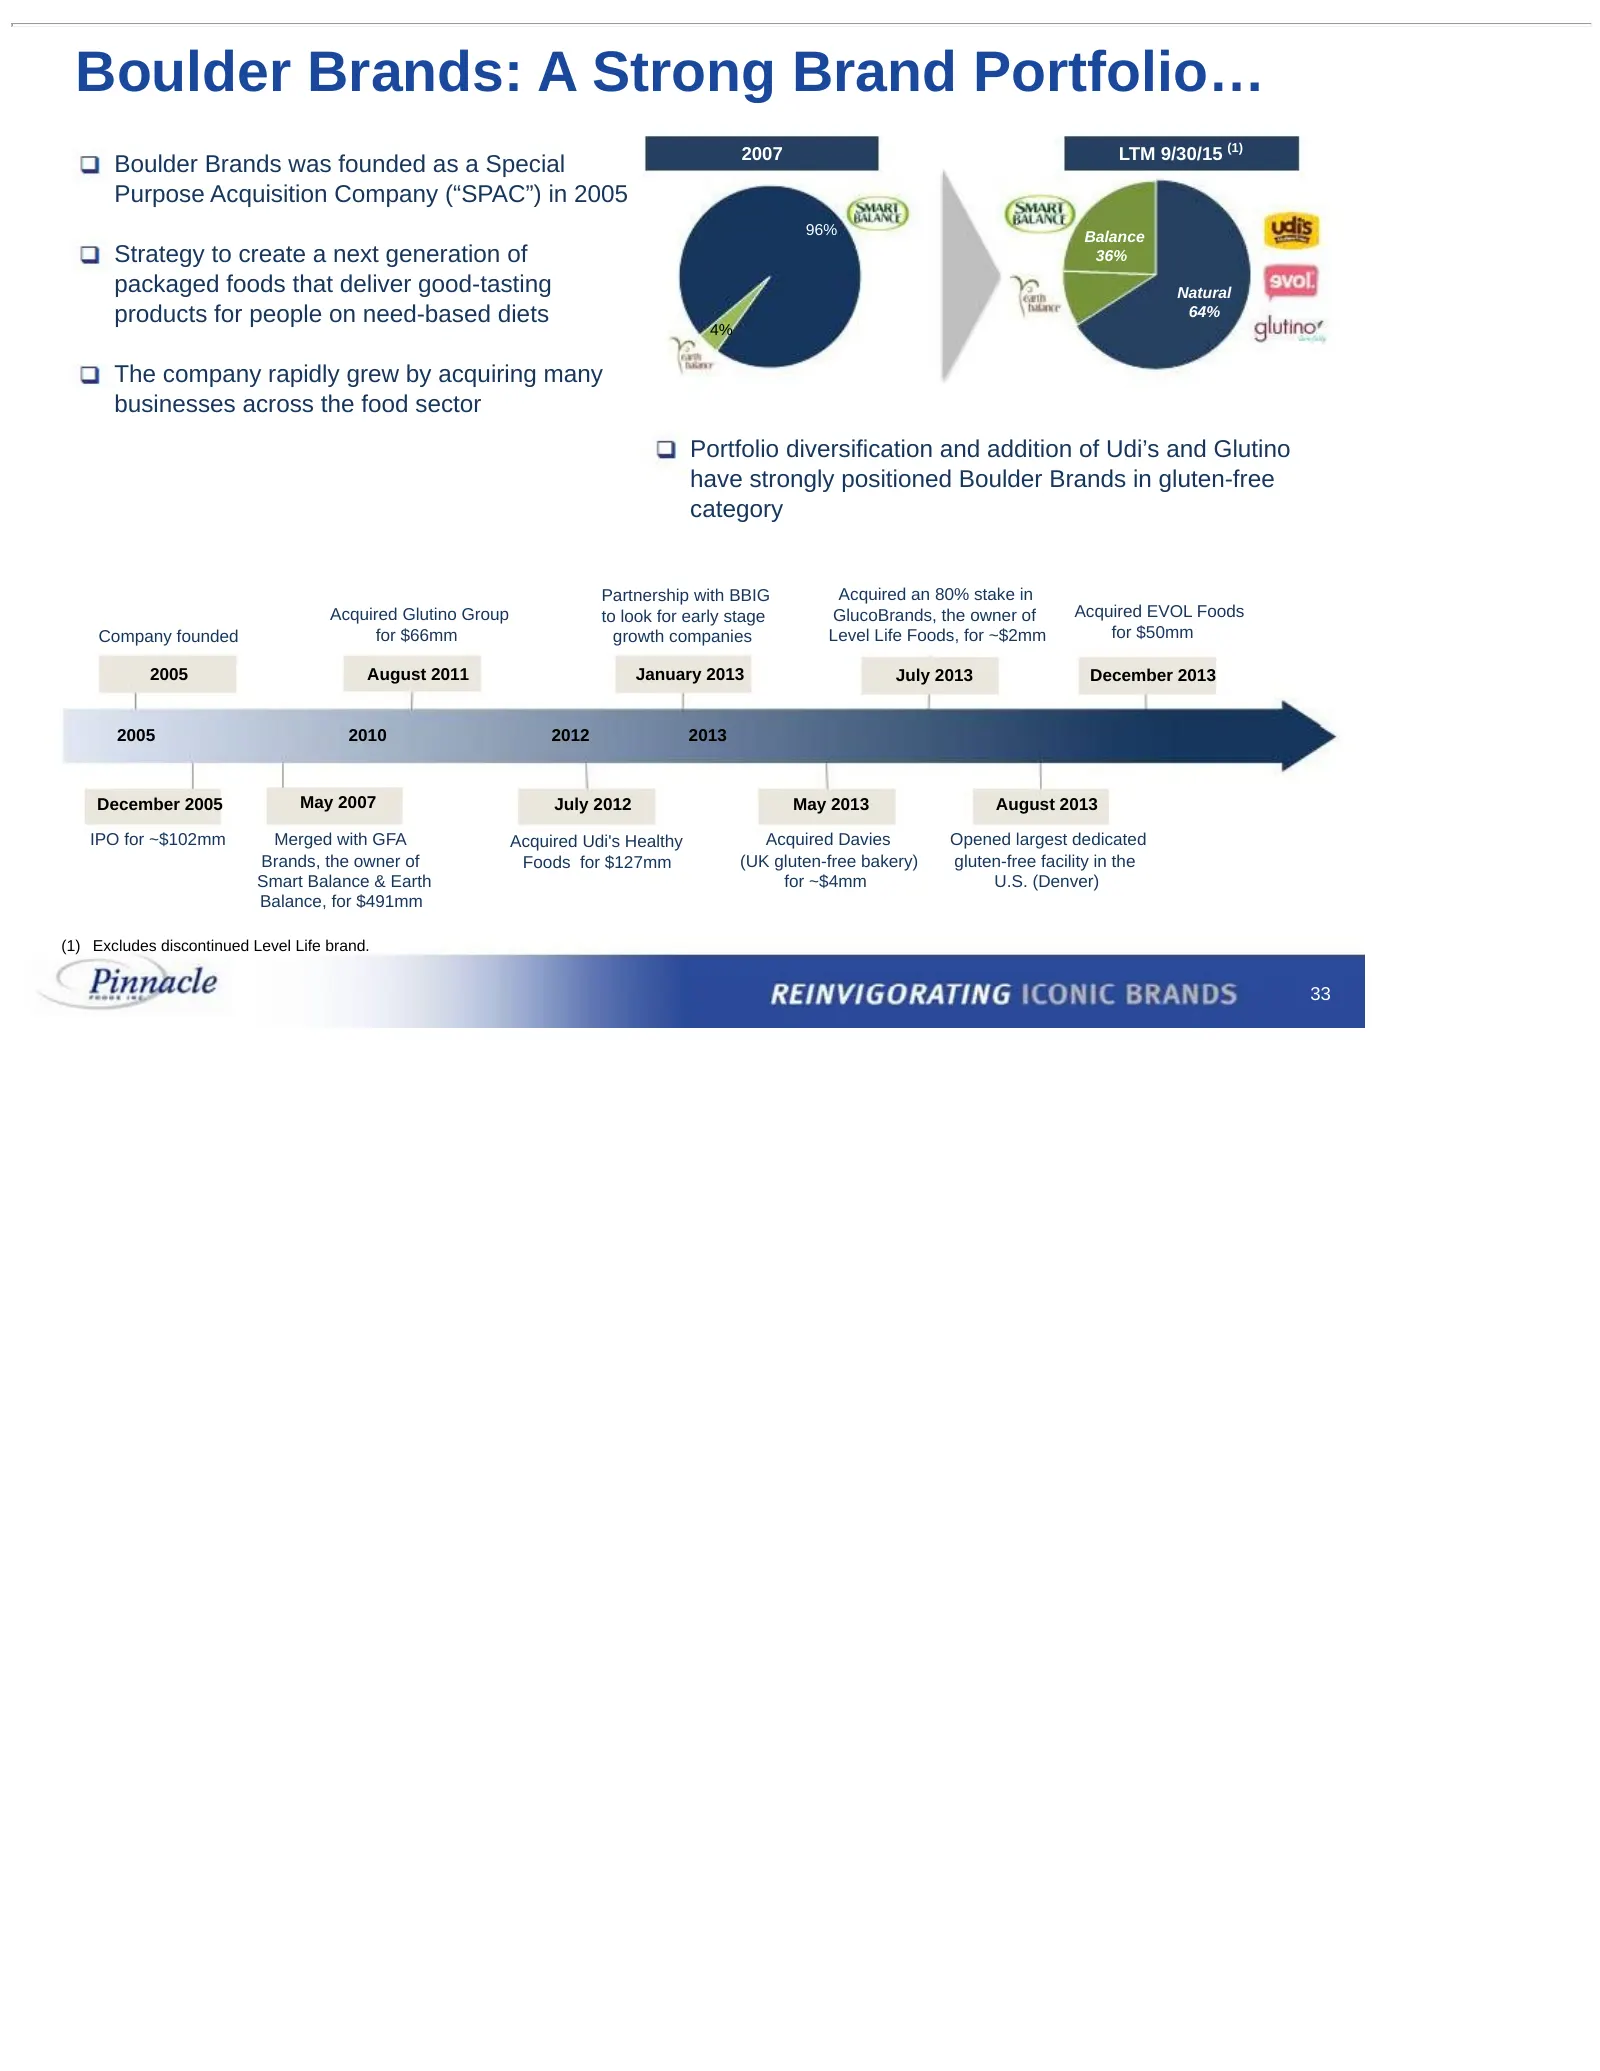
Boulder Brands: A Strong Brand Portfolio… 2007 LTM 9/30/15 (1) Boulder Brands was founded as a Special Purpose Acquisition Company (“SPAC”) in 2005 96% Balance Strategy to create a next generation of 36% packaged foods that deliver good-tasting Natural products for people on need-based diets 64% 4%
Slide 35: …with Recent Challenges
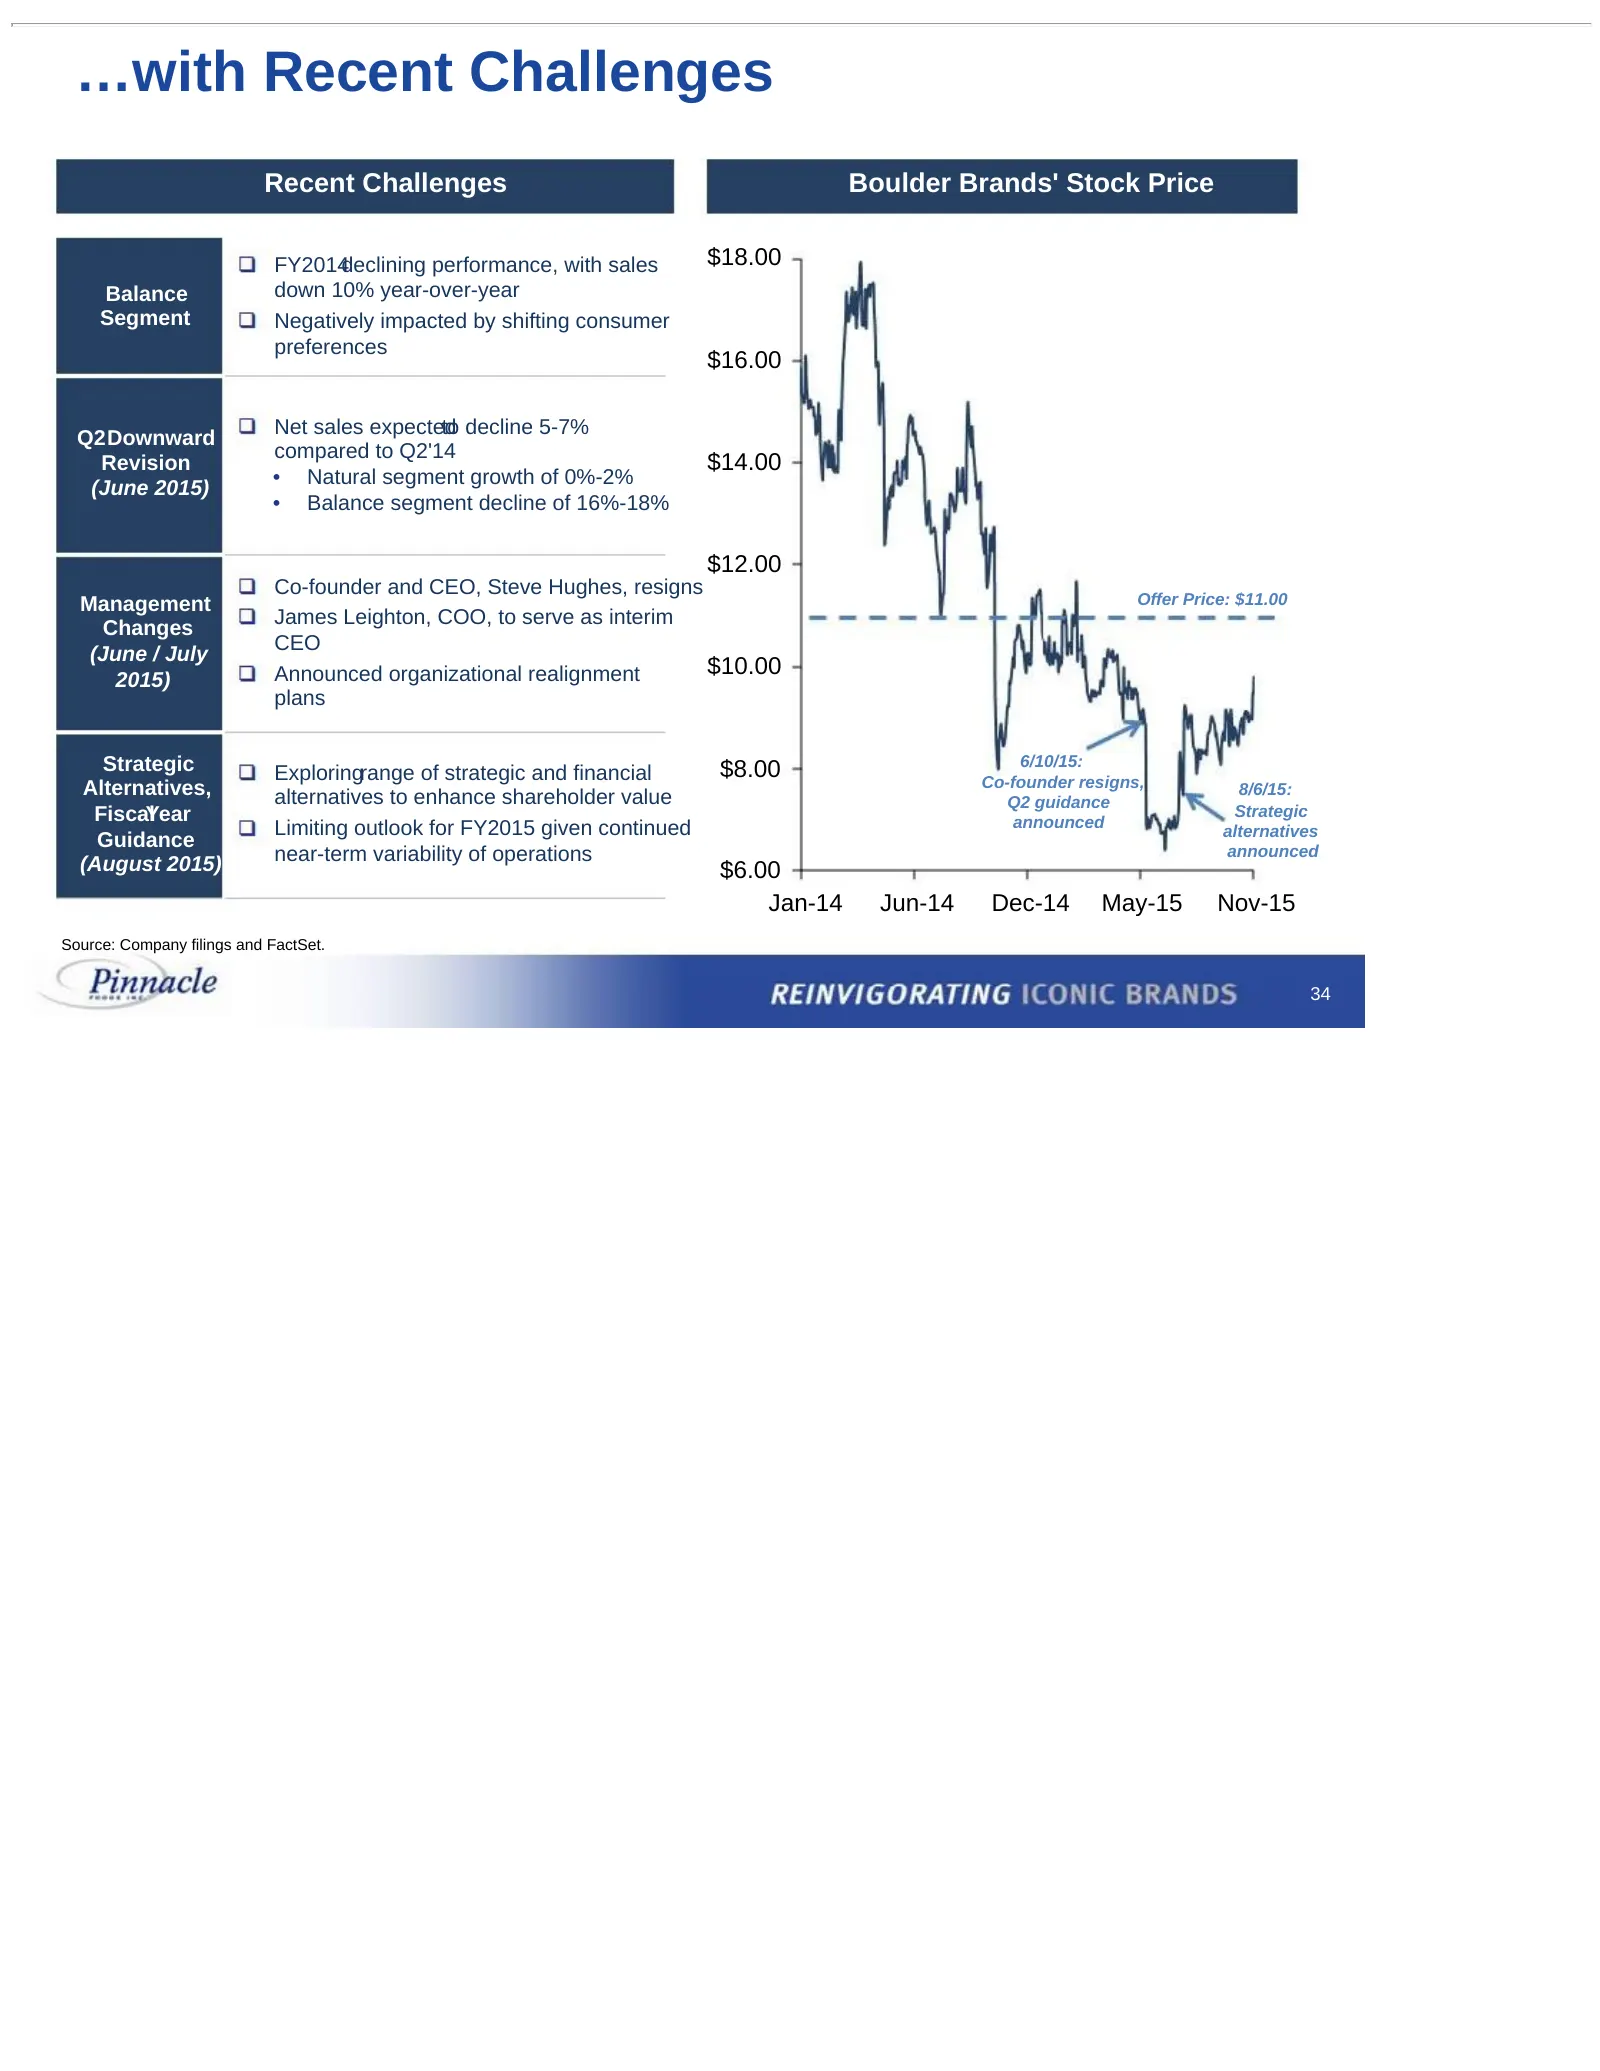
…with Recent Challenges Recent Challenges Boulder Brands' Stock Price FY2014declining performance, with sales $18.00 Balance down 10% year-over-year Segment Negatively impacted by shifting consumer preferences $16.00 Net sales expected to decline 5-7% Q2Downward compared to Q2'14 Revision $14.00 • N
Slide 36: Unique and Authentic Health & Wellness Platform
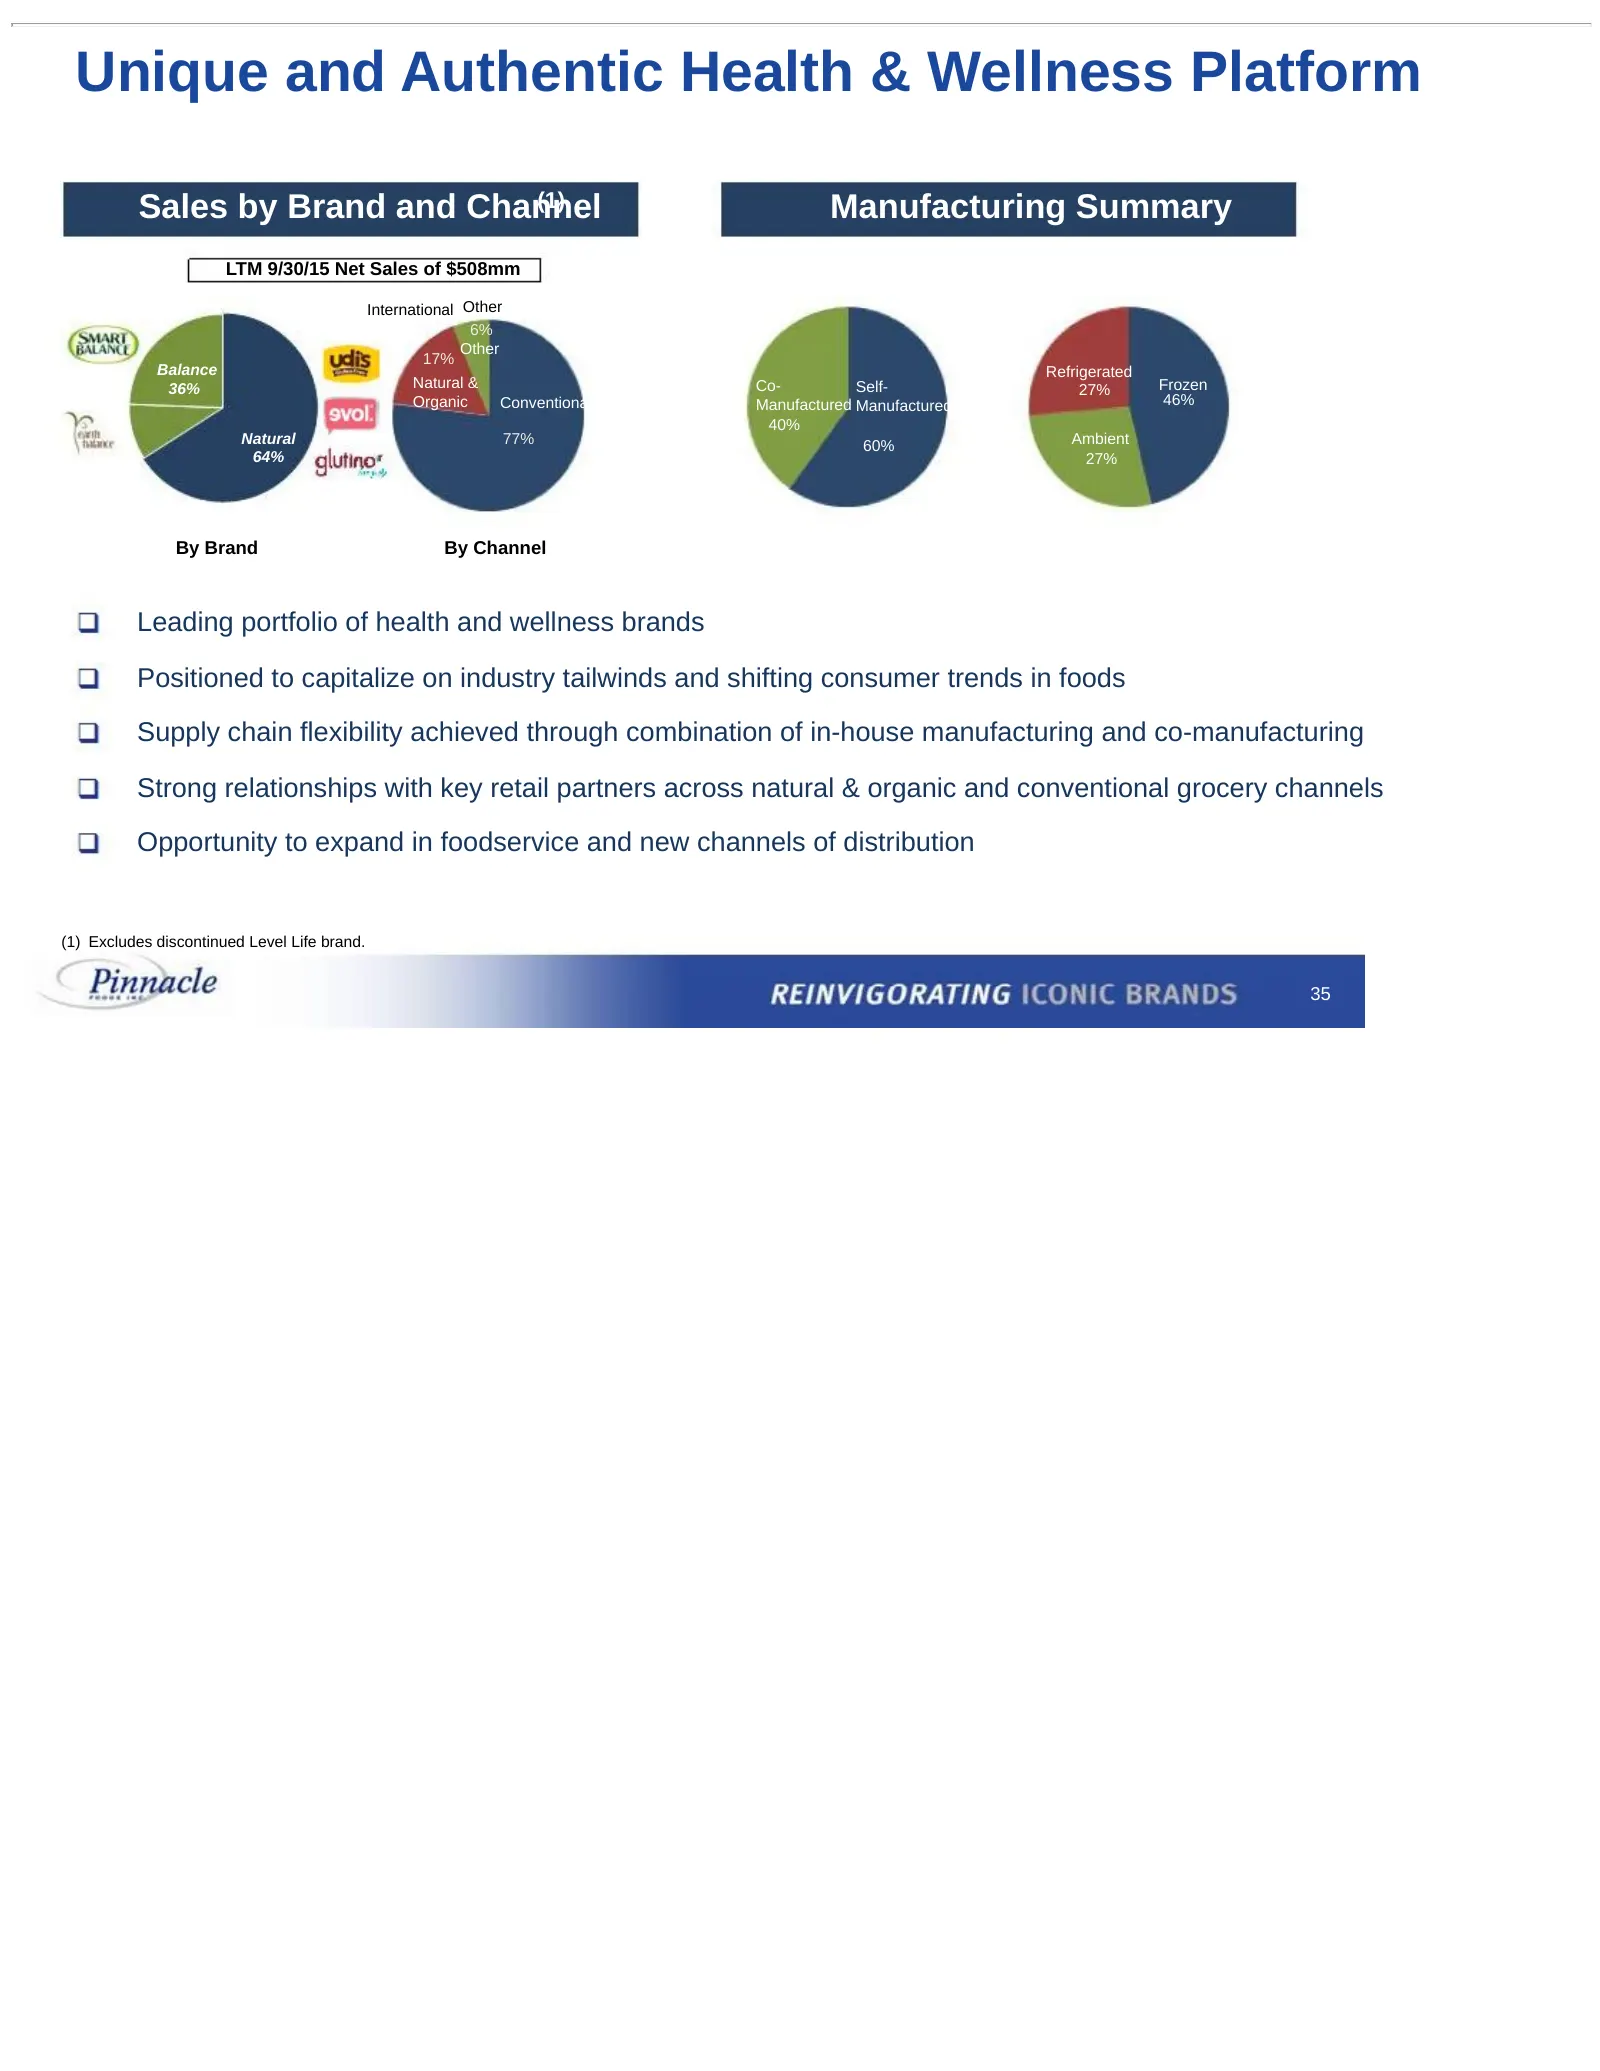
Unique and Authentic Health & Wellness Platform Sales by Brand and Channel (1) Manufacturing Summary LTM 9/30/15 Net Sales of $508mm International Other 6% Other 17% Balance Refrigerated 36% Natural & Co- Self- 27% Frozen Organic Conventional Manufactured Manufactured 46% 40% Natural 77% 60% Ambient
Slide 37: Broad Portfolio That Addresses Consumer Needs
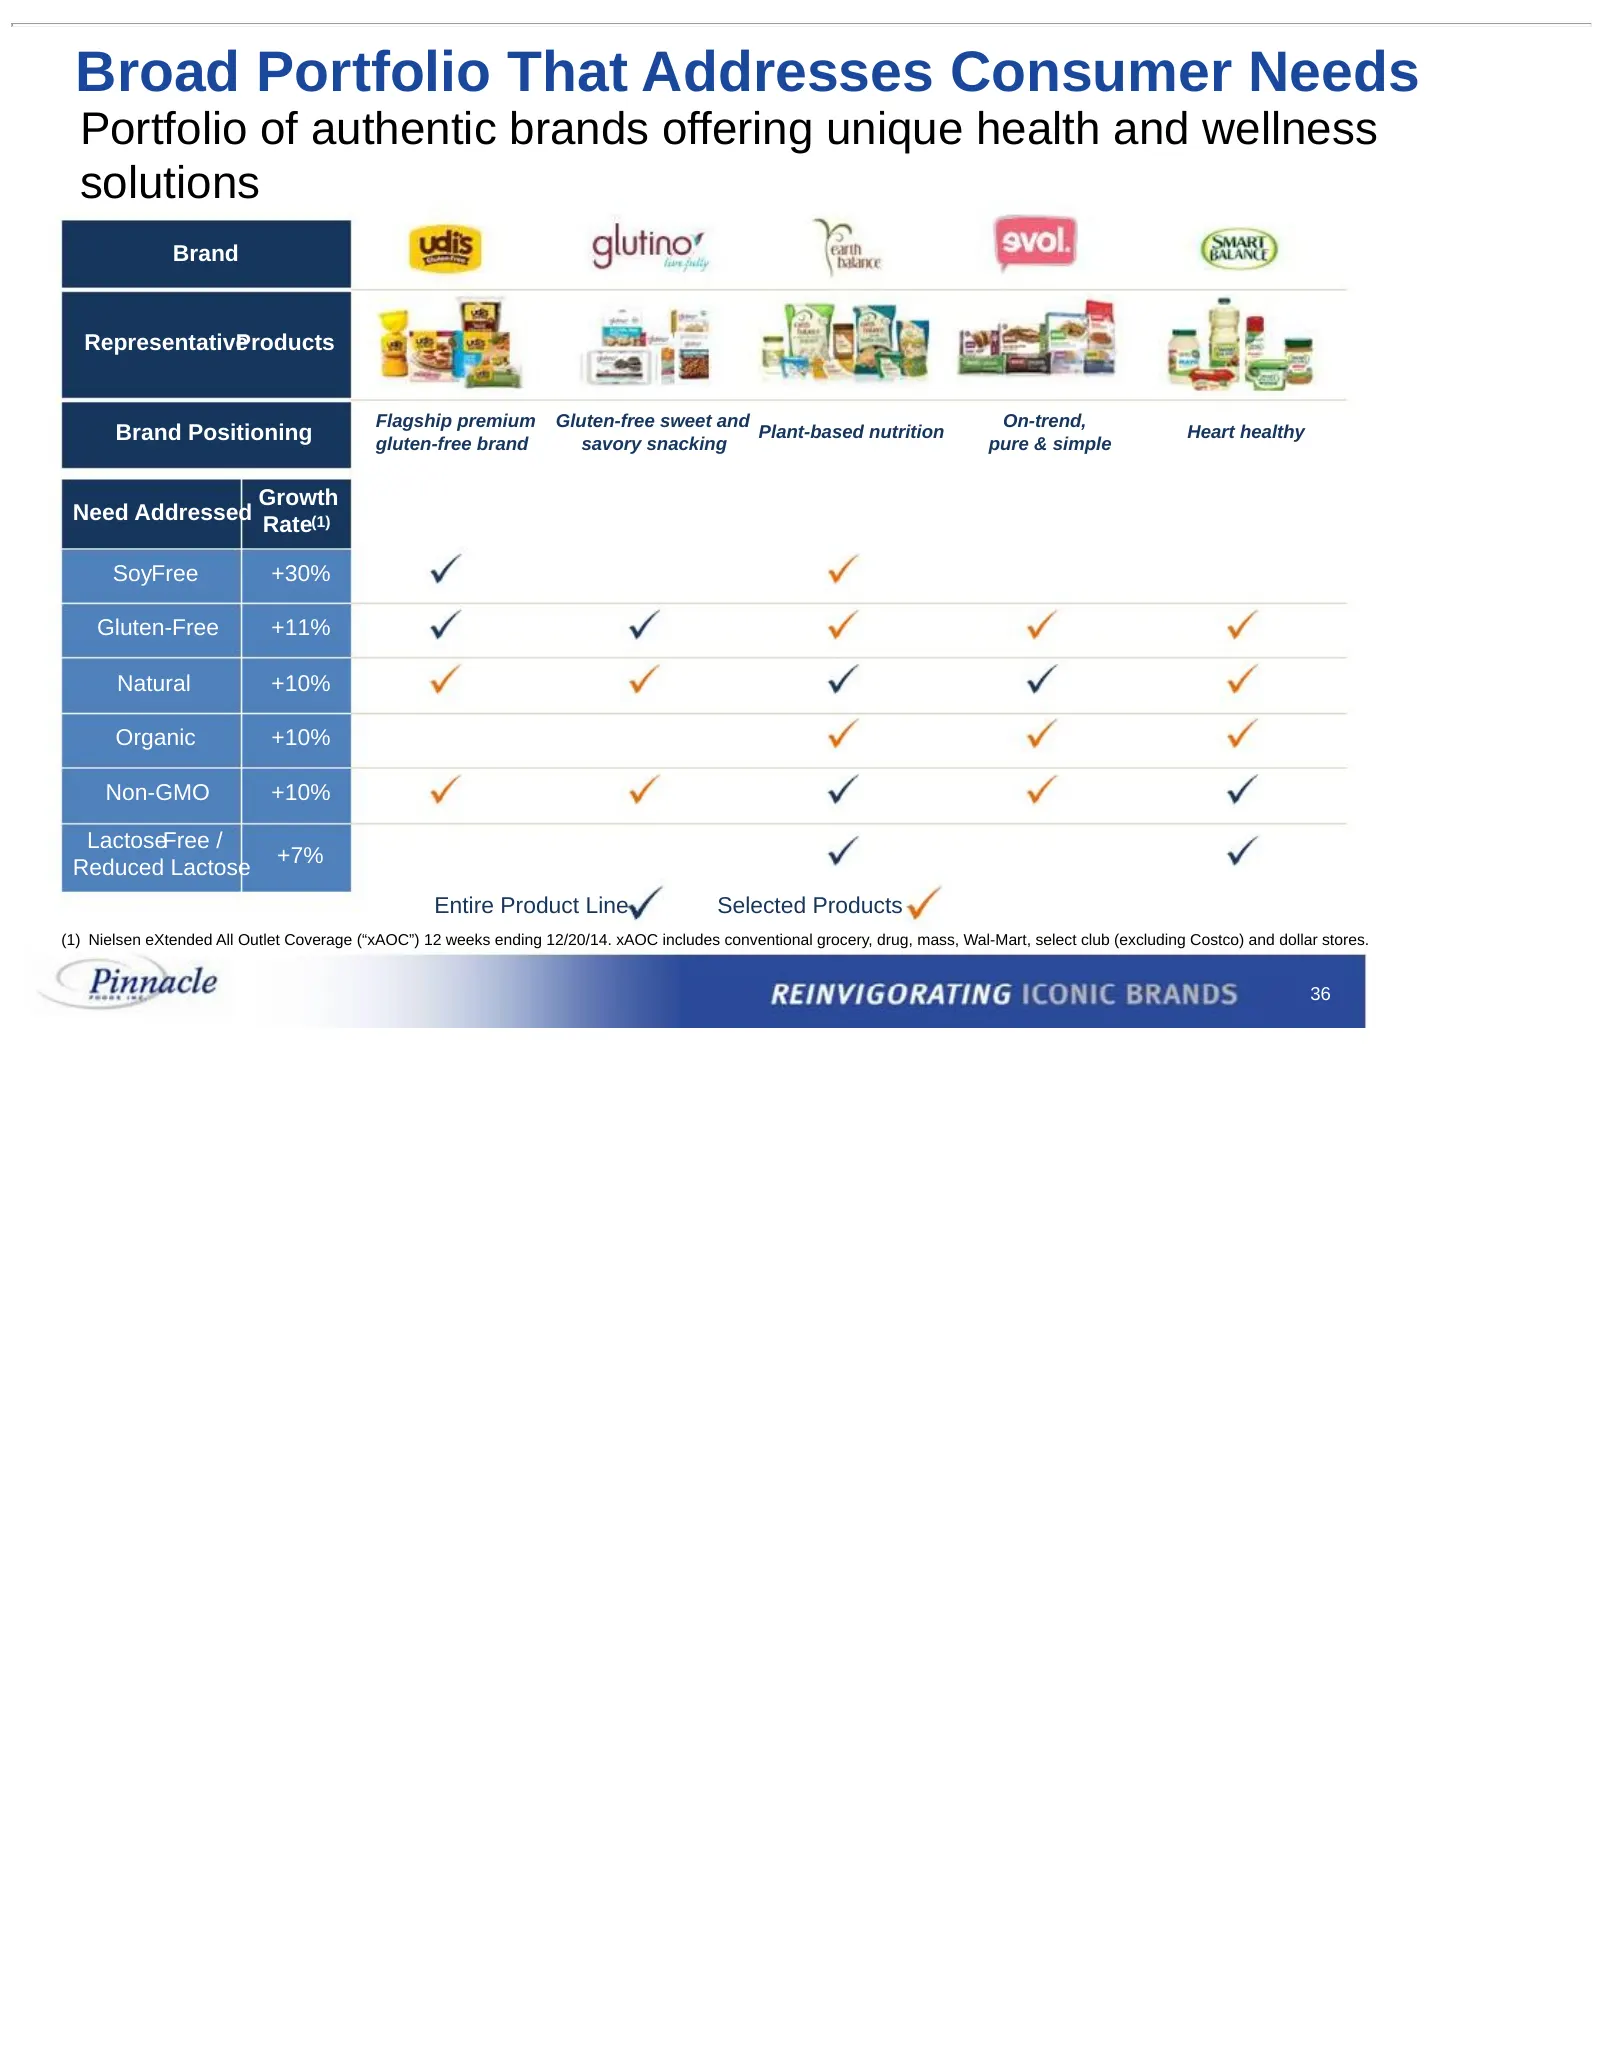
Broad Portfolio That Addresses Consumer Needs Portfolio of authentic brands offering unique health and wellness solutions Brand Representative Products Flagship premium Gluten-free sweet and On-trend, Brand Positioning gluten-free brand savory snacking Plant-based nutrition pure & simple Heart healt
Slide 38: Boulder Brands' Production Overview
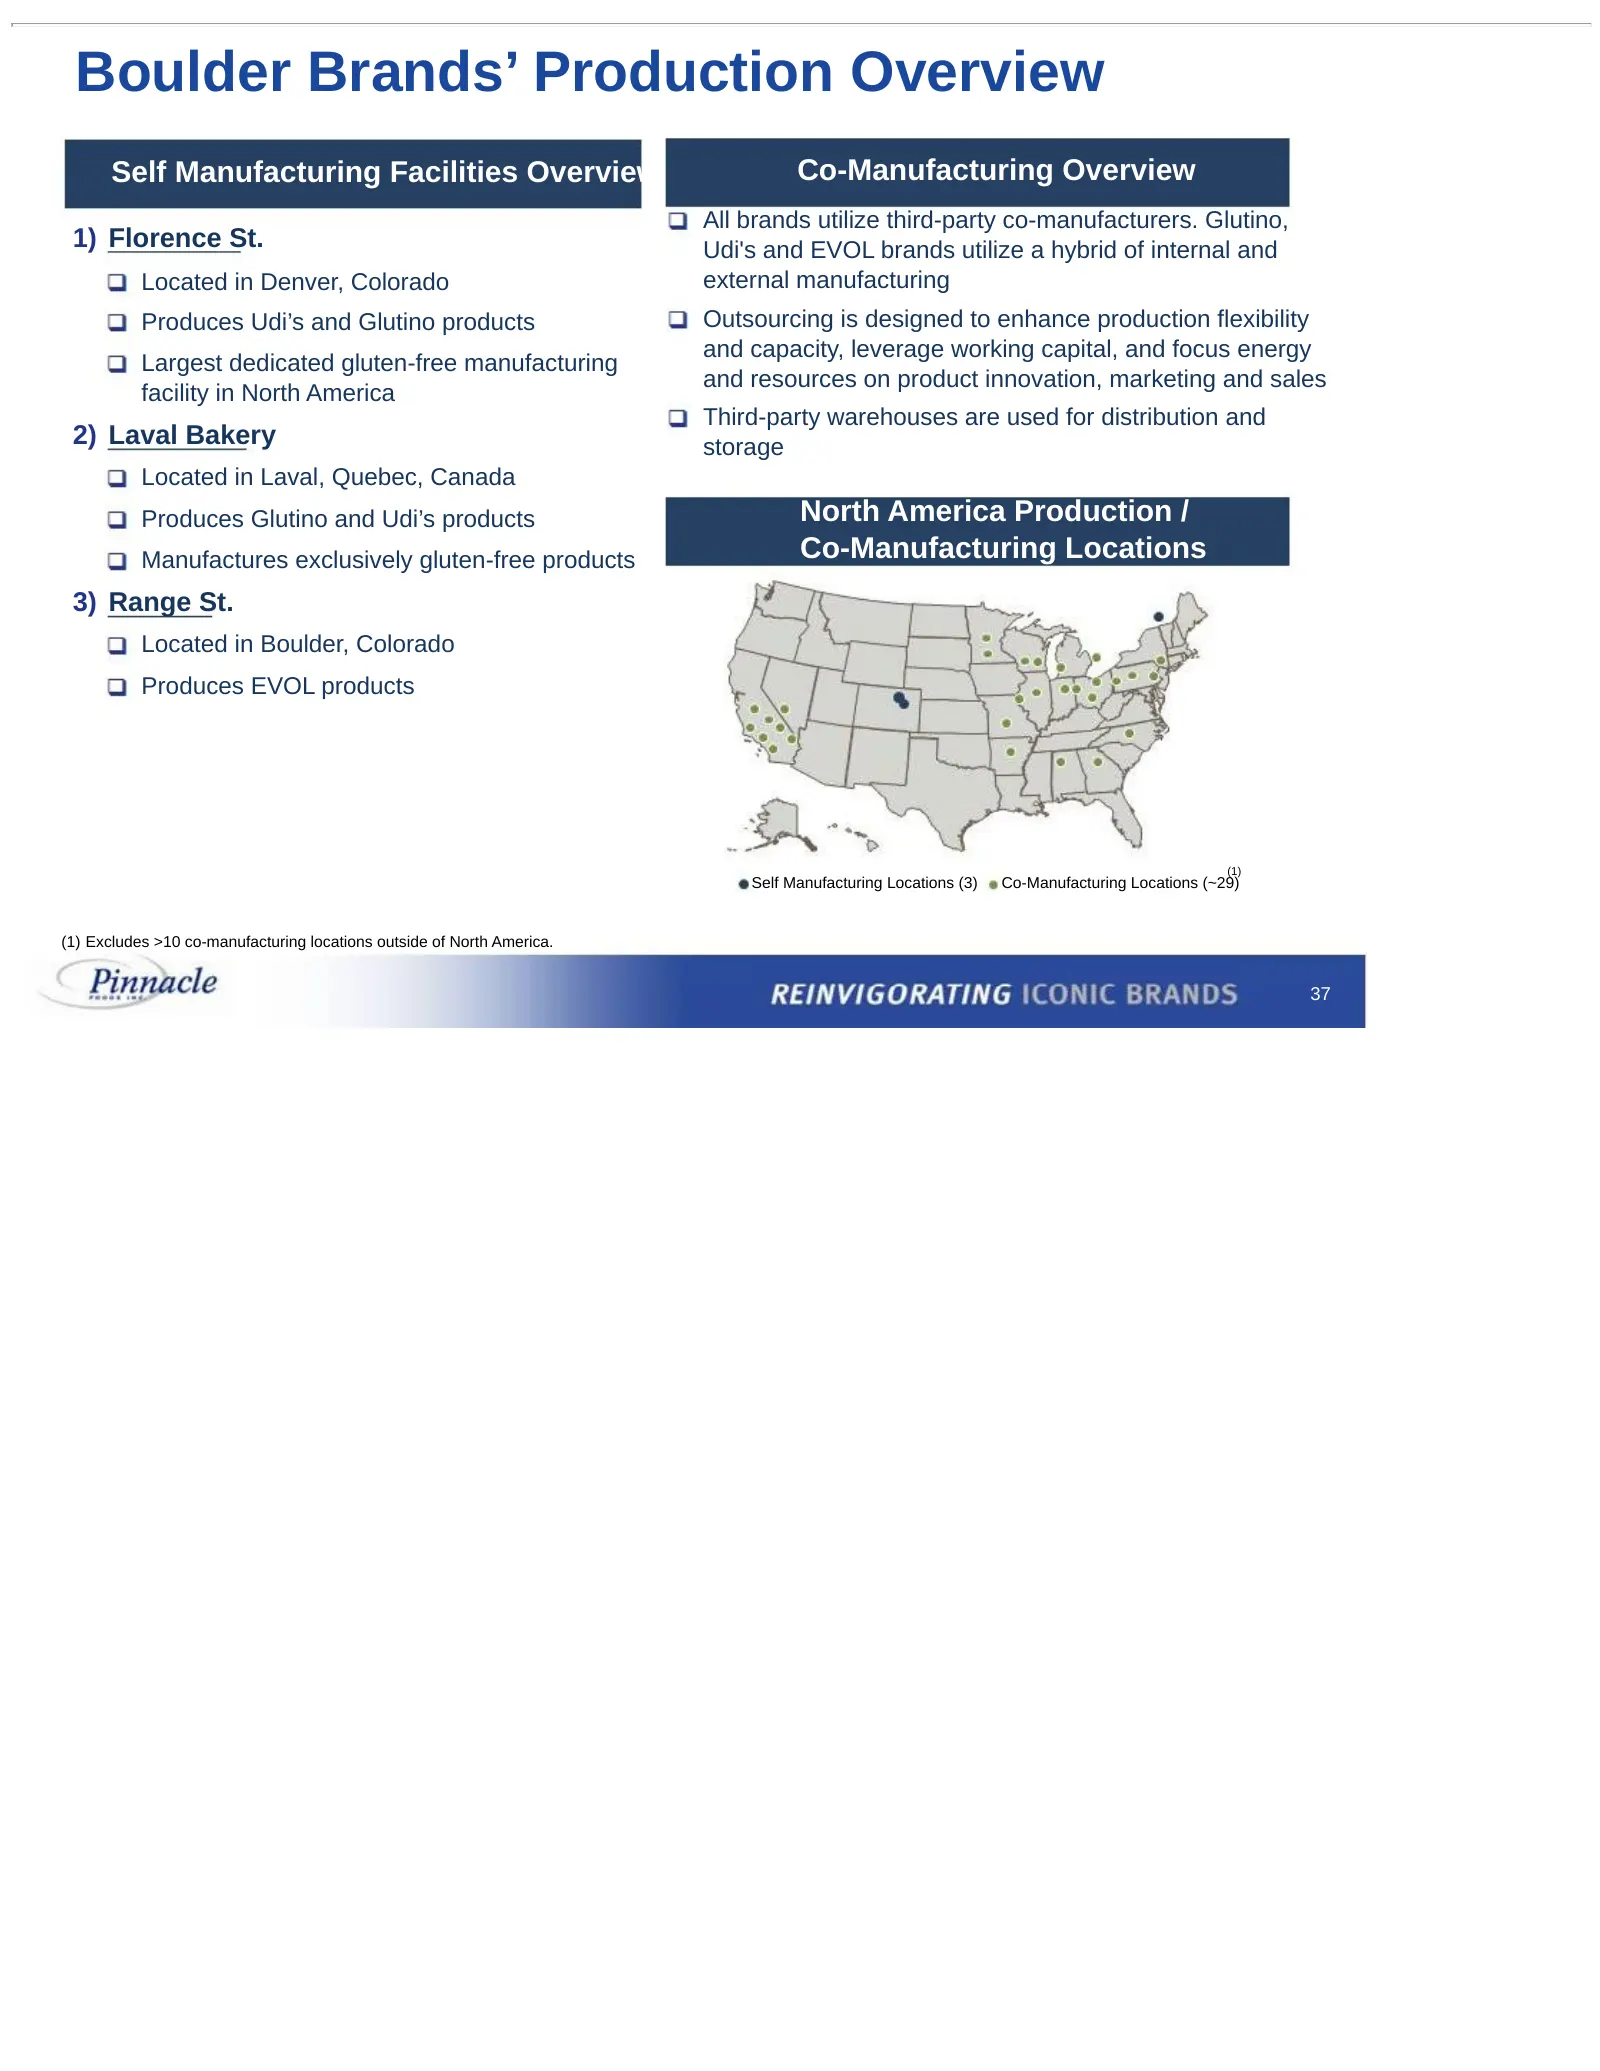
Boulder Brands’ Production Overview Self Manufacturing Facilities Overview Co-Manufacturing Overview All brands utilize third-party co-manufacturers. Glutino, 1) Florence St. Udi's and EVOL brands utilize a hybrid of internal and Located in Denver, Colorado external manufacturing Produces Udi’s and
Slide 39: Historical Boulder Brands Financial Performance
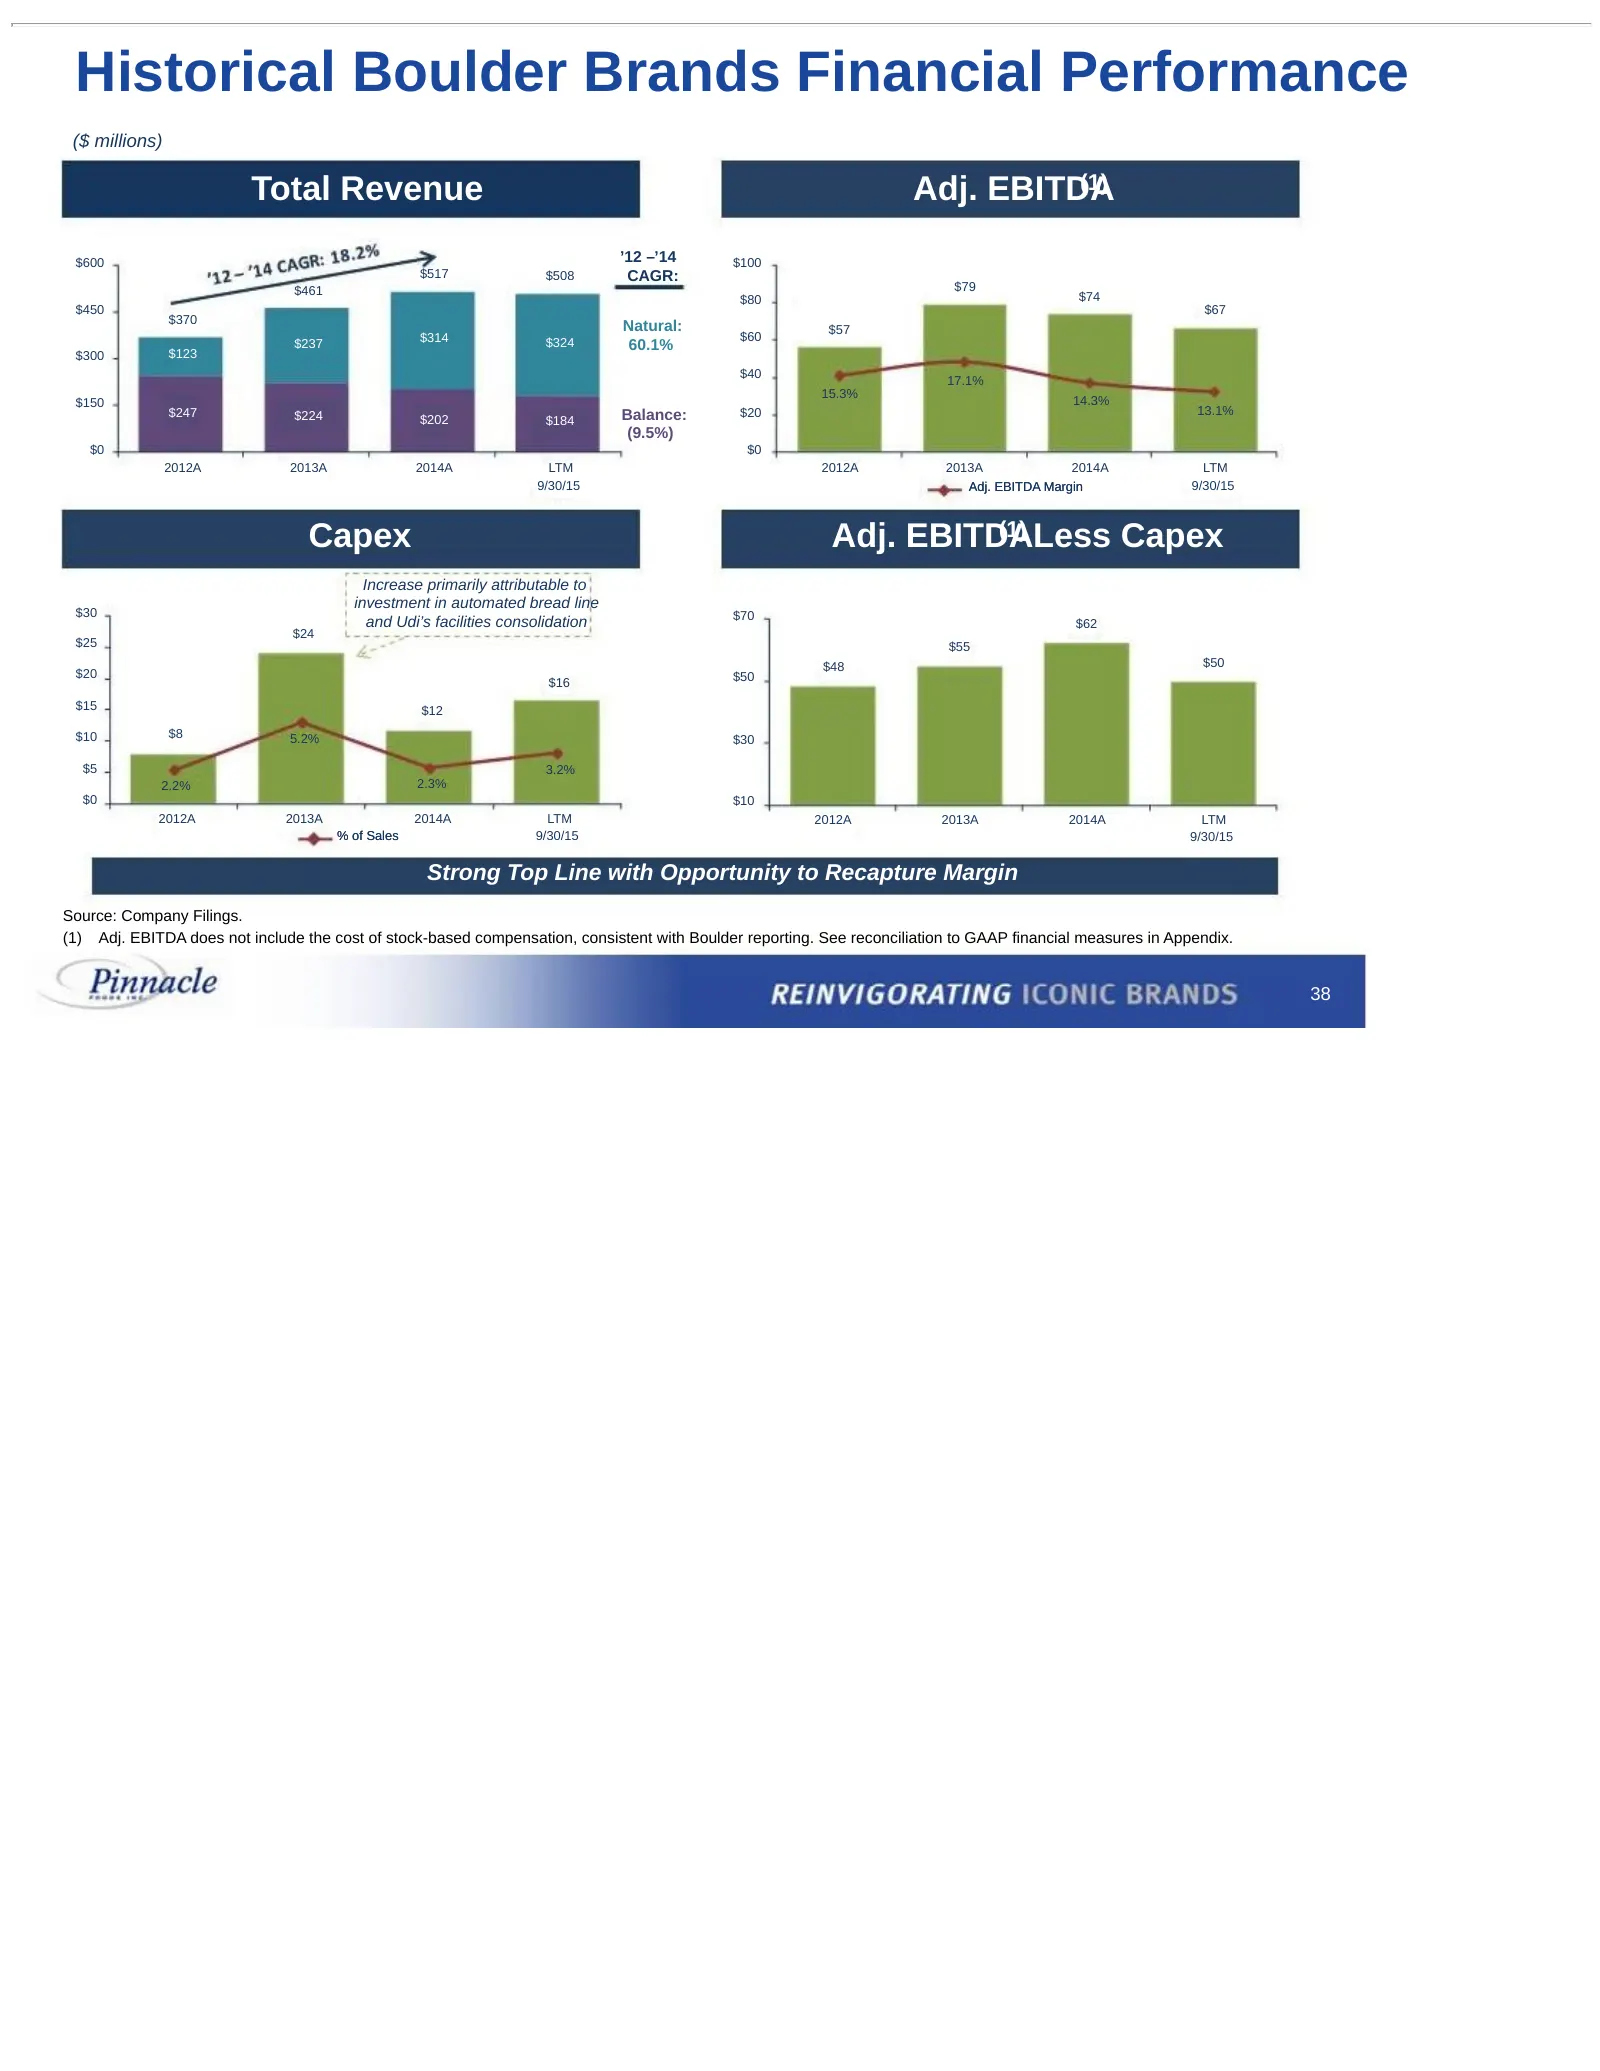
Historical Boulder Brands Financial Performance ($ millions) Total Revenue Adj. EBITDA (1) $600 ’12 –’14 $100 $517 $508 CAGR: $461 $79 $80 $74 $450 $67 $370 Natural: $57 $314 $324 $60 $237 60.1% $300 $123 $40 17.1% 15.3% $150 14.3% $247 $224 Balance: $20 13.1% $202 $184 (9.5%) $0 $0 2012A 2013A 2014
Slide 40: Recent Boulder Brands Performance
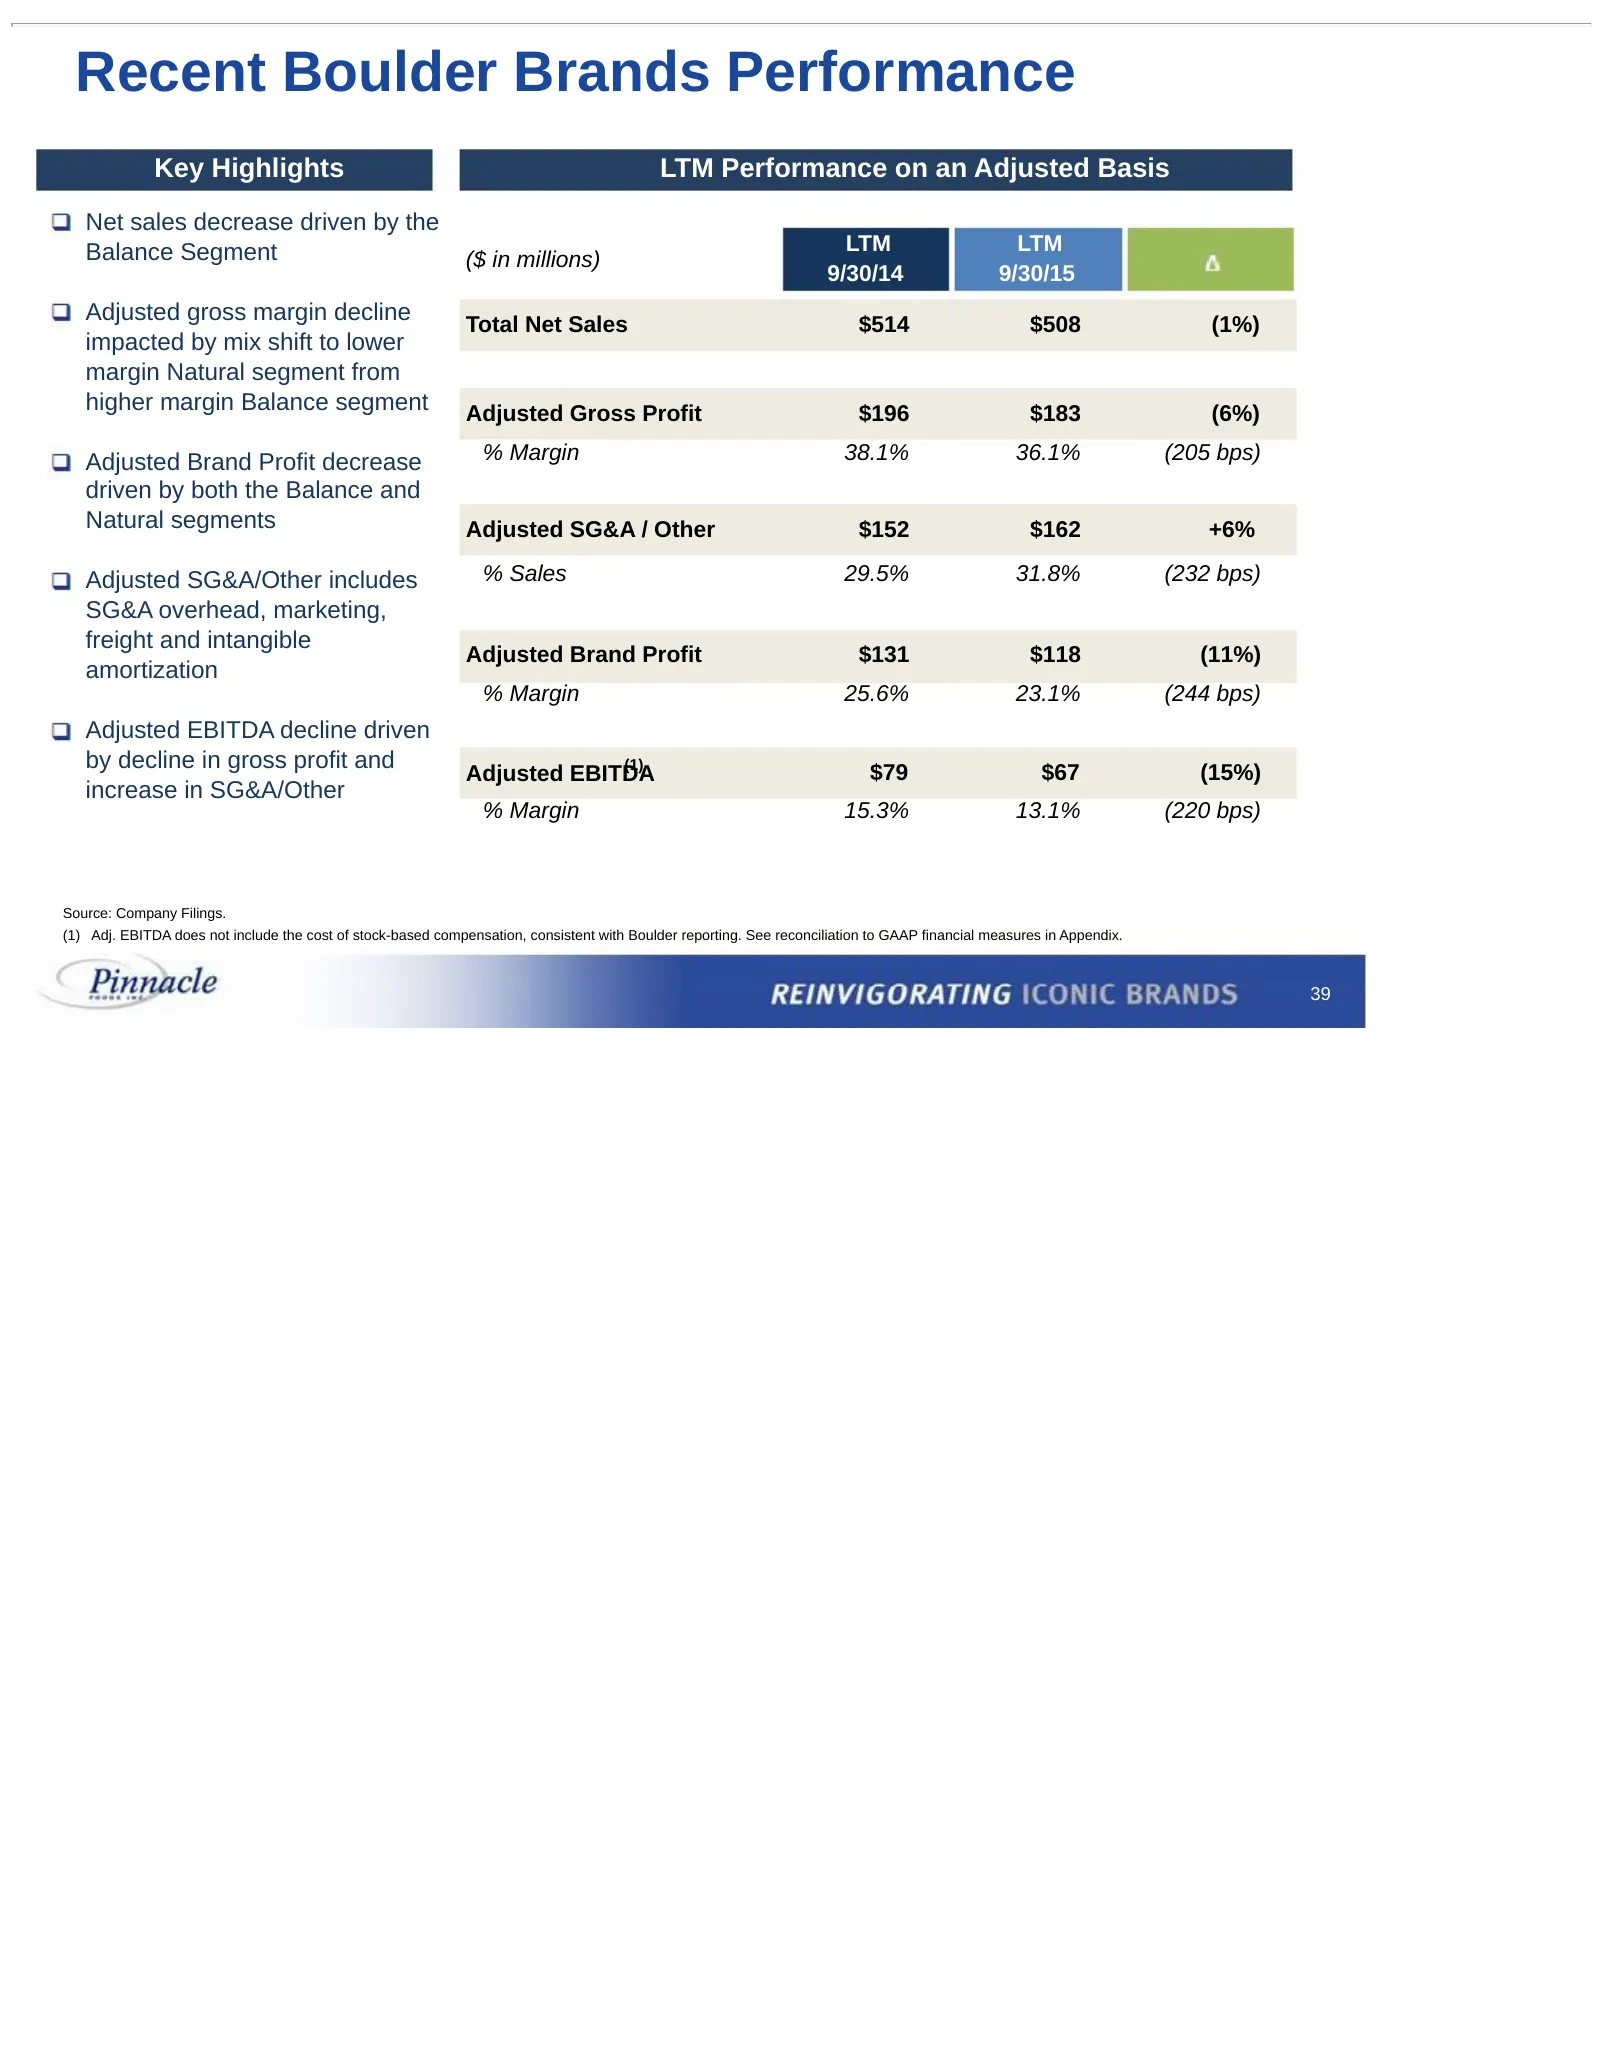
Recent Boulder Brands Performance Key Highlights LTM Performance on an Adjusted Basis Net sales decrease driven by the Balance Segment LTM LTM ($ in millions) 9/30/14 9/30/15 Adjusted gross margin decline Total Net Sales $514 $508 (1%) impacted by mix shift to lower margin Natural segment from highe
Slide 41: Credit Highlights
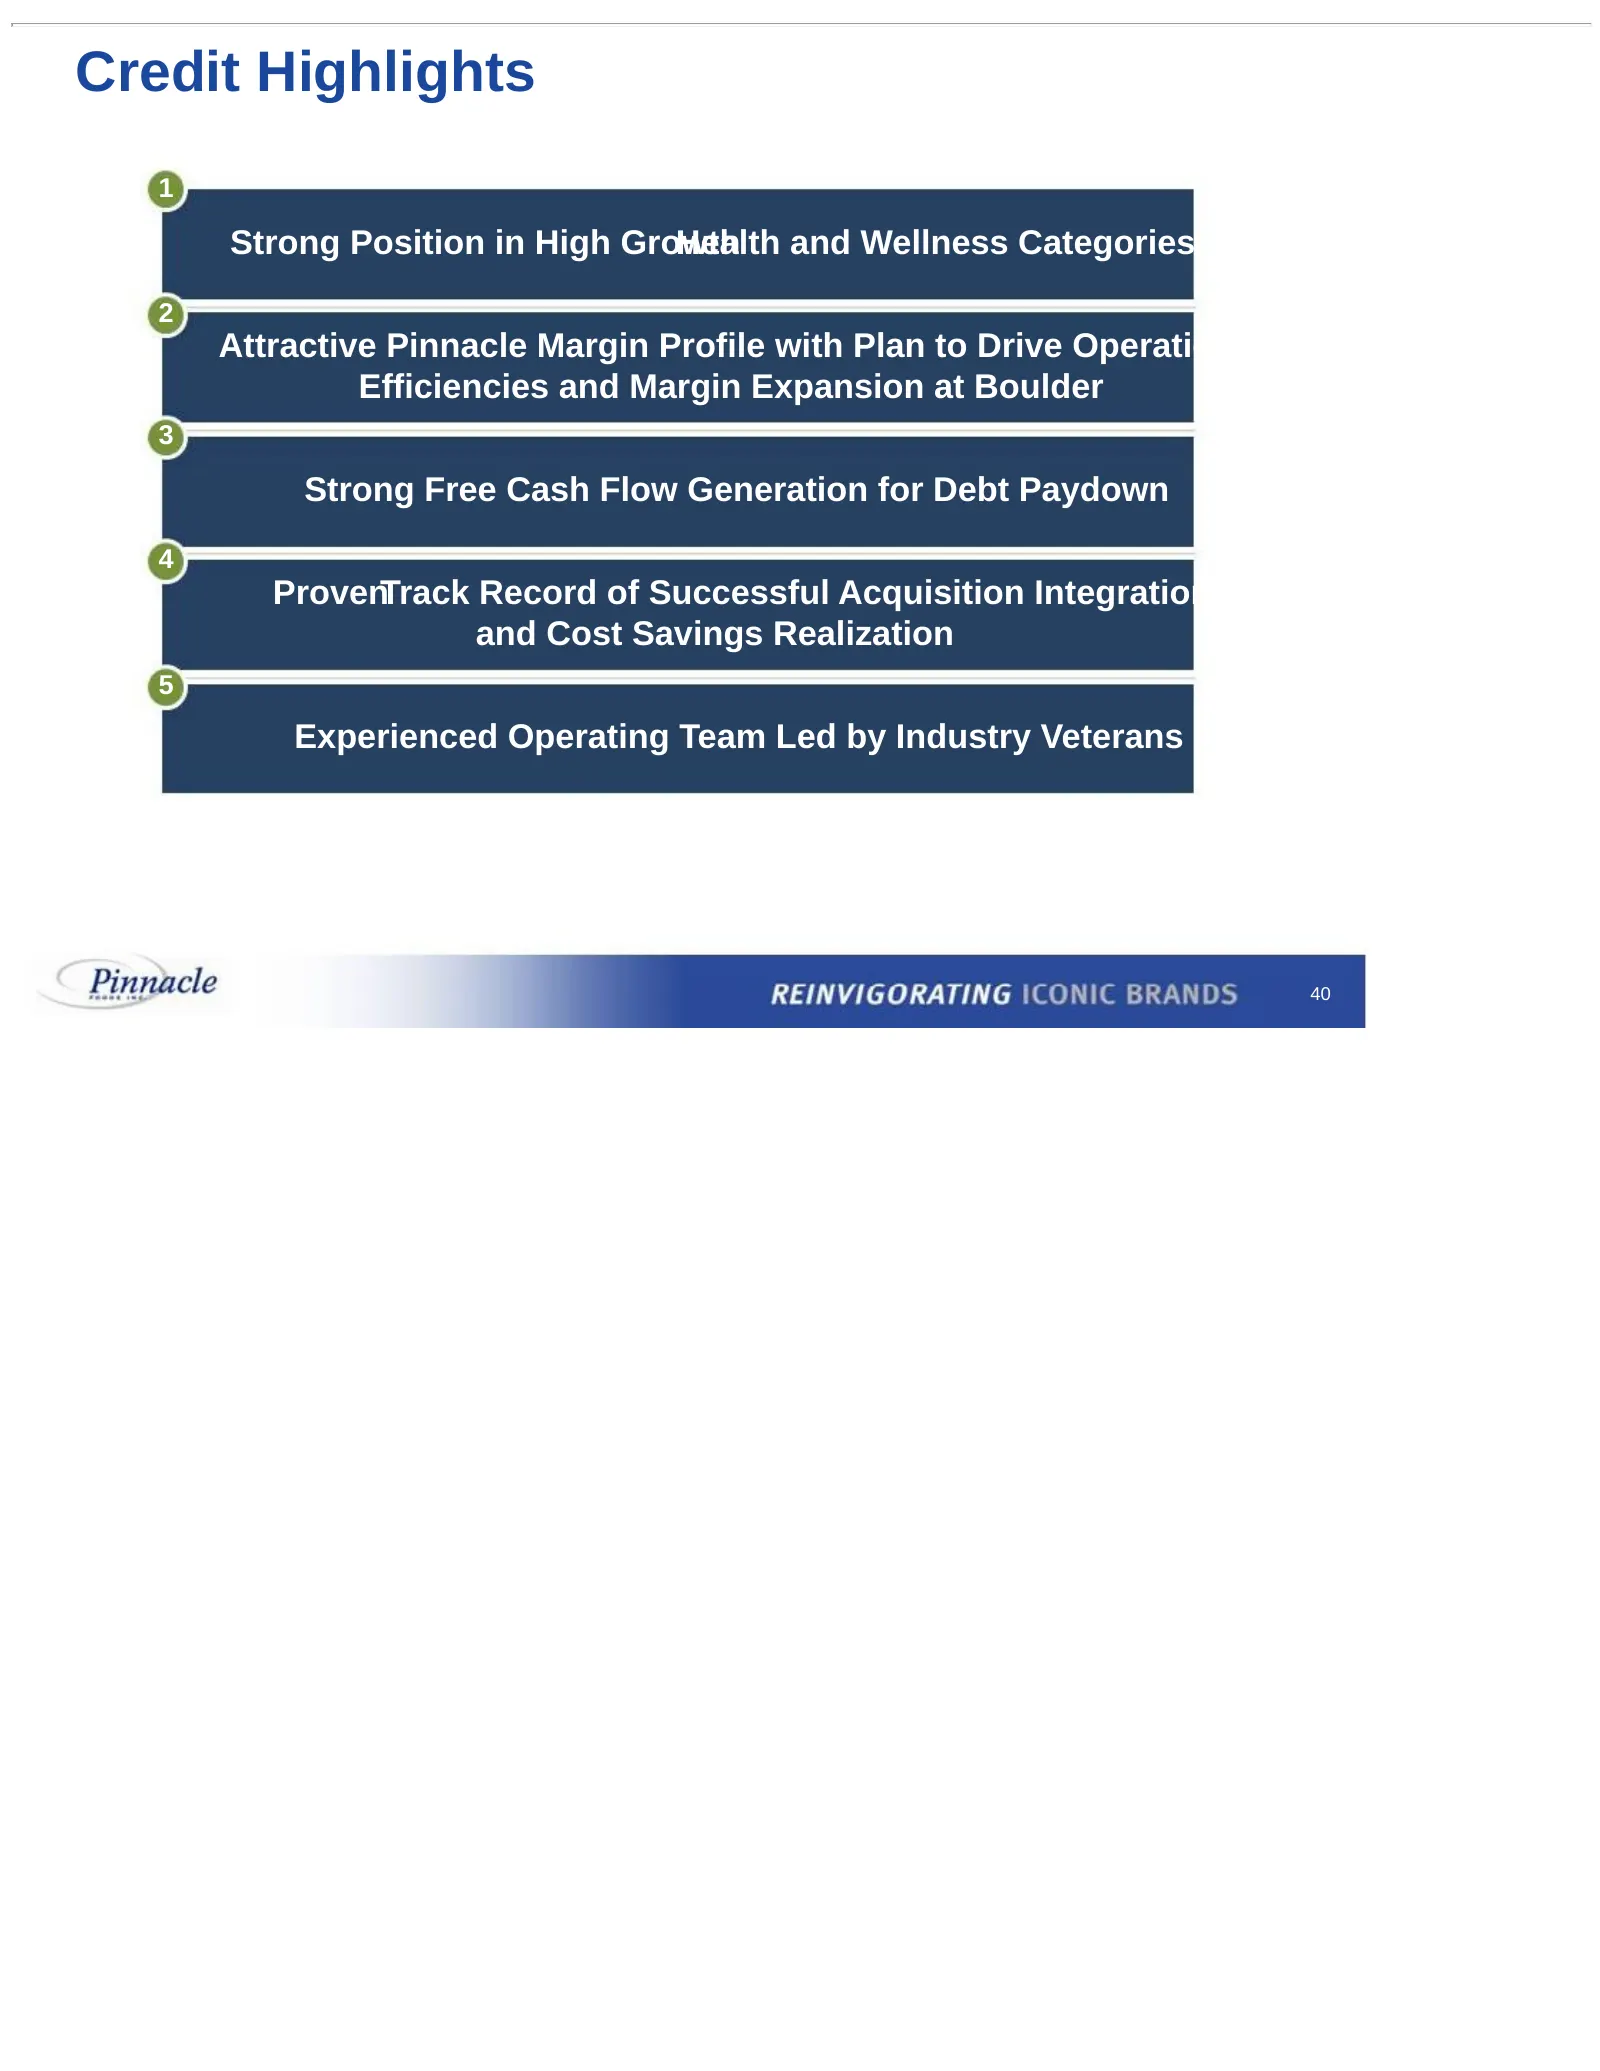
Credit Highlights 1 Strong Position in High Growth Health and Wellness Categories 2 Attractive Pinnacle Margin Profile with Plan to Drive Operational Efficiencies and Margin Expansion at Boulder 3 Strong Free Cash Flow Generation for Debt Paydown 4 ProvenTrack Record of Successful Acquisition Integr
Slide 42: Appendix
© Pinnhcle REINVIGORATING |CONIC BRANDS Appendix
Slide 43: Pinnacle Foods Unleveraged Free Cash Flow Reconciliation
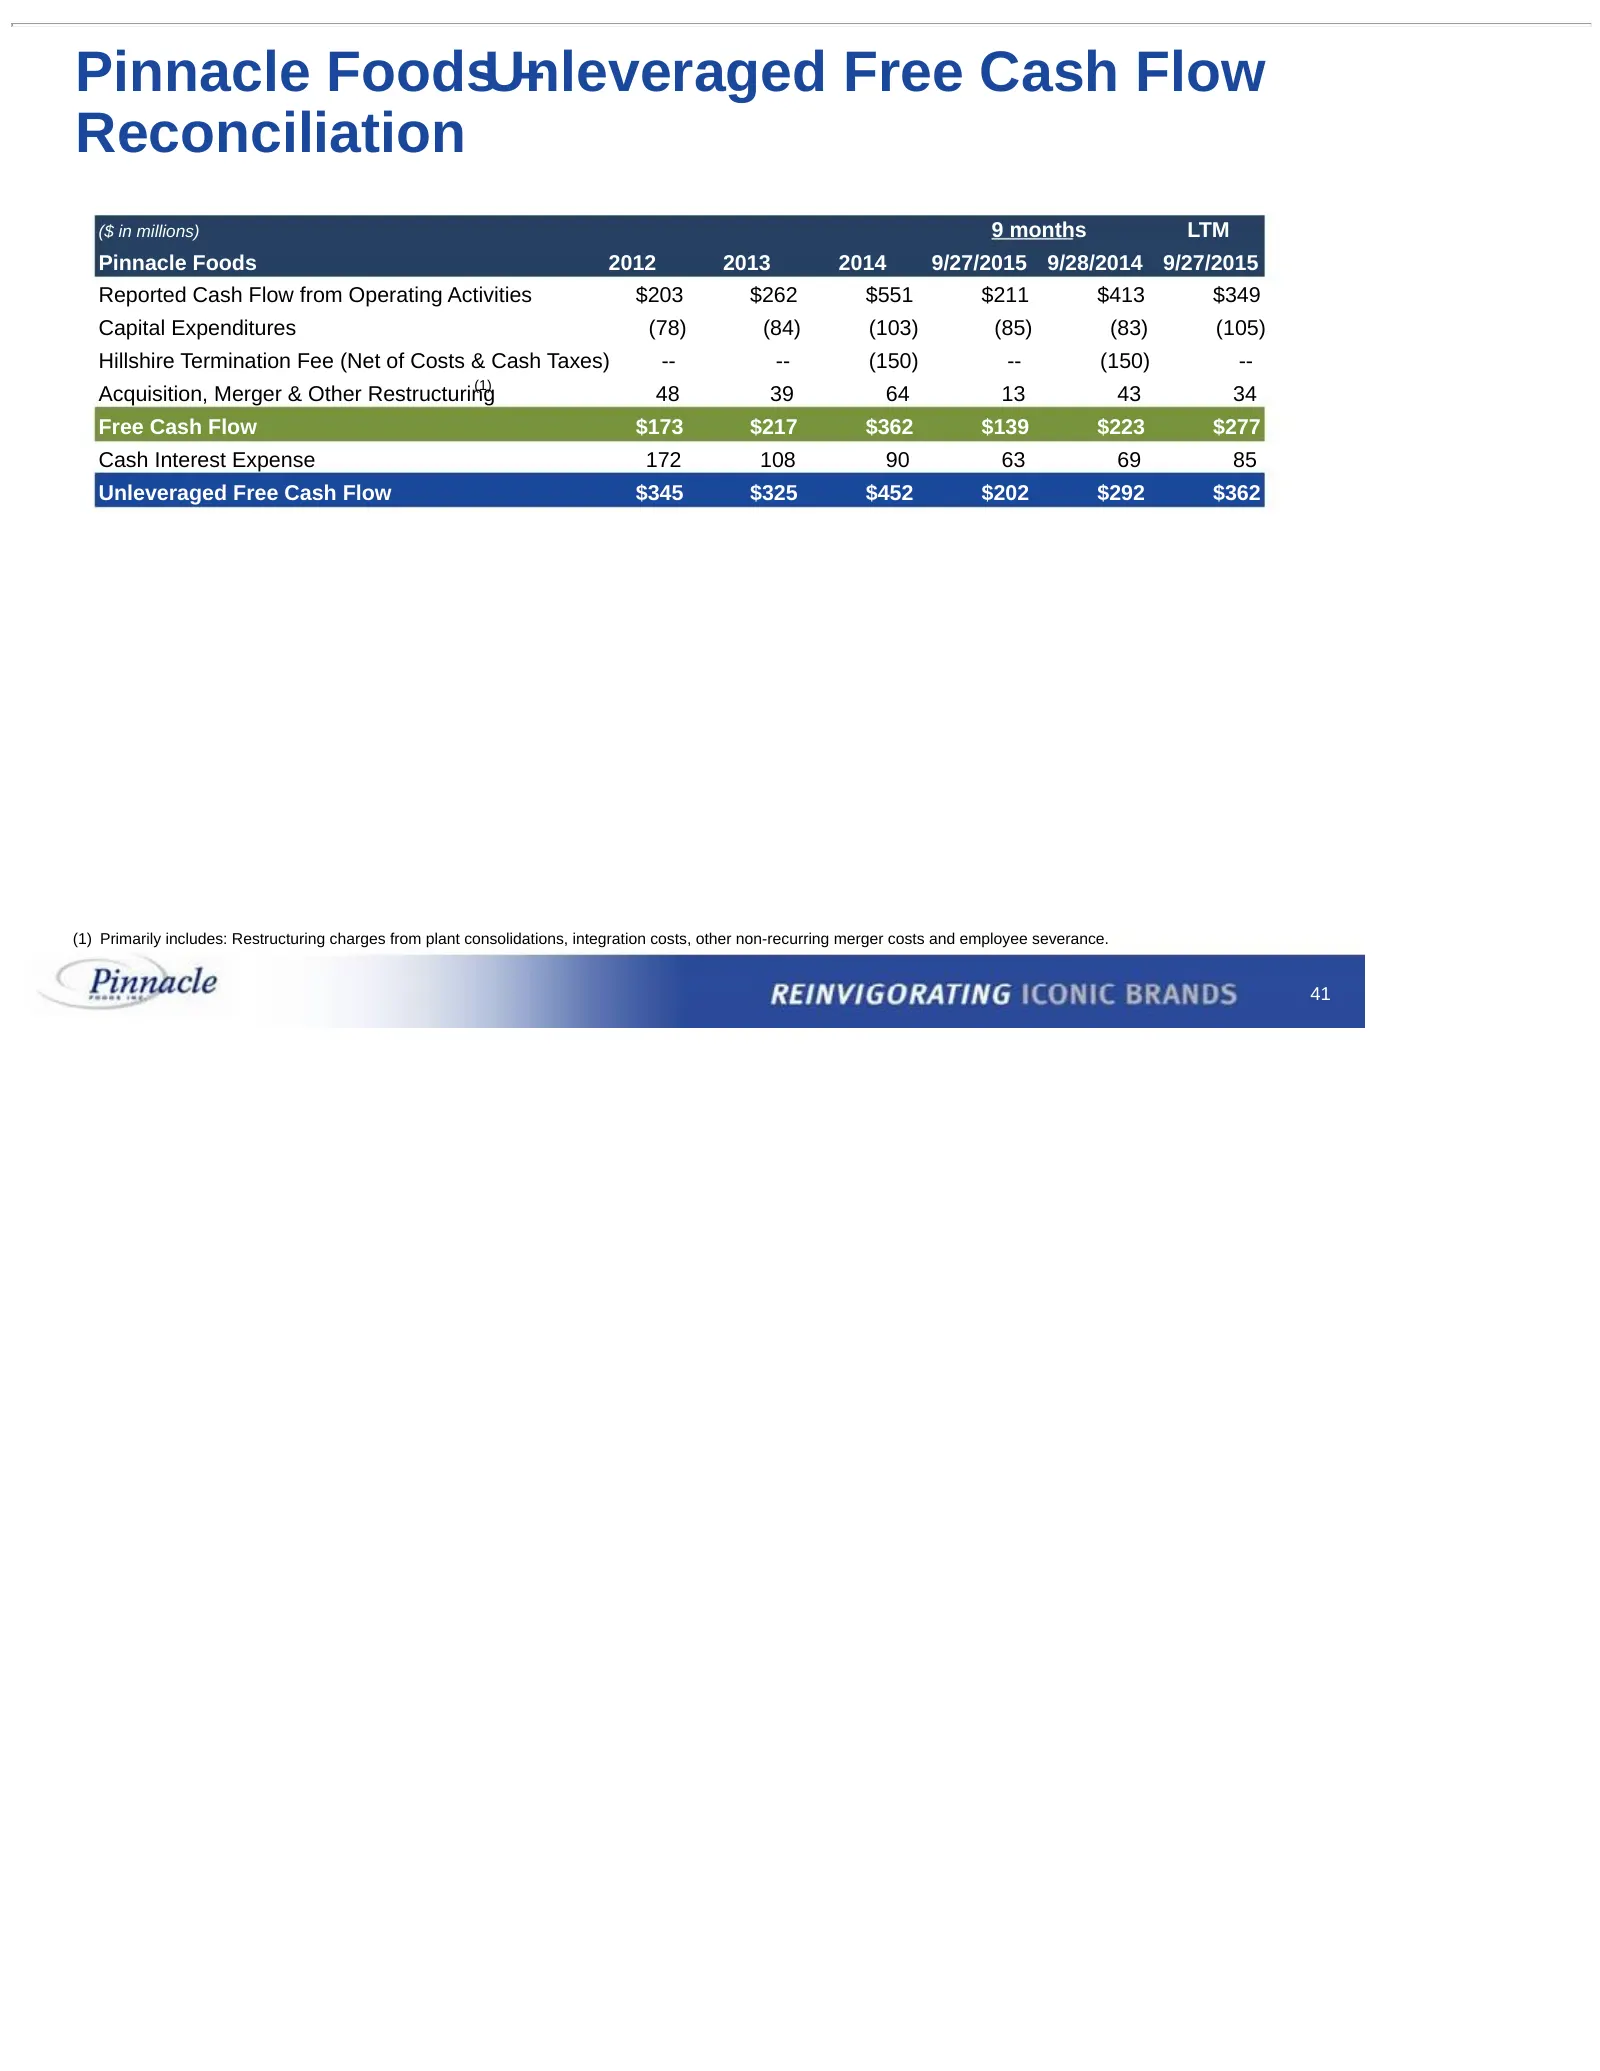
Pinnacle FoodsUnleveraged – Free Cash Flow Reconciliation ($ in millions) 9 months LTM Pinnacle Foods 2012 2013 2014 9/27/2015 9/28/2014 9/27/2015 Reported Cash Flow from Operating Activities $203 $262 $551 $211 $413 $349 Capital Expenditures (78) (84) (103) (85) (83) (105) Hillshire Termination Fee
Slide 44: Pinnacle Foods Adjusted Gross Profit Reconciliation
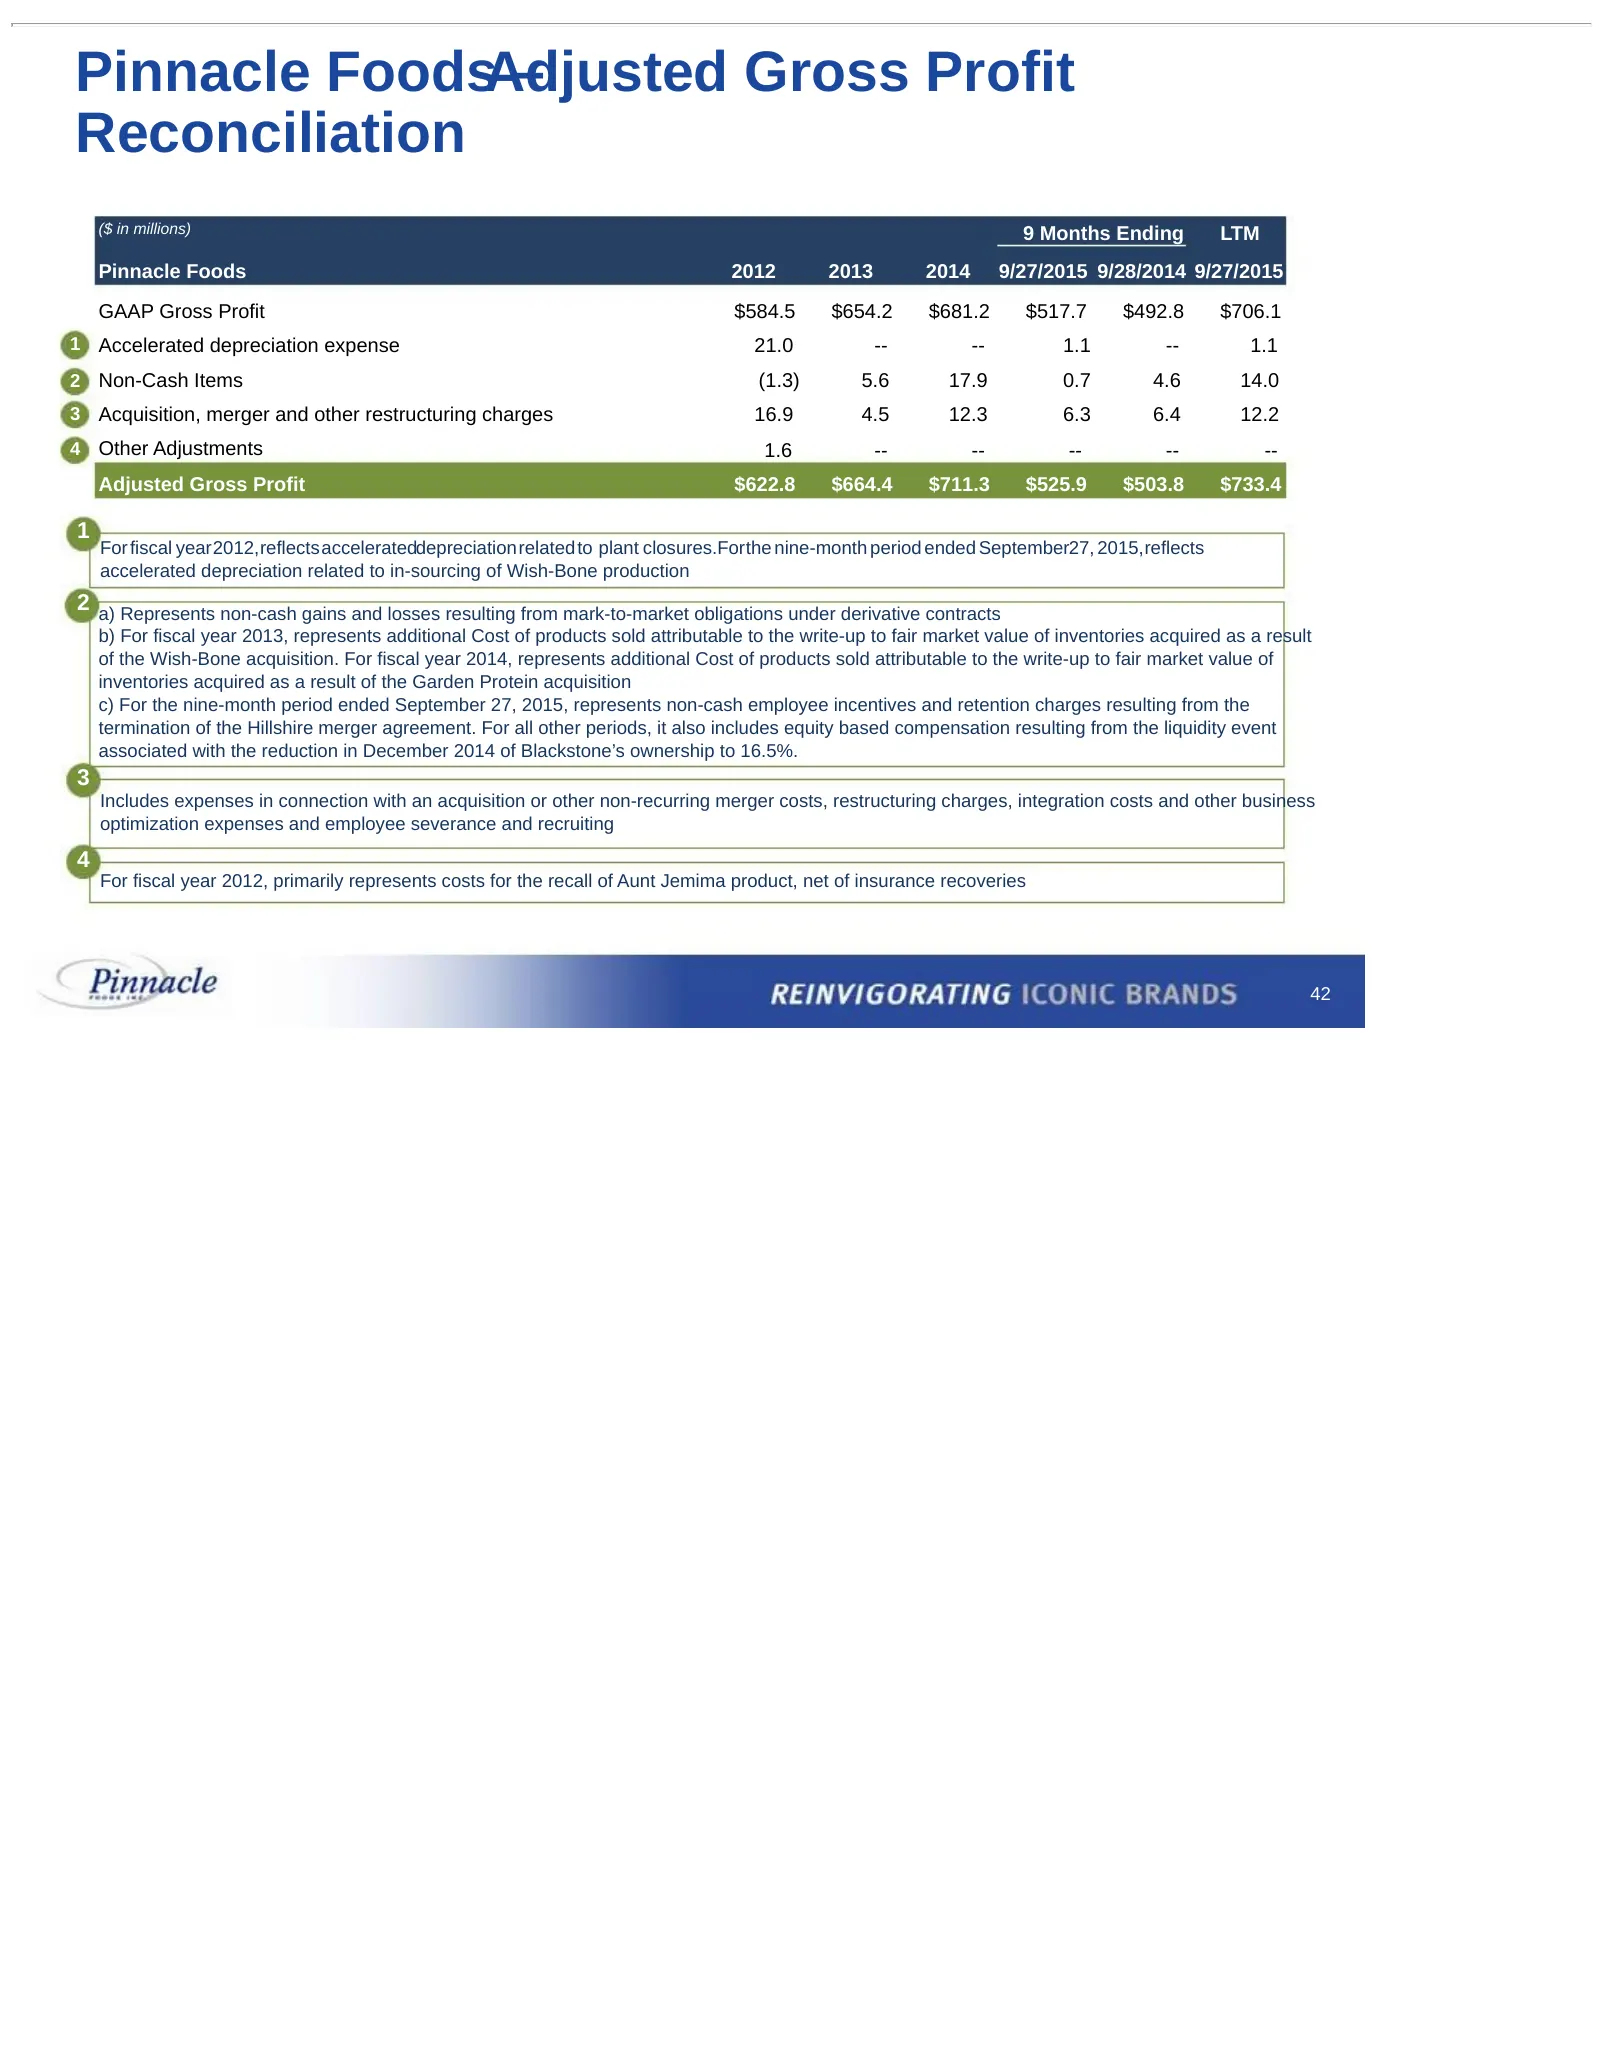
Pinnacle FoodsAdjusted – Gross Profit Reconciliation ($ in millions) 9 Months Ending LTM Pinnacle Foods 2012 2013 2014 9/27/2015 9/28/2014 9/27/2015 GAAP Gross Profit $584.5 $654.2 $681.2 $517.7 $492.8 $706.1 1 Accelerated depreciation expense 21.0 -- -- 1.1 -- 1.1 2 Non-Cash Items (1.3) 5.6 17.9 0.
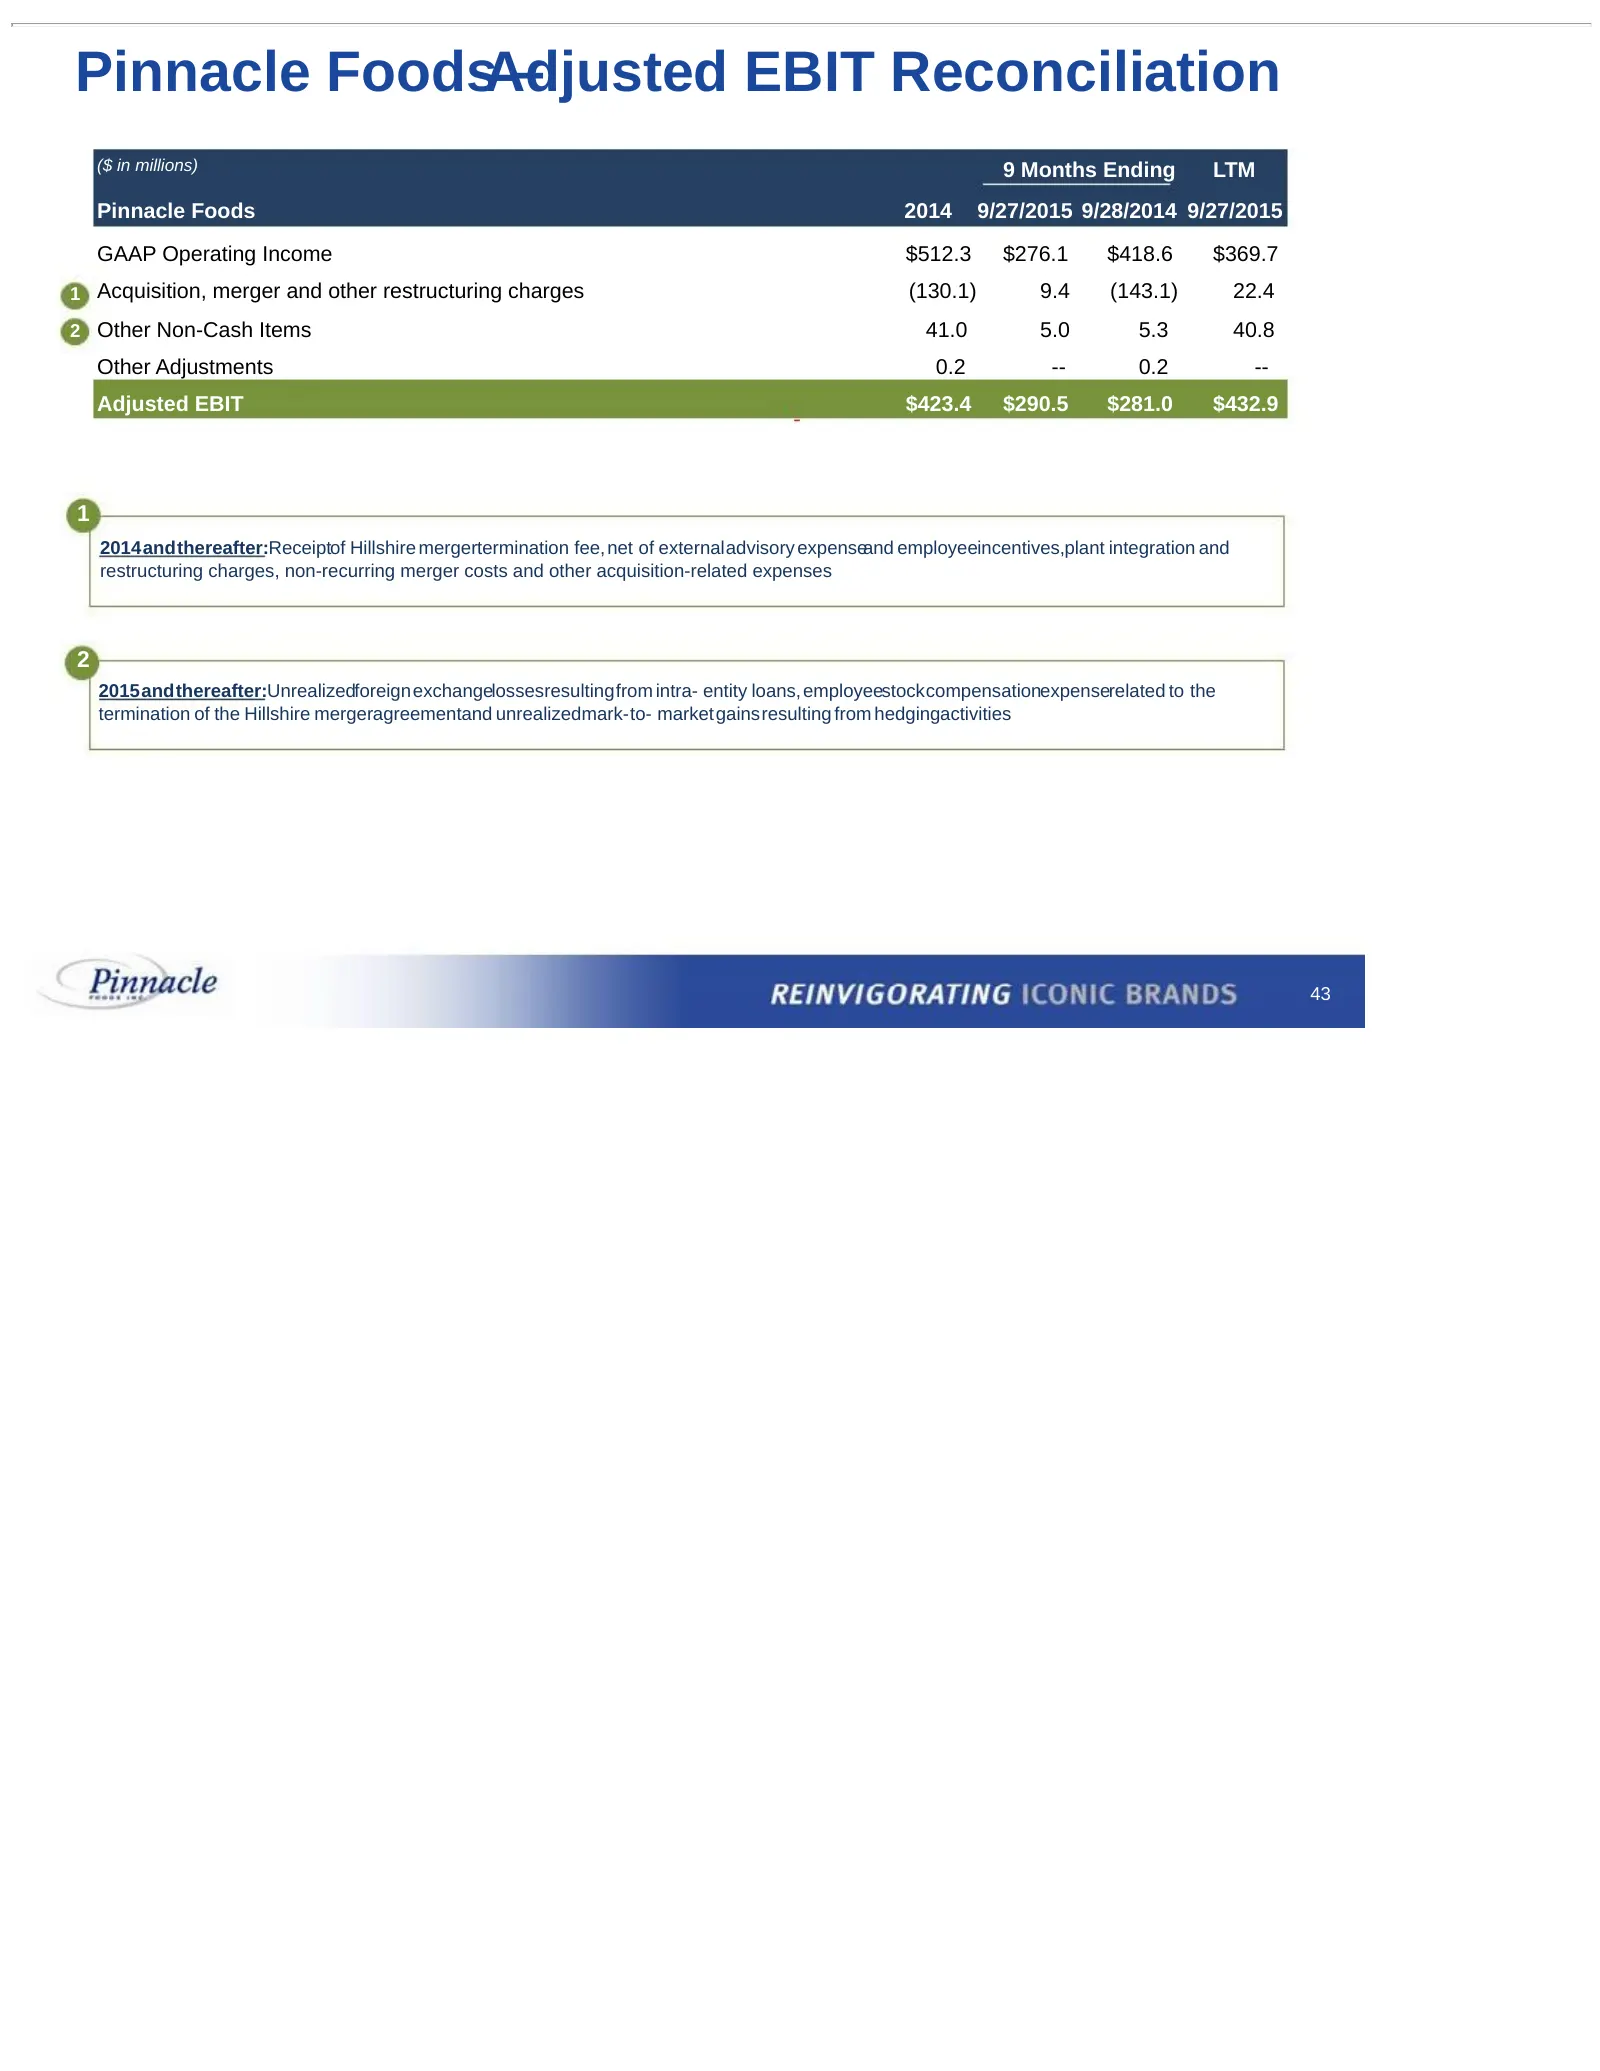
Slide 45: Pinnacle Foods Adjusted EBIT Reconciliation
Pinnacle FoodsAdjusted – EBIT Reconciliation ($ in millions) 9 Months Ending LTM Pinnacle Foods 2014 9/27/2015 9/28/2014 9/27/2015 GAAP Operating Income $283.6 $293.0 $512.3 $276.1 $418.6 $369.7 1 Acquisition, merger and other restructuring charges 45.1 22.1 (130.1) 9.4 (143.1) 22.4 2 Other Non-Cash
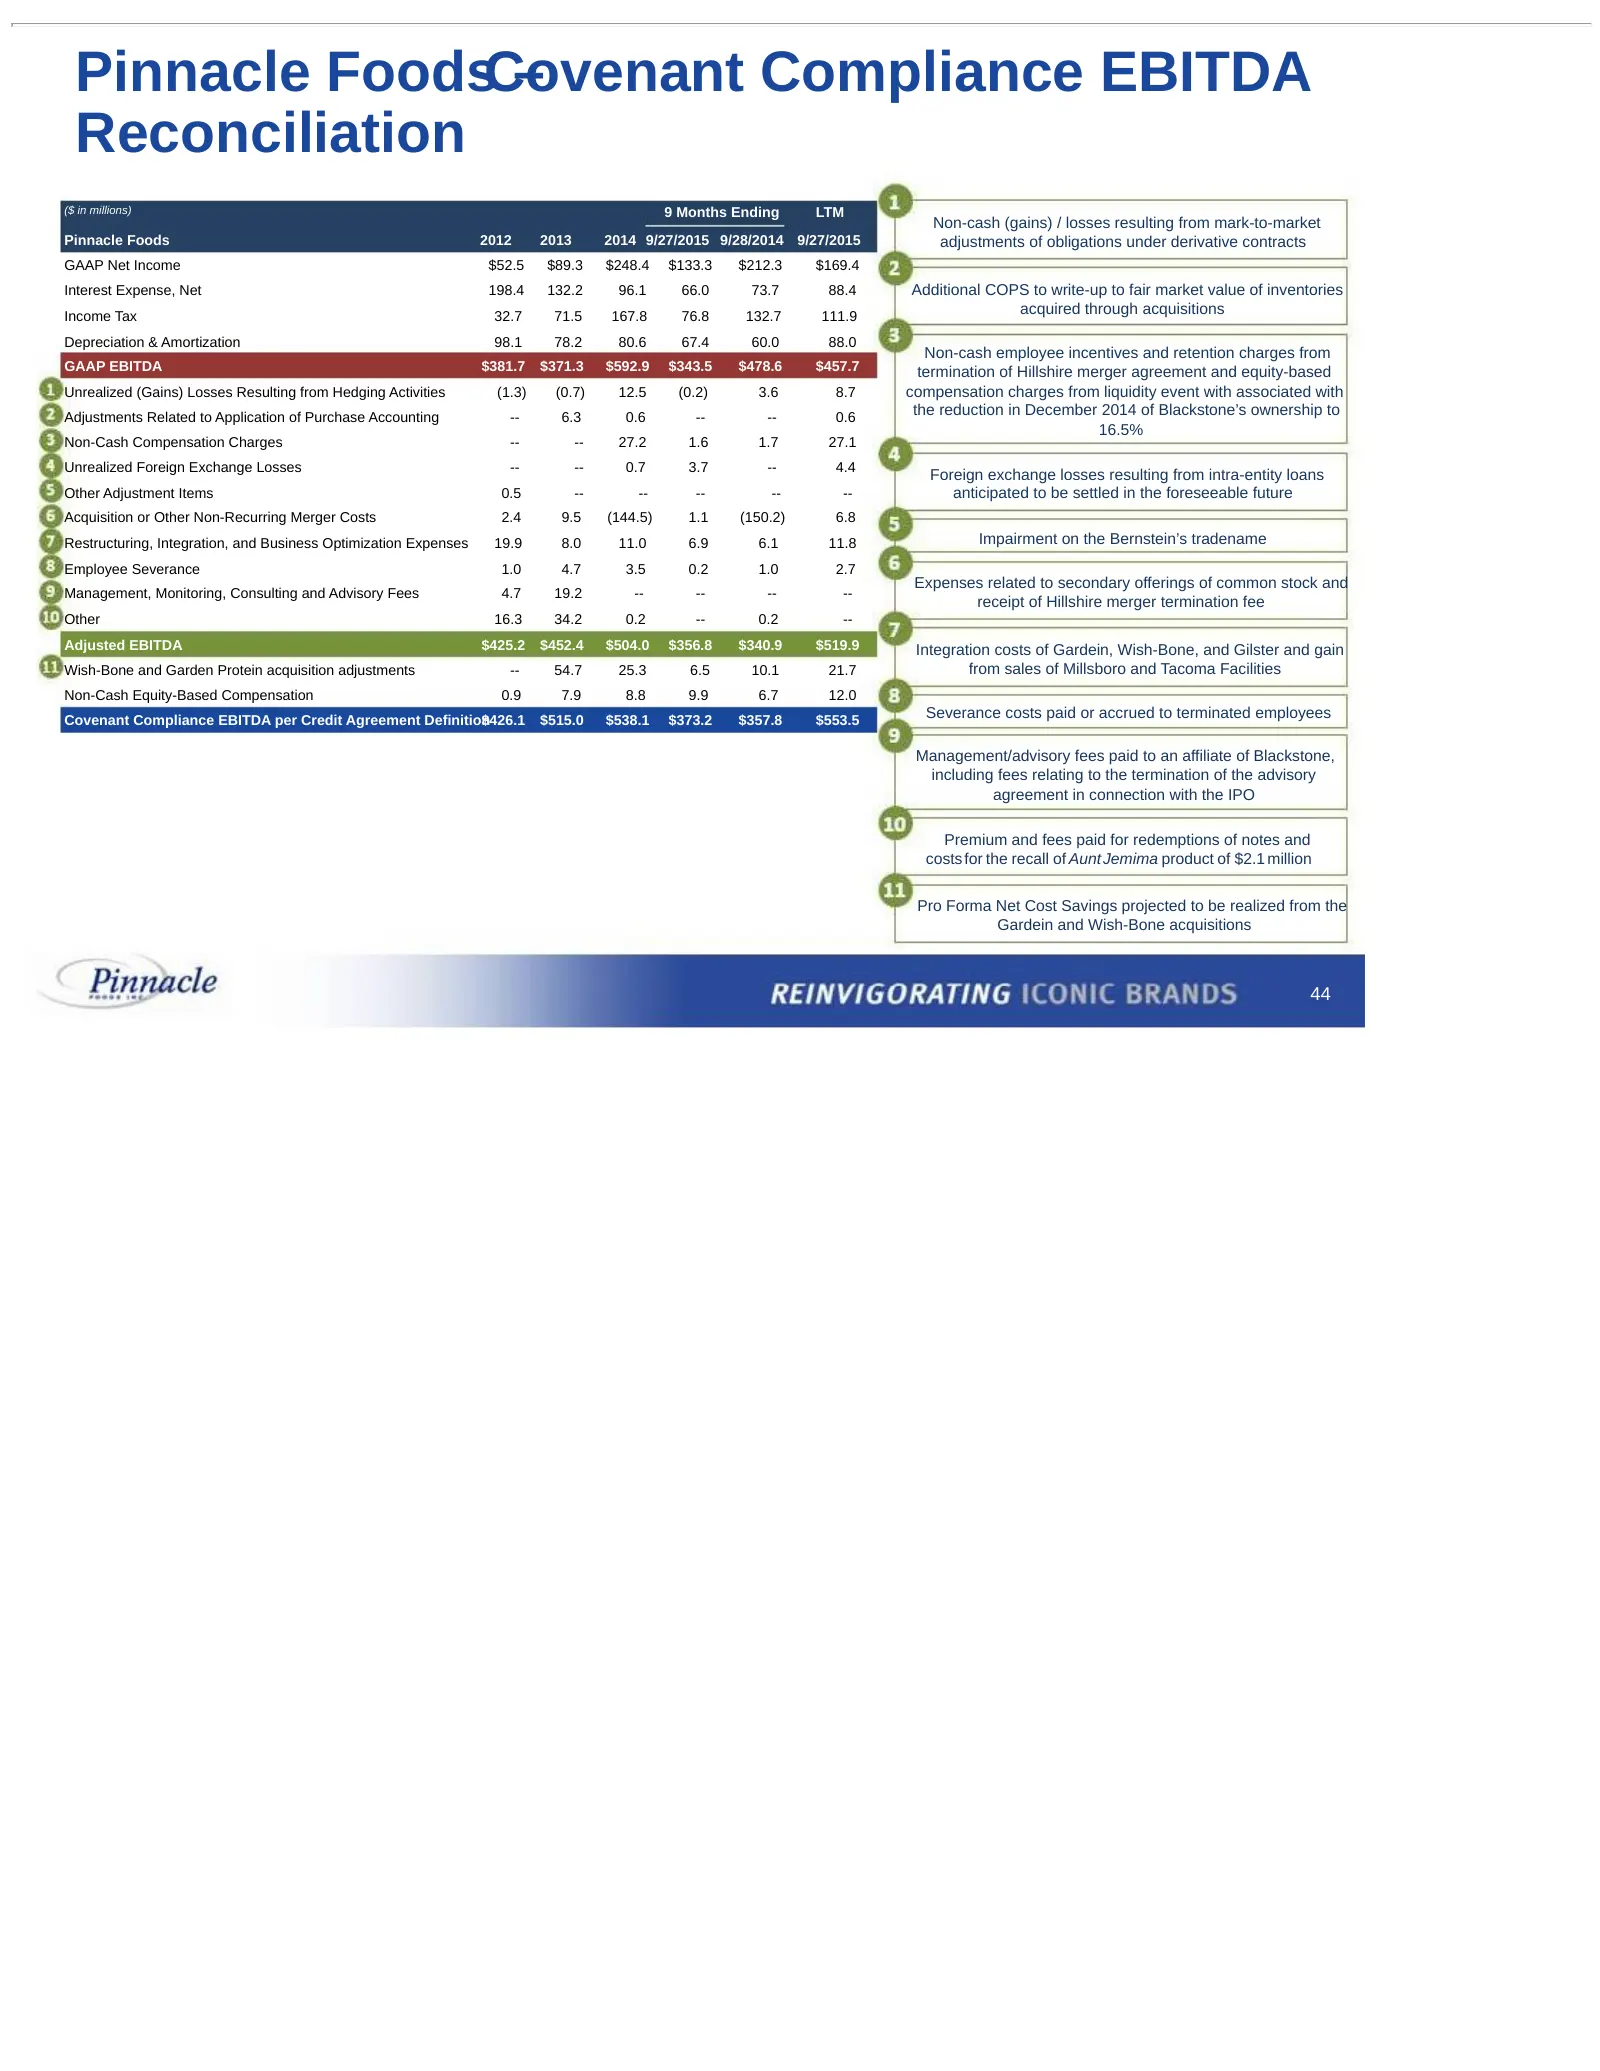
Slide 46: Pinnacle Foods Covenant Compliance EBITDA Reconciliation
Pinnacle FoodsCovenant – Compliance EBITDA Reconciliation ($ in millions) 9 Months Ending LTM Non-cash (gains) / losses resulting from mark-to-market Pinnacle Foods 2012 2013 2014 9/27/2015 9/28/2014 9/27/2015 adjustments of obligations under derivative contracts GAAP Net Income $52.5 $89.3 $248.4 $
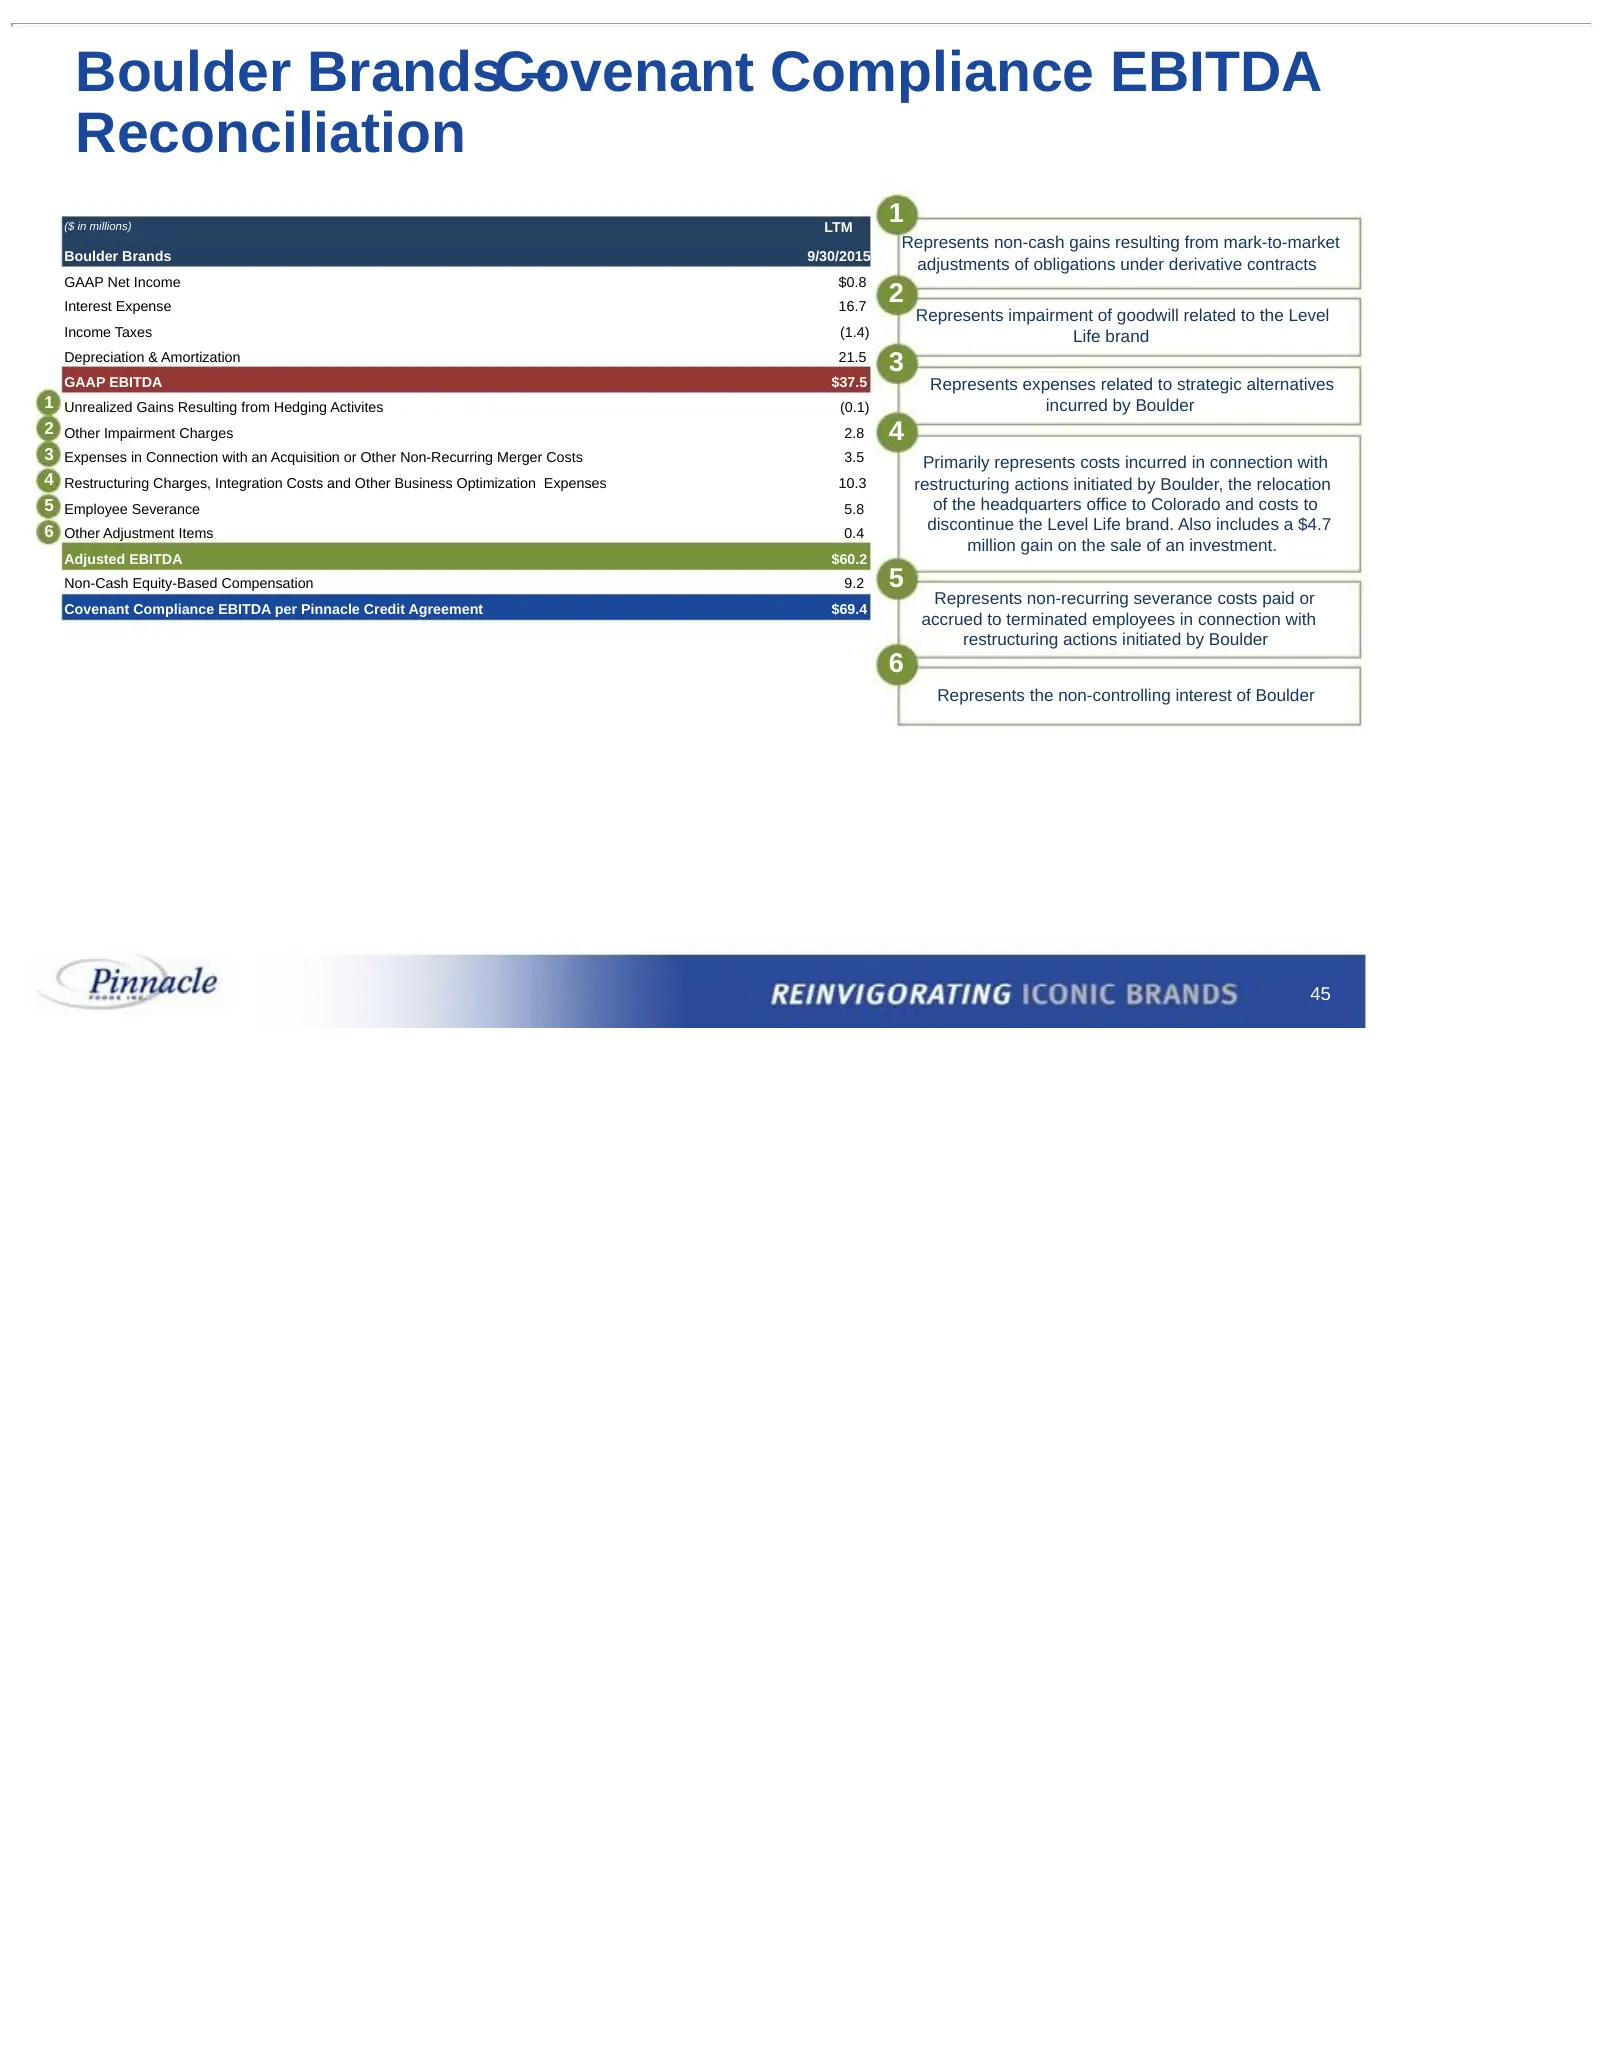
Slide 47: Boulder Brands Covenant Compliance EBITDA Reconciliation
Boulder BrandsCovenant – Compliance EBITDA Reconciliation ($ in millions) LTM 1 Represents non-cash gains resulting from mark-to-market Boulder Brands 9/30/2015 adjustments of obligations under derivative contracts GAAP Net Income $0.8 Interest Expense 16.7 2 Represents impairment of goodwill relate
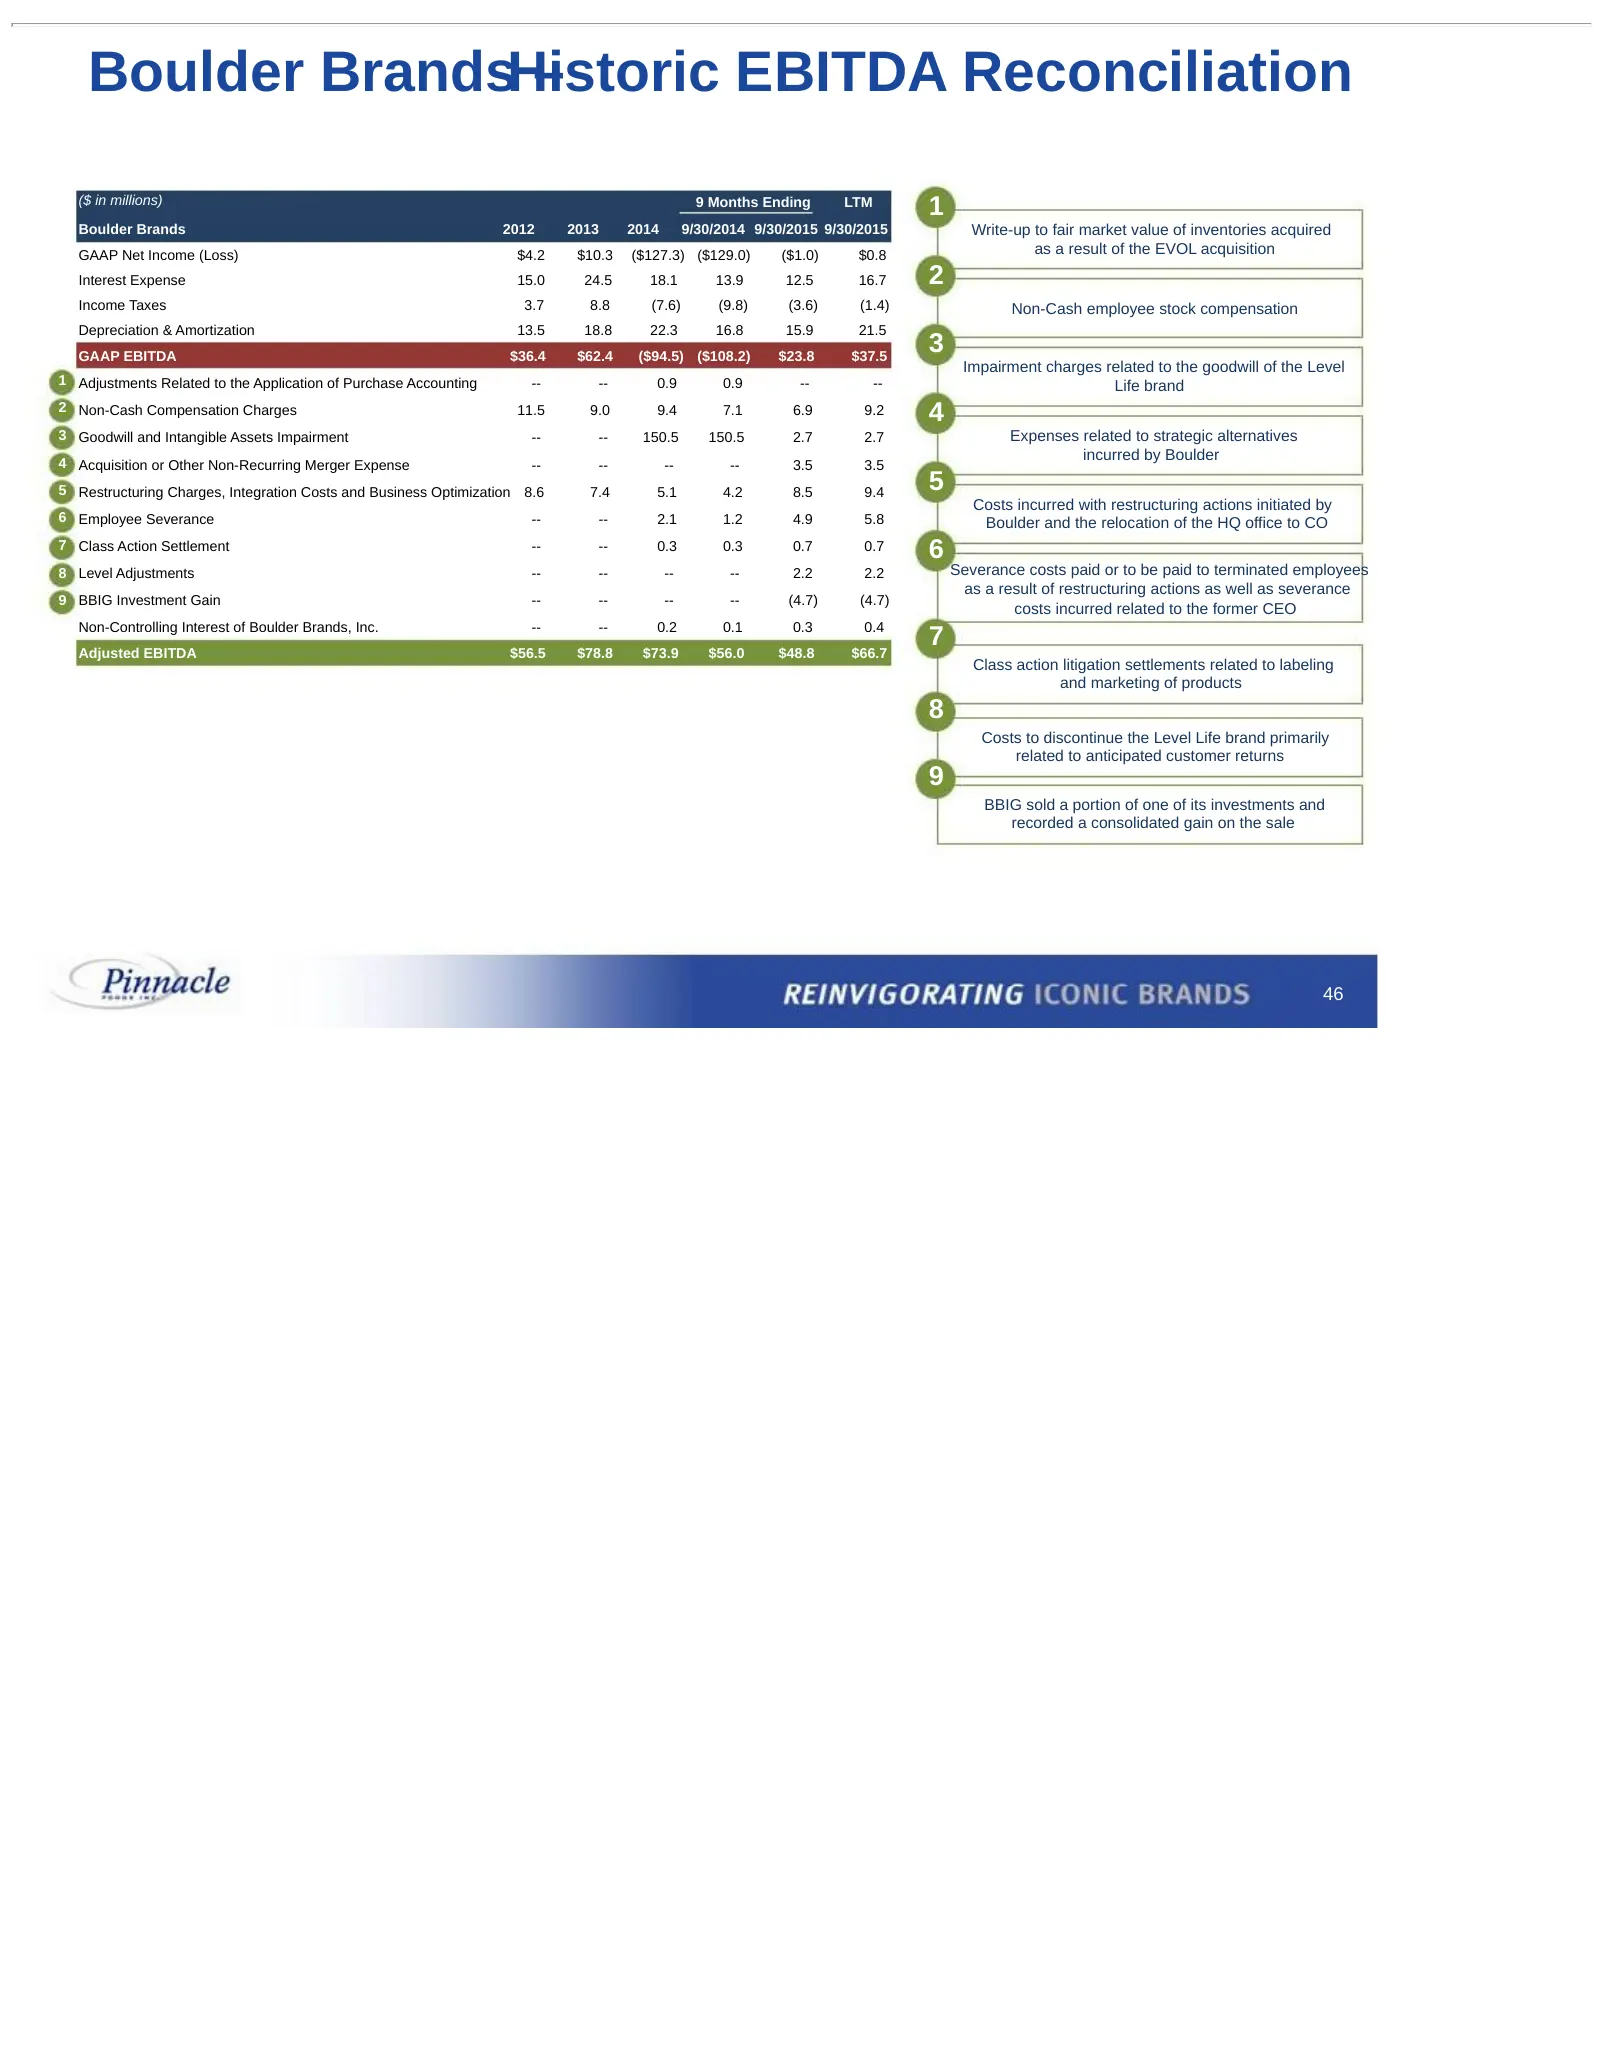
Slide 48: Boulder Brands Historic EBITDA Reconciliation
Boulder BrandsHistoric – EBITDA Reconciliation ($ in millions) 9 Months Ending LTM 1 Boulder Brands 2012 2013 2014 9/30/2014 9/30/2015 9/30/2015 Write-up to fair market value of inventories acquired GAAP Net Income (Loss) $4.2 $10.3 ($127.3) ($129.0) ($1.0) $0.8 as a result of the EVOL acquisition I
Source: SEC EDGAR · 8-K filed Jan 6, 2016
More decks from Pinnacle Foods Inc
 Q1 FY2019 Earnings Presentation44 slides · Sep 27, 2018
 Q4 FY2018 Earnings Presentation59 slides · Jun 27, 2018
 Barclays Global Consumer Staples Conference 201767 slides · Sep 6, 2017
 Debt Investor Presentation (January 2017)55 slides · Jan 23, 2017
 Investor Day (December 2016)55 slides · Dec 15, 2016
 Barclays Global Consumer Staples Conference 201651 slides · Sep 6, 2016