SunTrust Banks — Goldman Sachs Financial Services Conference 2015
23 slides from SunTrust Banks's conference presentation, Dec 8, 2015
Slide 1: Goldman Sachs Financial Services Conference
Goldman Sachs Financial Services Conference William H. Rogers Jr., Chairman and Chief Executive Officer, SunTrust Banks, Inc. December 8, 2015
Slide 2: Forward-looking statements and non-GAAP disclosure
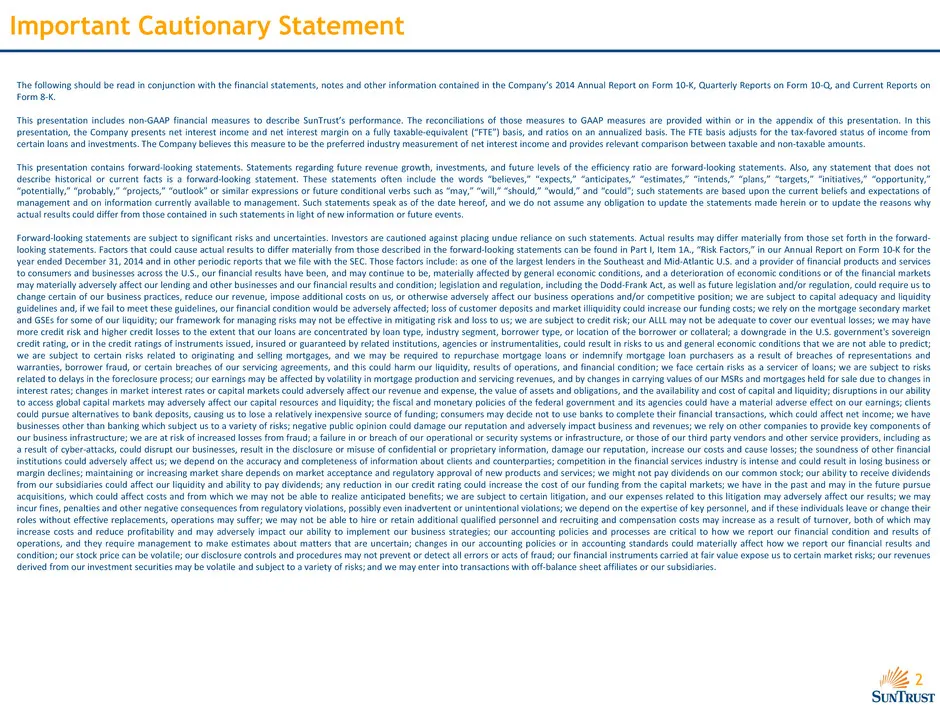
2 The following should be read in conjunction with the financial statements, notes and other information contained in the Company’s 2014 Annual Report on Form 10-K, Quarterly Reports on Form 10-Q, and Current Reports on Form 8-K. This presentation includes non-GAAP financial measures to describe Sun
Slide 3: Investment Thesis: Why invest in SunTrust?
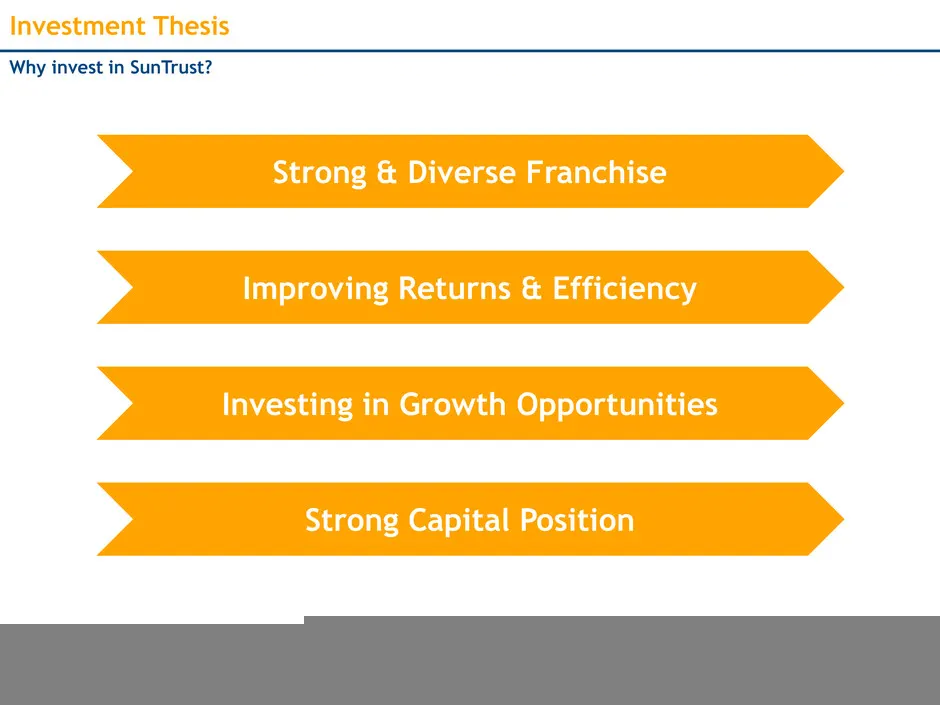
3 Investment Thesis Why invest in SunTrust? Investing in Growth Opportunities Strong & Diverse Franchise Improving Returns & Efficiency Strong Capital Position
Slide 4: SunTrust Overview
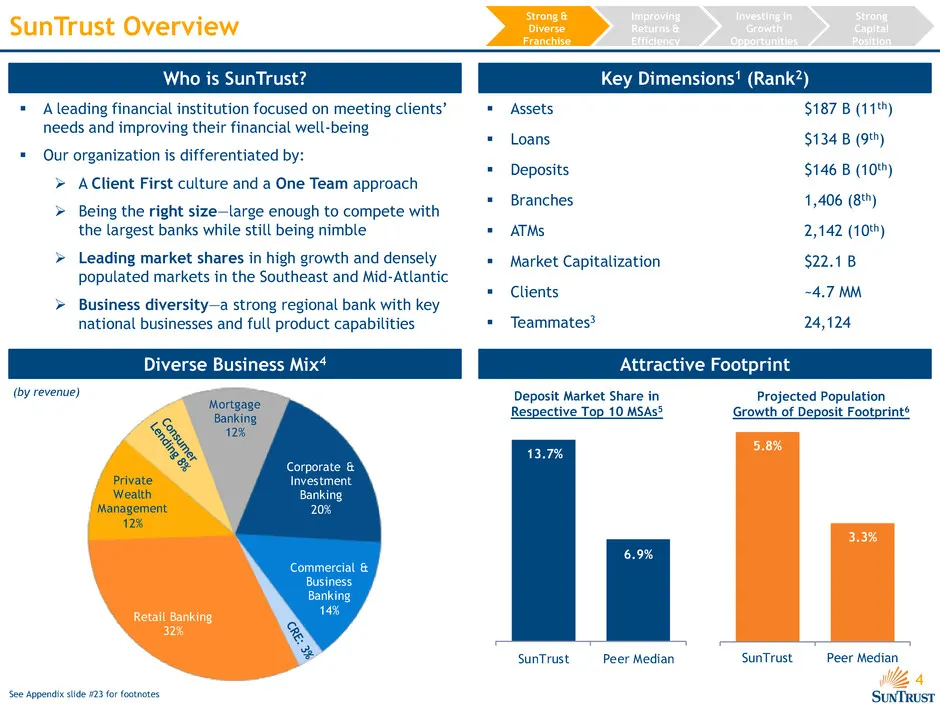
4 Corporate & Investment Banking 20% Commercial & Business Banking 14% Retail Banking 32% Private Wealth Management 12% Mortgage Banking 12% SunTrust Overview A leading financial institution focused on meeting clients’ needs and improving their financial well-being Our organization is differenti
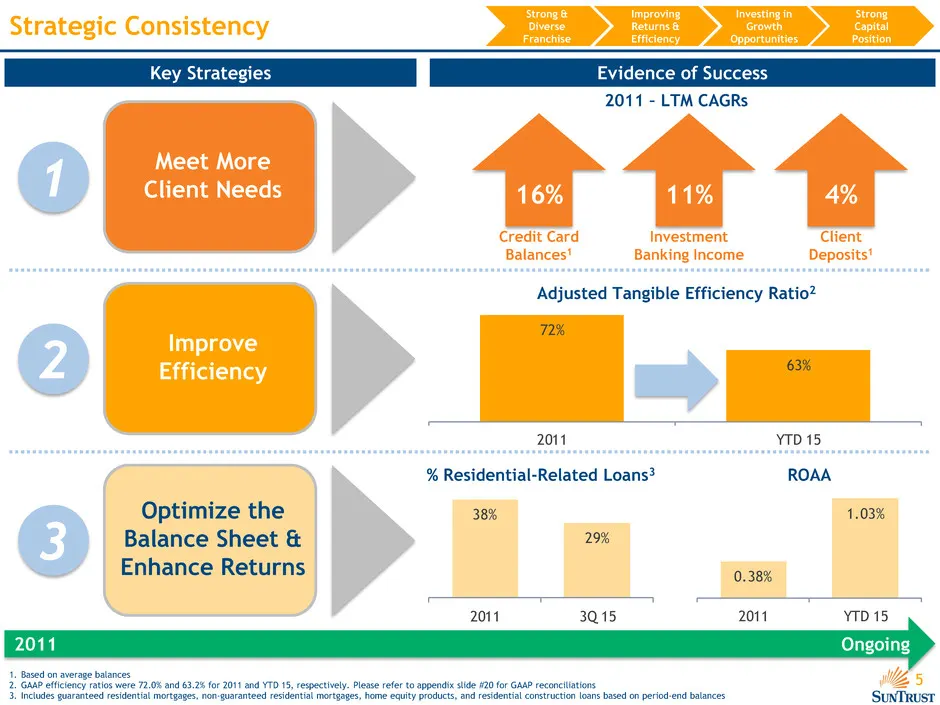
Slide 5: Strategic Consistency
5 Strategic Consistency Key Strategies Evidence of Success 2011 Ongoing Meet More Client Needs 2011 – LTM CAGRs 11% Investment Banking Income 16% Credit Card Balances1 4% Client Deposits1 1 72% 63% 2011 YTD 15 Adjusted Tangible Efficiency Ratio2 Improve Efficiency 2 Optimize the Balance Sheet & Enha
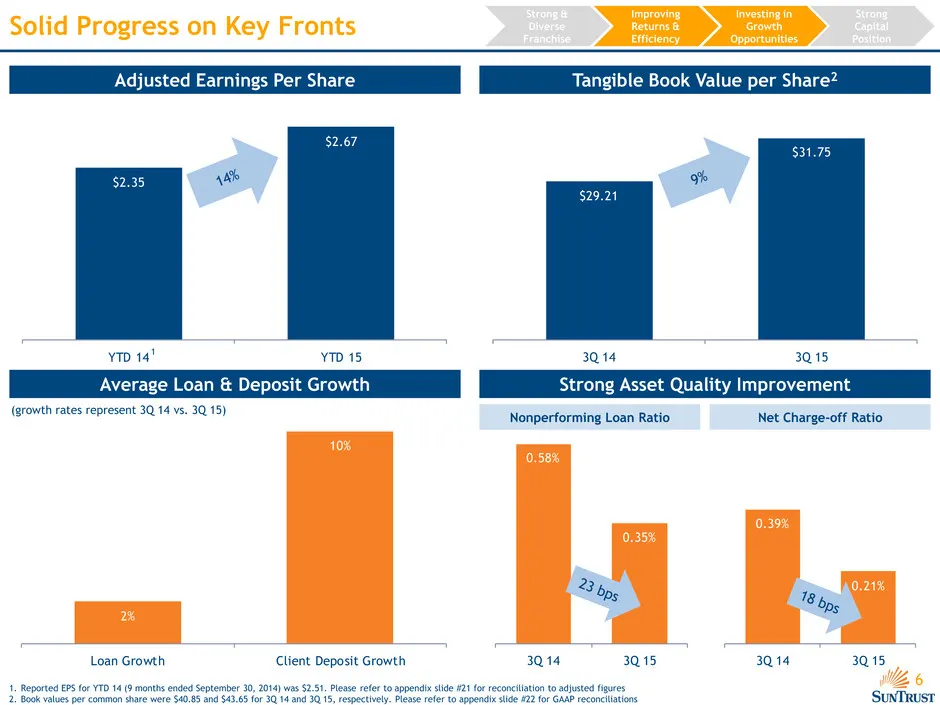
Slide 6: Solid Progress on Key Fronts
6 $2.35 $2.67 YTD 14 YTD 15 $29.21 $31.75 3Q 14 3Q 15 0.58% 0.35% 3Q 14 3Q 15 0.39% 0.21% 4 3Q 15 Solid Progress on Key Fronts Tangible Book Value per Share2 Adjusted Earnings Per Share Net Charge-off Ratio Strong Asset Quality Improvement Nonperforming Loan Ratio Average Loan & Deposit Growth 2% 10
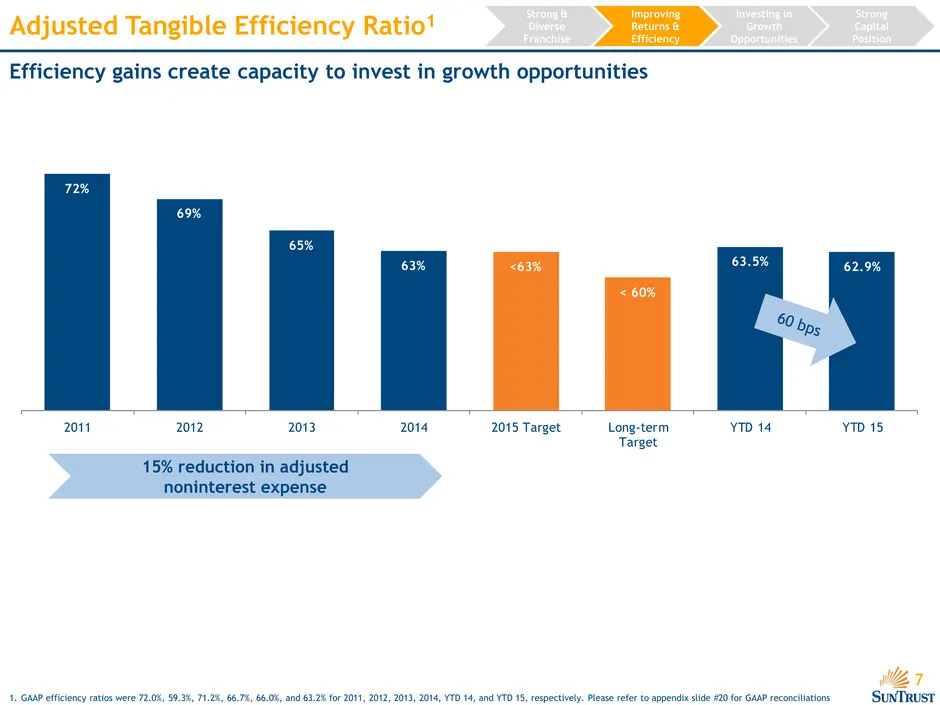
Slide 7: Adjusted Tangible Efficiency Ratio
7 72% 69% 65% 63% <63% < 60% 63.5% 62.9% 2011 2012 2013 2014 2015 Target Long-term Target YTD 14 YTD 15 Adjusted Tangible Efficiency Ratio1 Efficiency gains create capacity to invest in growth opportunities 15% reduction in adjusted noninterest expense Investing in Growth Opportunities Strong & Dive
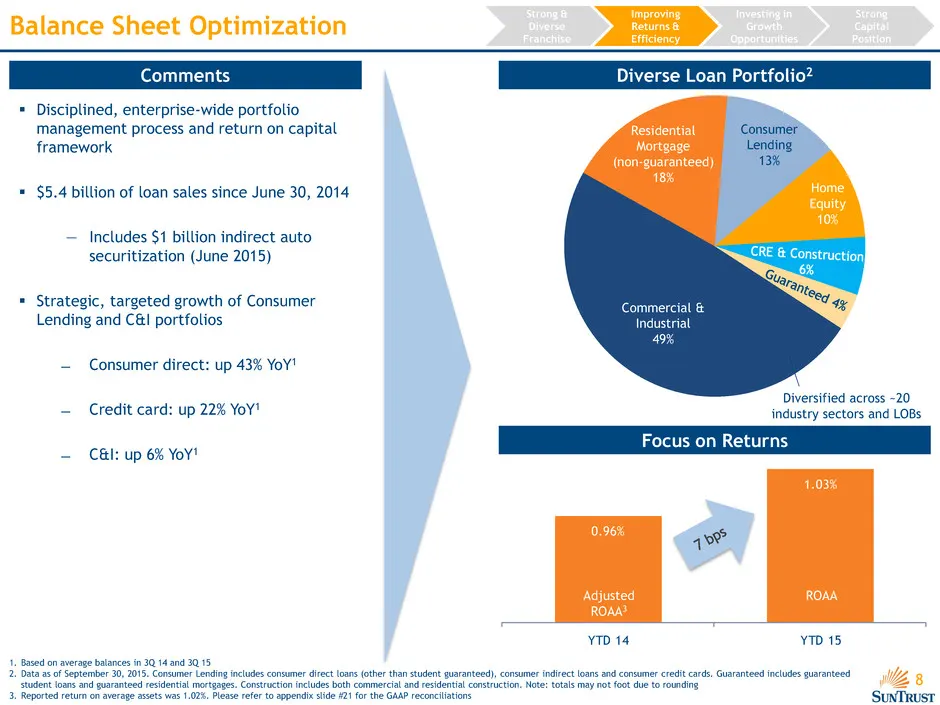
Slide 8: Balance Sheet Optimization
8 Balance Sheet Optimization Diverse Loan Portfolio2 Focus on Returns Comments Disciplined, enterprise-wide portfolio management process and return on capital framework $5.4 billion of loan sales since June 30, 2014 — Includes $1 billion indirect auto securitization (June 2015) Strategic, targ
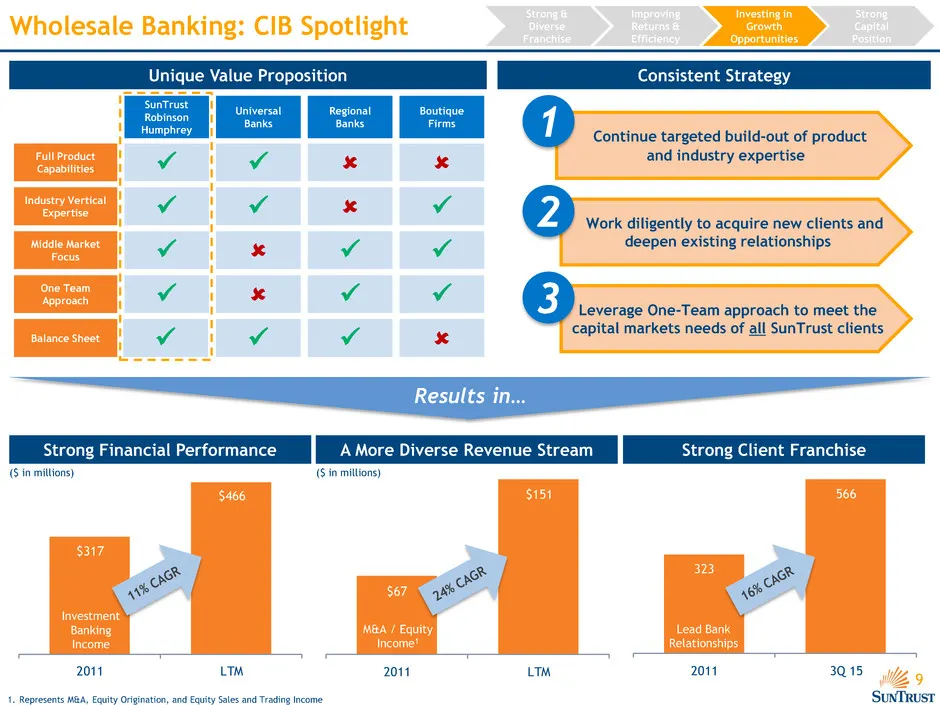
Slide 9: Wholesale Banking: CIB Spotlight
9 323 566 2011 3Q 15 Strong Client Franchise Lead Bank Relationships Wholesale Banking: CIB Spotlight Results in… Consistent Strategy Unique Value Proposition Full Product Capabilities Industry Vertical Expertise Middle Market Focus One Team Approach Balance Sheet SunTrust Robinson Humphre
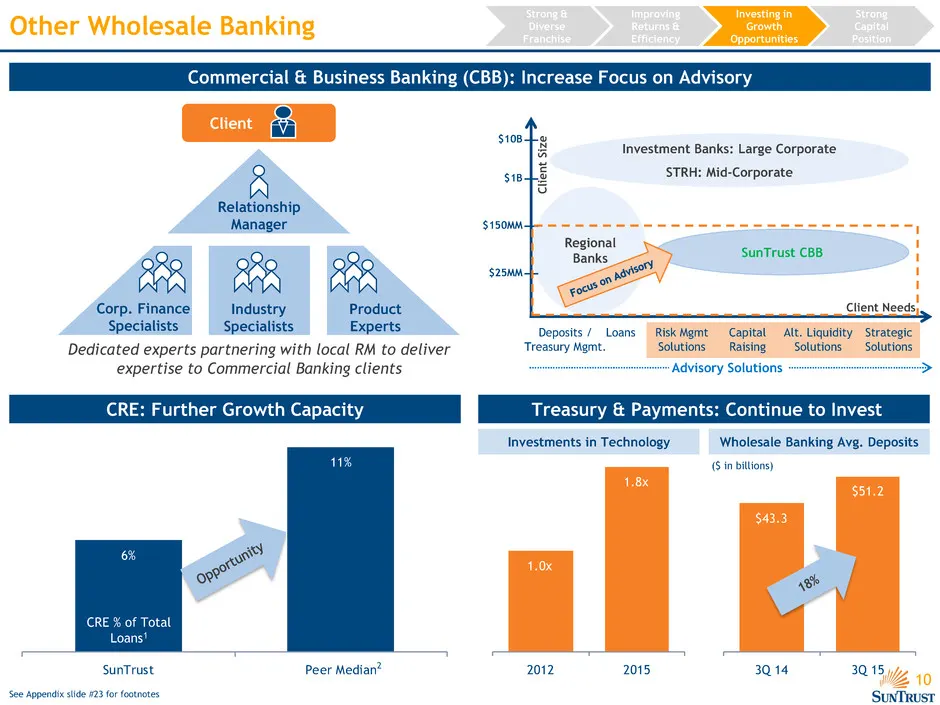
Slide 10: Wholesale Banking: CRE, Treasury & Payments, CBB
10 $43.3 $51.2 3Q 14 3Q 15 6% 11% SunTrust Peer Median Other Wholesale Banking CRE: Further Growth Capacity Treasury & Payments: Continue to Invest Client Corp. Finance Specialists Industry Specialists Product Experts Relationship Manager Commercial & Business Banking (CBB): Increase Focus on Adviso
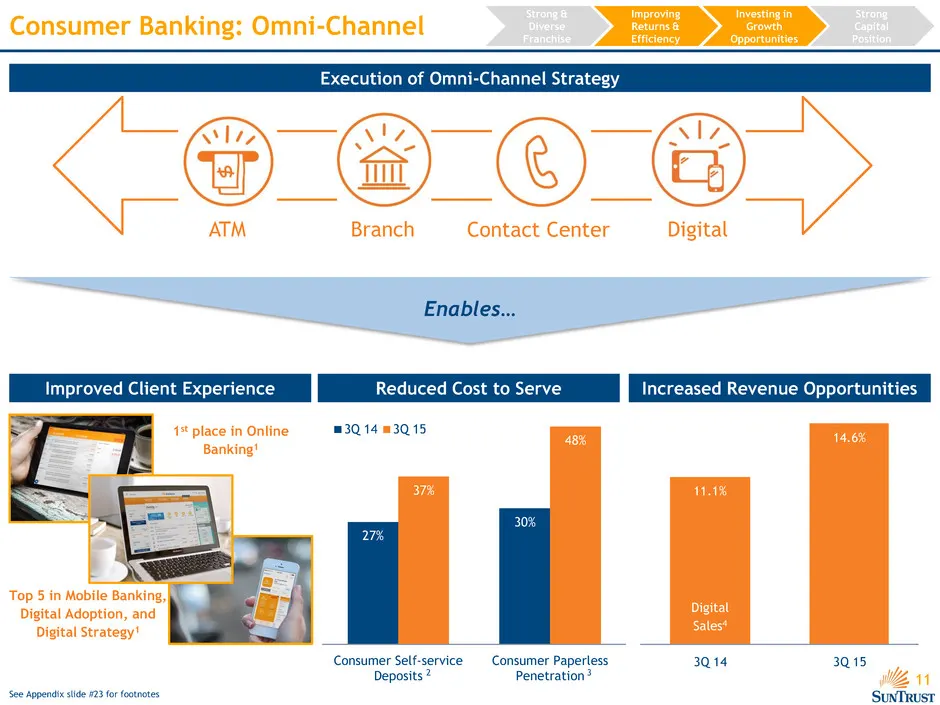
Slide 11: Consumer Banking: Omni-Channel
11 Enables… Consumer Banking: Omni-Channel Execution of Omni-Channel Strategy ATM Digital Contact Center Branch Investing in Growth Opportunities Strong & Diverse Franchise Improving Returns & Efficiency Strong Capital Position See Appendix slide #23 for footnotes Improved Client Experience 1st plac
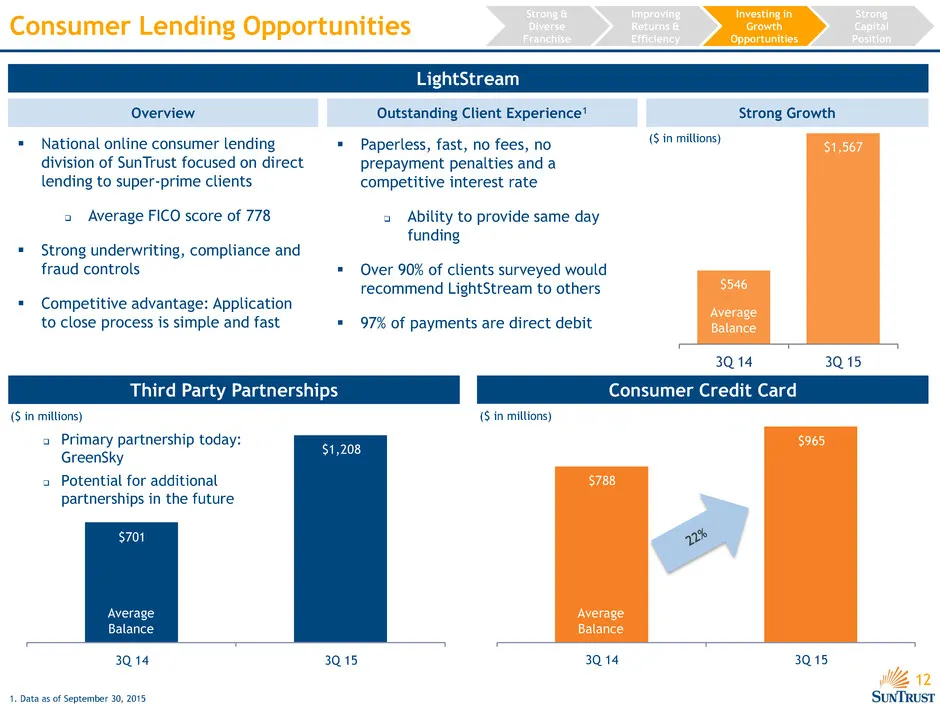
Slide 12: Consumer Lending Opportunities: LightStream
12 $546 $1,567 3Q 14 3Q 15 $701 $1,208 3Q 14 3Q 15 $788 $965 3Q 14 3Q 15 Average Balance Consumer Credit Card ($ in millions) Average Balance Consumer Lending Opportunities 1. Data as of September 30, 2015 LightStream Overview Outstanding Client Experience1 Strong Growth National online consumer l
Slide 13: Mortgage Banking
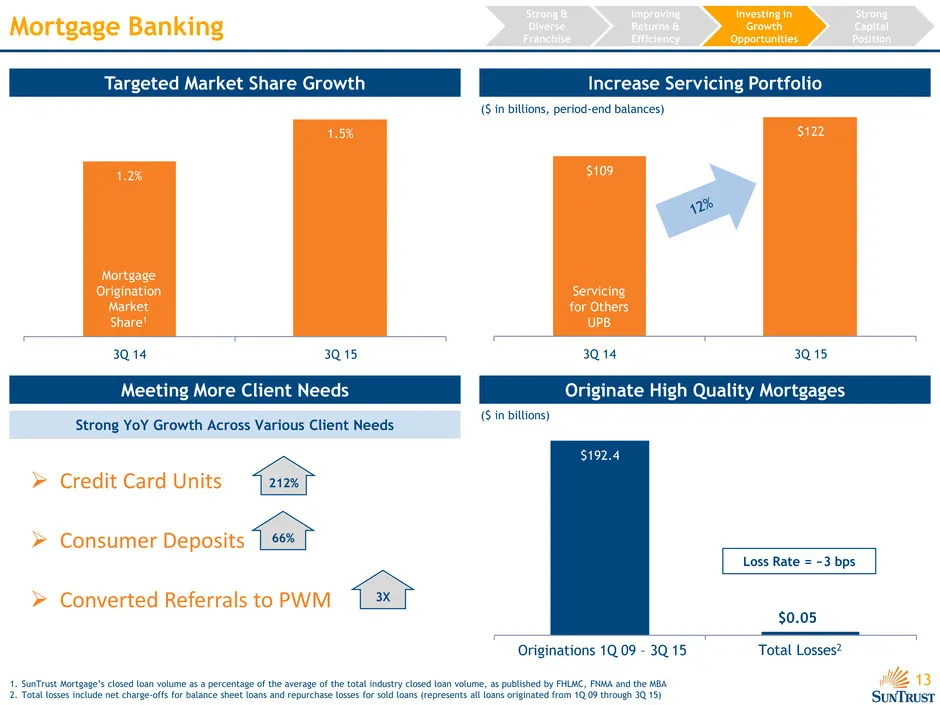
13 1.2% 1.5% 3Q 14 3Q 15 $109 $122 3Q 14 3Q 15 $192.4 Mortgage Banking Servicing for Others UPB ($ in billions, period-end balances) Mortgage Origination Market Share1 ($ in billions) Originations 1Q 09 – 3Q 15 Total Losses2 $0.05 Loss Rate = ~3 bps Credit Card Units Consumer Deposits Converte
Slide 14: Technology Investments
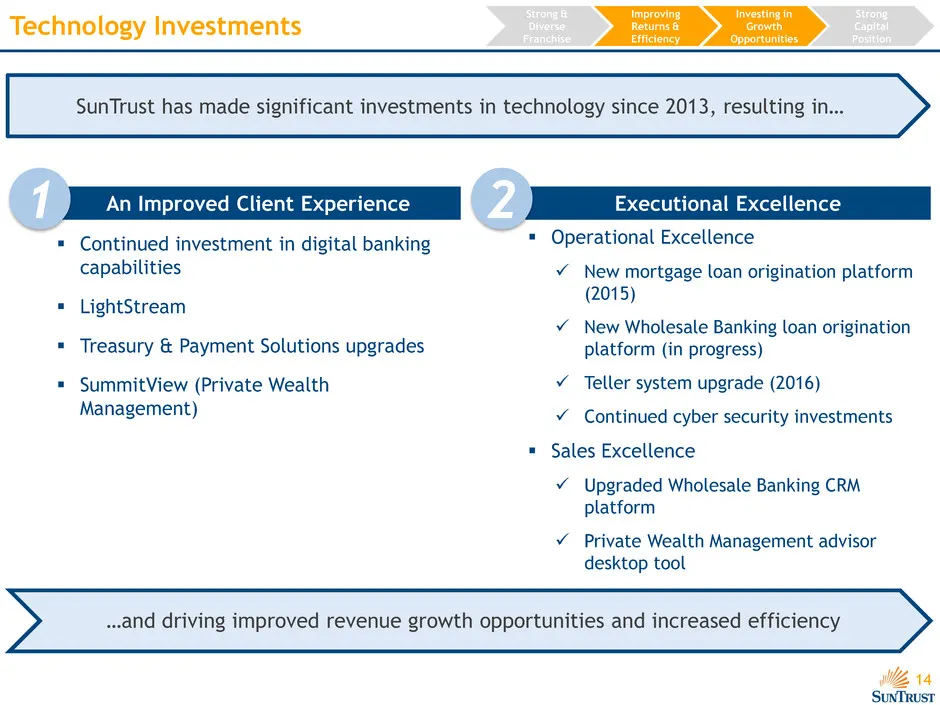
14 Technology Investments Investing in Growth Opportunities Strong & Diverse Franchise Improving Returns & Efficiency Strong Capital Position Continued investment in digital banking capabilities LightStream Treasury & Payment Solutions upgrades SummitView (Private Wealth Management) An Impro
Slide 15: Delivering the Bank
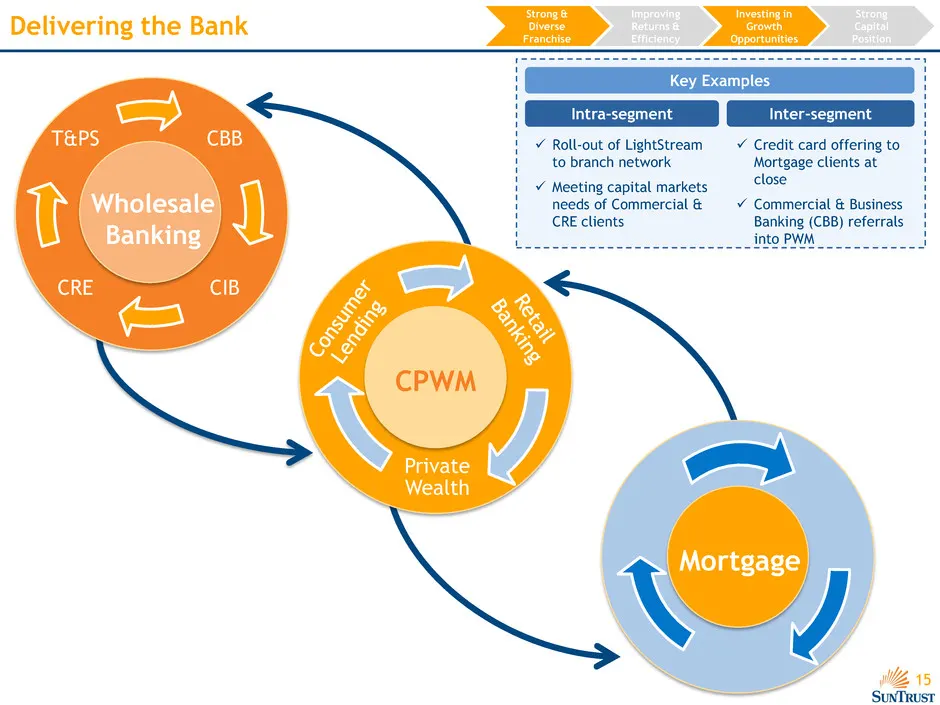
15 Delivering the Bank CBB CIB CRE T&PS Wholesale Banking 8u Private Wealth CPWM 8u Mortgage Intra-segment Roll-out of LightStream to branch network Meeting capital markets needs of Commercial & CRE clients Credit card offering to Mortgage clients at close Commercial & Business Banking (CBB)
Slide 16: One-Team Case Study
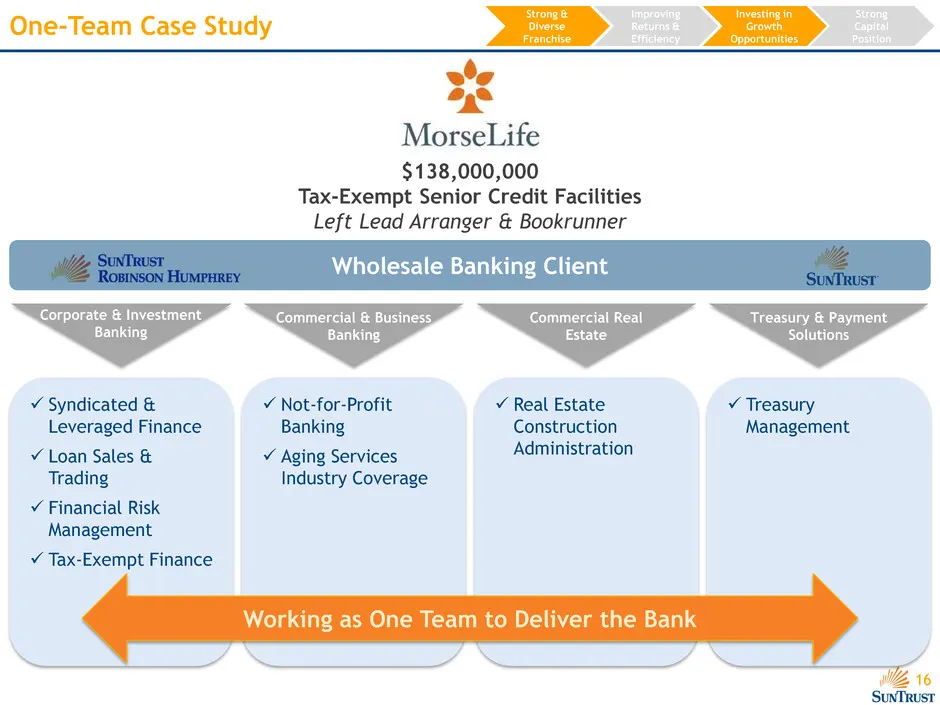
16 One-Team Case Study Syndicated & Leveraged Finance Loan Sales & Trading Financial Risk Management Tax-Exempt Finance Not-for-Profit Banking Aging Services Industry Coverage Real Estate Construction Administration Treasury Management Working as One Team to Deliver the Bank Wholesal
Slide 17: Strong Capital Position Supports Growth
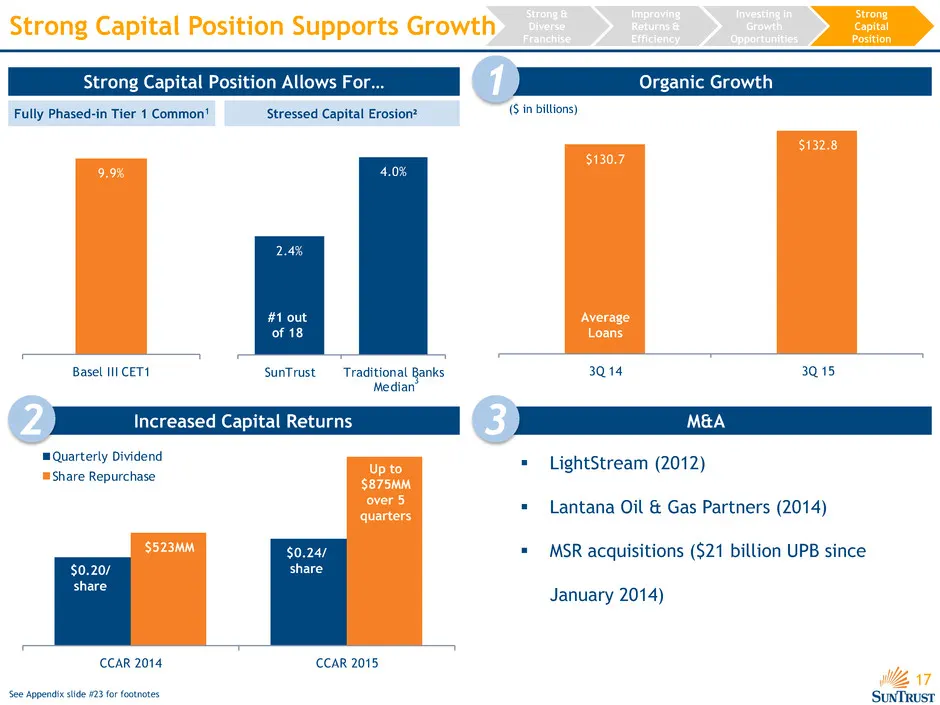
17 CCAR 2014 CCAR 2015 Quarterly Dividend Share Repurchase Strong Capital Position Supports Growth LightStream (2012) Lantana Oil & Gas Partners (2014) MSR acquisitions ($21 billion UPB since January 2014) Increased Capital Returns M&A $0.20/ share $523MM $0.24/ share Up to $875MM over 5 quart
Slide 18: Investment Thesis: Why invest in SunTrust?
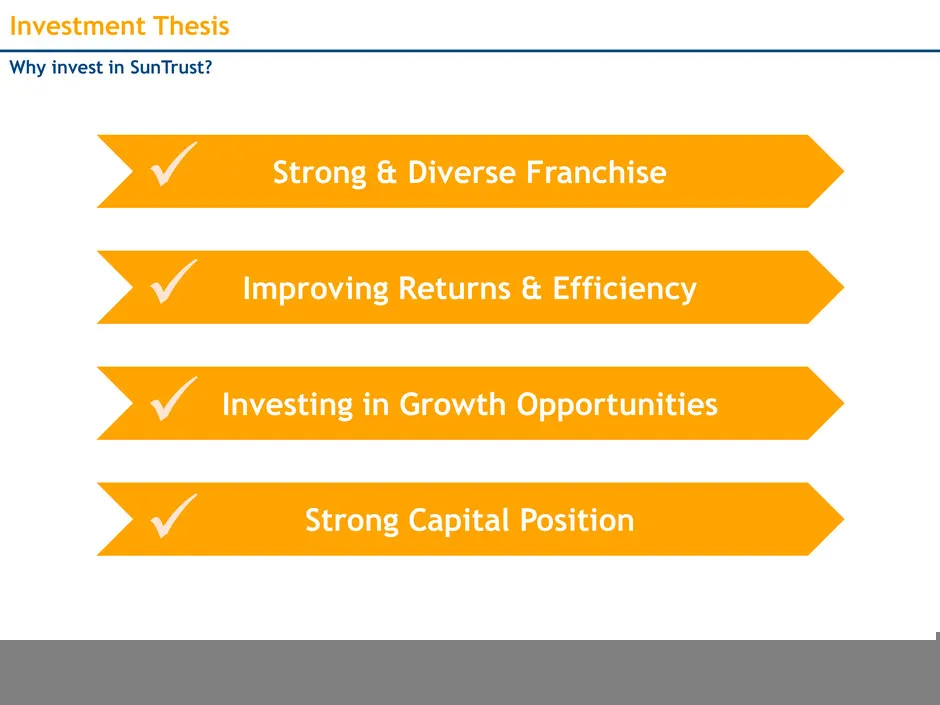
18 Investment Thesis Why invest in SunTrust? Investing in Growth Opportunities Strong & Diverse Franchise Improving Returns & Efficiency Strong Capital Position

Slide 19: Appendix
Appendix
Slide 20: Reconciliation of Efficiency Ratios
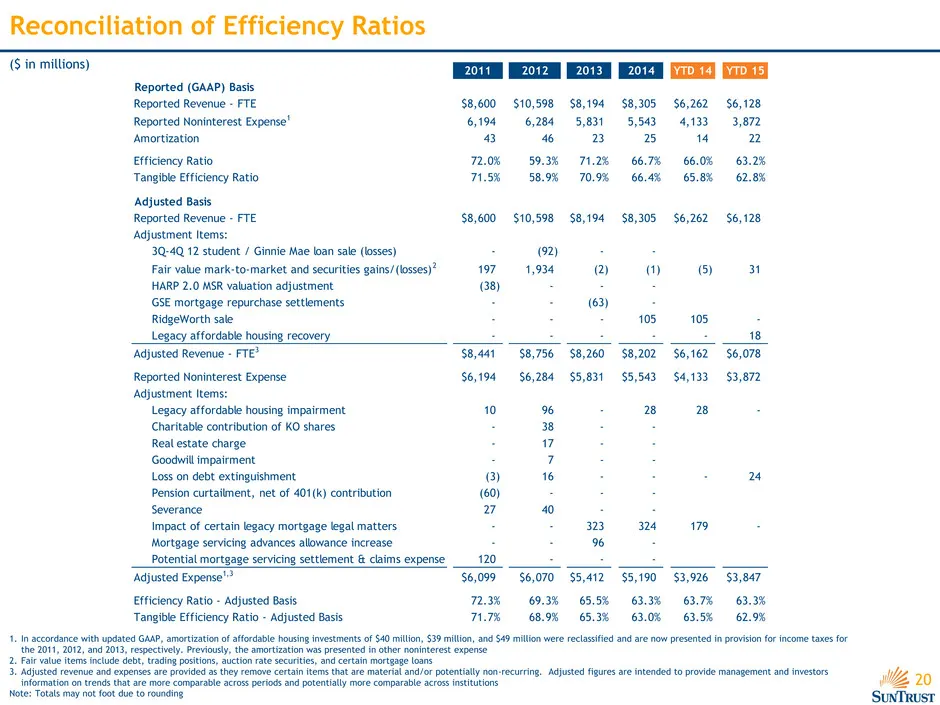
20 Reconciliation of Efficiency Ratios ($ in millions) 1. In accordance with updated GAAP, amortization of affordable housing investments of $40 million, $39 million, and $49 million were reclassified and are now presented in provision for income taxes for the 2011, 2012, and 2013, respectively. Pre
Slide 21: Income Statement
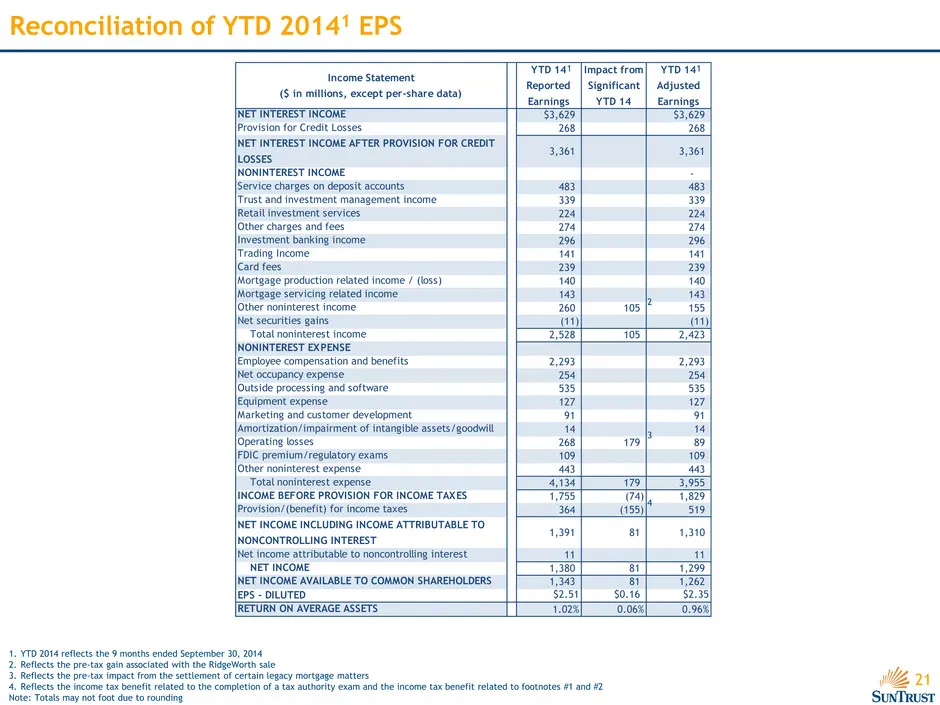
21 Income Statement ($ in millions, except per-share data) YTD 14 Reported Earnings Impact from Significant YTD 14 YTD 14 Adjusted Earnings NET INTEREST INCOME $3,629 $3,629 Provision for Credit Losses 268 268 NET INTEREST INCOME AFTER PROVISION FOR CREDIT LOSSES 3,361 3,361 NONINTEREST INCOME - Ser
Slide 22: Reconciliation of Tangible Book Value Per Share
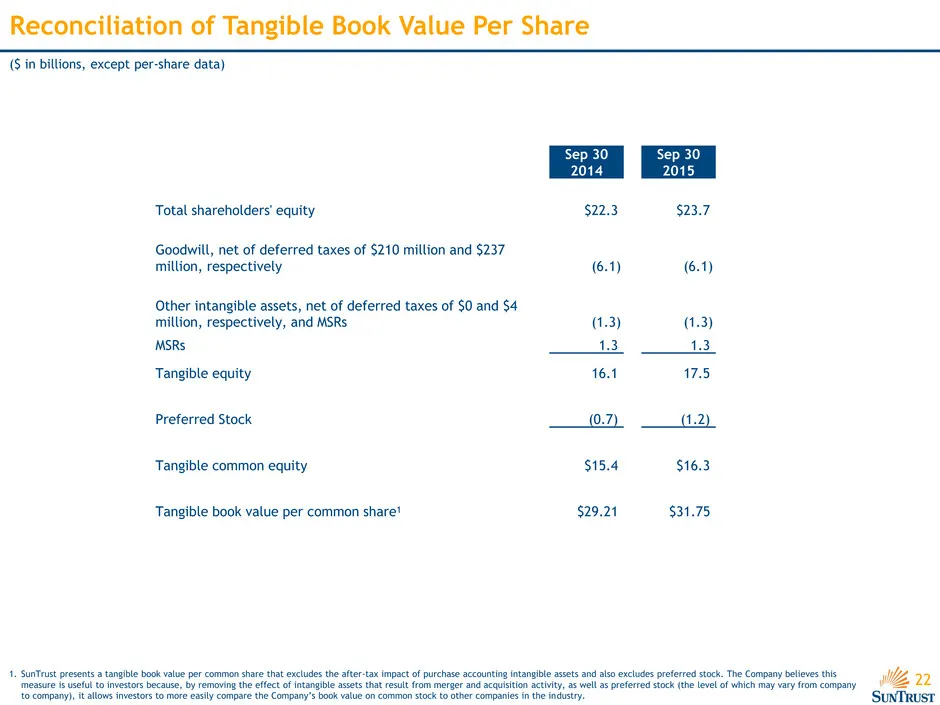
22 Reconciliation of Tangible Book Value Per Share ($ in billions, except per-share data) 1. SunTrust presents a tangible book value per common share that excludes the after-tax impact of purchase accounting intangible assets and also excludes preferred stock. The Company believes this measure is us
Slide 23: Footnotes
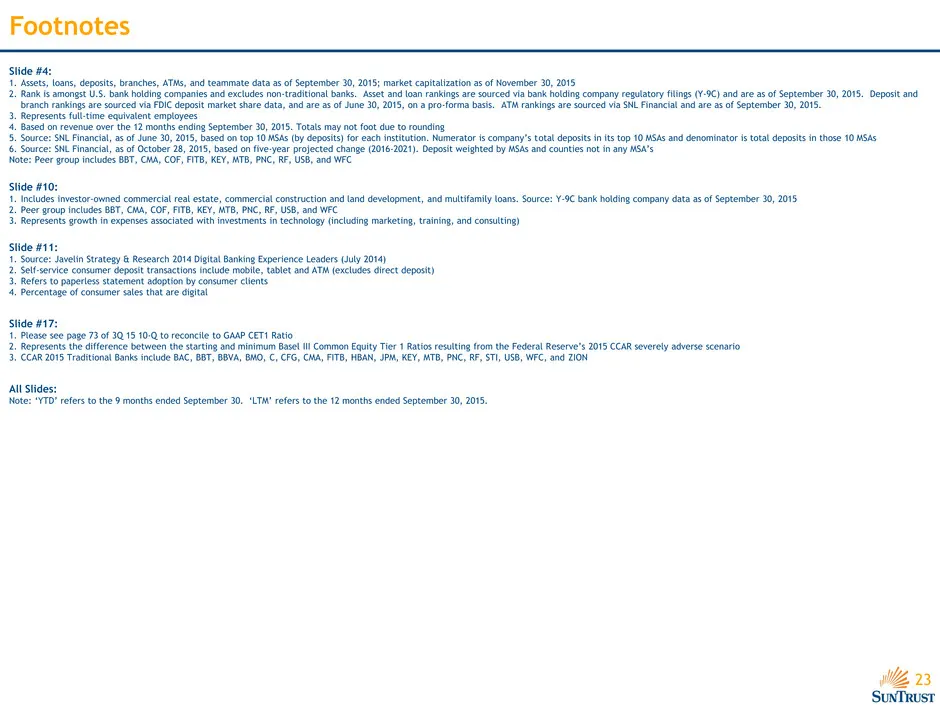
23 Footnotes Slide #4: 1. Assets, loans, deposits, branches, ATMs, and teammate data as of September 30, 2015; market capitalization as of November 30, 2015 2. Rank is amongst U.S. bank holding companies and excludes non-traditional banks. Asset and loan rankings are sourced via bank holding company
Source: SEC EDGAR · 8-K filed Dec 8, 2015
More decks from SunTrust Banks Inc
 Q3 2019 Earnings Presentation21 slides · Oct 17, 2019
 Q2 2019 Earnings Presentation22 slides · Jul 18, 2019
 Q1 2019 Earnings Presentation22 slides · Apr 18, 2019
 Merger or Acquisition (February 2019)38 slides · Feb 7, 2019
 Q4 2018 Earnings Presentation23 slides · Jan 18, 2019
 2018 Goldman Sachs US Financial Services Conference30 slides · Dec 4, 2018