Bryn Mawr Bank — Investor Presentation (February 2018)
14 slides from Bryn Mawr Bank's investor presentation, Feb 7, 2018
Slide 1: Bryn Mawr Bank Corporation
BMBC BRYN MAWR BANK CORPORATION February 2018 NASDAQ: BMTC
Slide 2: Safe Harbor
Safe Harbor This presentation contains statements which, to the extent that they are not recitations of historical fact may constitute forward- looking statements for purposes of the Securities Act of 1933, as amended, and the Securities Exchange Act of 1934, as amended. Please see the section title
Slide 3: Bryn Mawr Trust - Overview
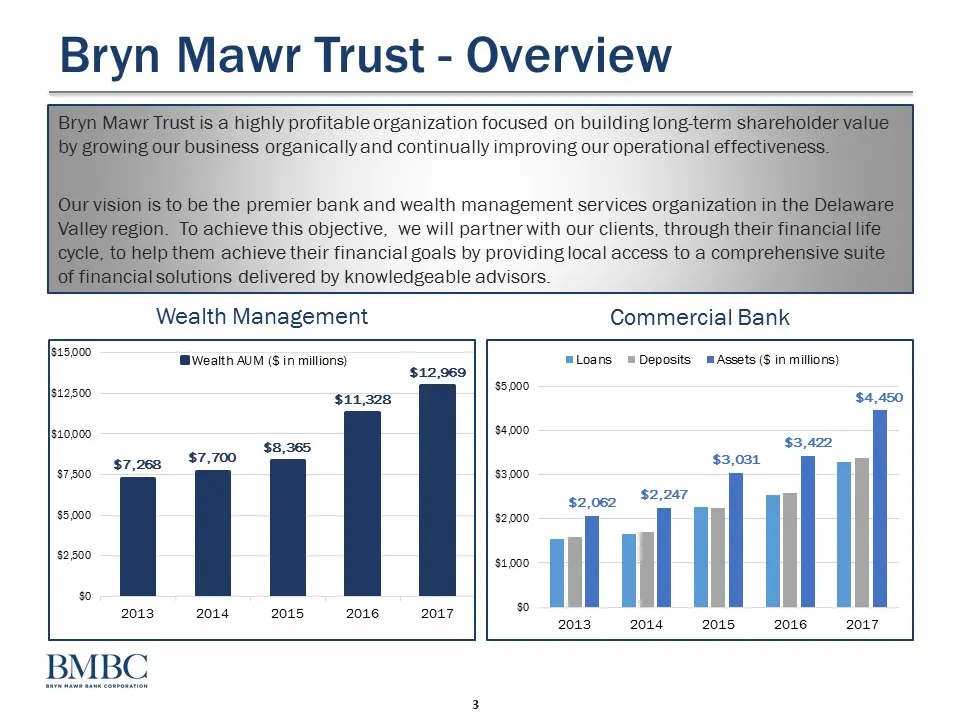
Bryn Mawr Trust - Overview 2 highly profitable organization focused on building long-term; organically and continually improving our operational effe the premier bank and wealth management services organiza’ hieve this objective, we will partner with our clients, through achieve their financial goal
Slide 4: Market Overview
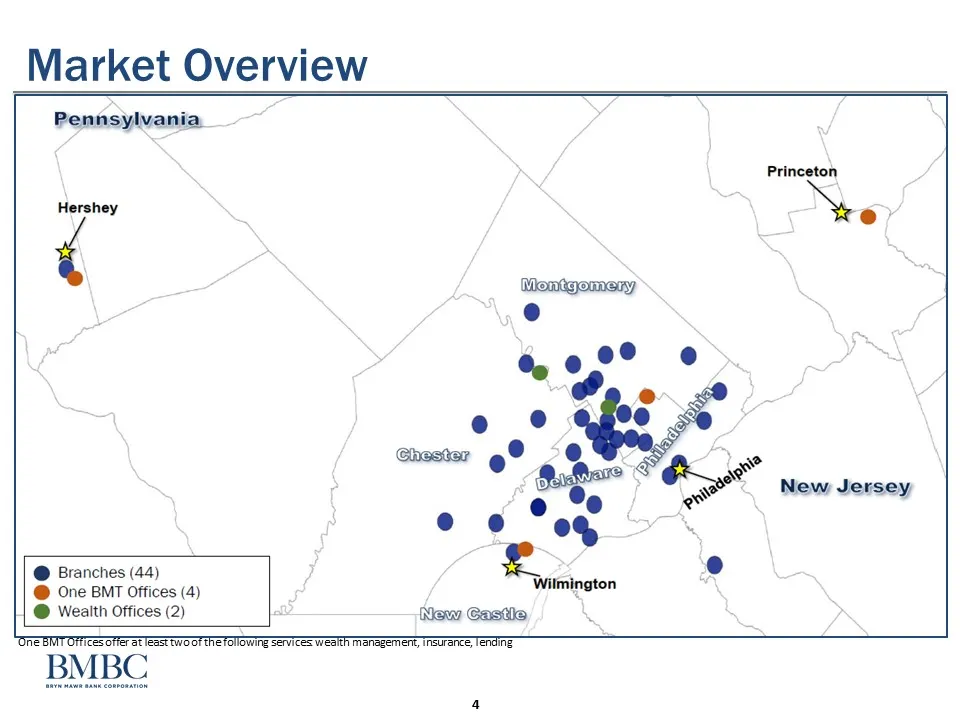
Market Overview Pennsylvania_ Princeton Hershey ~ Momtgomeny J & areal New Jersey @ Branches (44) x @ One BMT Offices (4) Wilmington @ Wealth Offices (2) K Now Gastie ‘One BMT OMTCES OTe at Tess To OF Te ToTOWing SENICES WESTN MAnEgEMeNE, MEUTaNCE, TEMES BMBC
Slide 5: Quarter 2017 Performance
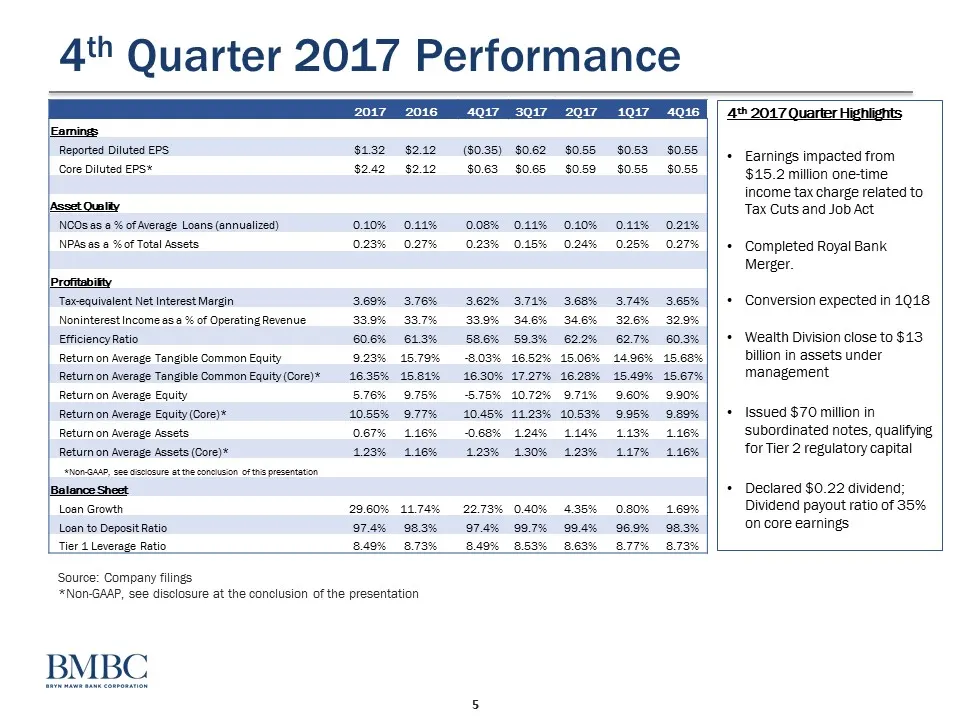
4 Quarter 2017 Performance 201720164017 3037_2017_1017_ 4016 BP ubraeent an ney Eamings Reported Diluted EPS $132 $212 (80.35) $062 $055 $083 $055 ||. Earnings impacted from Core Diluted EPS* $242 $212 $063 $065 $059 $055 $0.55 $15.2 million one-time income tax charge related to Asset Ounfiy Tax Cut
Slide 6: Wealth Management Results
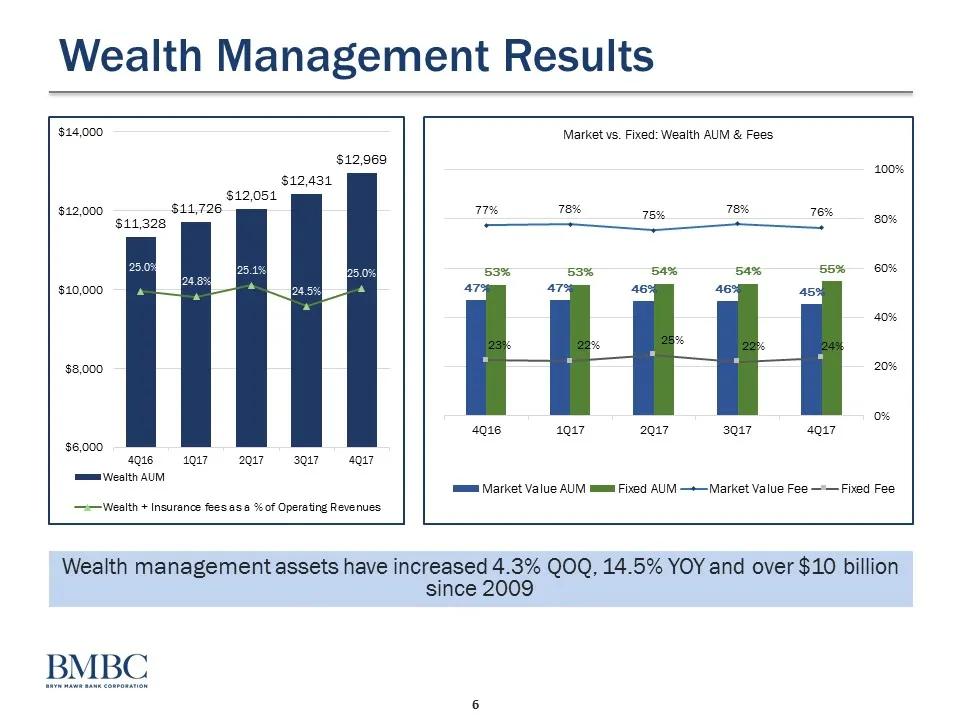
Wealth Management Results $14,000 $12,969 $12,431, $12,051 $12,000 $11,726 $11,328 $10,000 $8,000 $6,000 age 1017207 3g agi7 mmm Wealth AUM Wealth + Insurance feeses.e %of Operating Revenues Market vs. Fixed: Wealth AUM & Fees 17% 78% = 78% 76% 53% 53% 54% 54% 55% 47: ar 46: 46: 45: pe agie 1017 204
Slide 7: Valuation
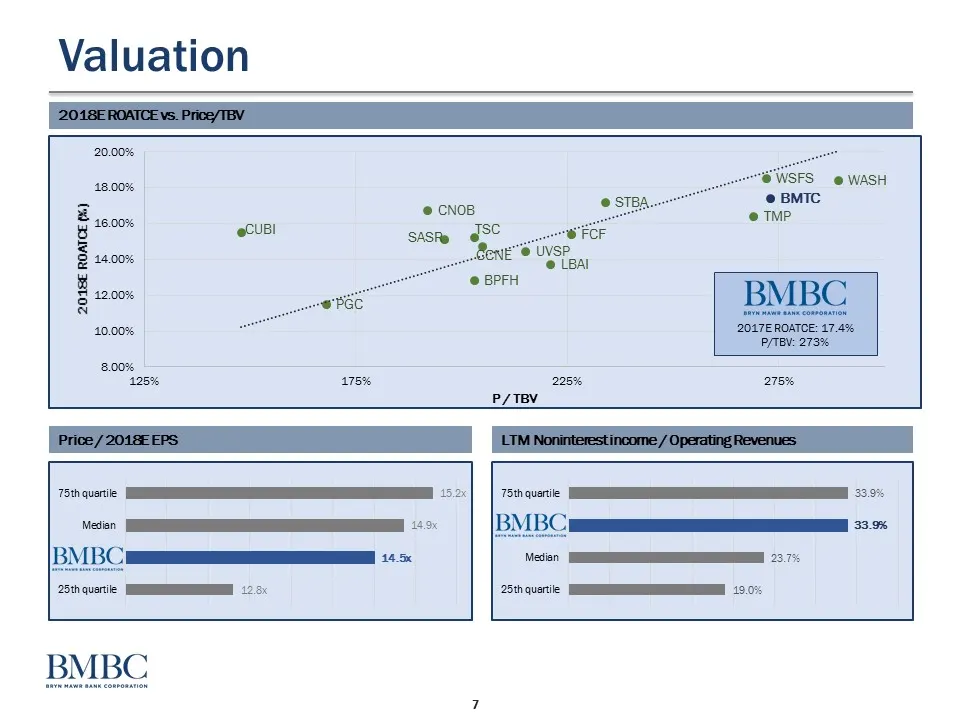
Valuation e 5 : ecuBl 2018€ ROATCE (%) & 12.00% 10.00% ‘2047 ROATCE: 47.4% P/TBV: 273% 8.00% 125% 175% 225% 278% Shqueri TT 190% BMBC
Slide 8: Strategic Objectives
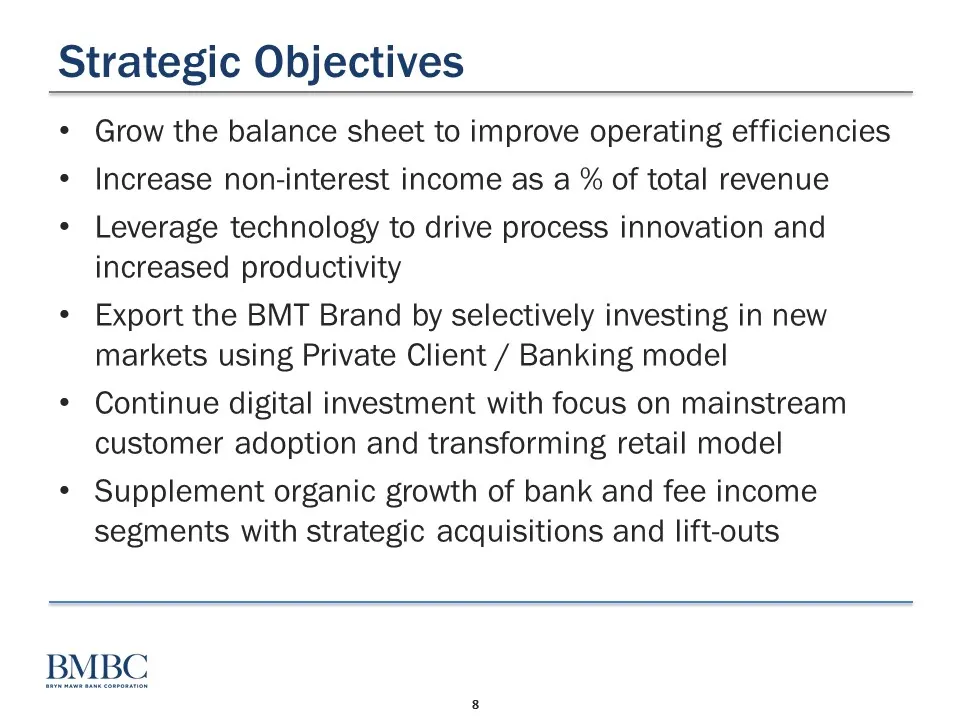
Strategic Objectives * Grow the balance sheet to improve operating efficiencies * Increase non-interest income as a % of total revenue * Leverage technology to drive process innovation and increased productivity ¢ Export the BMT Brand by selectively investing in new markets using Private Client / Ba
Slide 9: Relationship Based Sales Approach
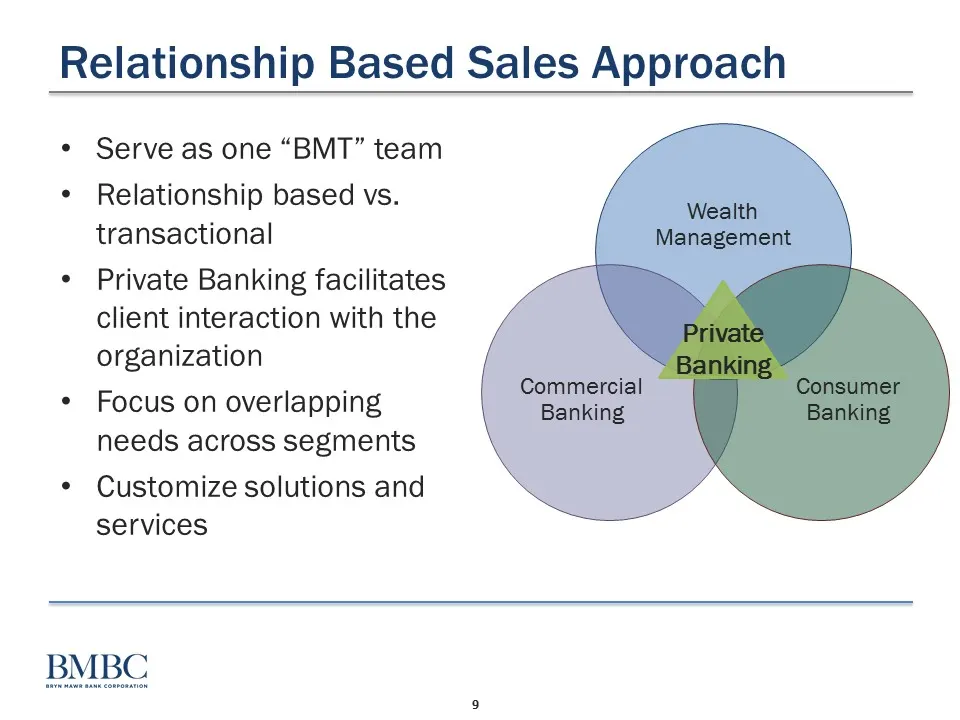
Relationship Based Sales Approach * Serve as one “BMT” team * Relationship based vs. transactional * Private Banking facilitates client interaction with the organization * Focus on overlapping needs across segments * Customize solutions and services
Slide 10: Deposit Focus
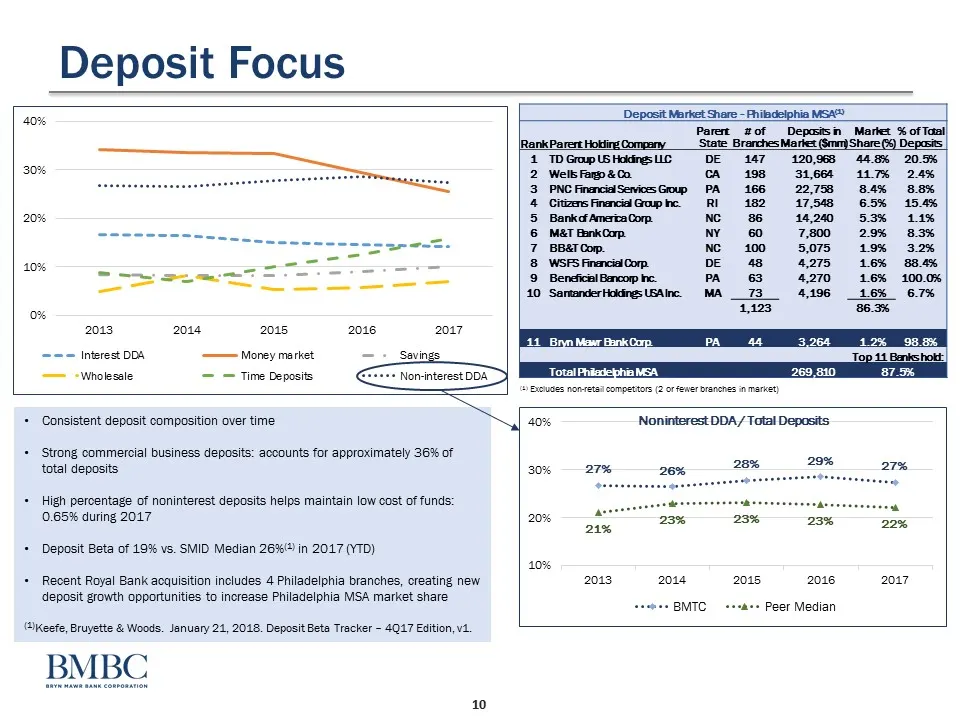
Deposit Focus = ae So er eer ee ee (eae a ees es 30% 2 Wells Fargo & Co. CA 198 31,664 117% 24% (Se Ae Hee ieee Ge me Ge Be 7 [=a @ 5 BS Ss fe 3 eS eo 38 2 e ae nS ee eS ‘a ie fF BBS 9 soccutemts PA Be & Se jee. Be eS i a= mi ipniti masa seu = ote | (Cem Sa Sect gence + Consistent deposit compositio
Slide 11: Forward Looking Statements and Safe Harbor
Forward Looking Statements and Safe Harbor This presentation contains statements which, to the extent that they are not recitations of historical fact may constitute forward-looking statements for purposes of the Securities Act of 1933, as amended, and the Securities Exchange Act of 1934, as amended
Slide 12: Peer Companies
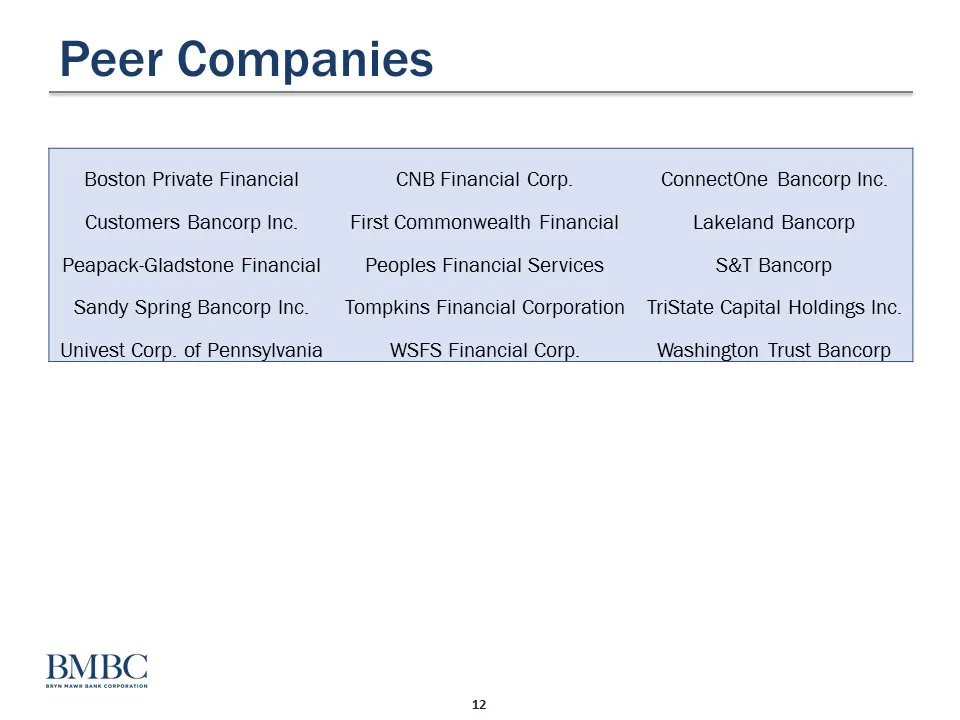
Peer Companies Boston Private Financial CNB Financial Corp. ConnectOne Bancorp Inc. Customers Bancorp Inc. First Commonwealth Financial Lakeland Bancorp Peapack-Gladstone Financial Peoples Financial Services S&T Bancorp Sandy Spring Bancorp Inc. Tompkins Financial Corporation TriState Capital Holdin
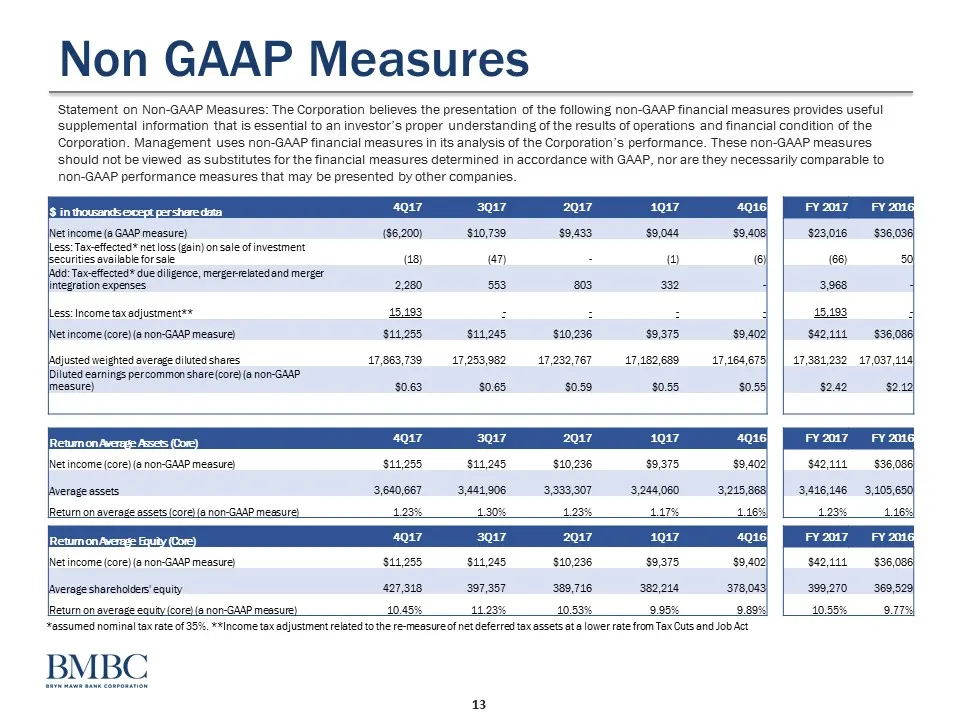
Slide 13: Non GAAP Measures
Non GAAP Measures ‘Statement on Non-GAAP Measures: The Corporation believes the presentation of the following non-GAAP financial measures provides useful ‘supplemental information that is essential to an investor's proper understanding of the results of operations and financial condition of the Corp
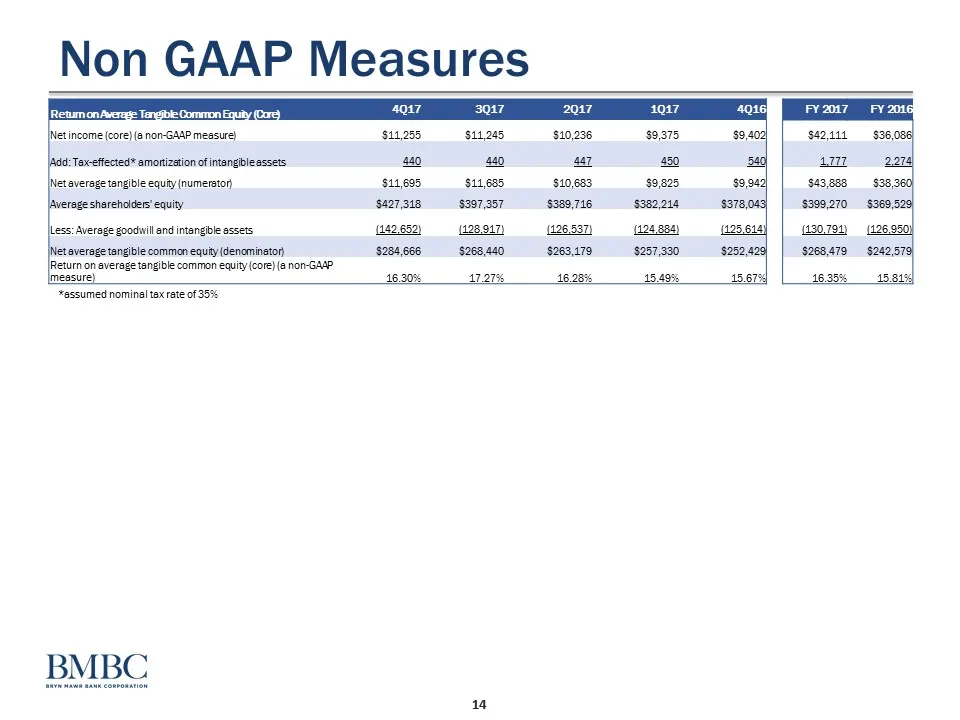
Slide 14: Non GAAP Measures
Non GAAP Measures Net income (core) 8 non-GAAP messure) $11,255 $11,285 $10,236 $9375 |Add: Taxceftected* amortization ofintangibleassets 440 440 487 450 NNetaverage tangible equty (numerator) $11,695 $11,685 $10,683, $9,825 erage shareholders’ equity $427,318 $397,357 $389,716 $382,218 Less: Averag
Source: SEC EDGAR · 8-K filed Feb 7, 2018
More decks from Bryn Mawr Bank Corporation
 Merger or Acquisition (March 2021)20 slides · Mar 10, 2021
 Q4 2020 Earnings Presentation16 slides · Jan 22, 2021
 Q3 2020 Earnings Presentation14 slides · Oct 23, 2020
 Investor Presentation (September 2020)17 slides · Sep 21, 2020
 Q2 2020 Earnings Presentation14 slides · Jul 21, 2020
 Q1 2020 Earnings Presentation13 slides · Apr 21, 2020