CH Energy — Q1 2012 Earnings Presentation
36 slides from CH Energy's earnings presentation, Apr 26, 2012
Slide 1: Schedule 14A Proxy Statement - CH Energy Group, Inc.
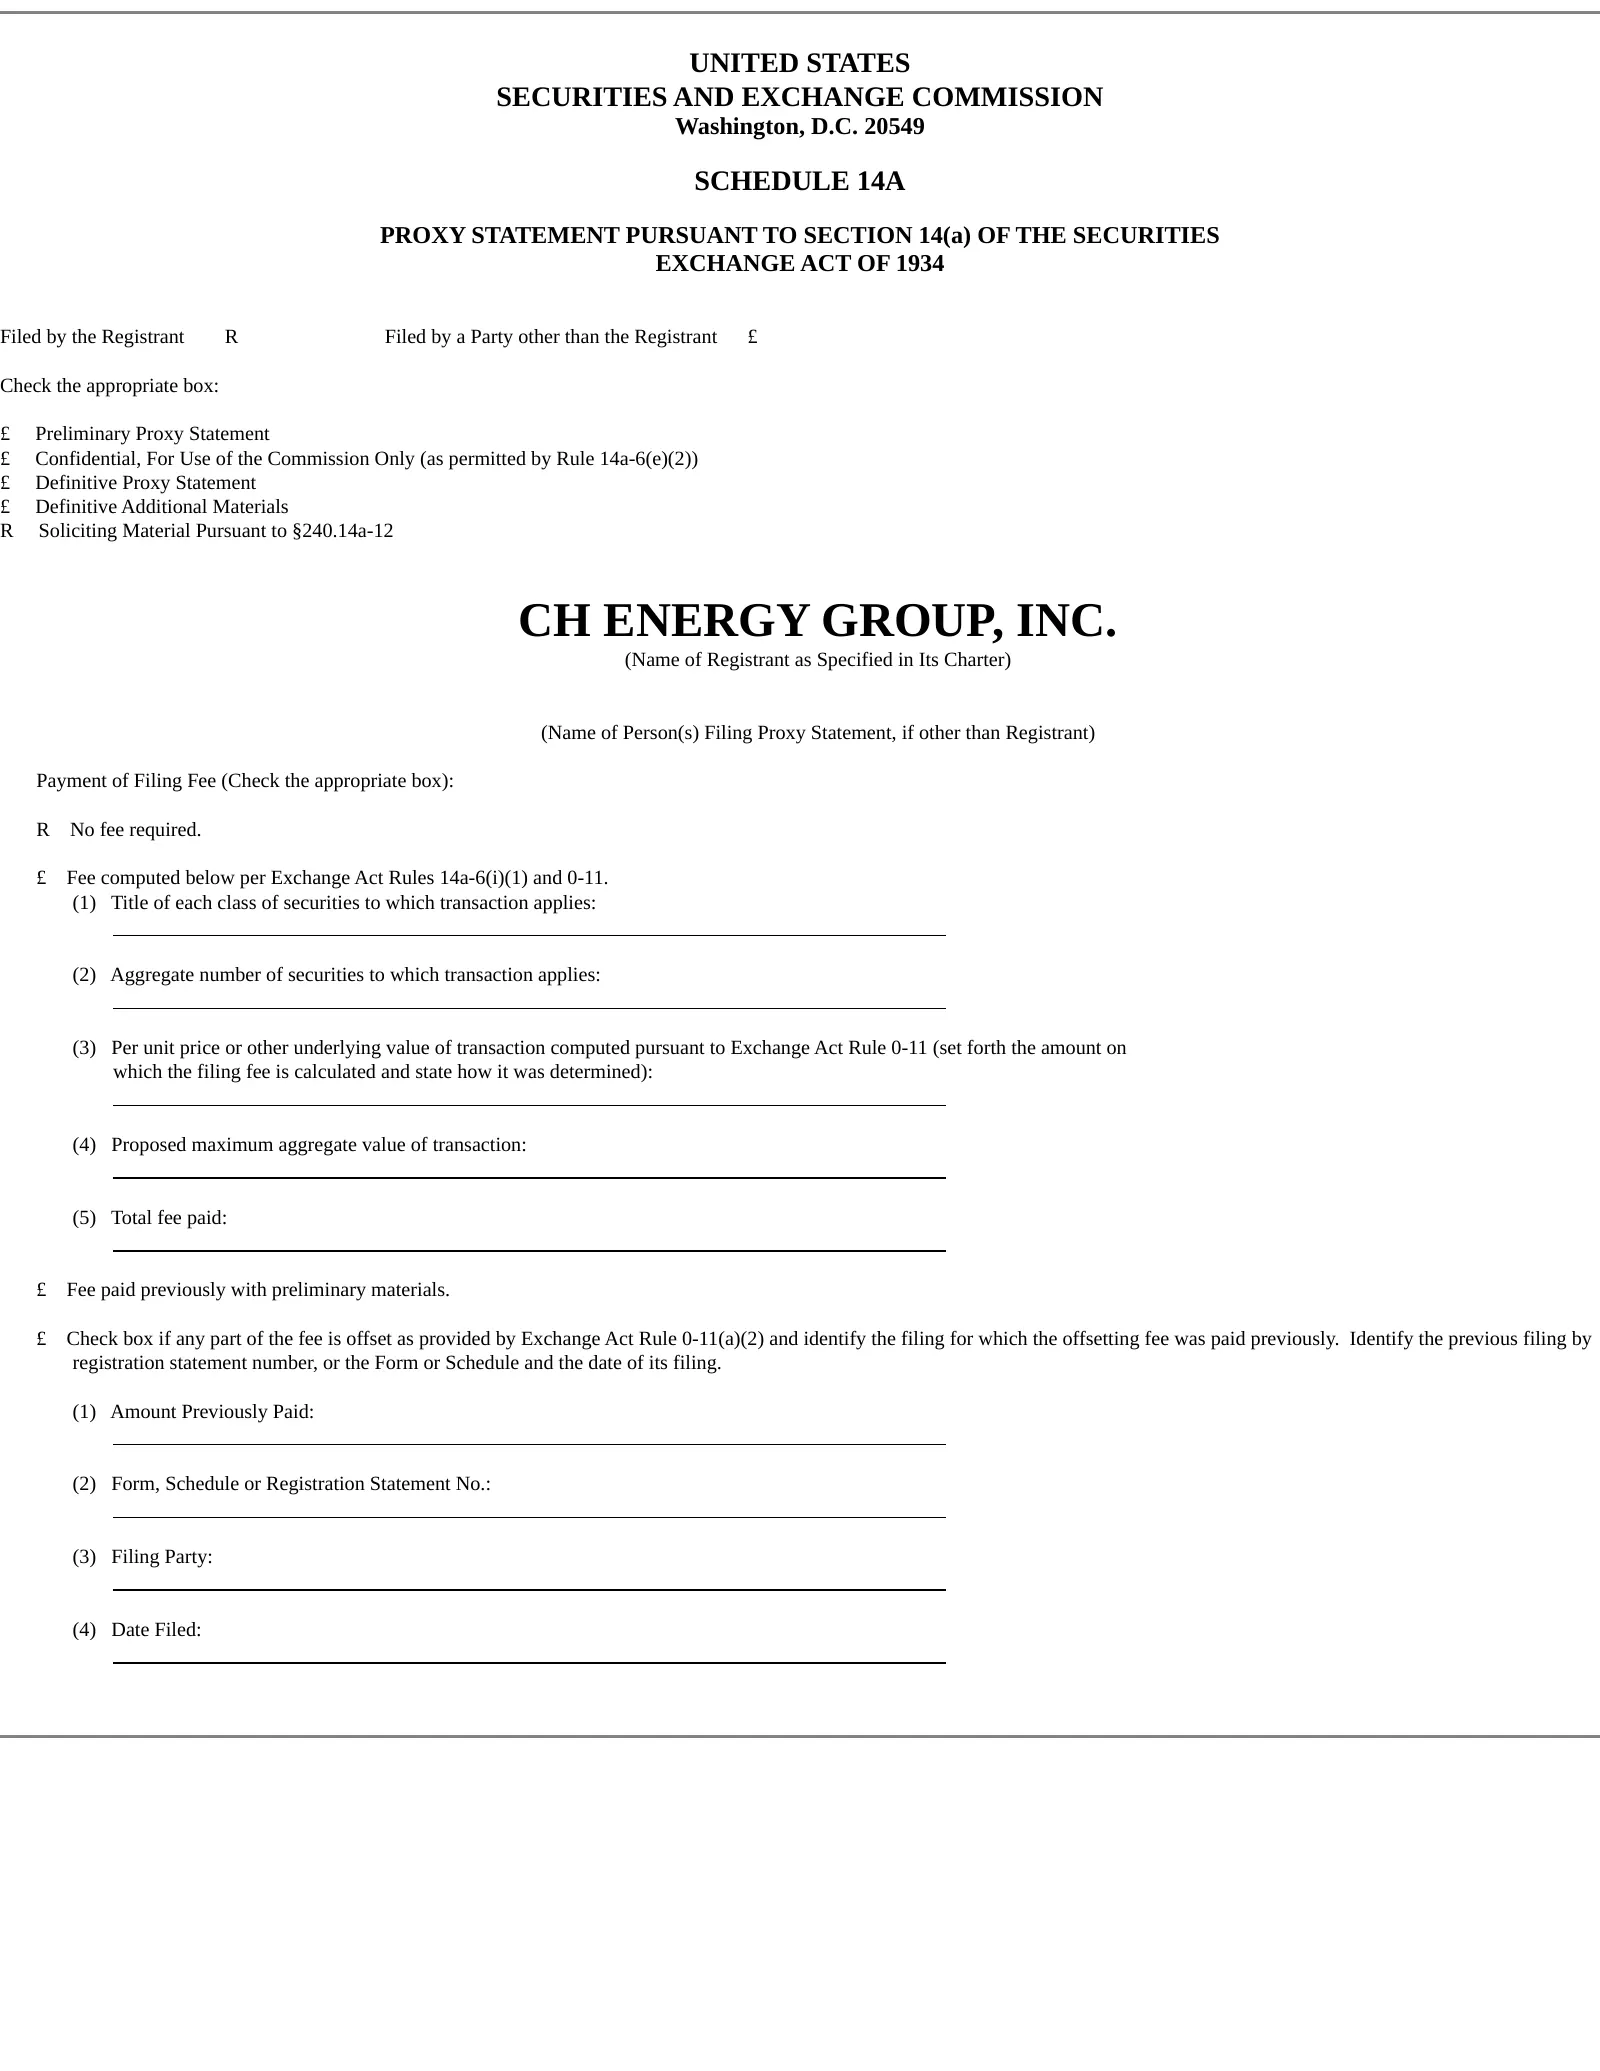
UNITED STATES SECURITIES AND EXCHANGE COMMISSION Washington, D.C. 20549 SCHEDULE 14A PROXY STATEMENT PURSUANT TO SECTION 14(a) OF THE SECURITIES EXCHANGE ACT OF 1934 Filed by the Registrant R Filed by a Party other than the Registrant £ Check the appropriate box: £ Preliminary Proxy Statement £ Conf
Slide 2: CH Energy Group Reports First-Quarter Earnings
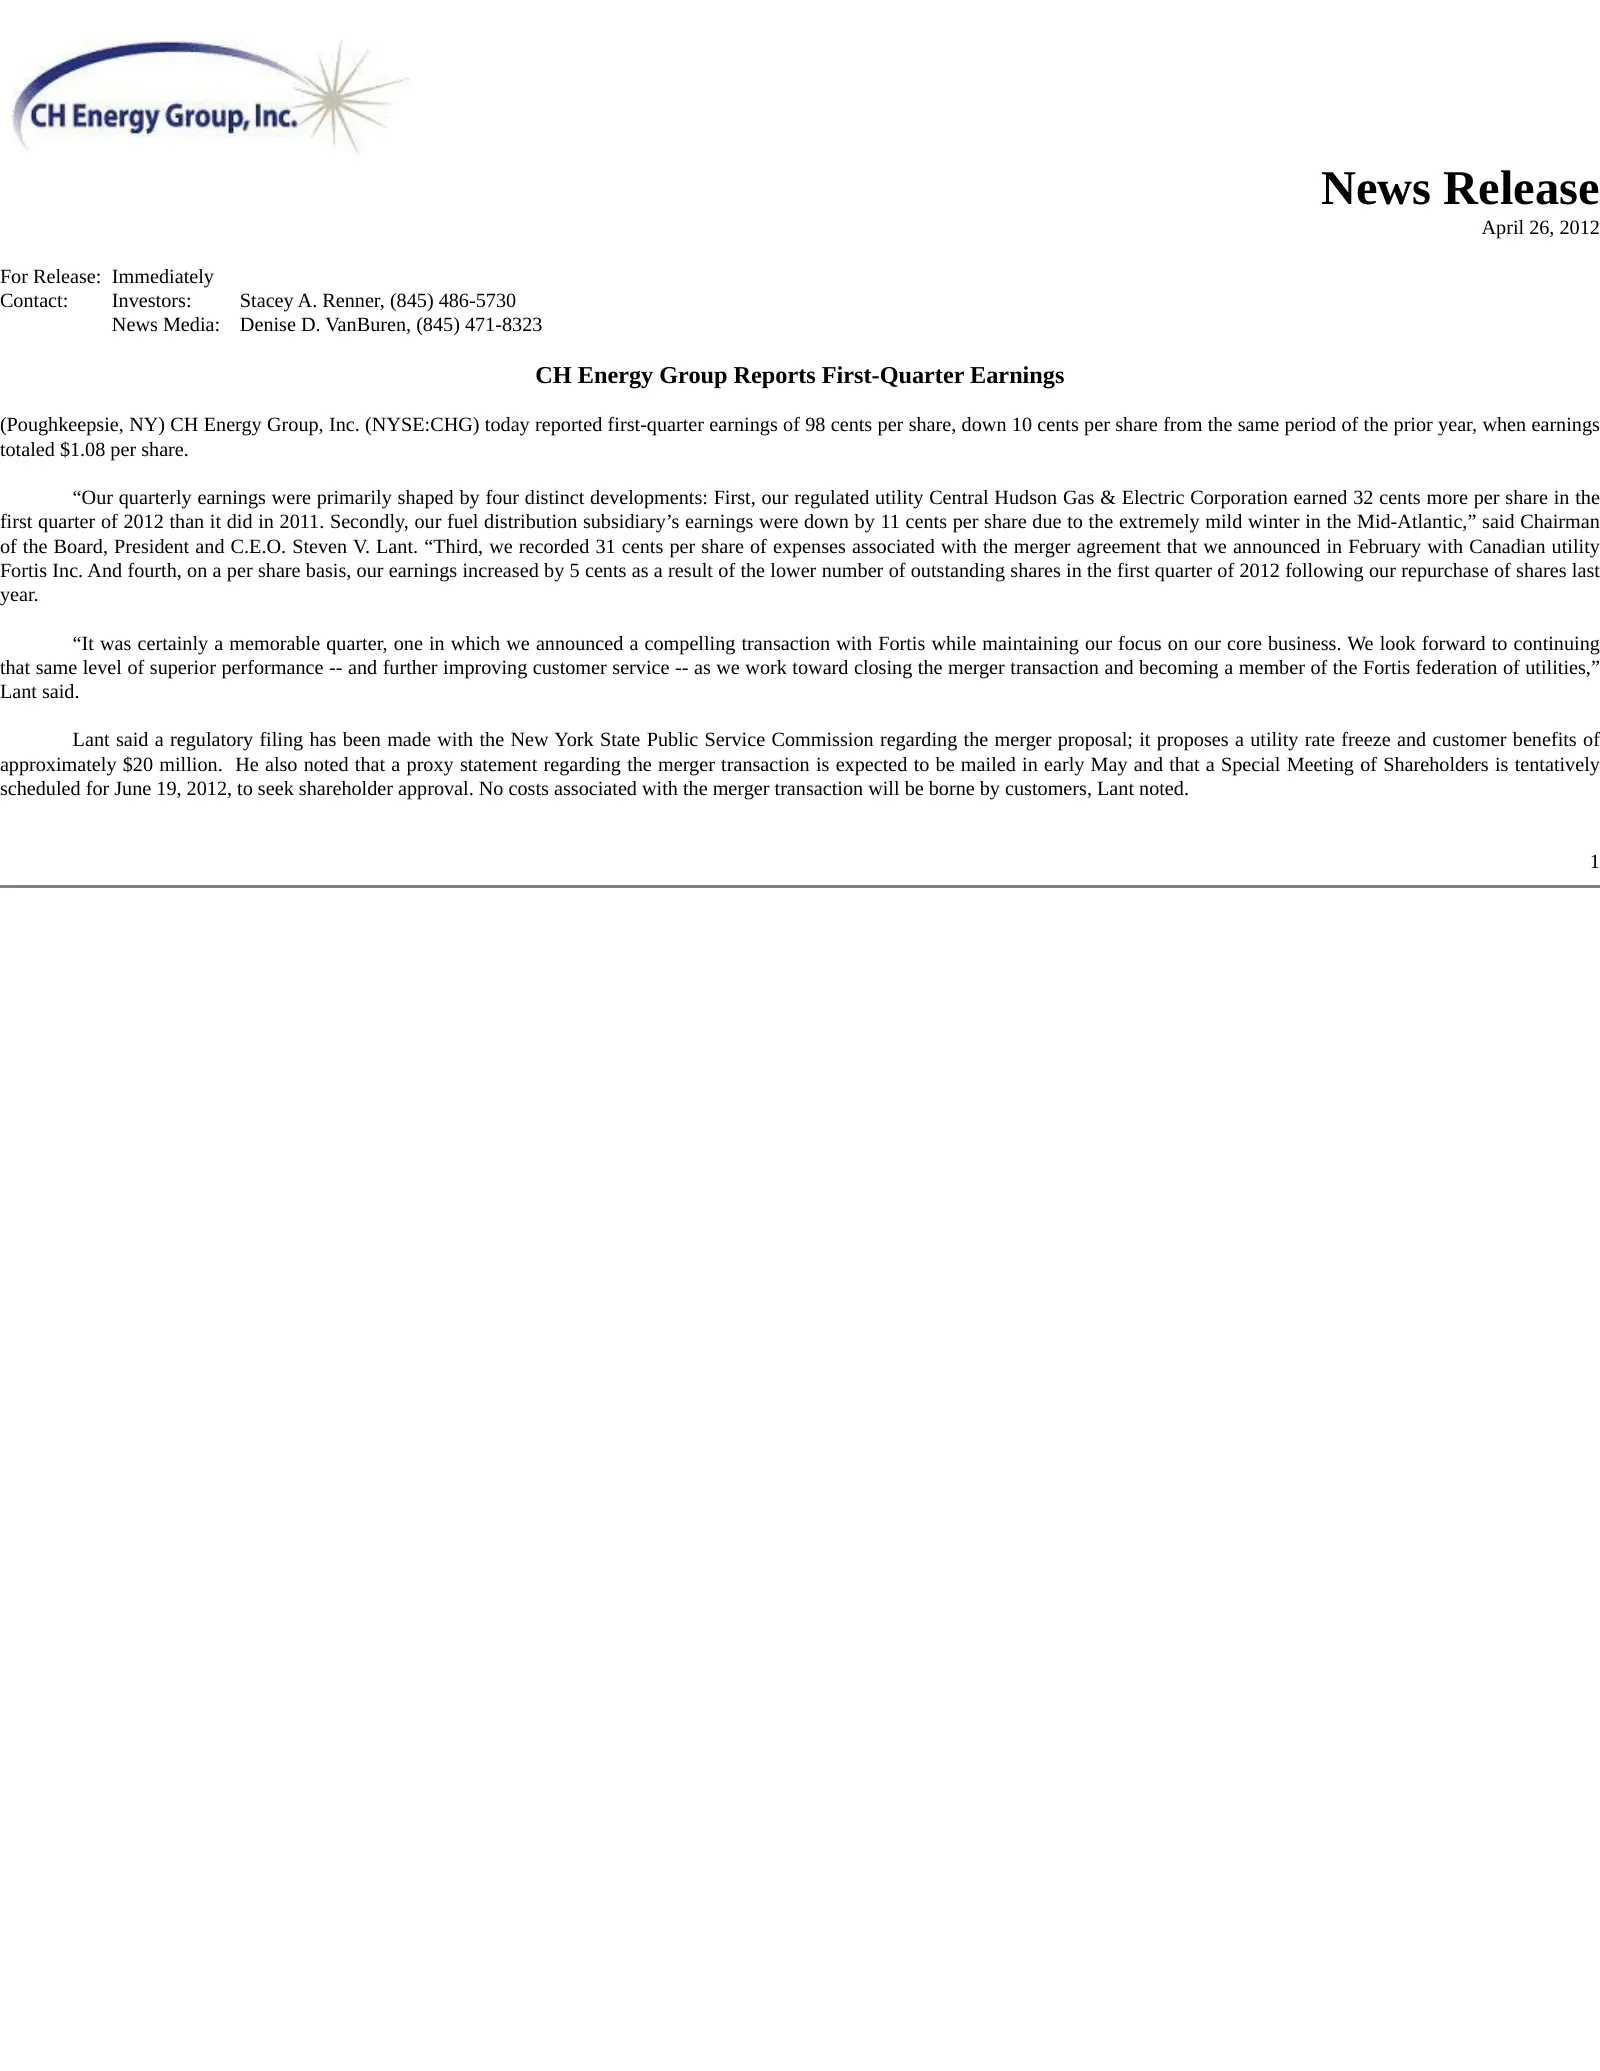
News Release April 26, 2012 For Release: Immediately Contact: Investors: Stacey A. Renner, (845) 486-5730 News Media: Denise D. VanBuren, (845) 471-8323 CH Energy Group Reports First-Quarter Earnings (Poughkeepsie, NY) CH Energy Group, Inc. (NYSE:CHG) today reported first-quarter earnings of 98 cent
Slide 3: Quarterly results by business unit
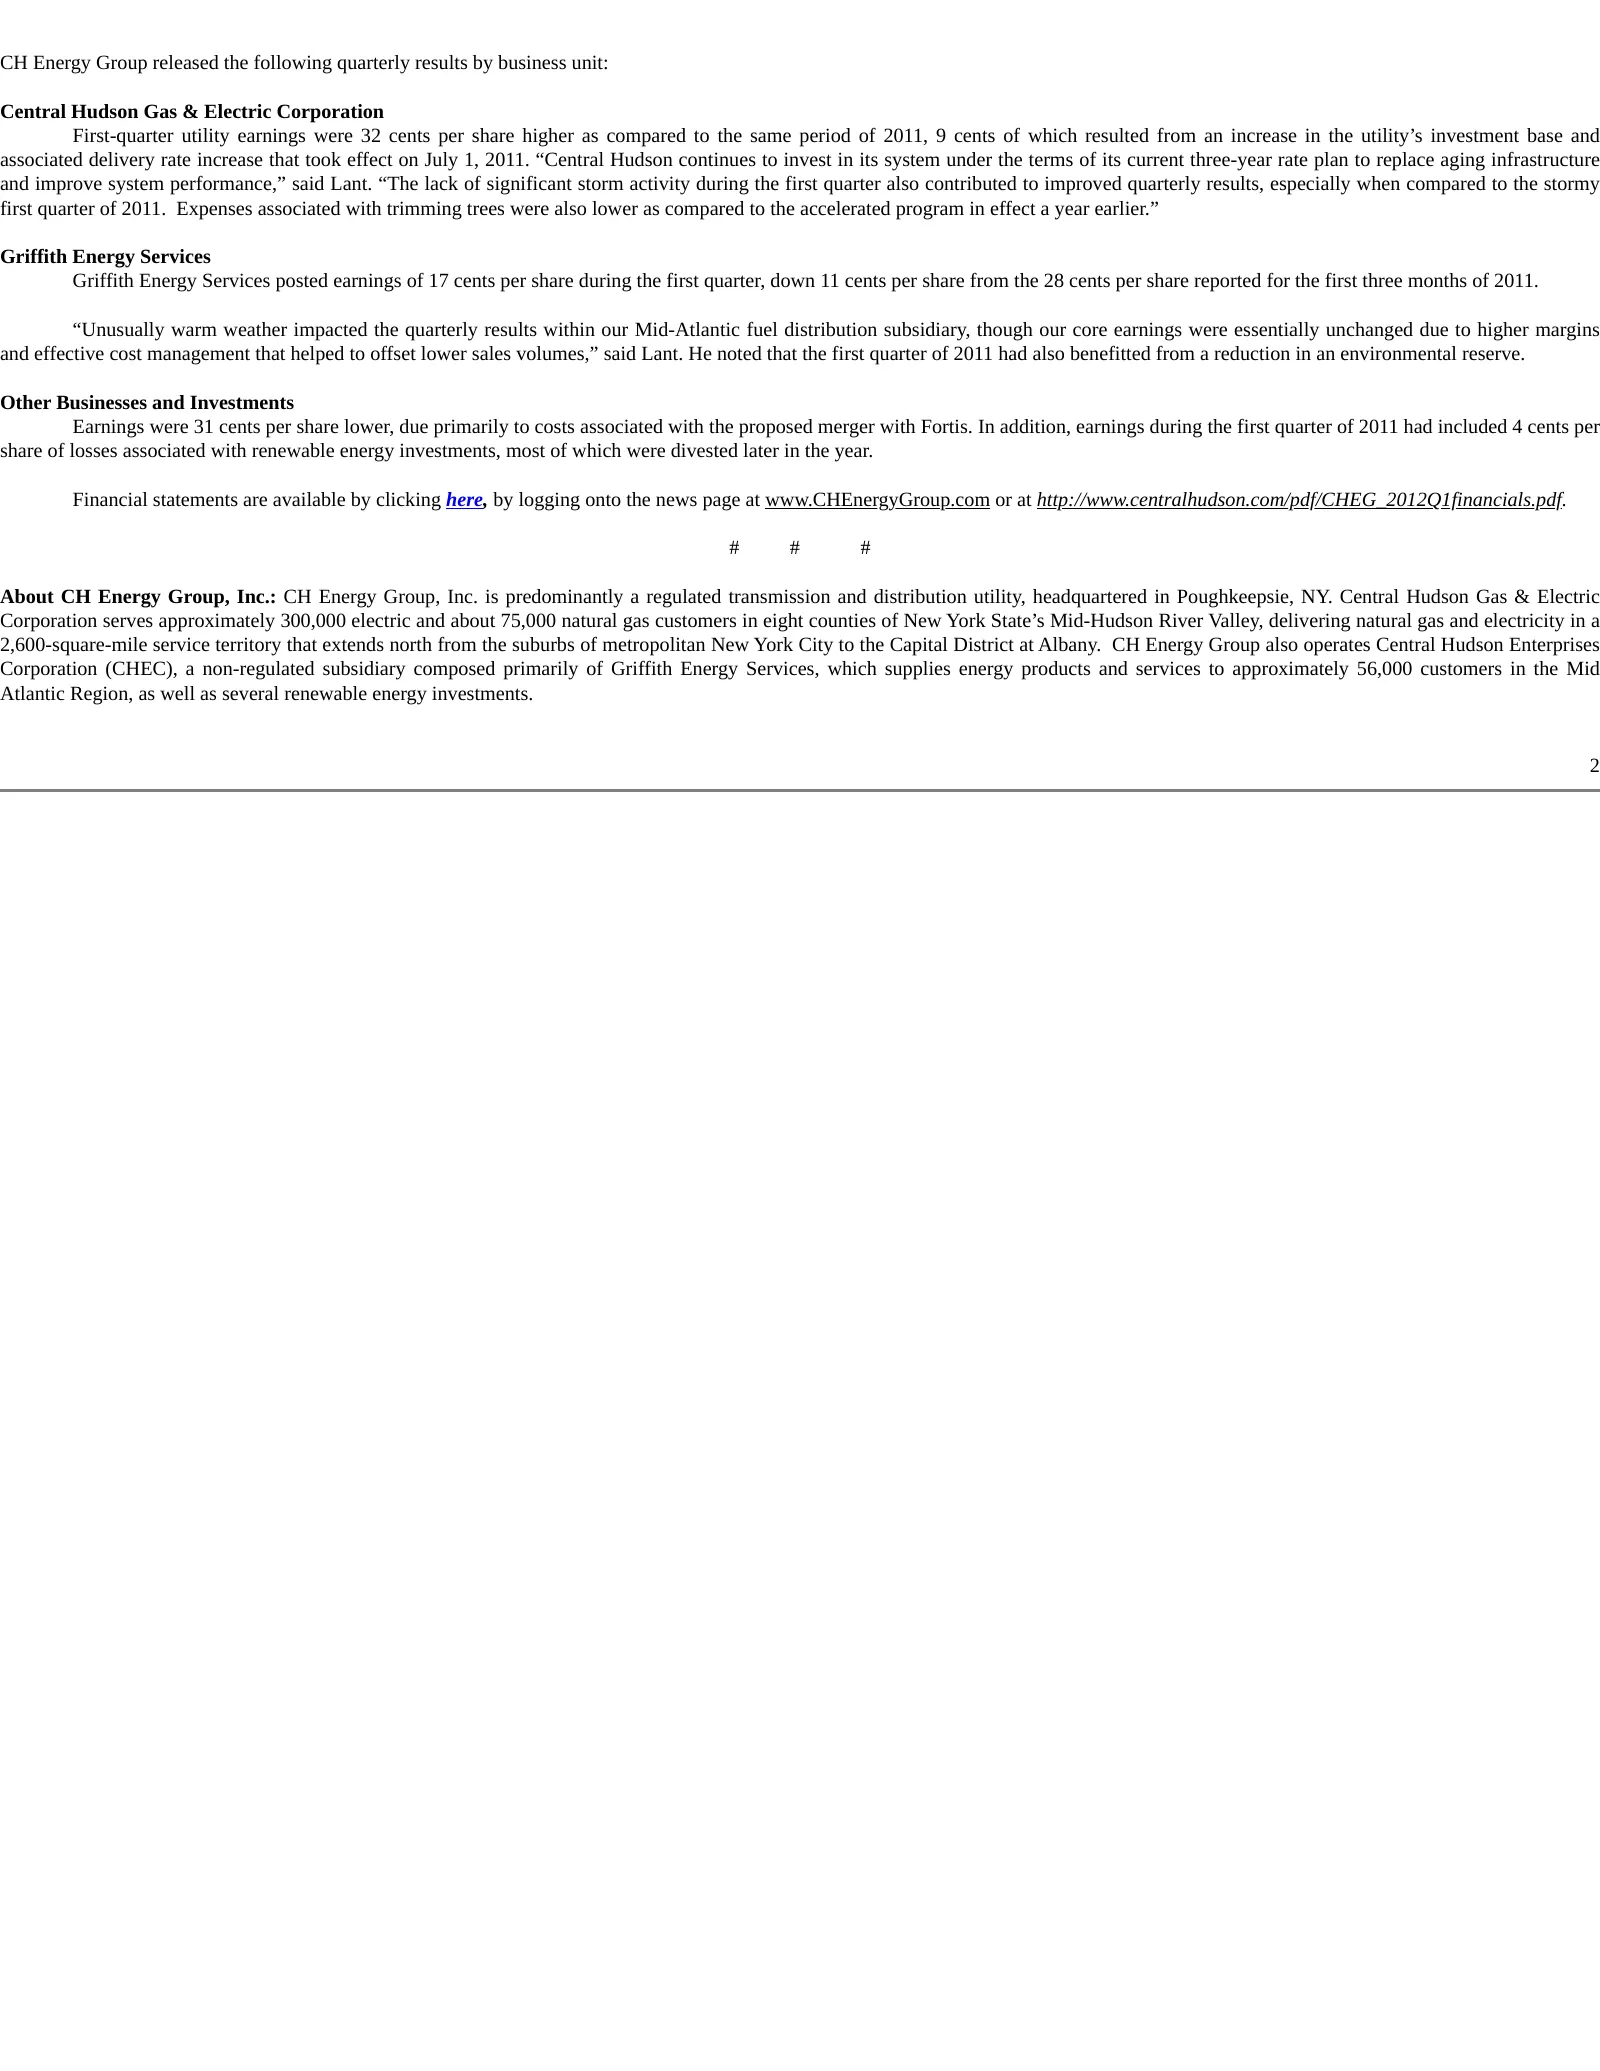
CH Energy Group released the following quarterly results by business unit: Central Hudson Gas & Electric Corporation First-quarter utility earnings were 32 cents per share higher as compared to the same period of 2011, 9 cents of which resulted from an increase in the utility’s investment base and a
Slide 4: Forward-Looking Statements
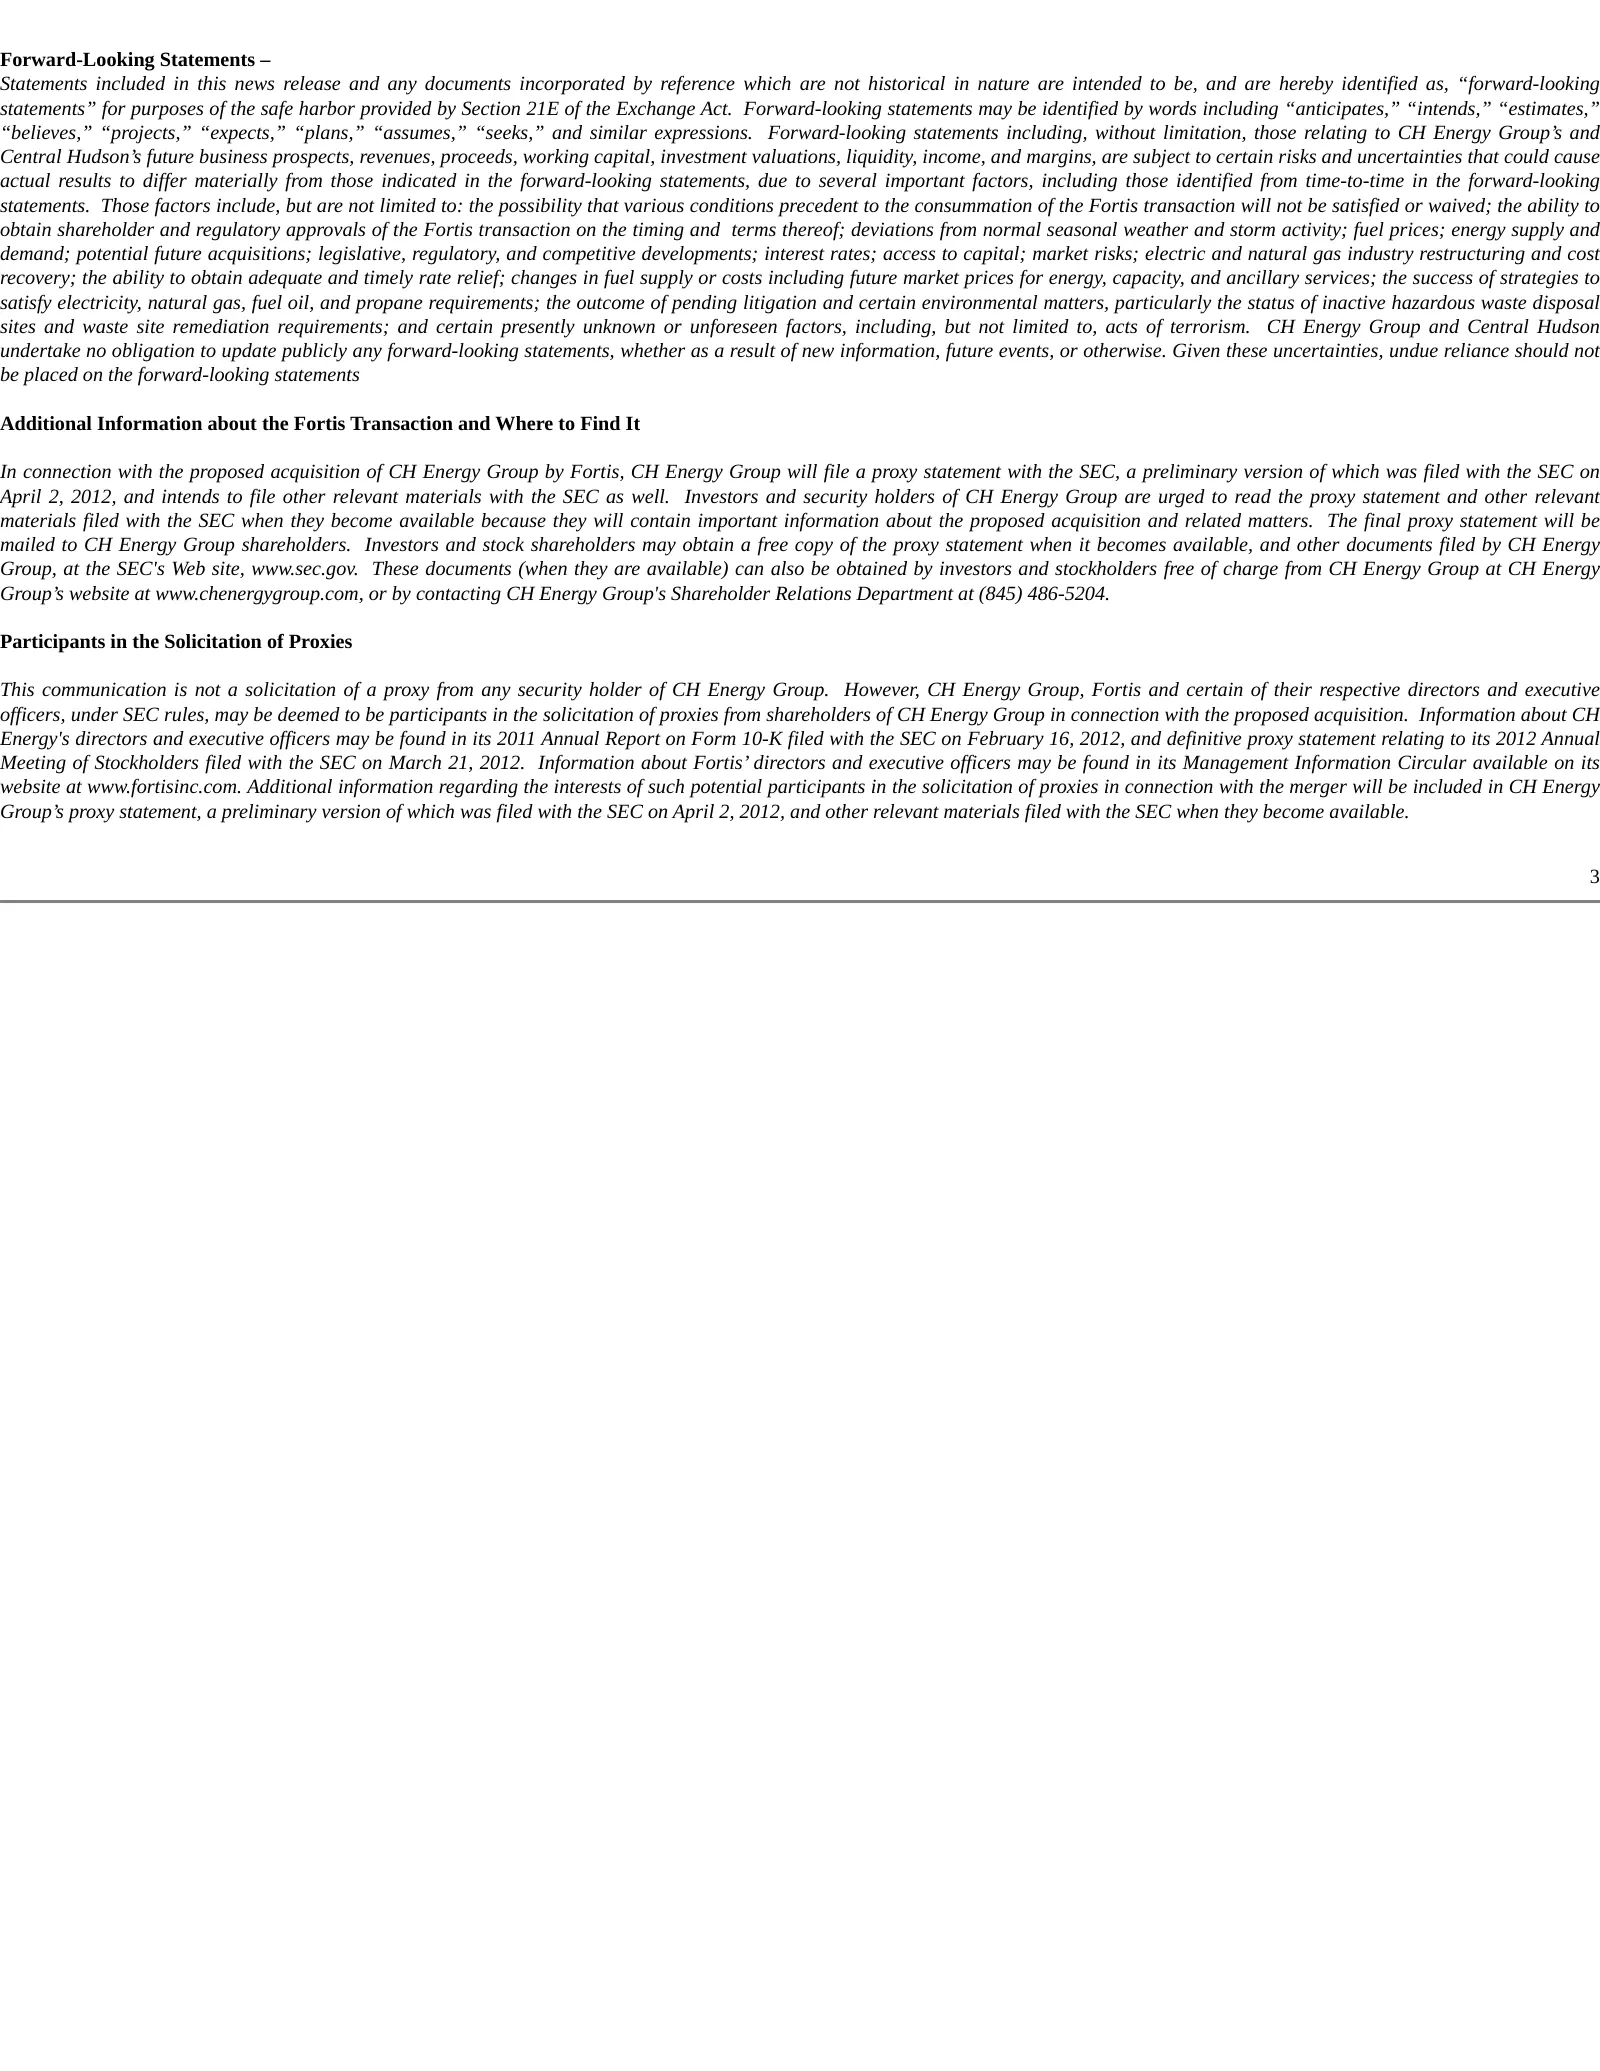
Forward-Looking Statements – Statements included in this news release and any documents incorporated by reference which are not historical in nature are intended to be, and are hereby identified as, “forward-looking statements” for purposes of the safe harbor provided by Section 21E of the Exchange
Slide 5: Consolidated Balance Sheet
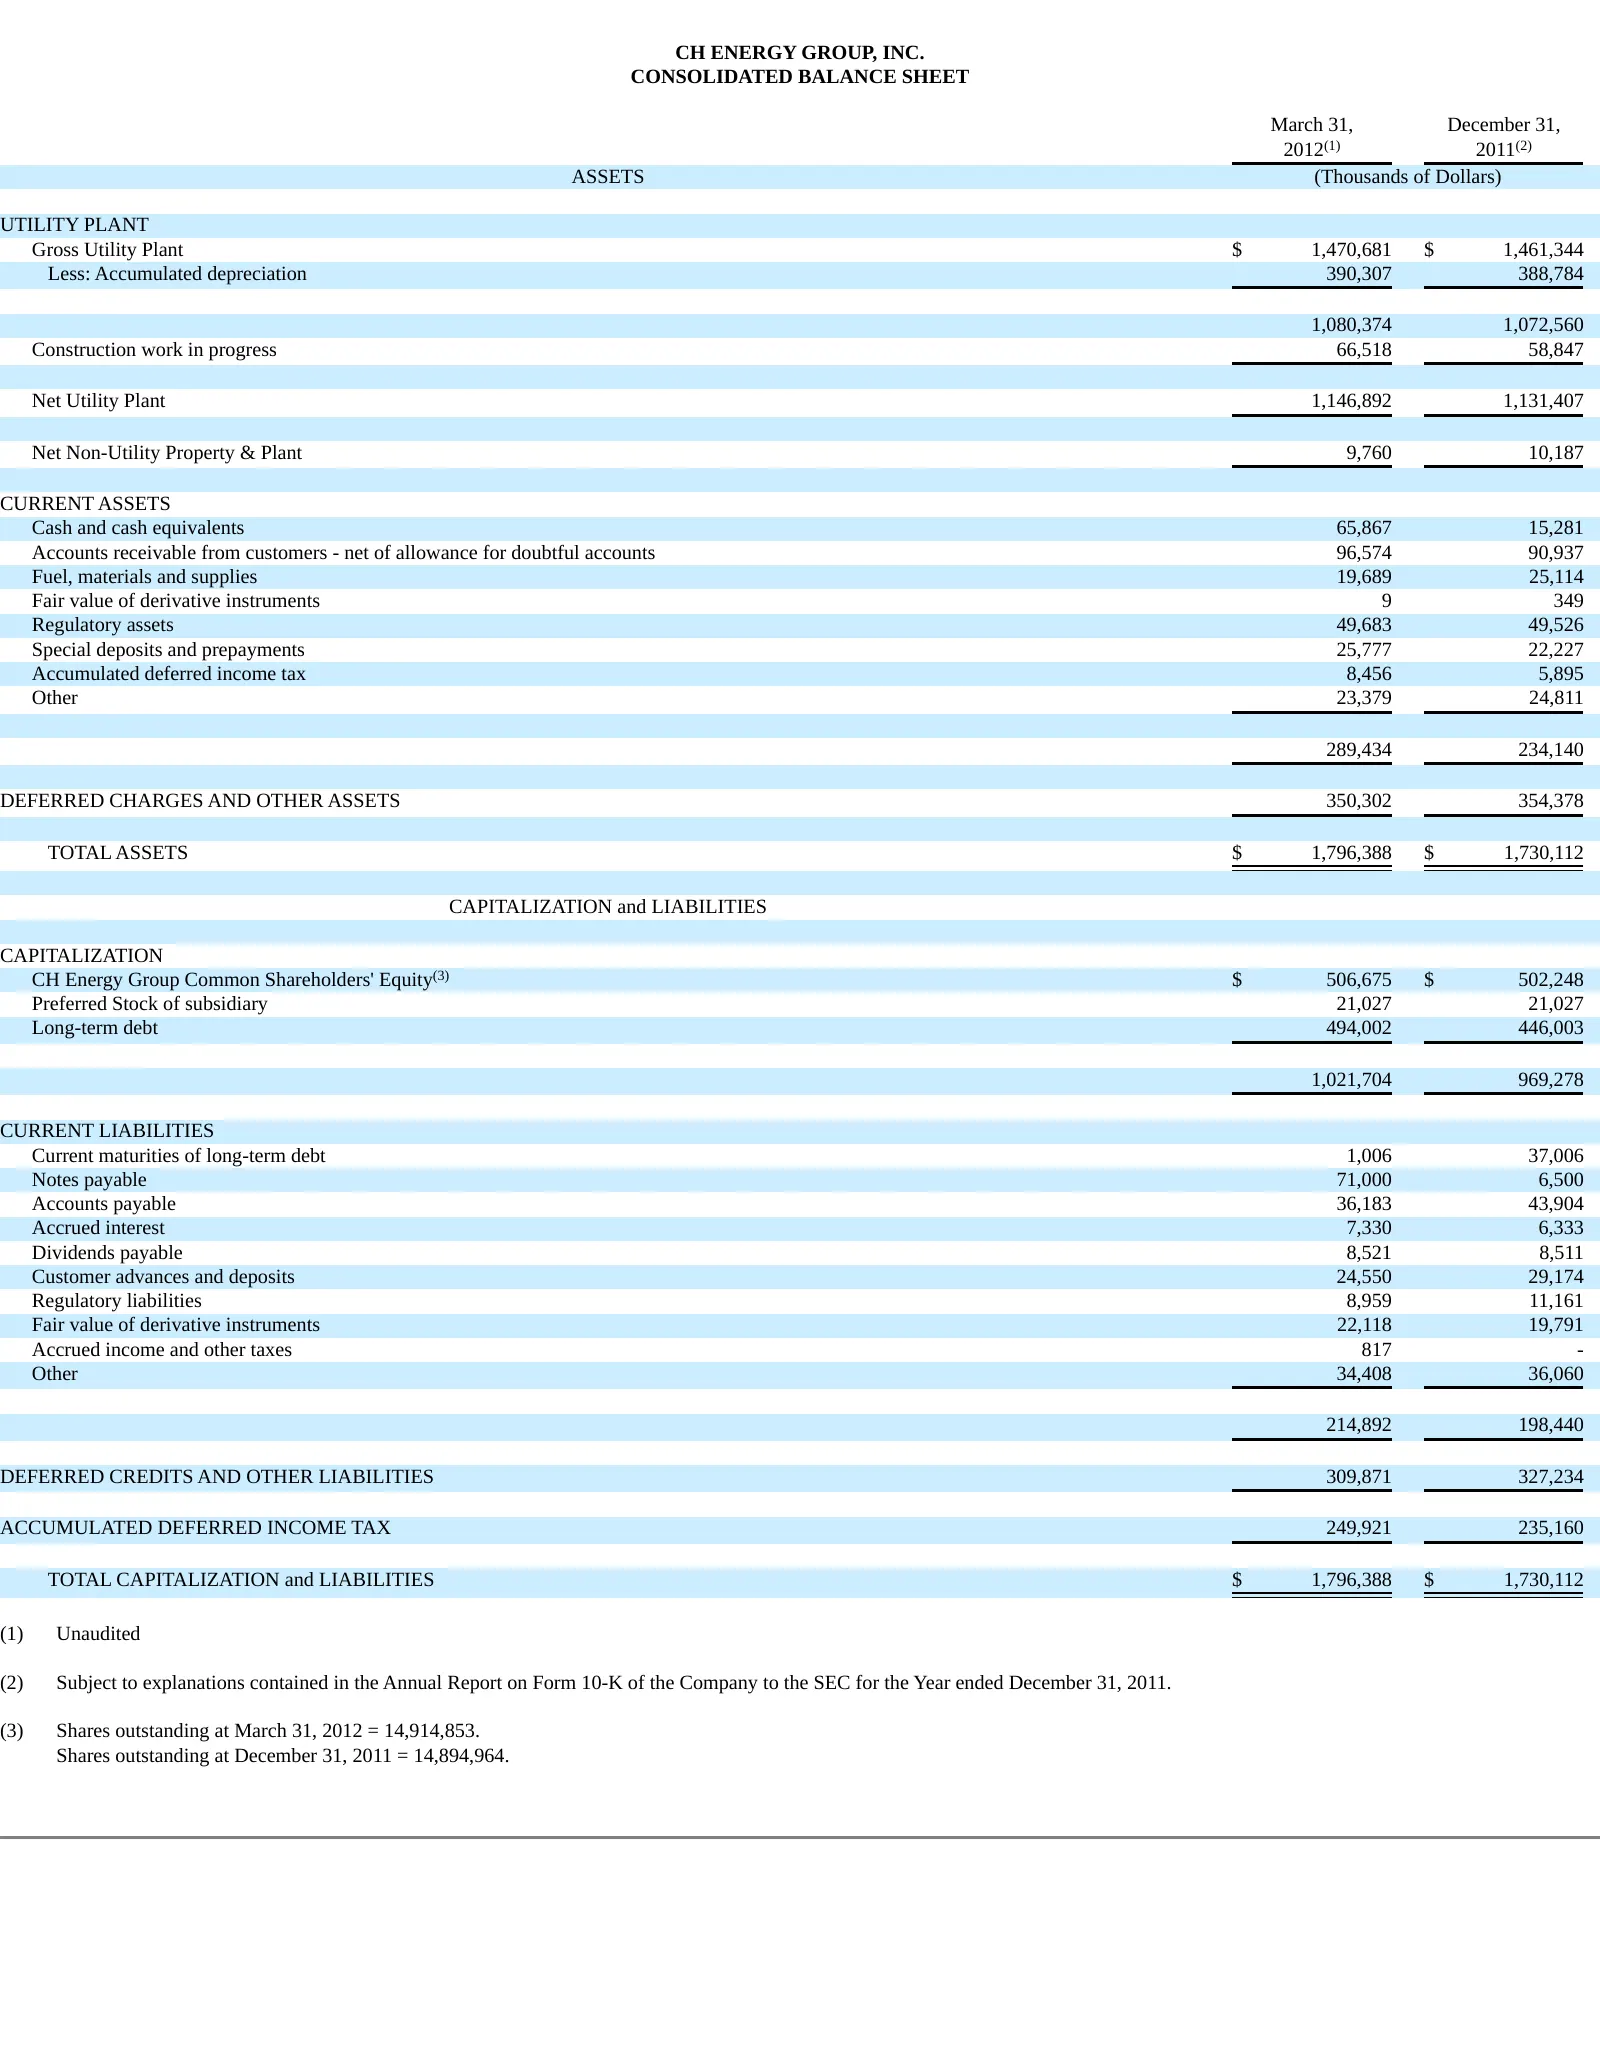
CH ENERGY GROUP, INC. CONSOLIDATED BALANCE SHEET March 31, December 31, 2012(1) 2011(2) ASSETS (Thousands of Dollars) UTILITY PLANT Gross Utility Plant $ 1,470,681 $ 1,461,344 Less: Accumulated depreciation 390,307 388,784 1,080,374 1,072,560 Construction work in progress 66,518 58,847 Net Utility P
Slide 6: Consolidated Statement of Income
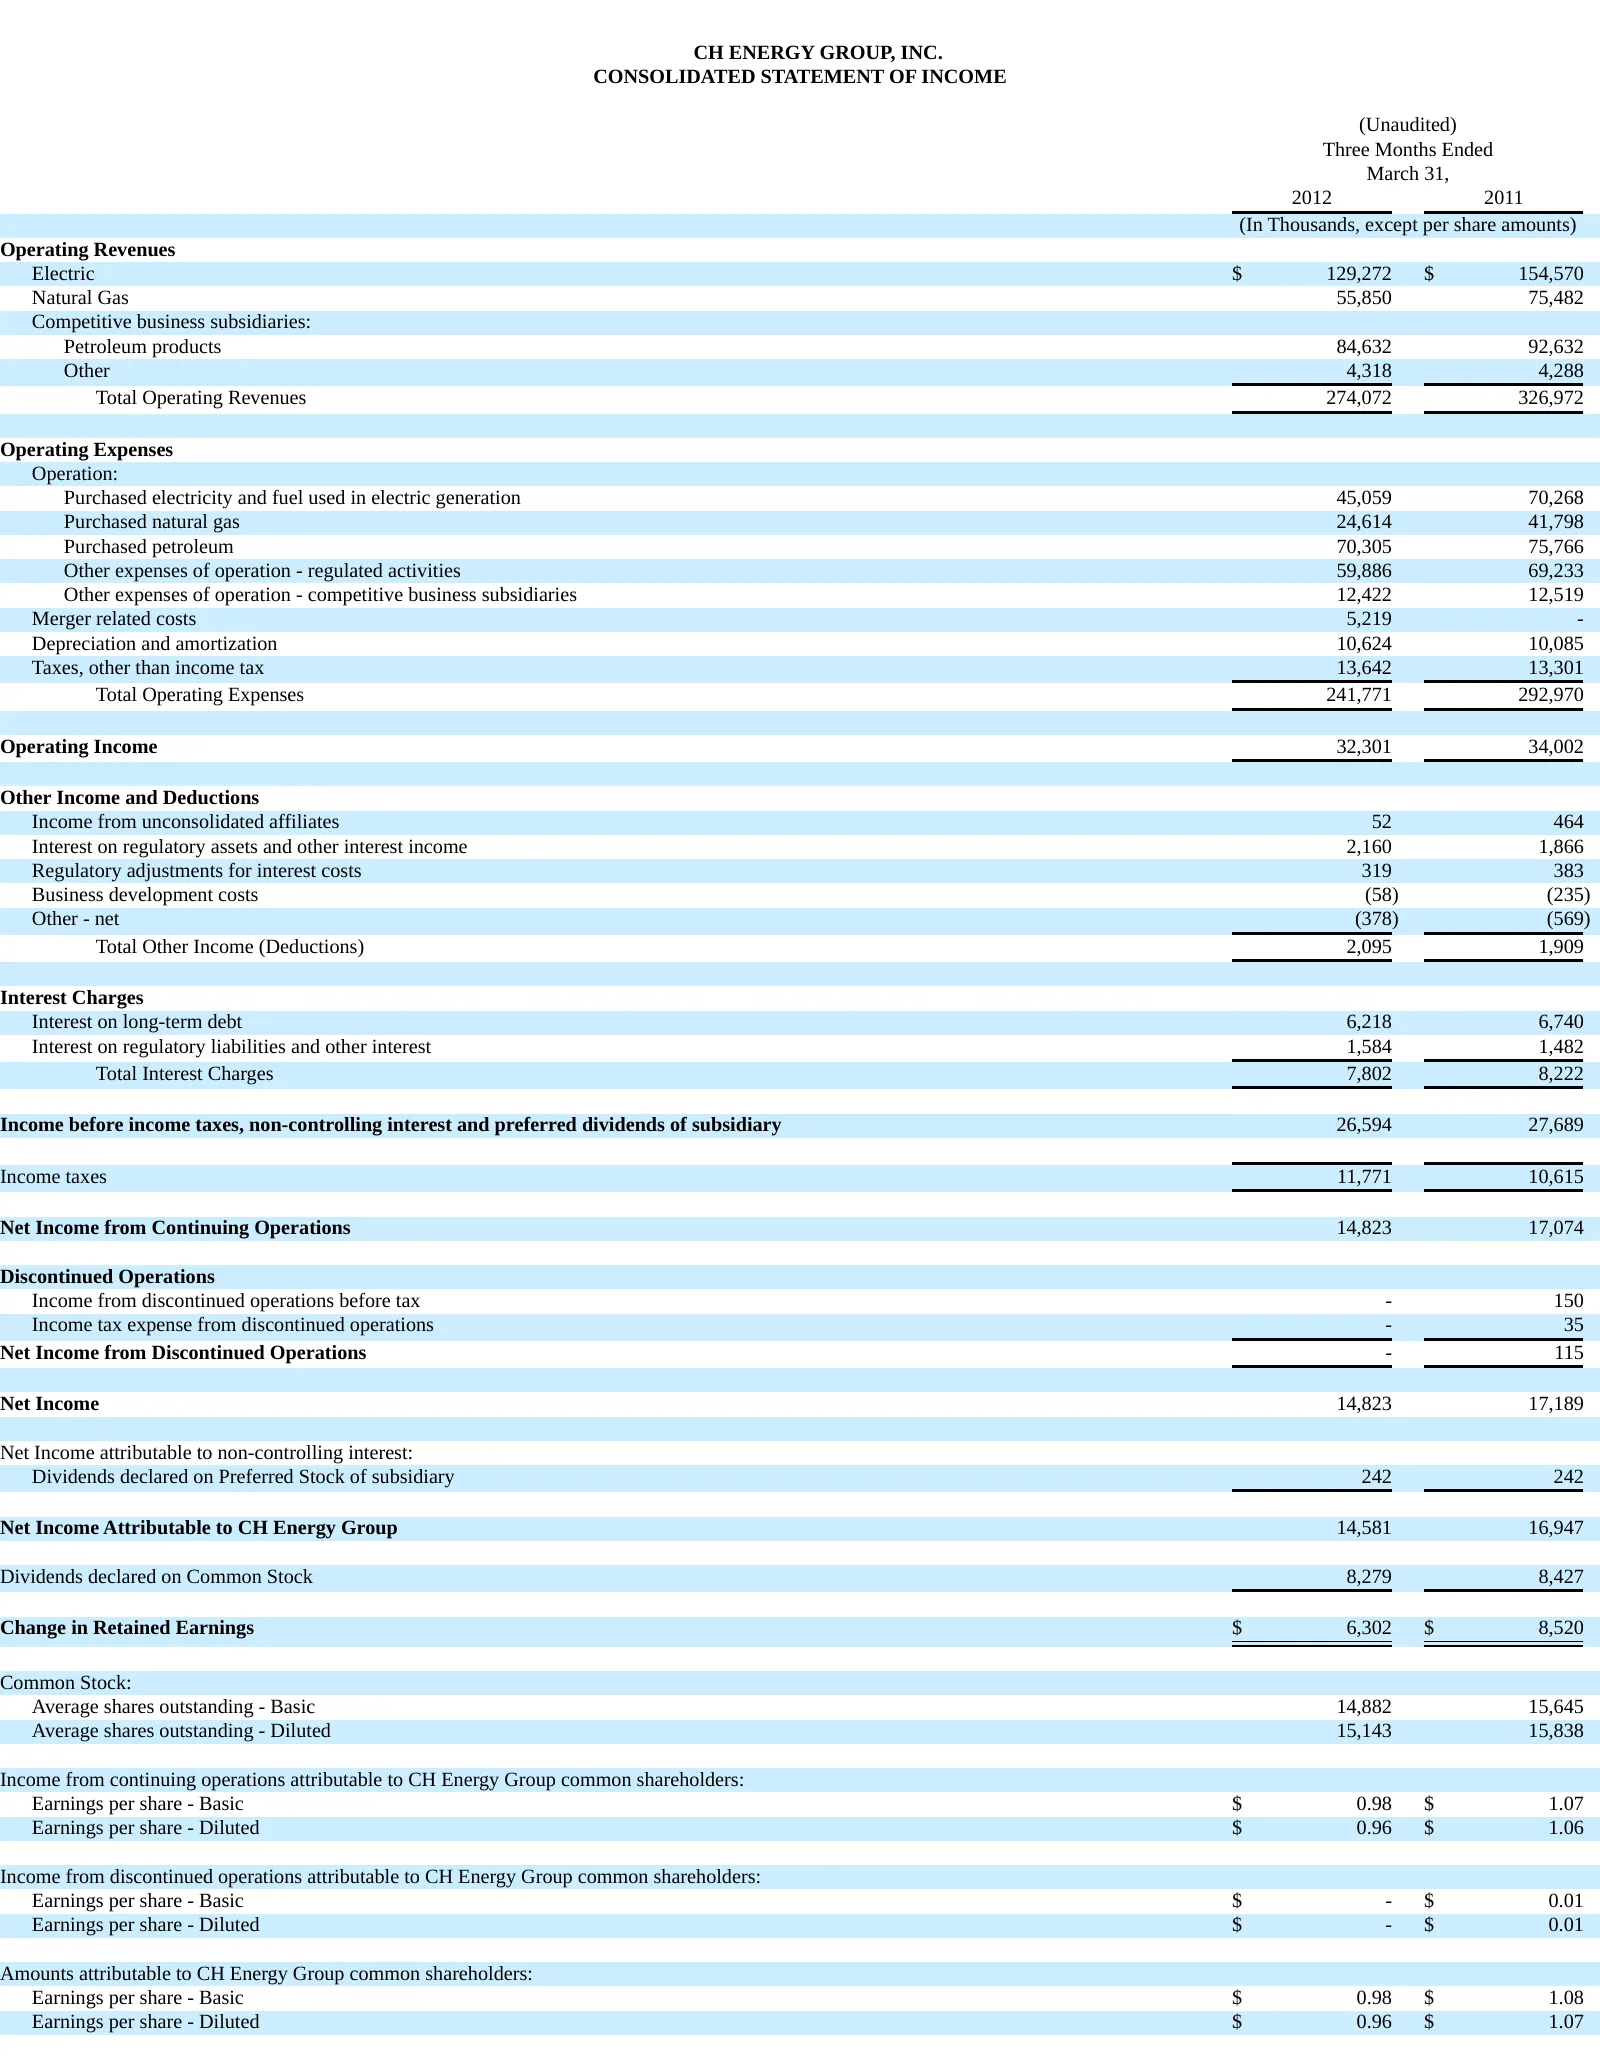
CH ENERGY GROUP, INC. CONSOLIDATED STATEMENT OF INCOME (Unaudited) Three Months Ended March 31, 2012 2011 (In Thousands, except per share amounts) Operating Revenues Electric $ 129,272 $ 154,570 Natural Gas 55,850 75,482 Competitive business subsidiaries: Petroleum products 84,632 92,632 Other 4,318

Slide 7: Dividends Declared Per Share
Dividends Declared Per Share $ 0.555 $ 0.540
Slide 8: Earnings Per Share by Segment
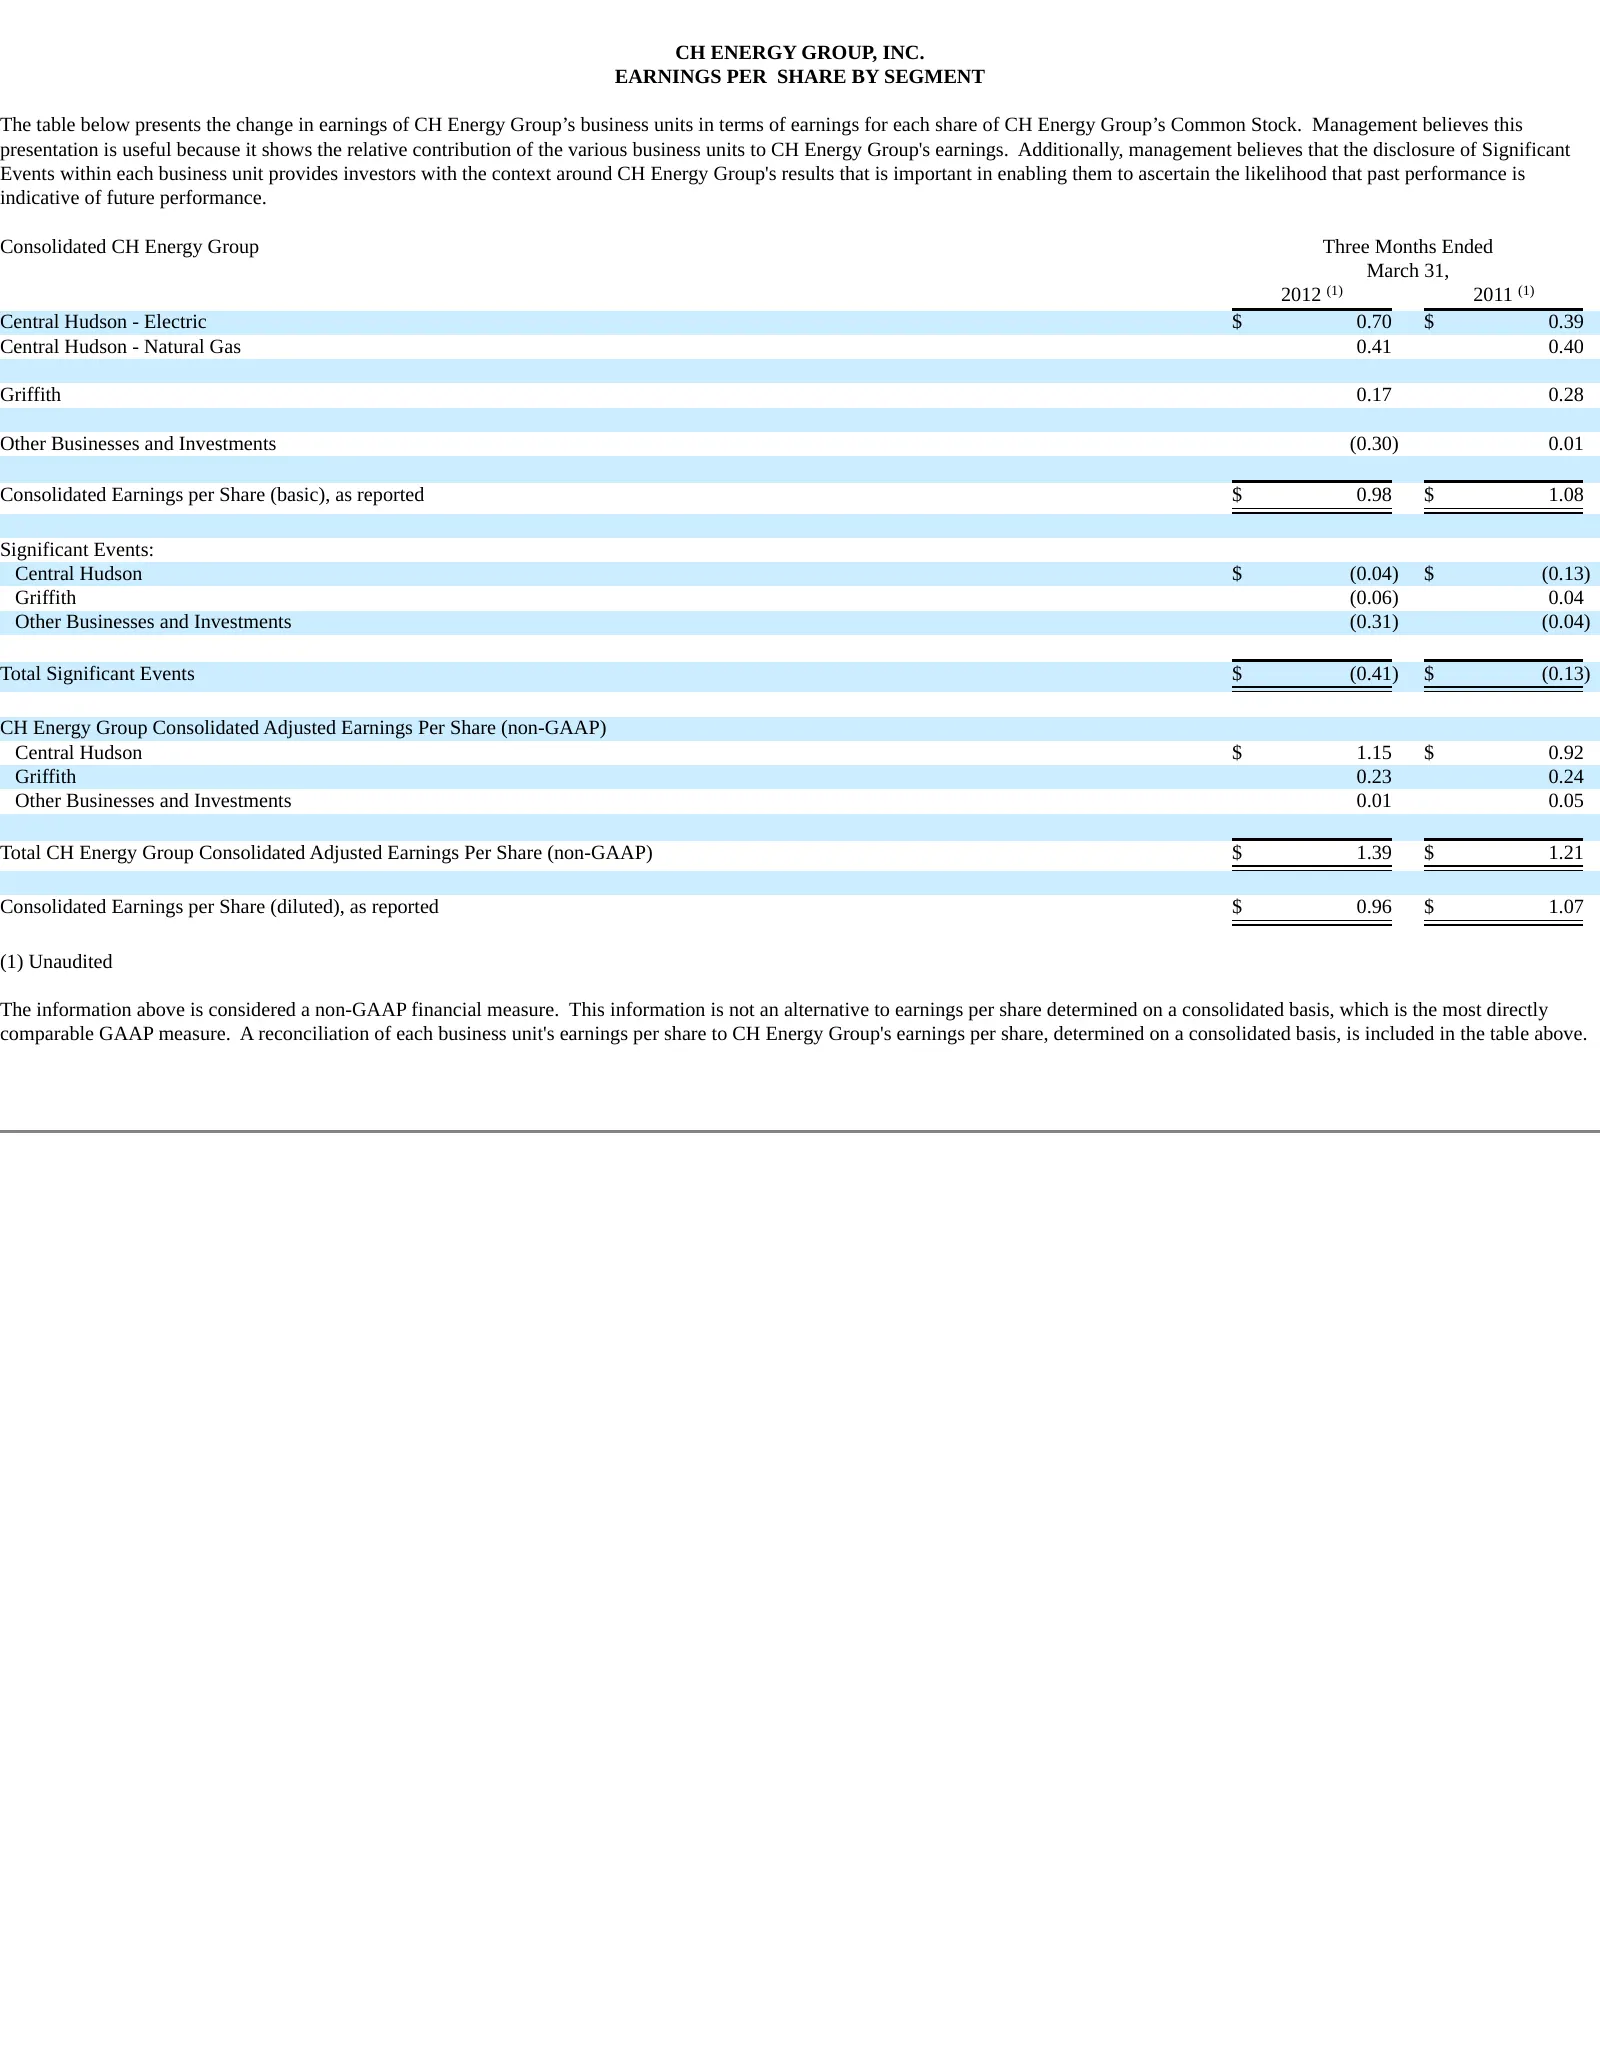
CH ENERGY GROUP, INC. EARNINGS PER SHARE BY SEGMENT The table below presents the change in earnings of CH Energy Group’s business units in terms of earnings for each share of CH Energy Group’s Common Stock. Management believes this presentation is useful because it shows the relative contribution of
Slide 9: First Quarter 2012 Earnings Release Supplement
First Quarter 2012 Earnings Release Supplement April 26, 2012
Slide 10: Table of Contents
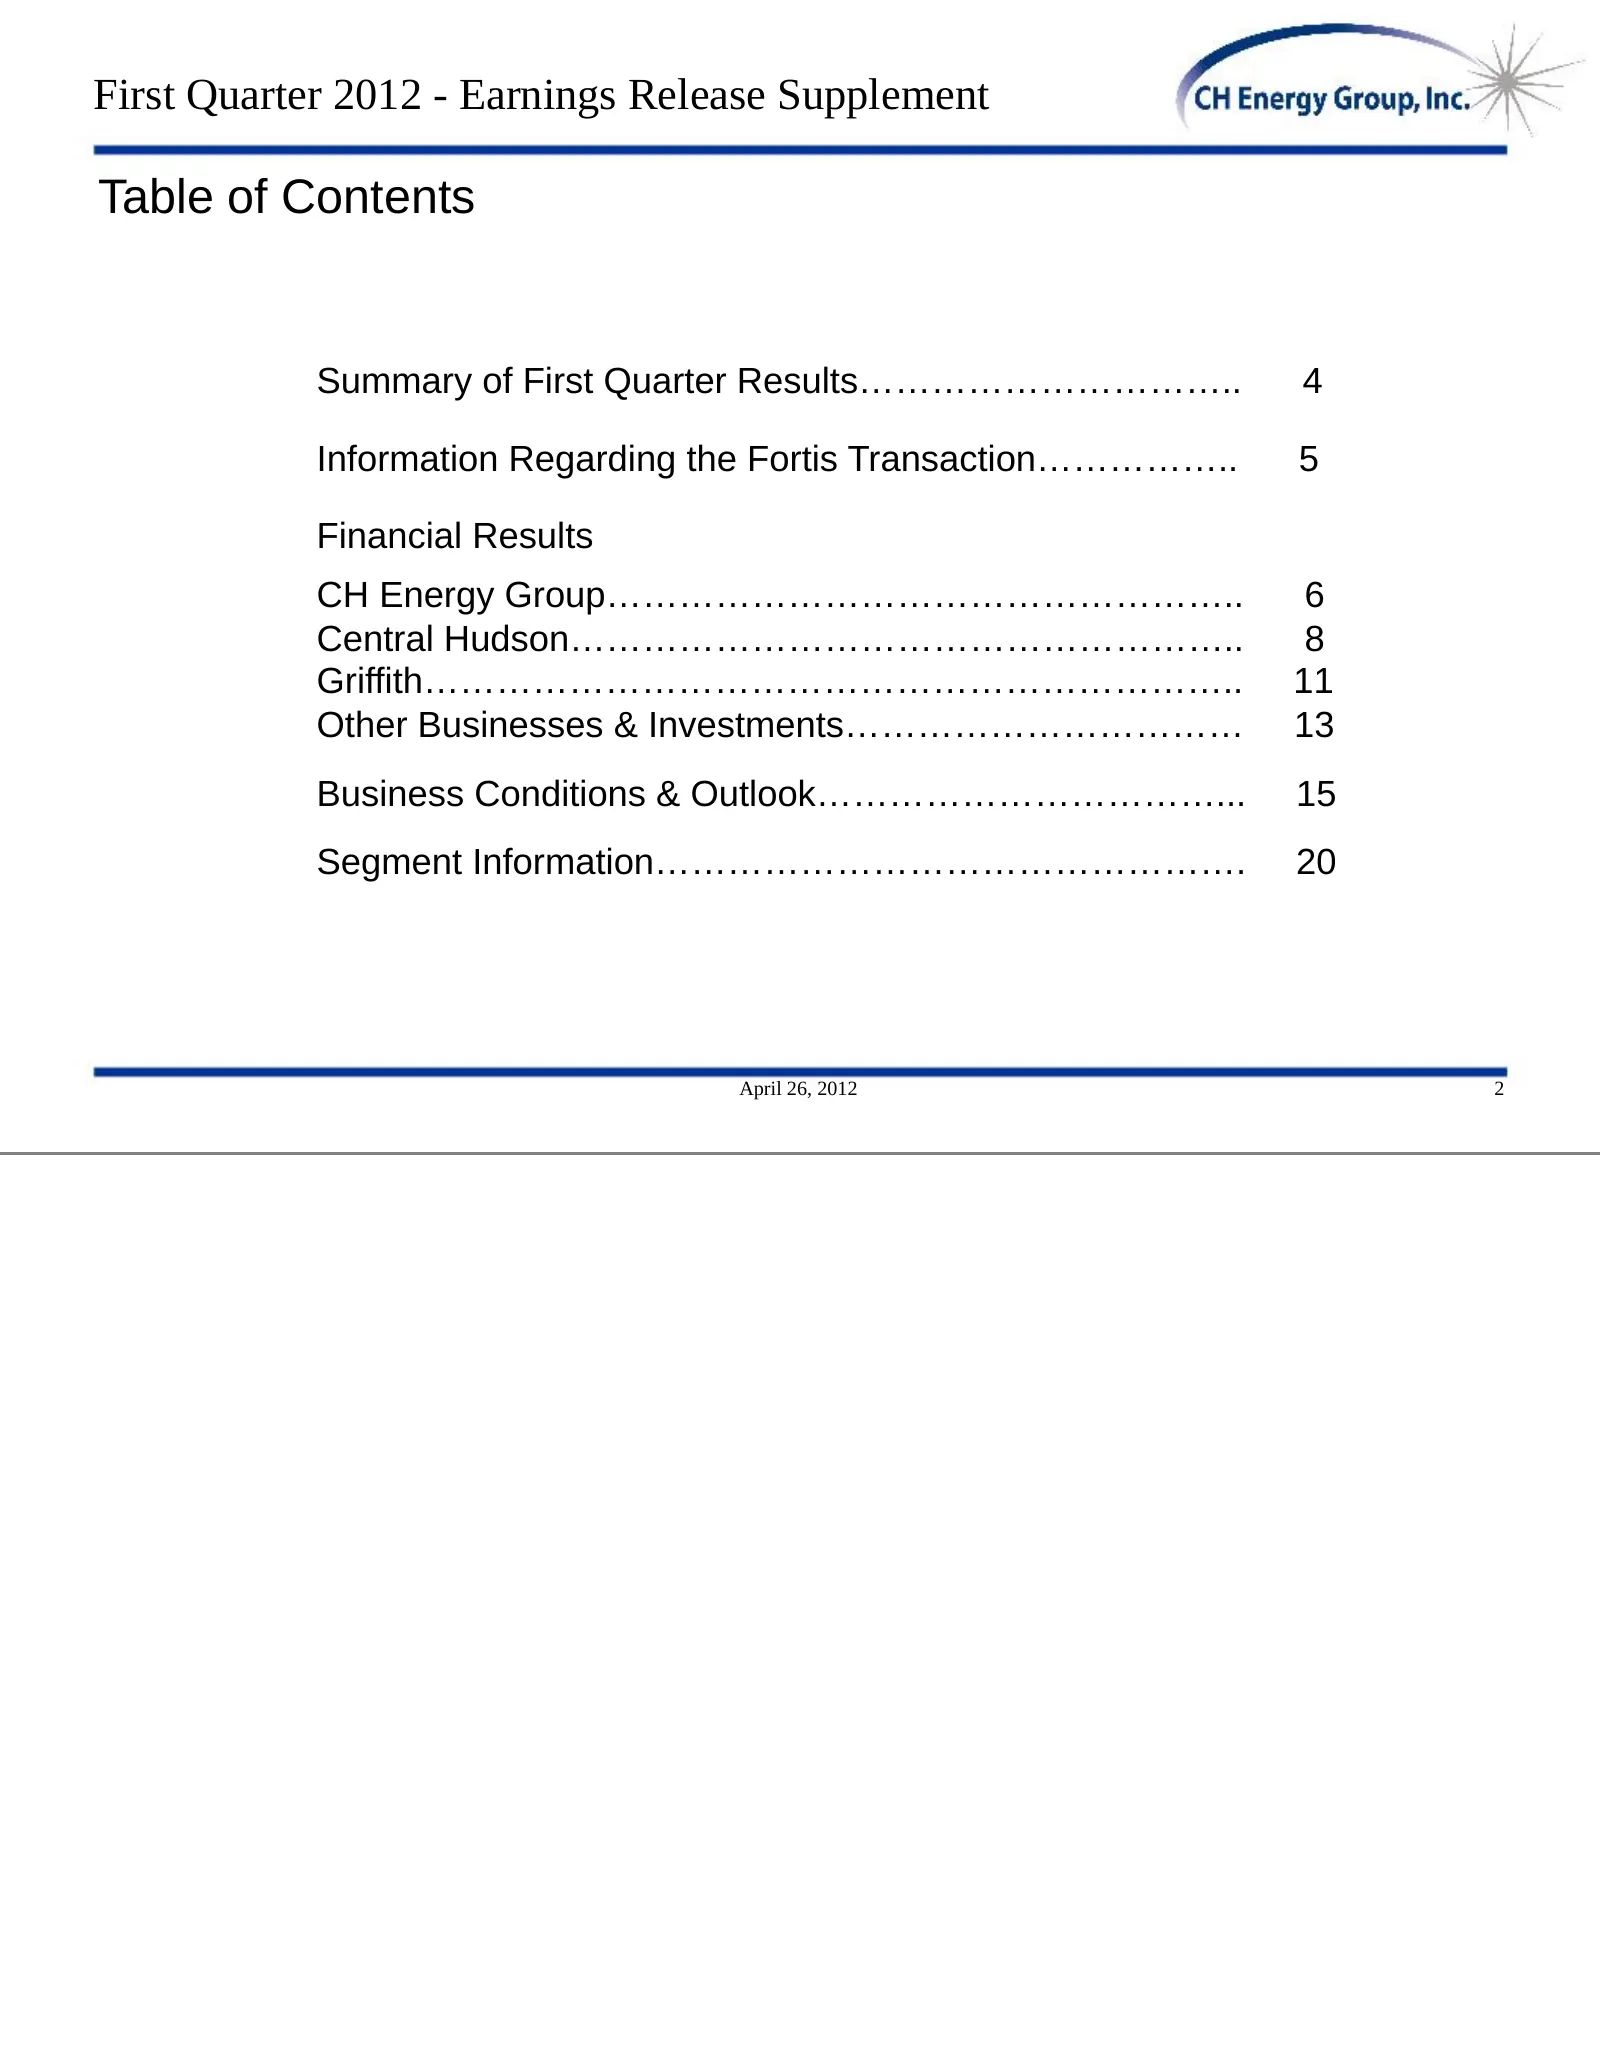
First Quarter 2012 - Earnings Release Supplement Table of Contents Summary of First Quarter Results………………………….. 4 Information Regarding the Fortis Transaction…………….. 5 Financial Results CH Energy Group…………………………………………….. 6 Central Hudson……………………………………………….. 8 Griffith………………………………………………………….. 11 Othe
Slide 11: Forward-Looking Statements
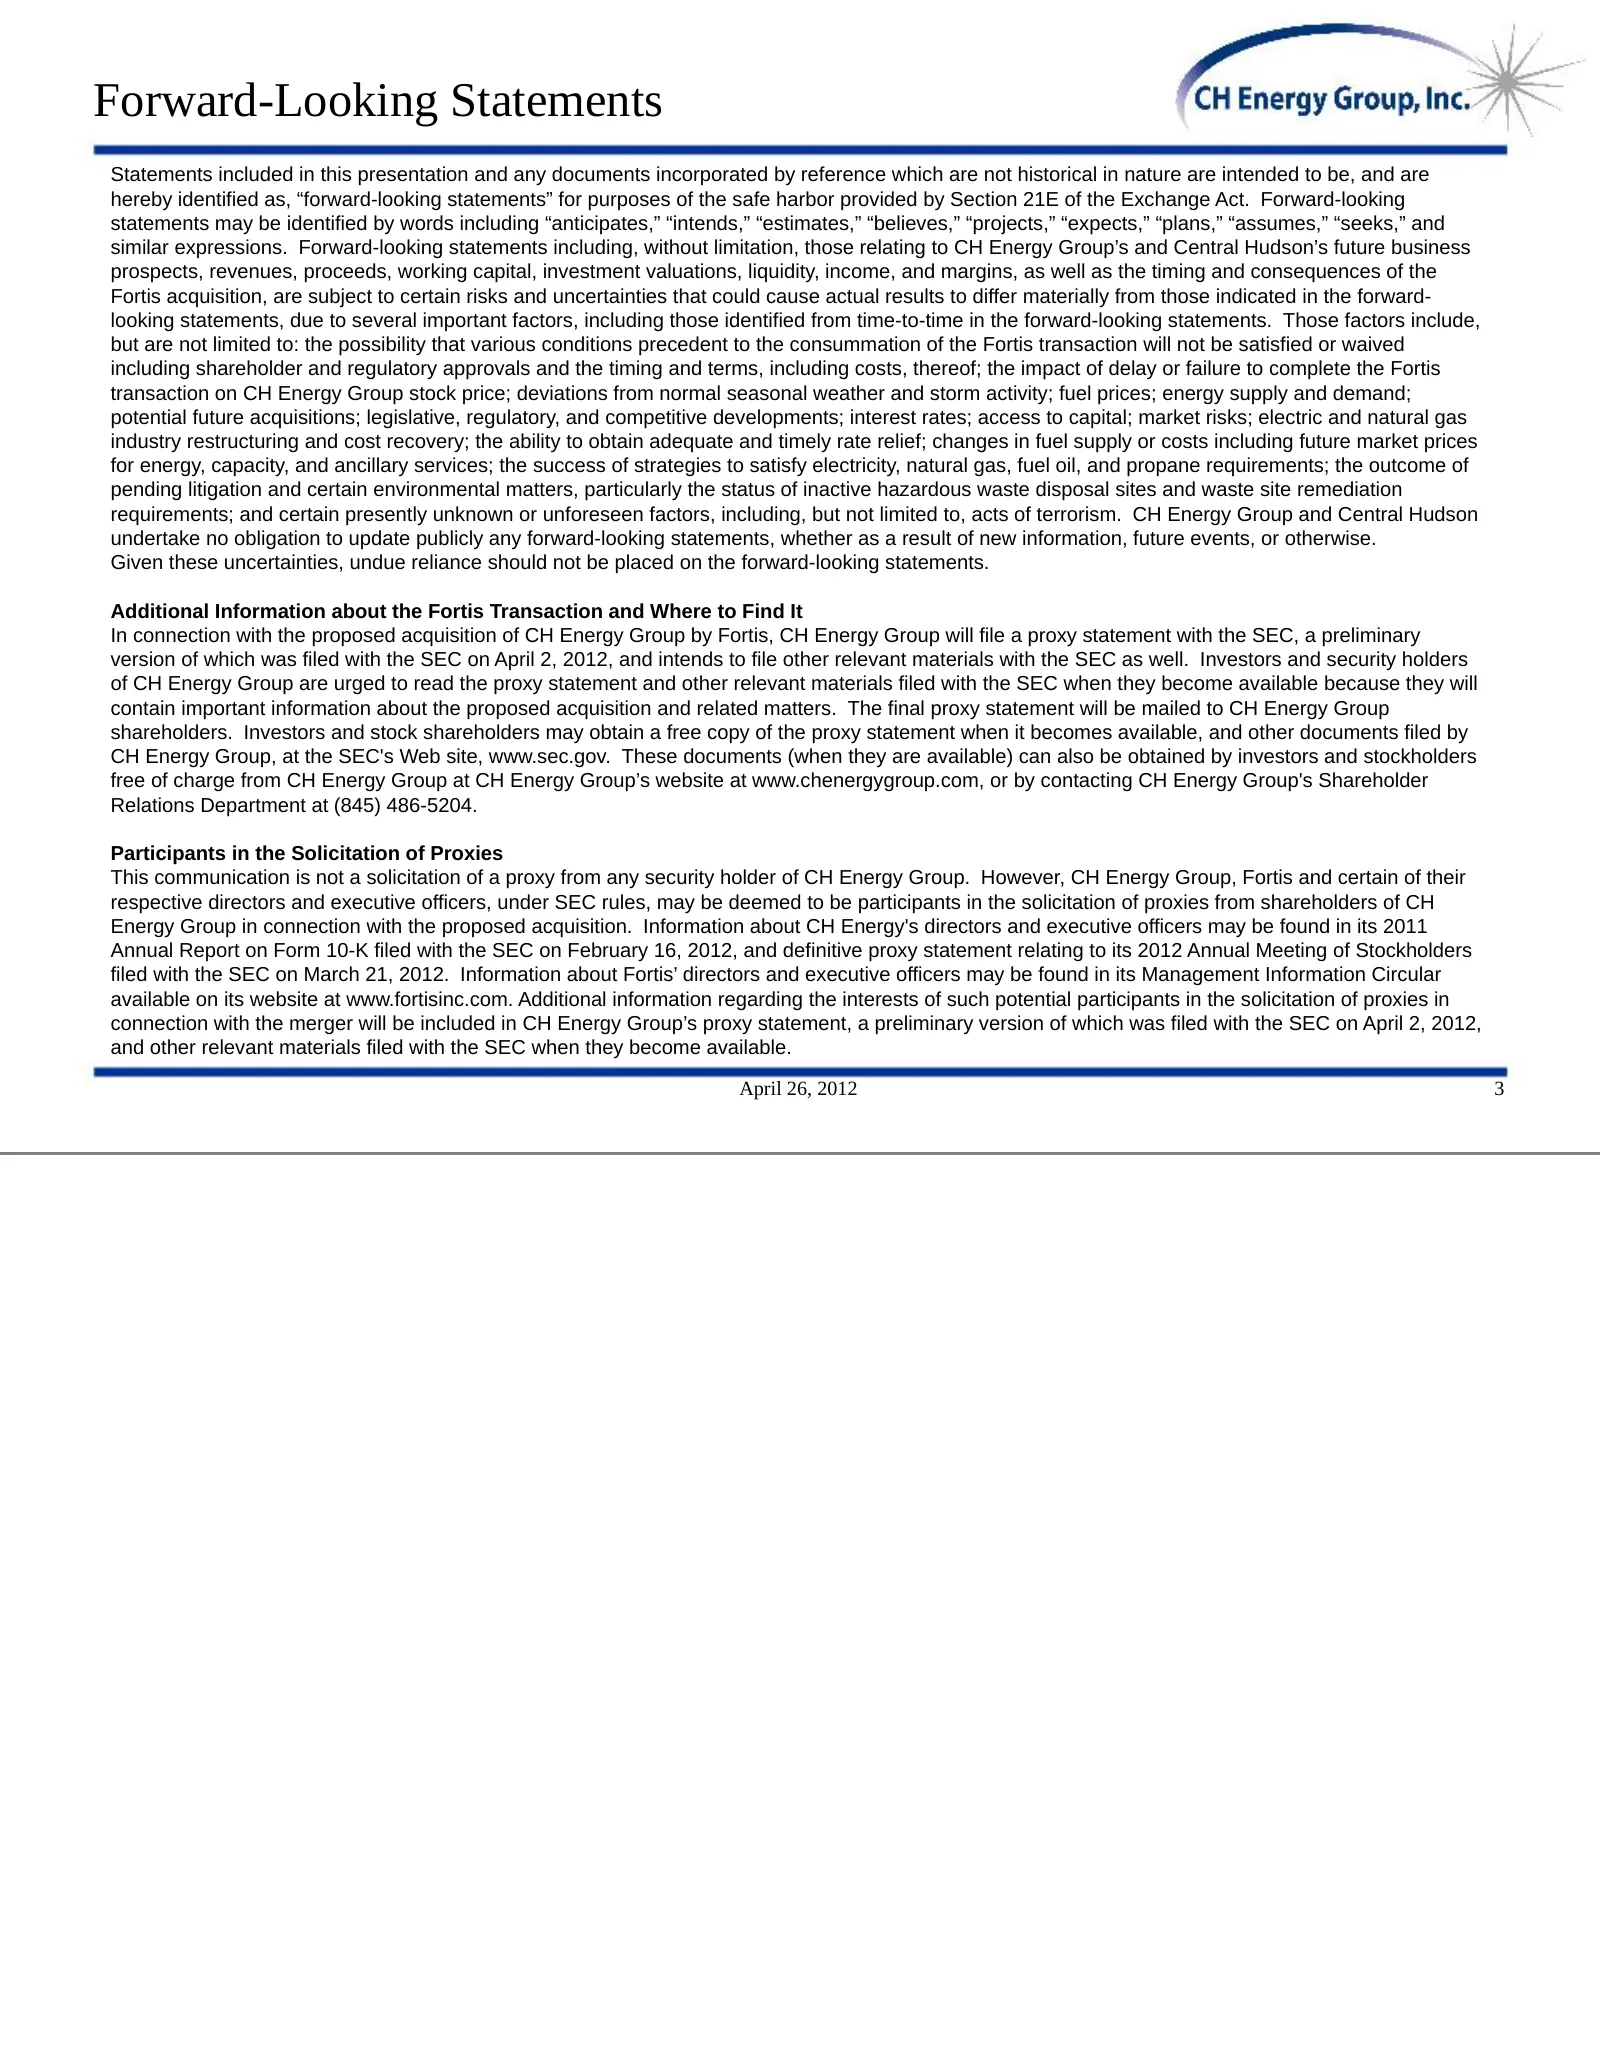
Forward-Looking Statements Statements included in this presentation and any documents incorporated by reference which are not historical in nature are intended to be, and are hereby identified as, “forward-looking statements” for purposes of the safe harbor provided by Section 21E of the Exchange Ac
Slide 12: Summary of First Quarter Results
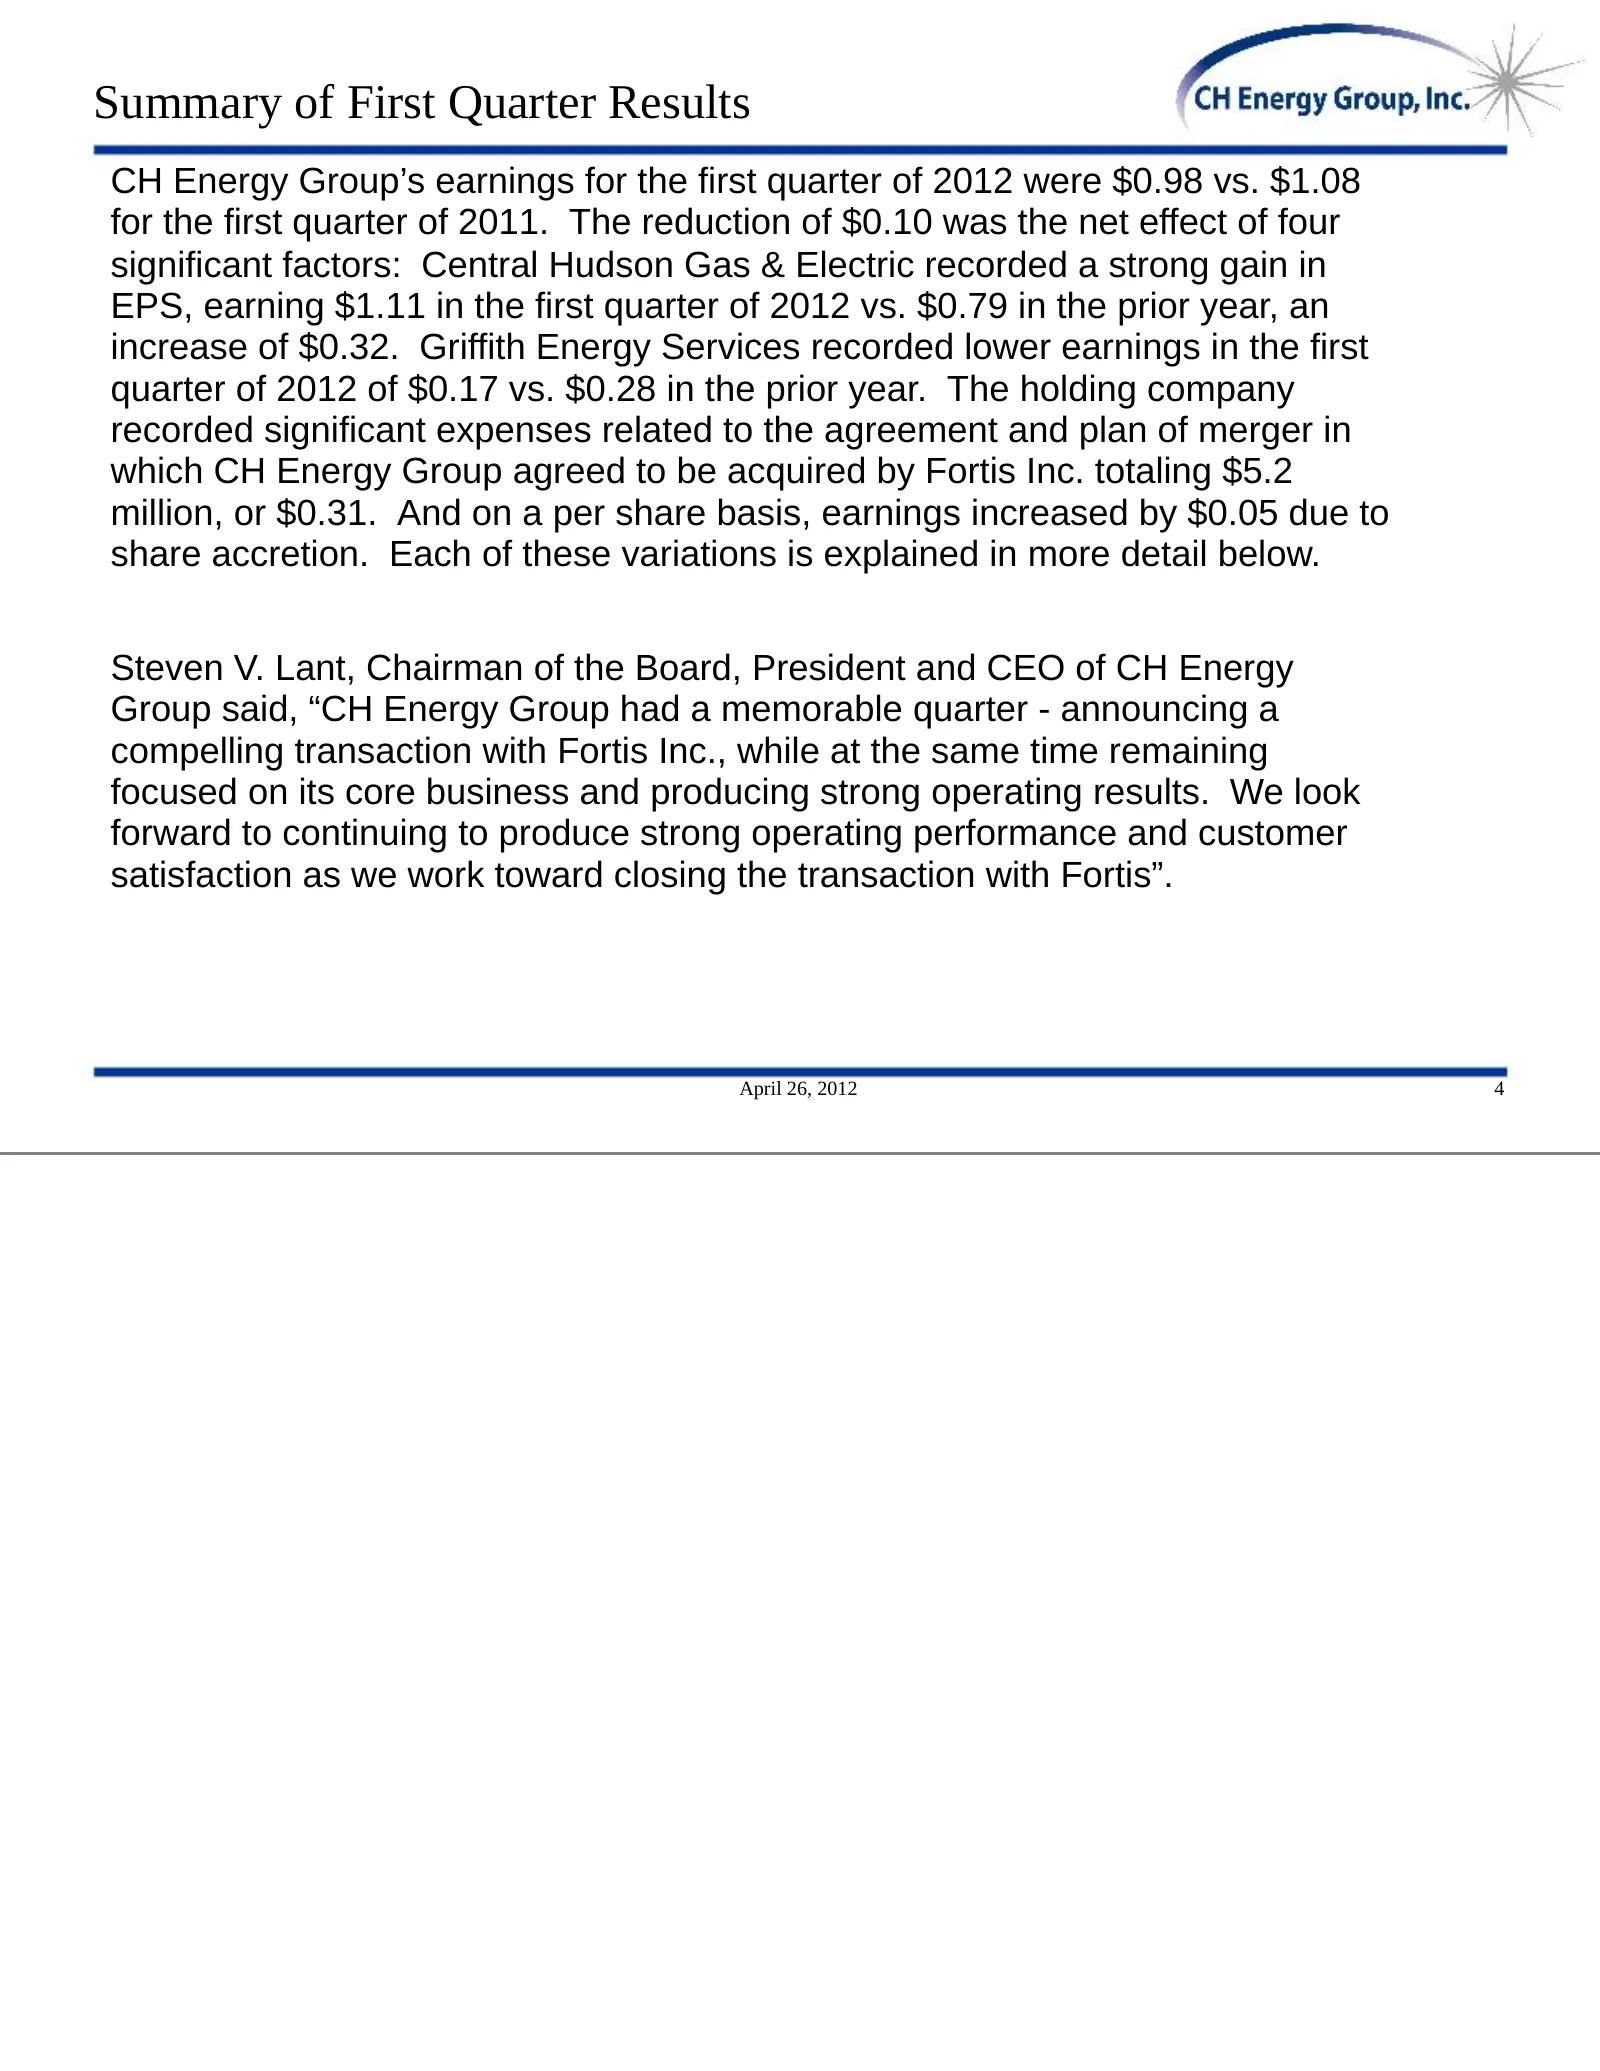
Summary of First Quarter Results CH Energy Group’s earnings for the first quarter of 2012 were $0.98 vs. $1.08 for the first quarter of 2011. The reduction of $0.10 was the net effect of four significant factors: Central Hudson Gas & Electric recorded a strong gain in EPS, earning $1.11 in the first
Slide 13: Information Regarding the Fortis Transaction
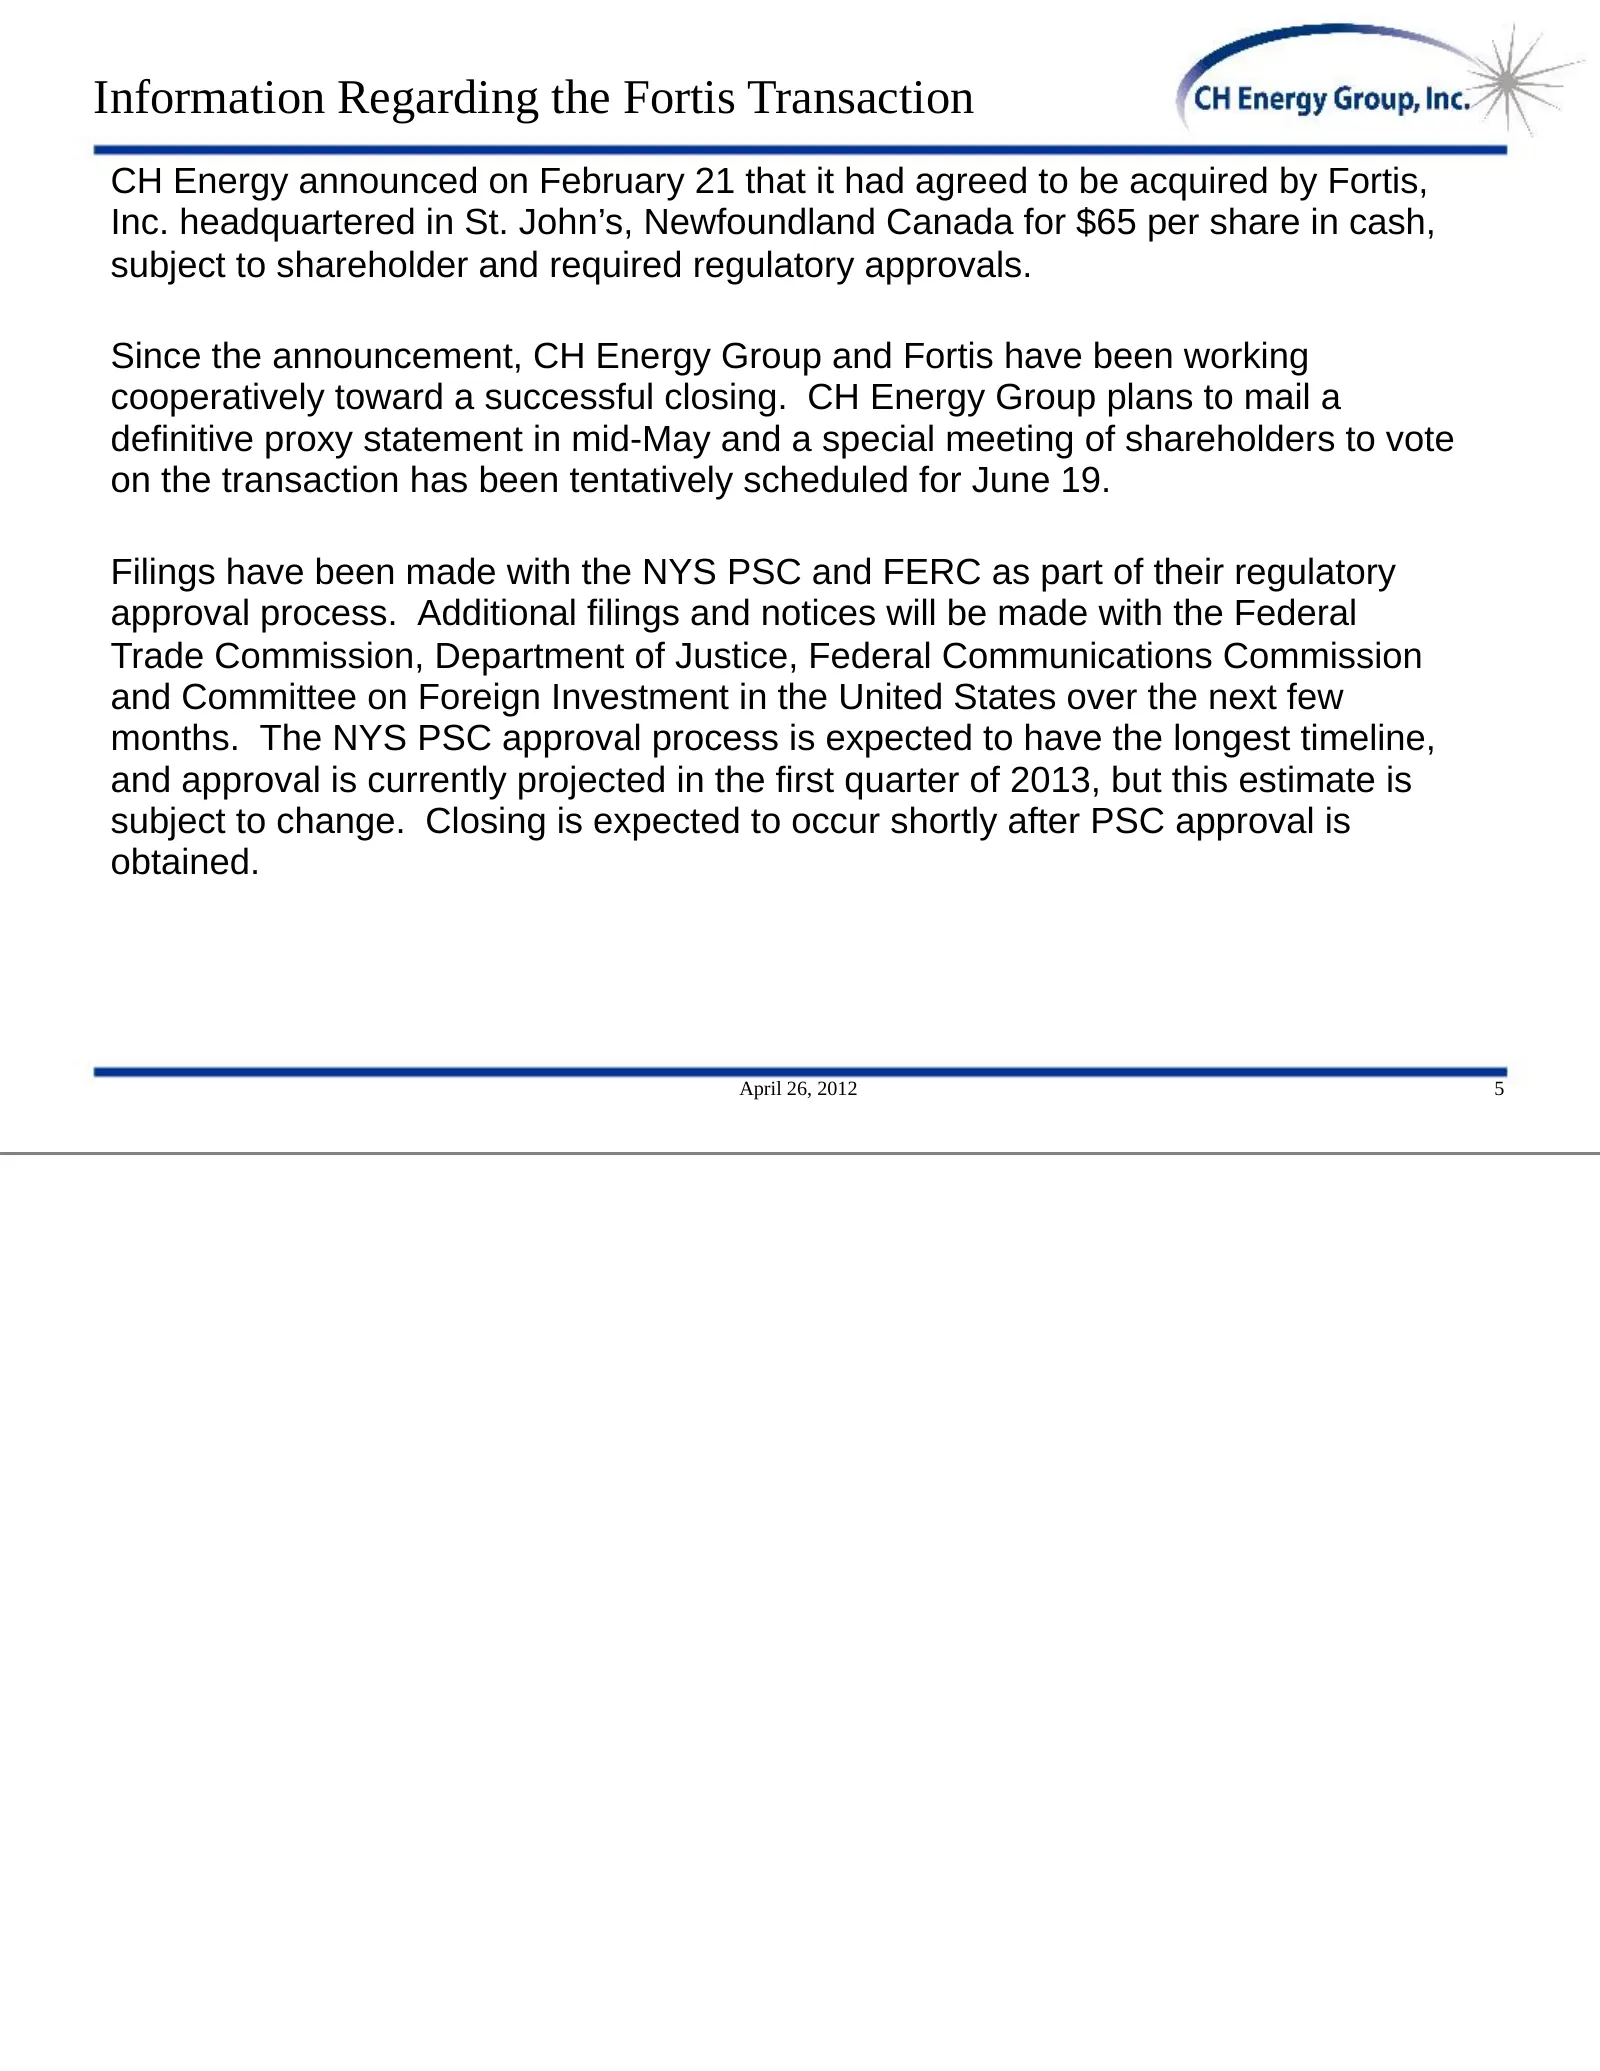
Information Regarding the Fortis Transaction CH Energy announced on February 21 that it had agreed to be acquired by Fortis, Inc. headquartered in St. John’s, Newfoundland Canada for $65 per share in cash, subject to shareholder and required regulatory approvals. Since the announcement, CH Energy Gr
Slide 14: Financial Results - CH Energy Group
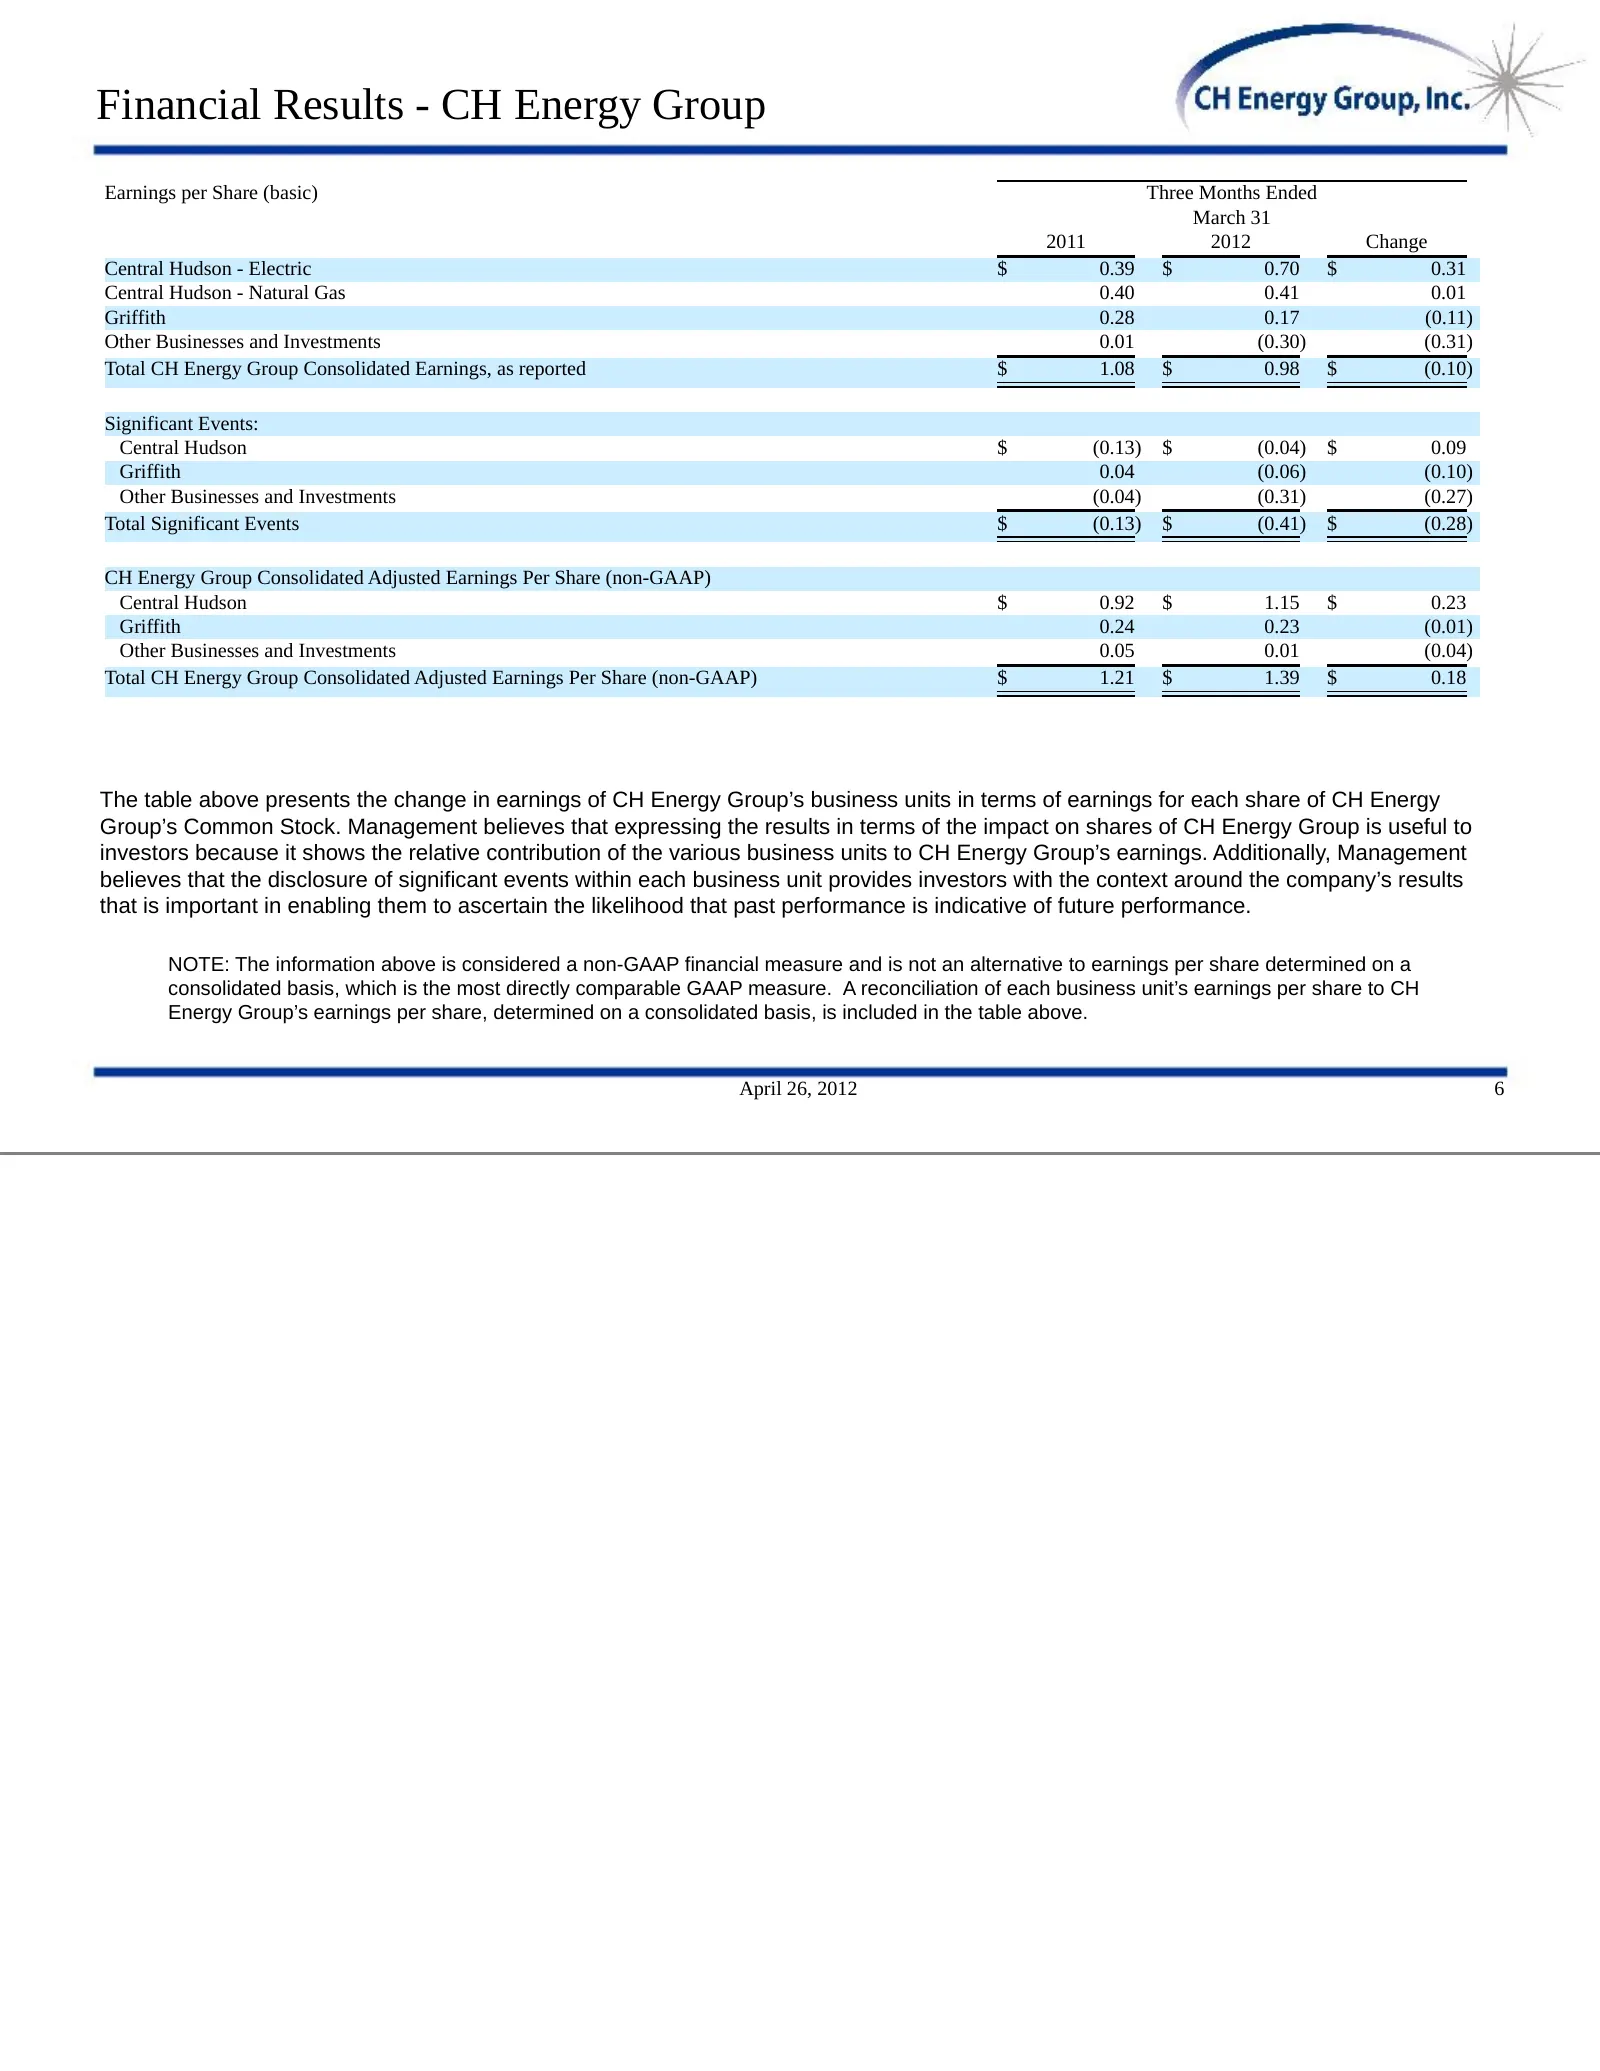
Financial Results - CH Energy Group Earnings per Share (basic) Three Months Ended March 31 2011 2012 Change Central Hudson - Electric $ 0.39 $ 0.70 $ 0.31 Central Hudson - Natural Gas 0.40 0.41 0.01 Griffith 0.28 0.17 (0.11) Other Businesses and Investments 0.01 (0.30) (0.31) Total CH Energy Group C
Slide 15: Financial Results - CH Energy Group
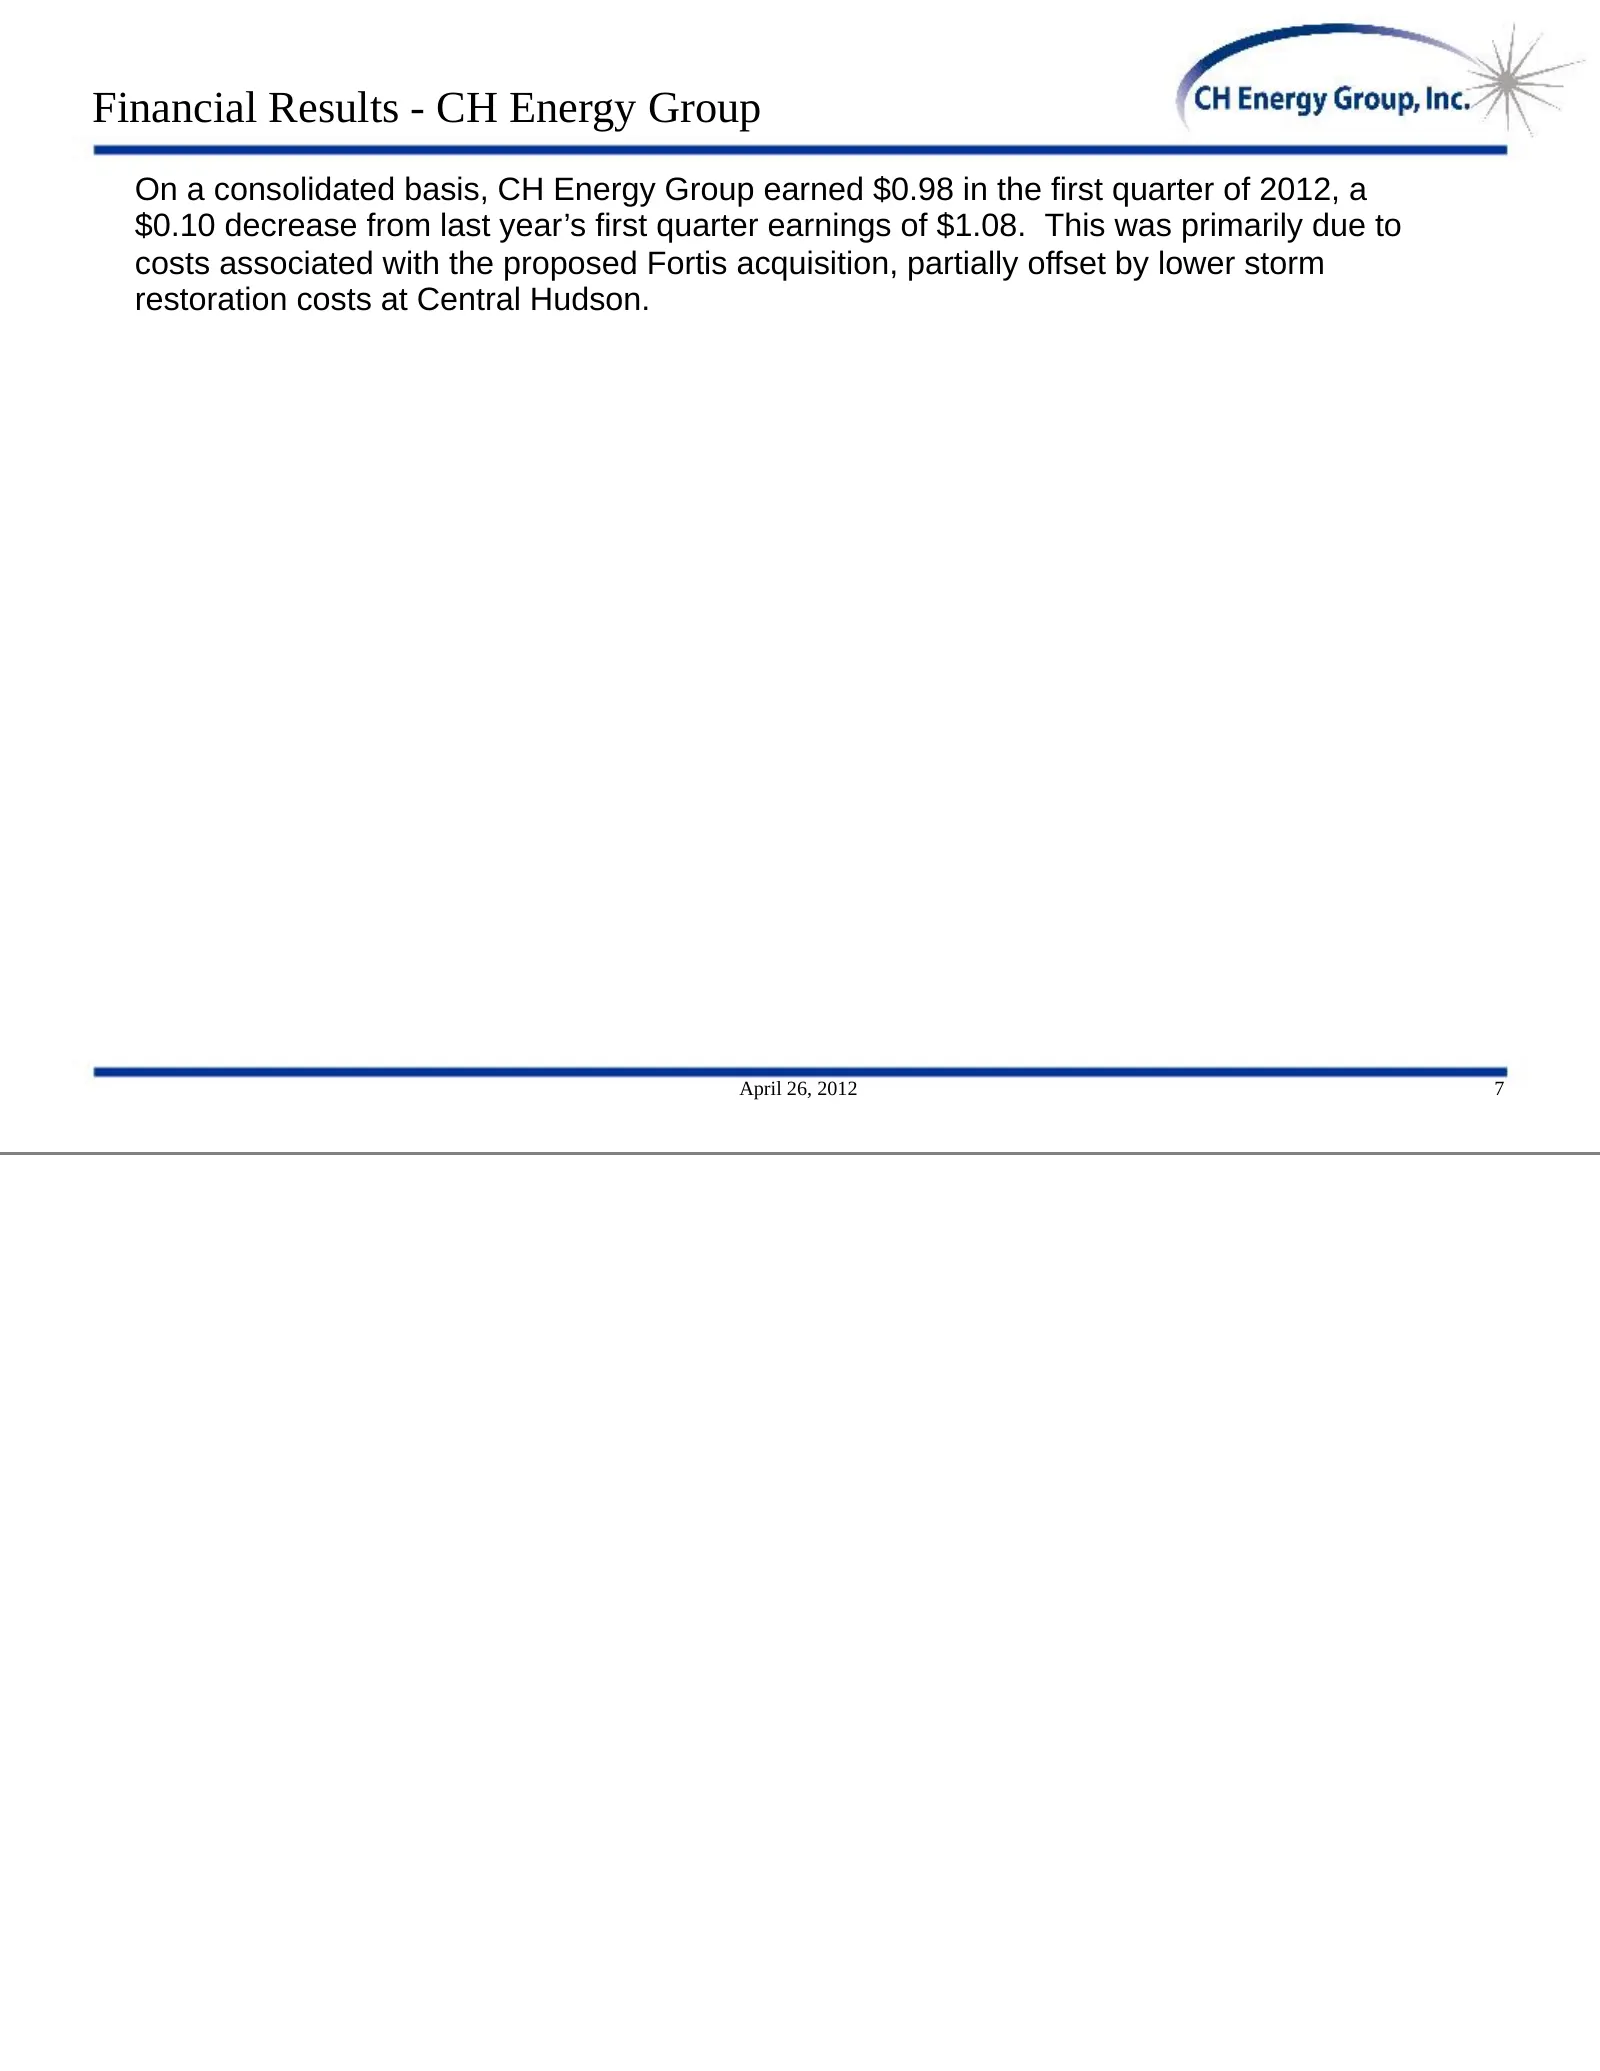
Financial Results - CH Energy Group On a consolidated basis, CH Energy Group earned $0.98 in the first quarter of 2012, a $0.10 decrease from last year’s first quarter earnings of $1.08. This was primarily due to costs associated with the proposed Fortis acquisition, partially offset by lower storm
Slide 16: Financial Results - Central Hudson
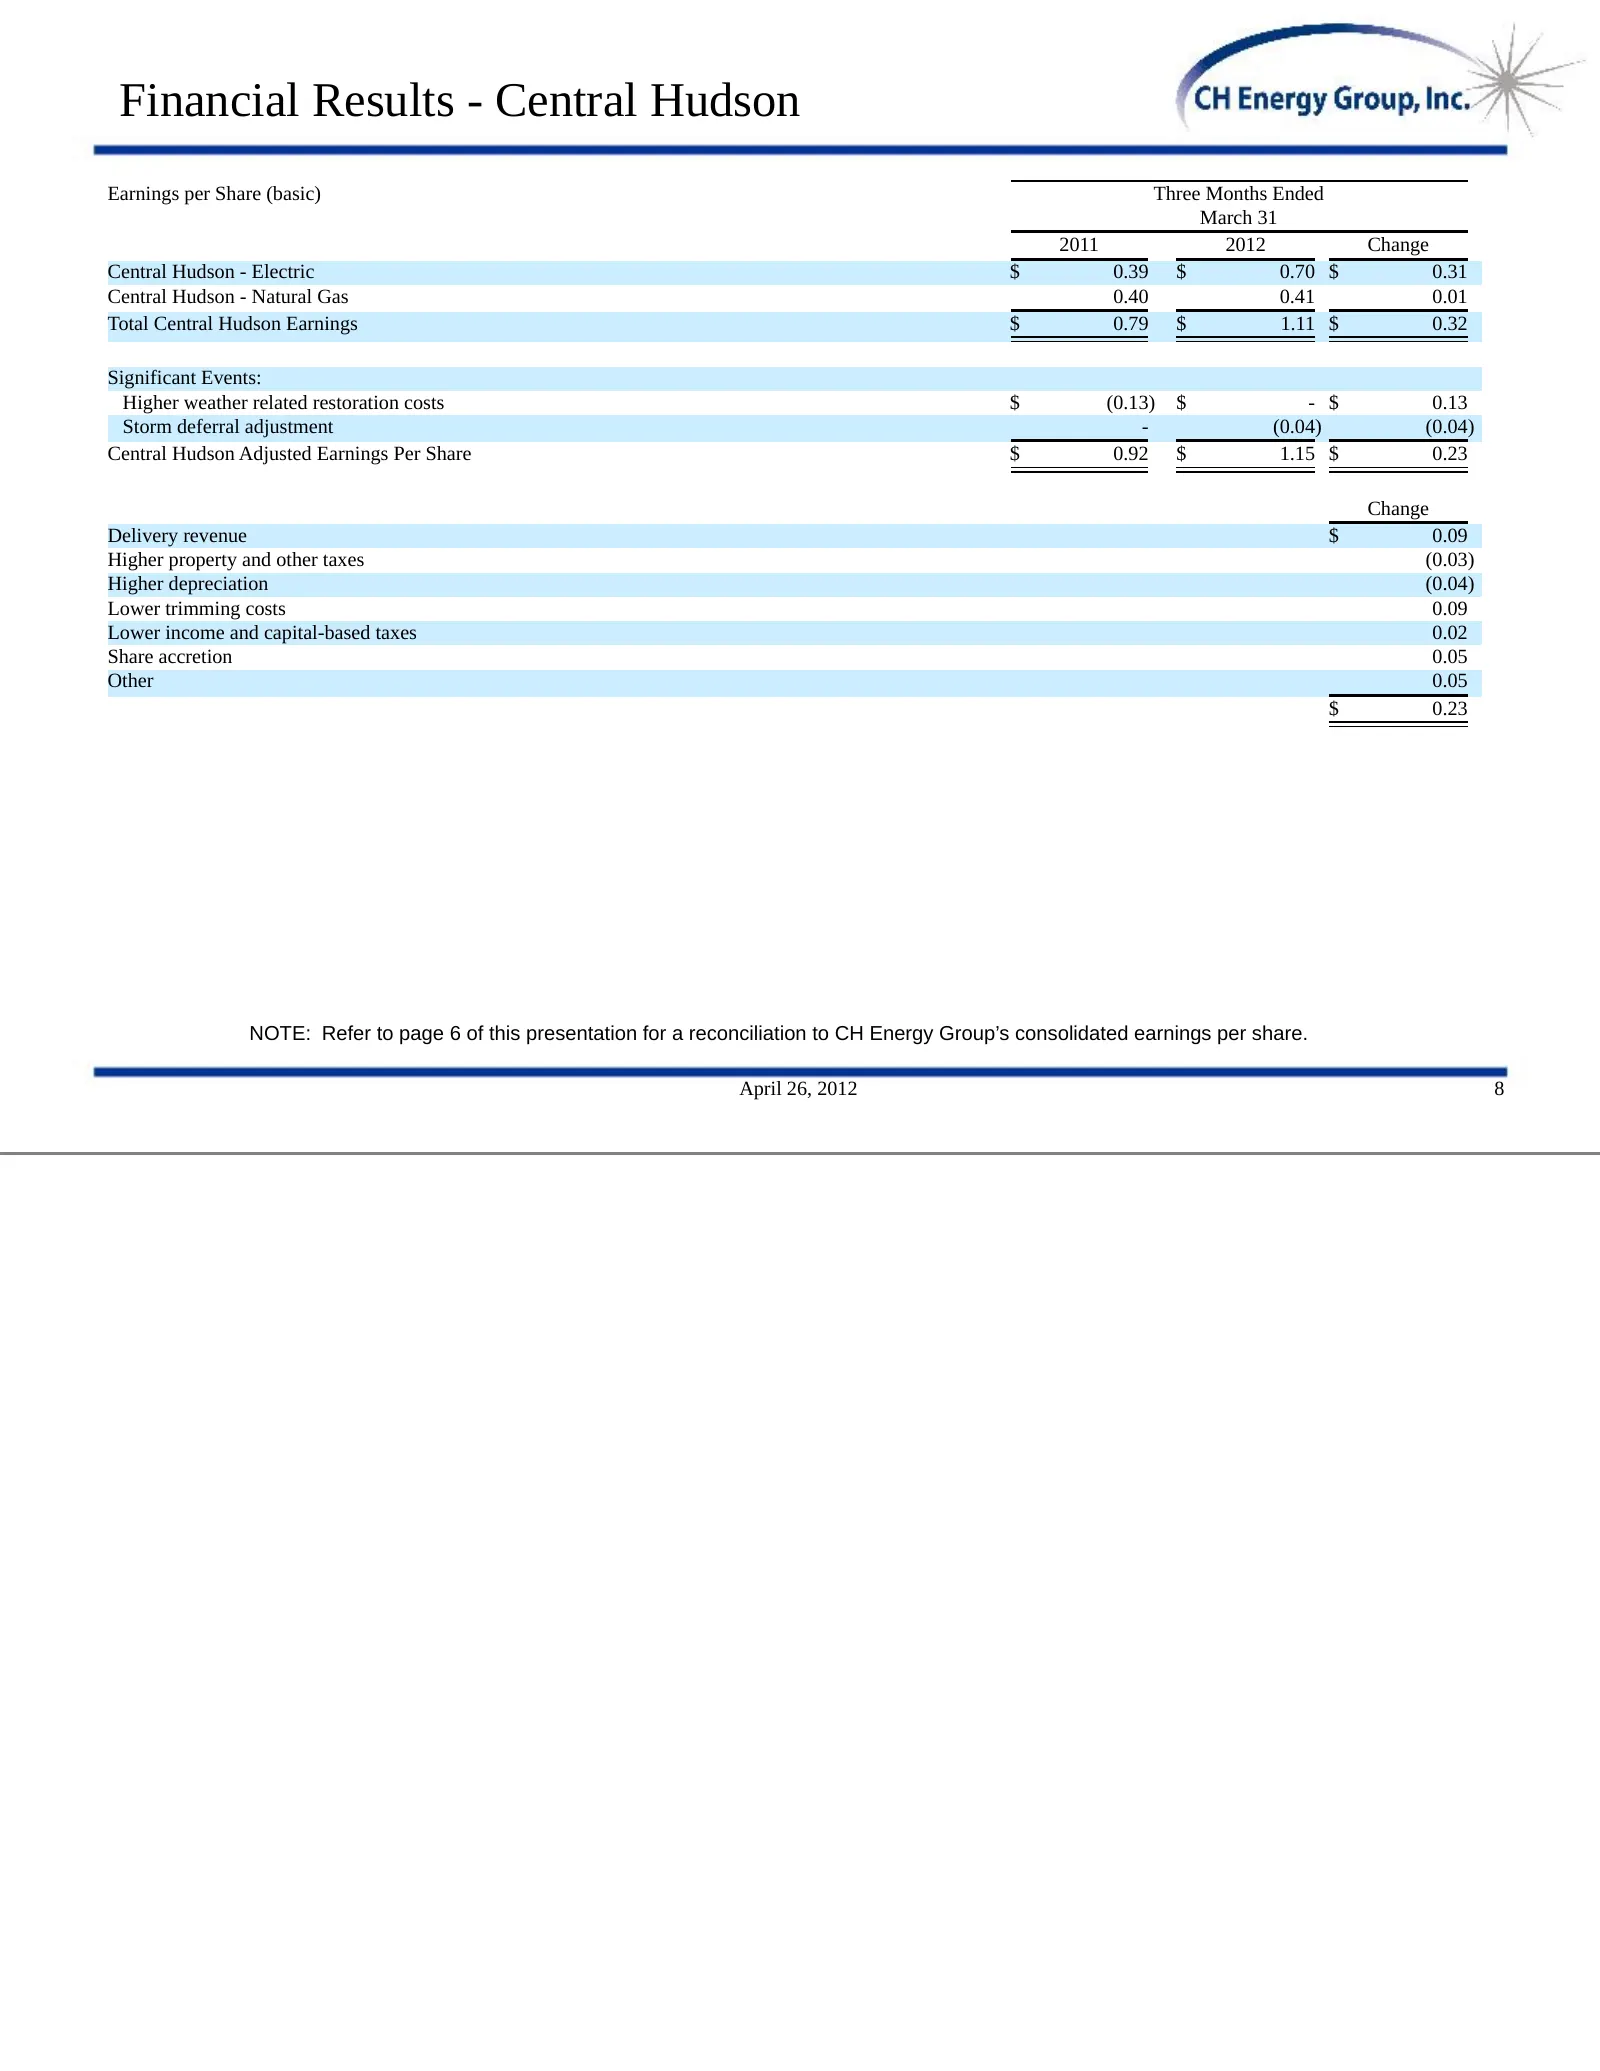
Financial Results - Central Hudson Earnings per Share (basic) Three Months Ended March 31 2011 2012 Change Central Hudson - Electric $ 0.39 $ 0.70 $ 0.31 Central Hudson - Natural Gas 0.40 0.41 0.01 Total Central Hudson Earnings $ 0.79 $ 1.11 $ 0.32 Significant Events: Higher weather related restorat
Slide 17: Financial Results - Central Hudson
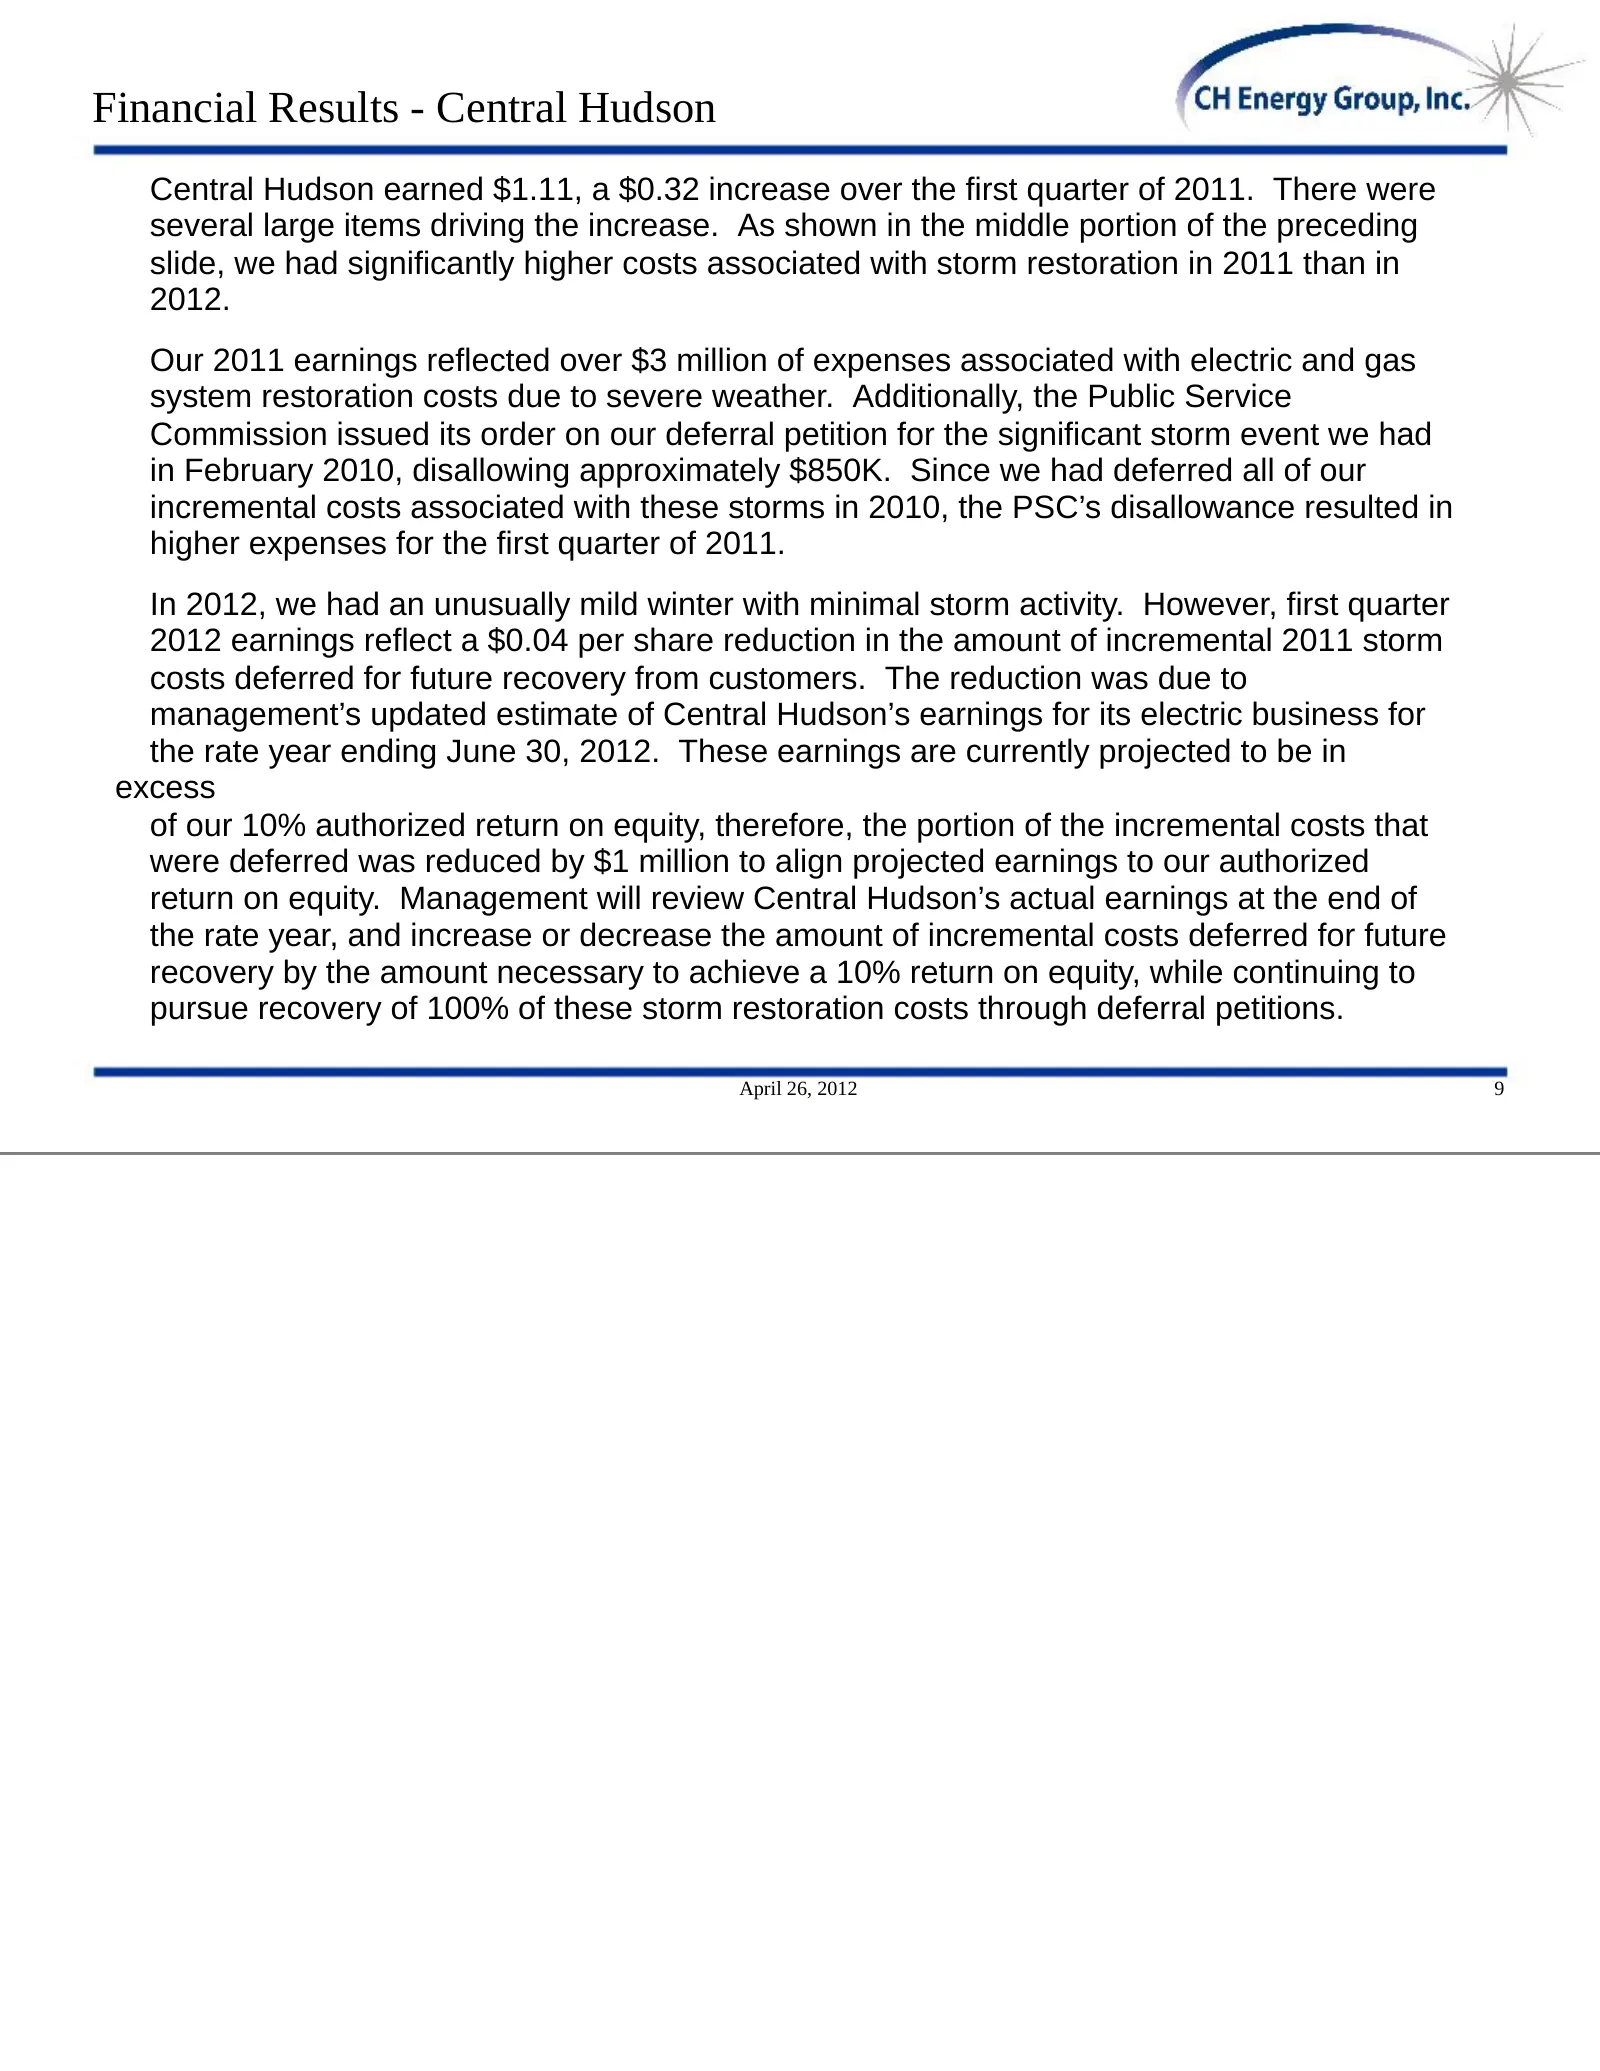
Financial Results - Central Hudson Central Hudson earned $1.11, a $0.32 increase over the first quarter of 2011. There were several large items driving the increase. As shown in the middle portion of the preceding slide, we had significantly higher costs associated with storm restoration in 2011 tha
Slide 18: Financial Results - Central Hudson
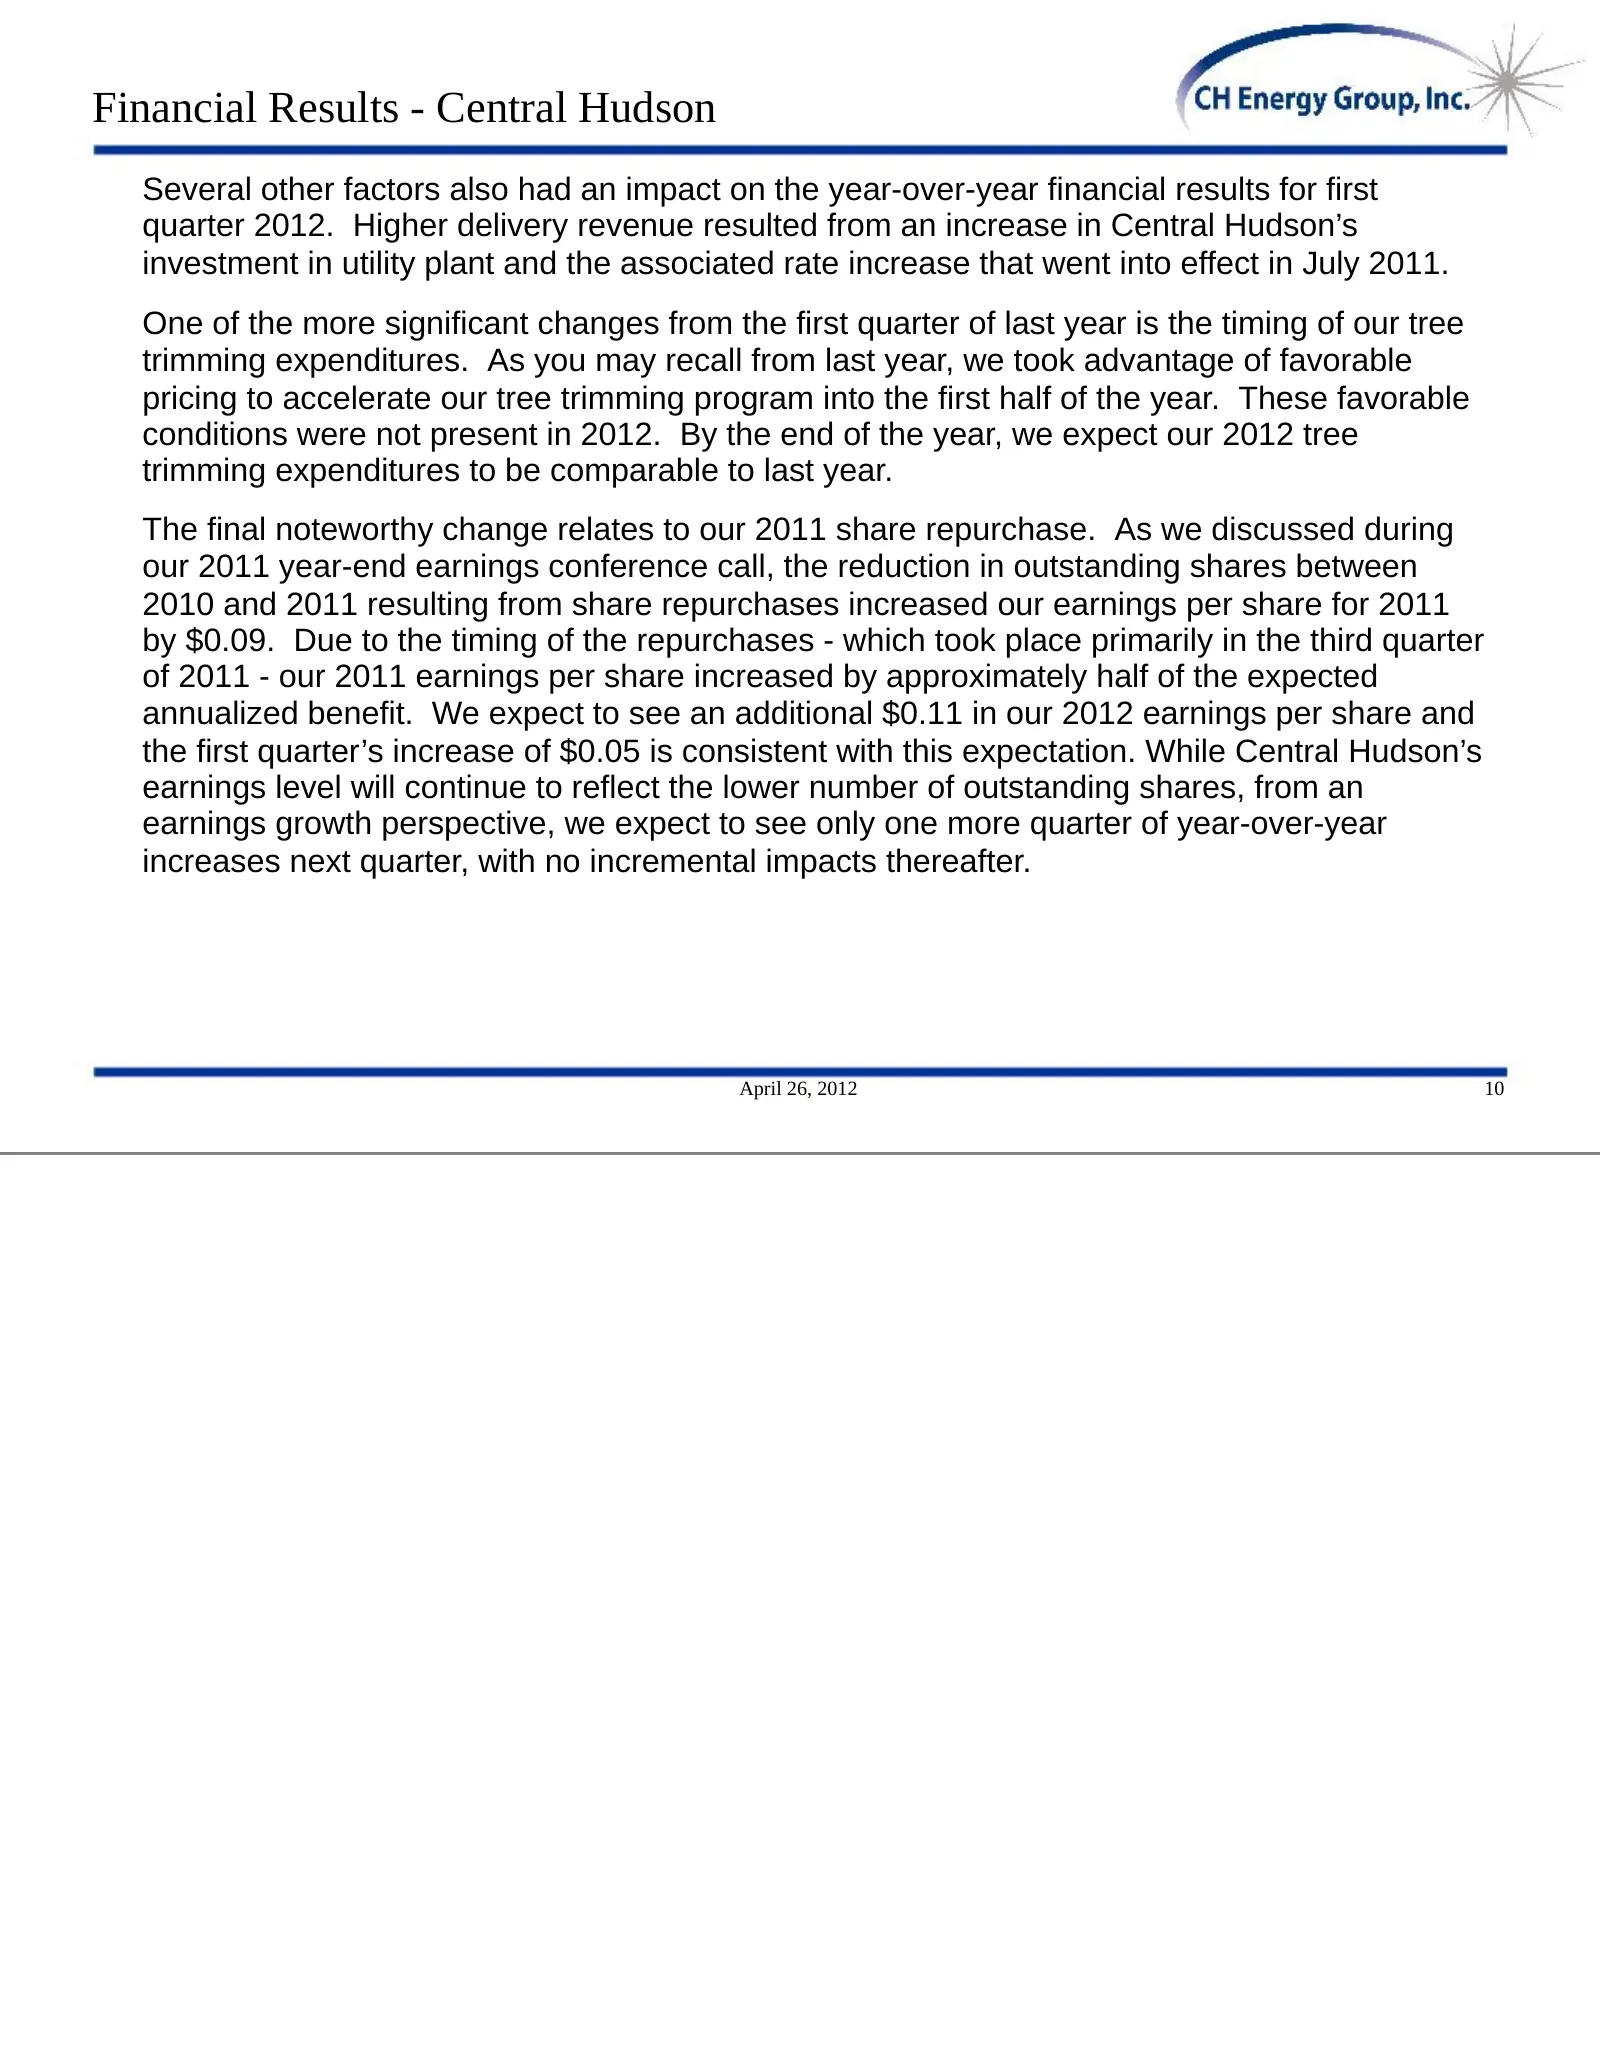
Financial Results - Central Hudson Several other factors also had an impact on the year-over-year financial results for first quarter 2012. Higher delivery revenue resulted from an increase in Central Hudson’s investment in utility plant and the associated rate increase that went into effect in July
Slide 19: Financial Results - Griffith
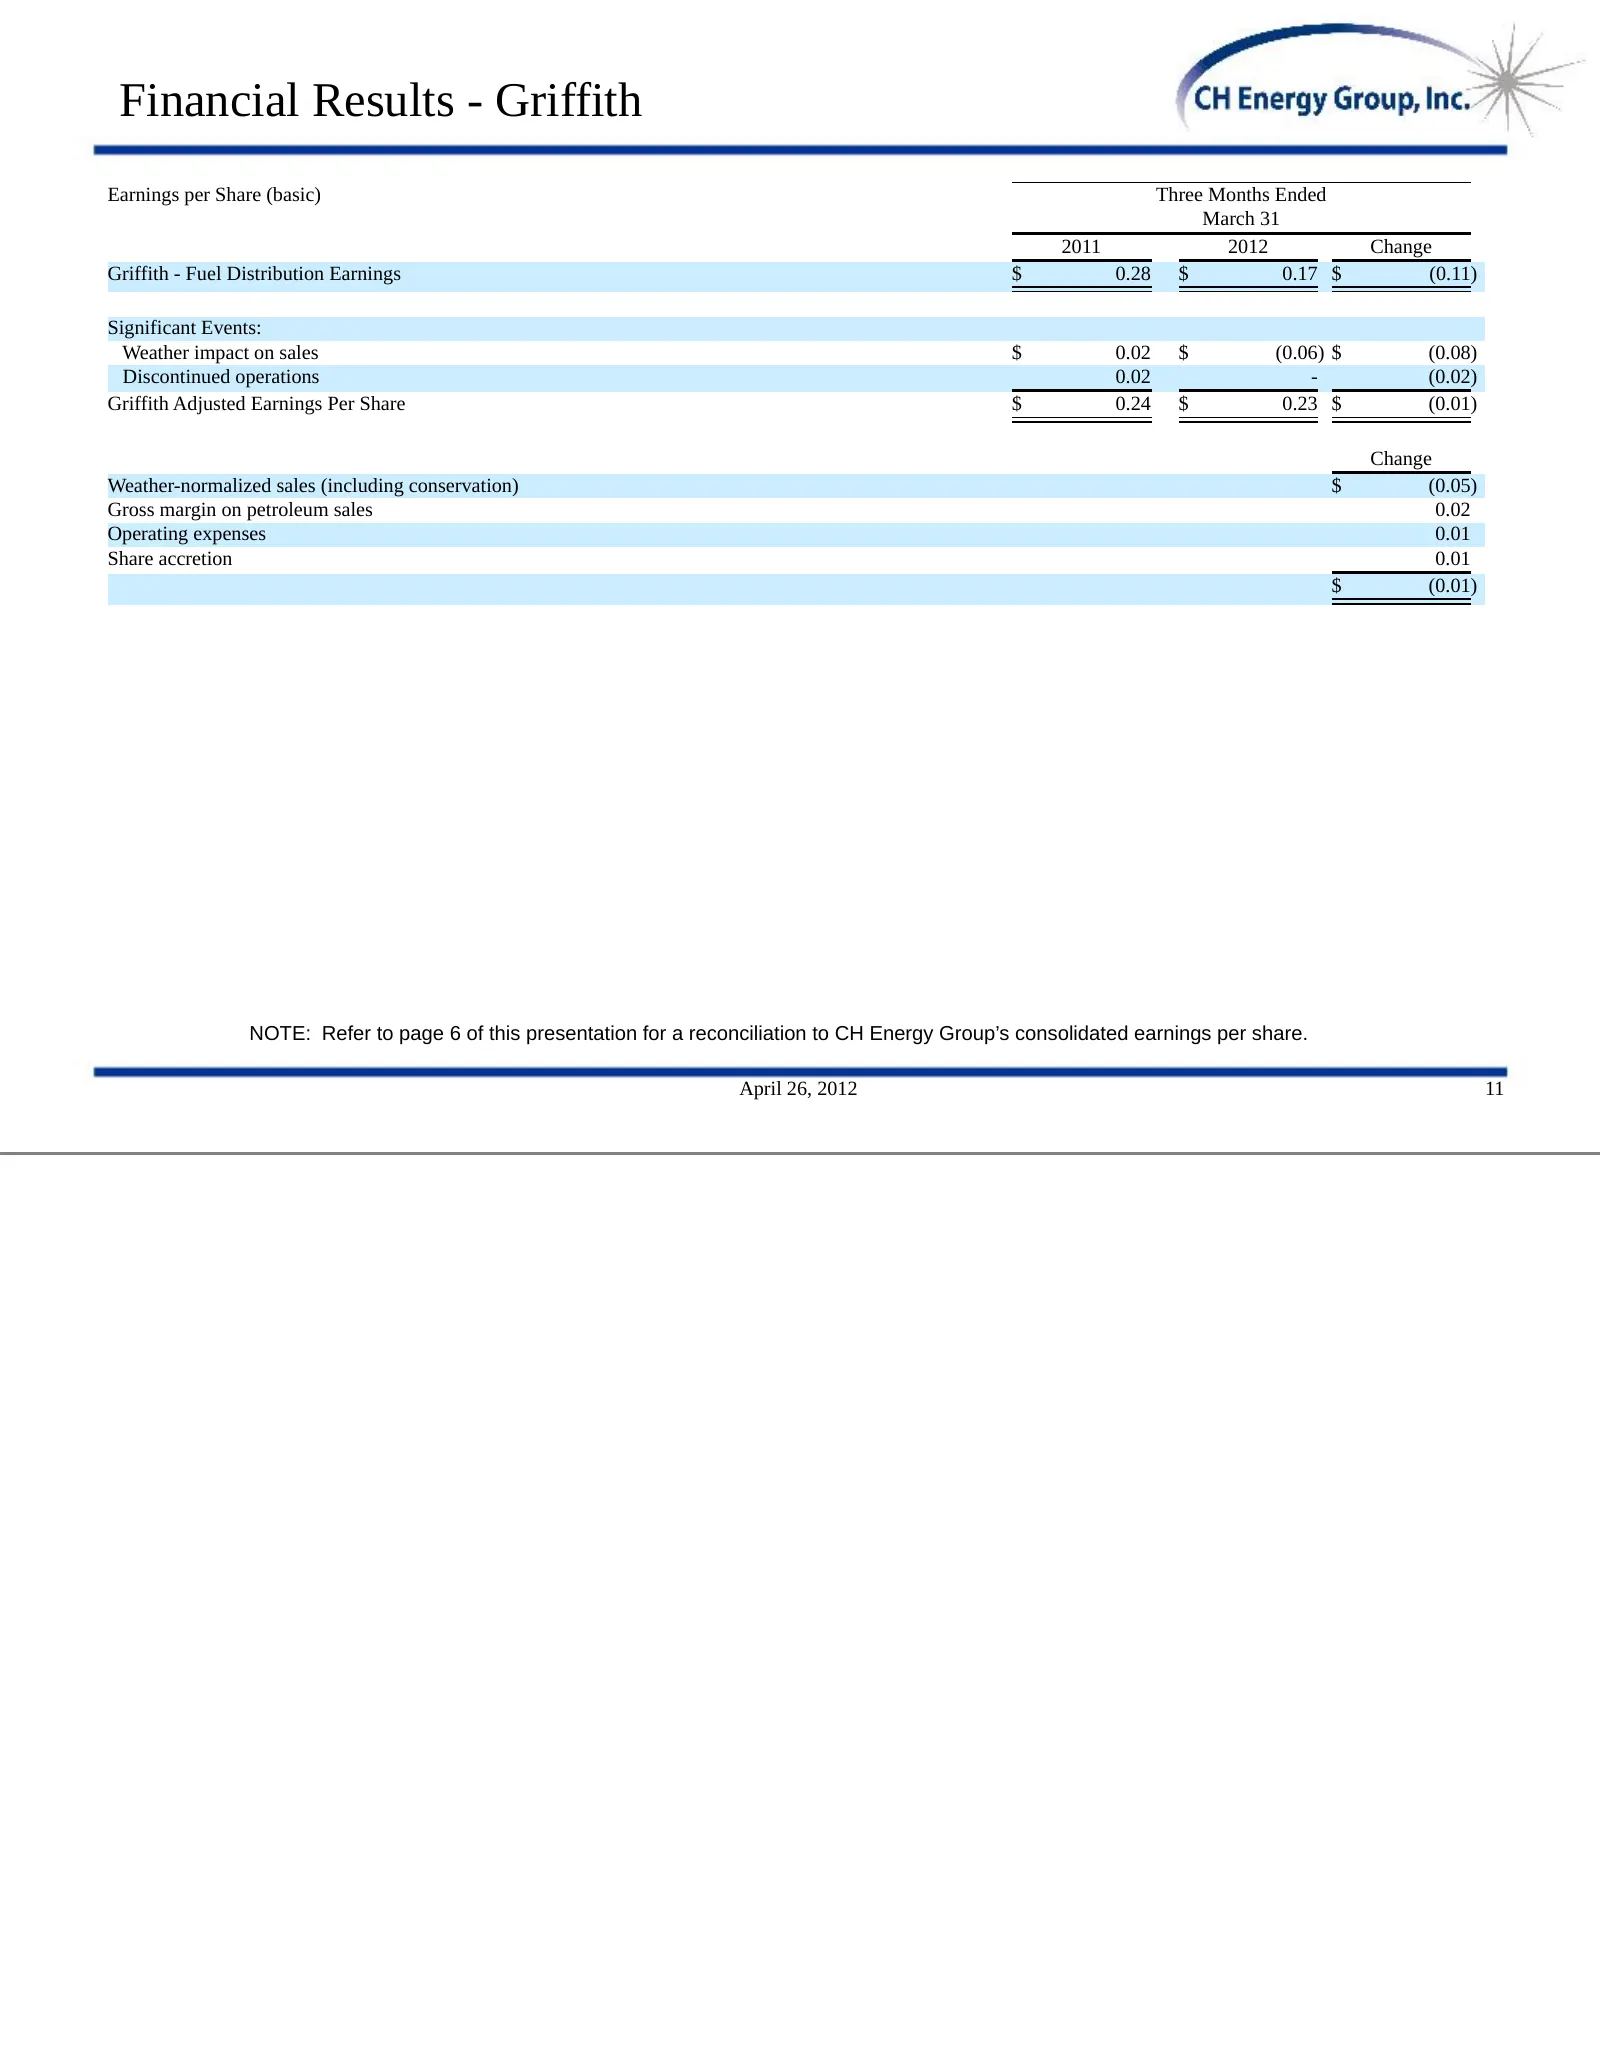
Financial Results - Griffith Earnings per Share (basic) Three Months Ended March 31 2011 2012 Change Griffith - Fuel Distribution Earnings $ 0.28 $ 0.17 $ (0.11) Significant Events: Weather impact on sales $ 0.02 $ (0.06) $ (0.08) Discontinued operations 0.02 - (0.02) Griffith Adjusted Earnings Per
Slide 20: Financial Results - Griffith
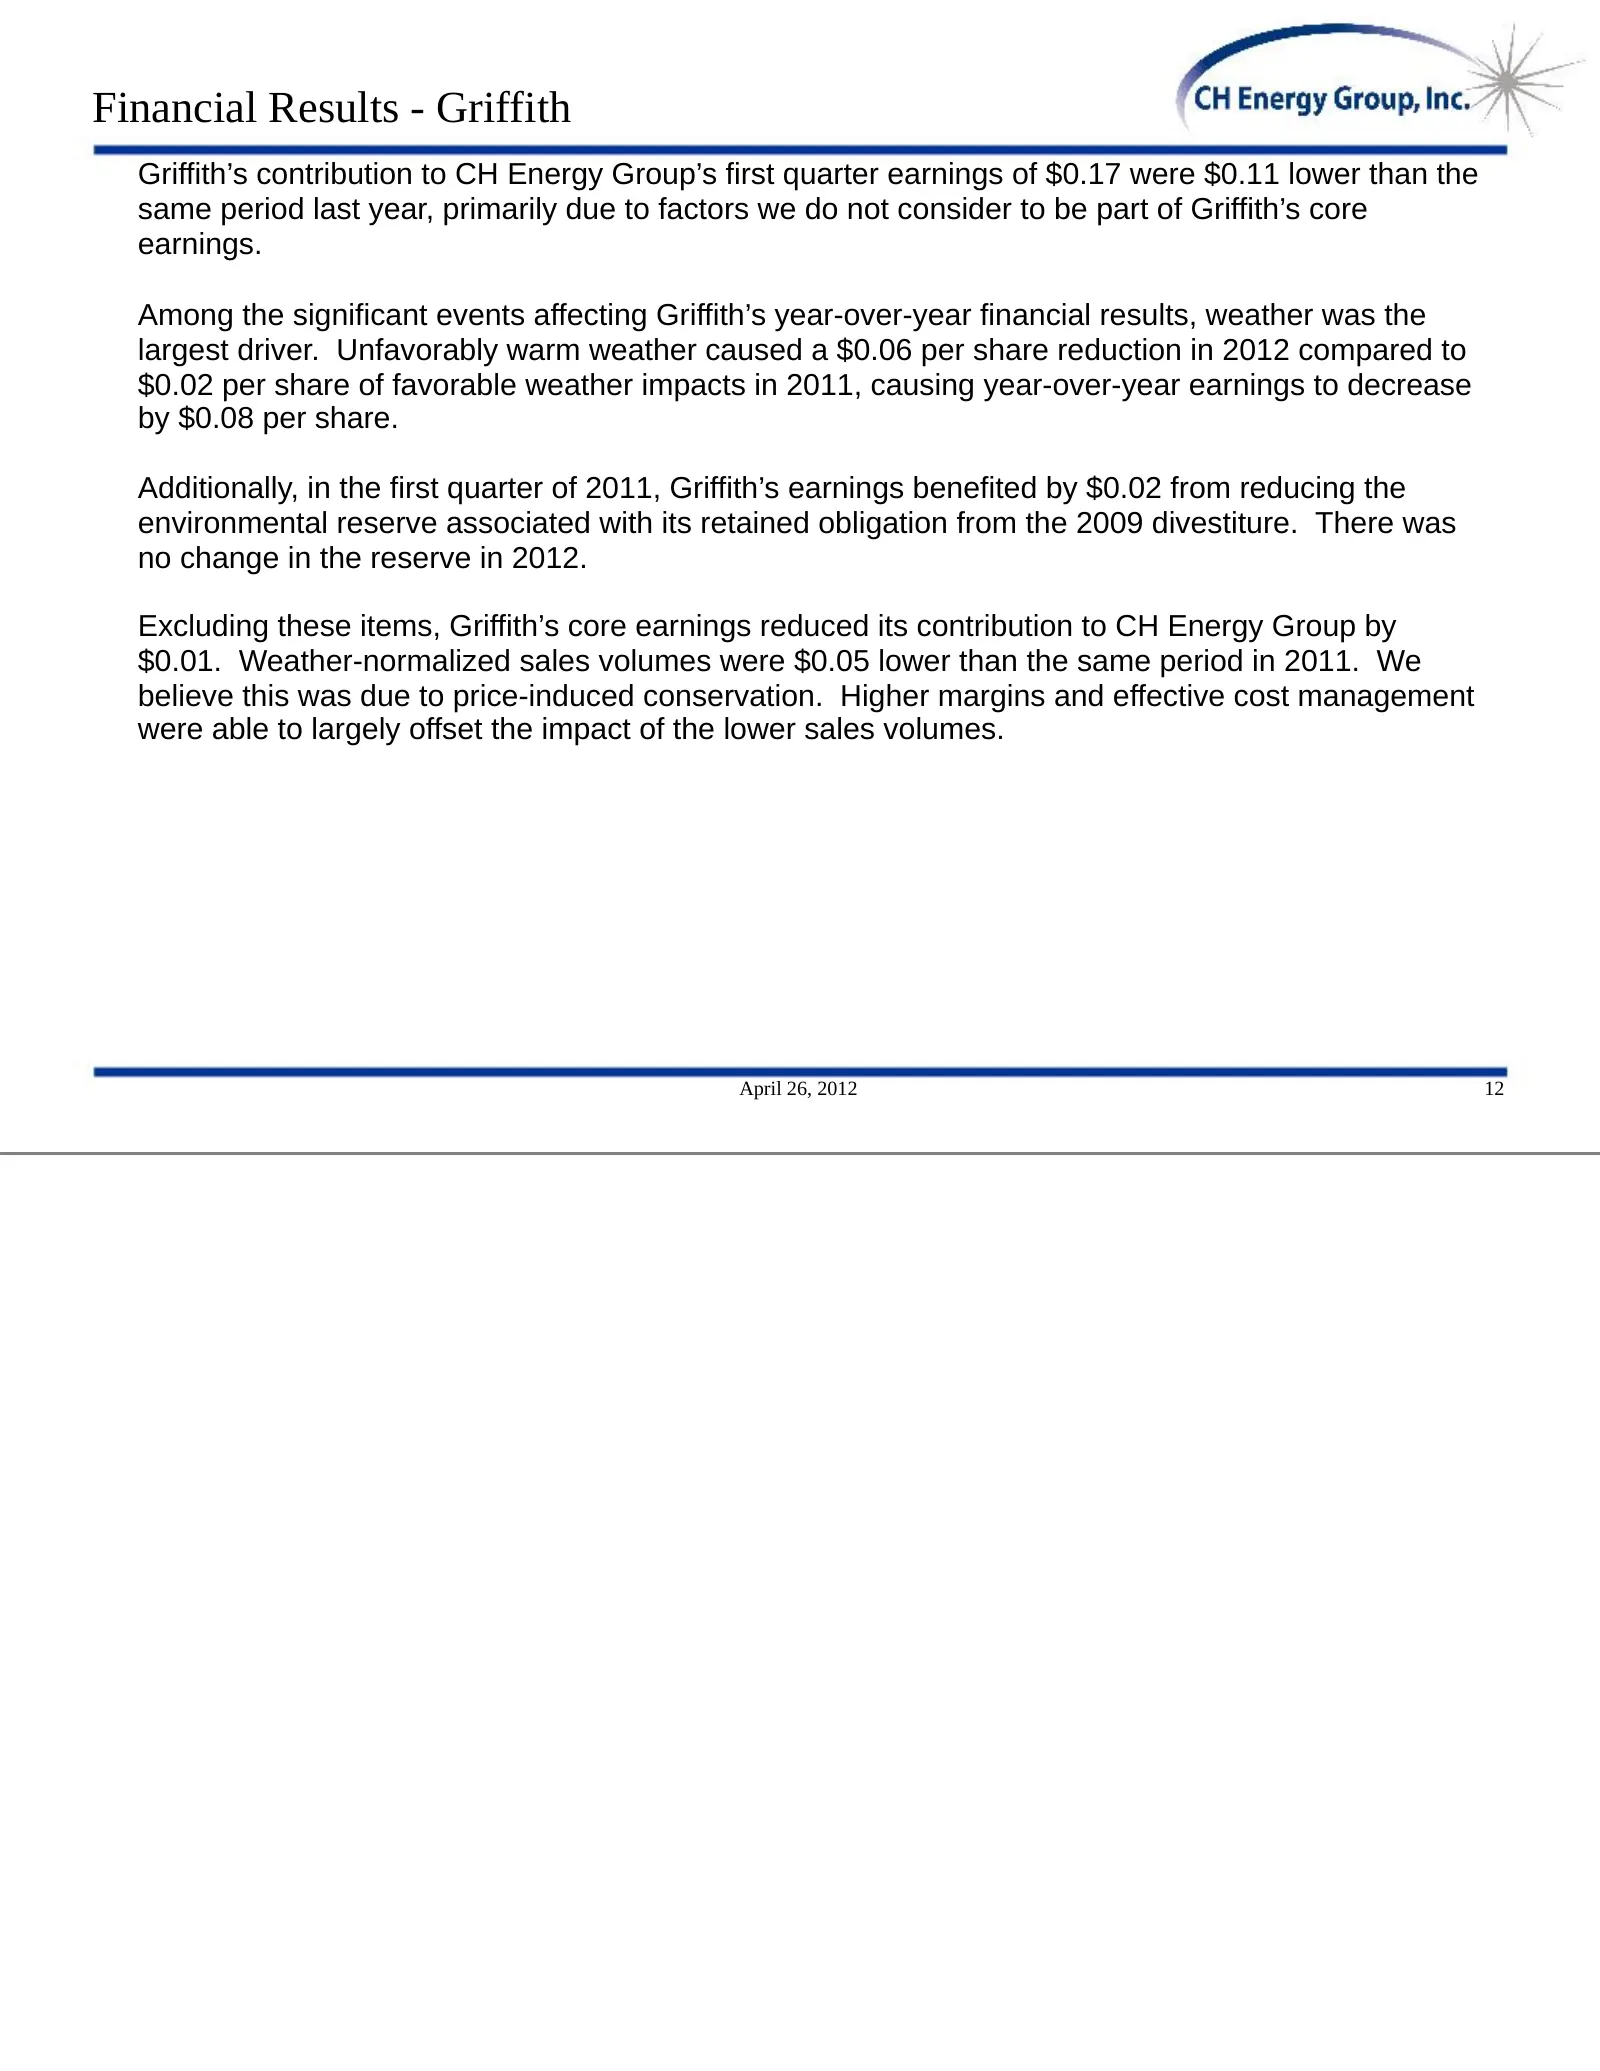
Financial Results - Griffith Griffith’s contribution to CH Energy Group’s first quarter earnings of $0.17 were $0.11 lower than the same period last year, primarily due to factors we do not consider to be part of Griffith’s core earnings. Among the significant events affecting Griffith’s year-over-y
Slide 21: Financial Results - Other Businesses & Investments
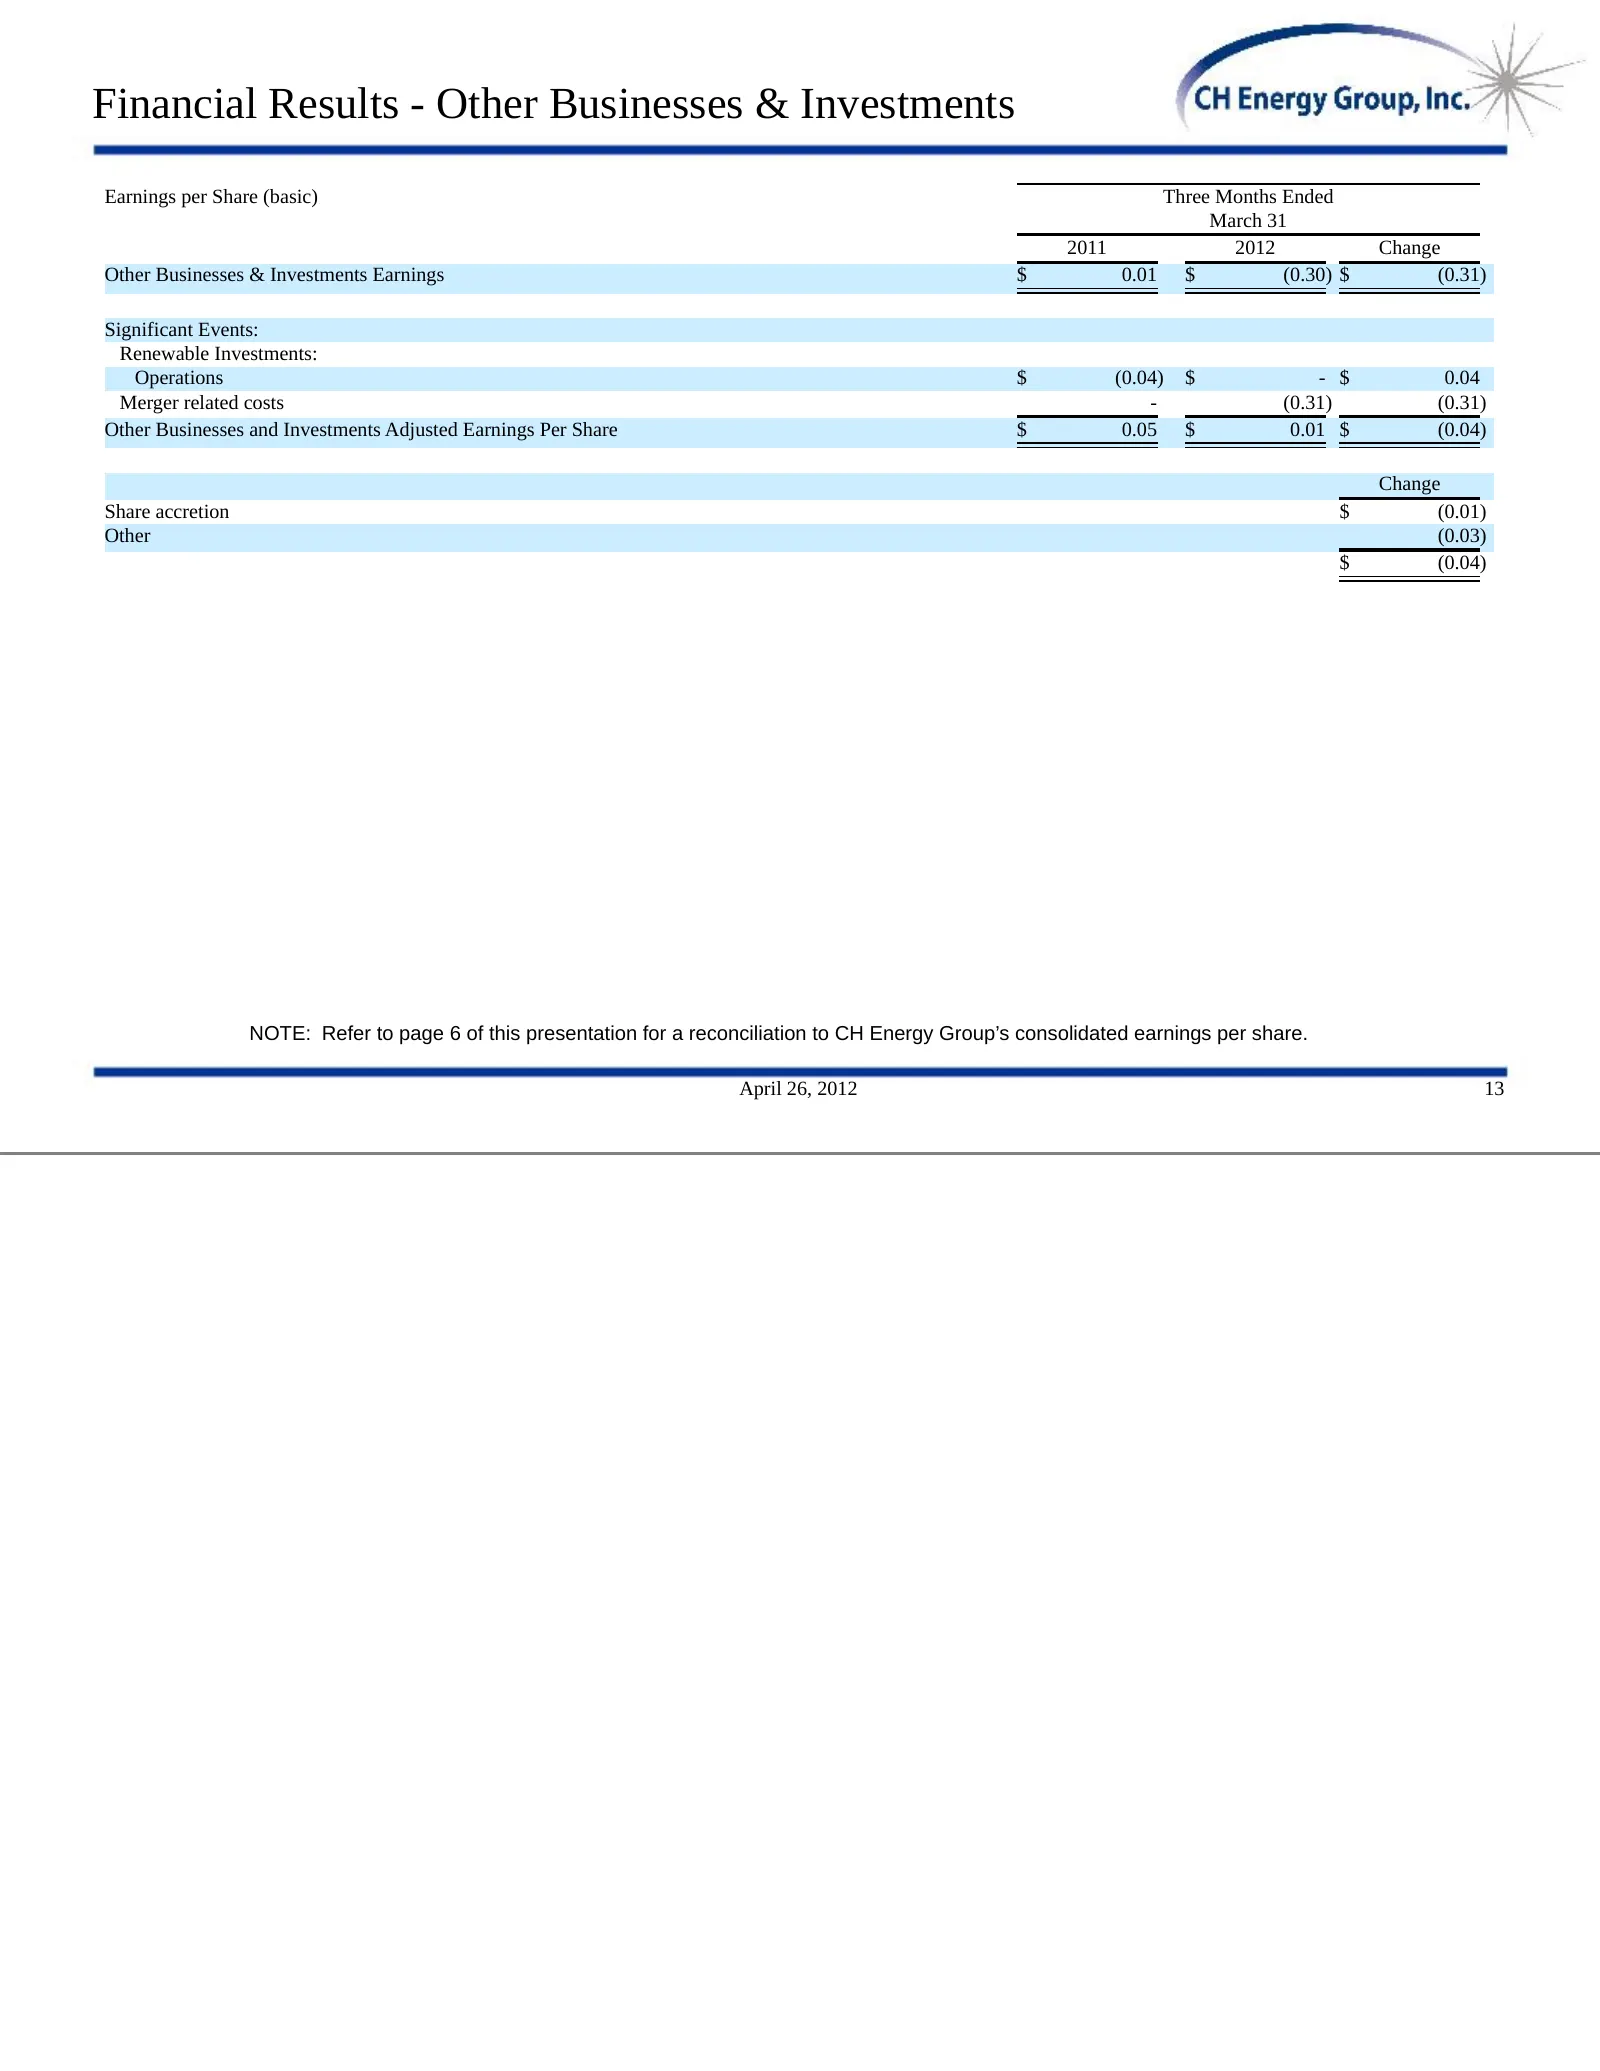
Financial Results - Other Businesses & Investments Earnings per Share (basic) Three Months Ended March 31 2011 2012 Change Other Businesses & Investments Earnings $ 0.01 $ (0.30) $ (0.31) Significant Events: Renewable Investments: Operations $ (0.04) $ - $ 0.04 Merger related costs - (0.31) (0.31) O
Slide 22: Financial Results - Other Businesses and Investments
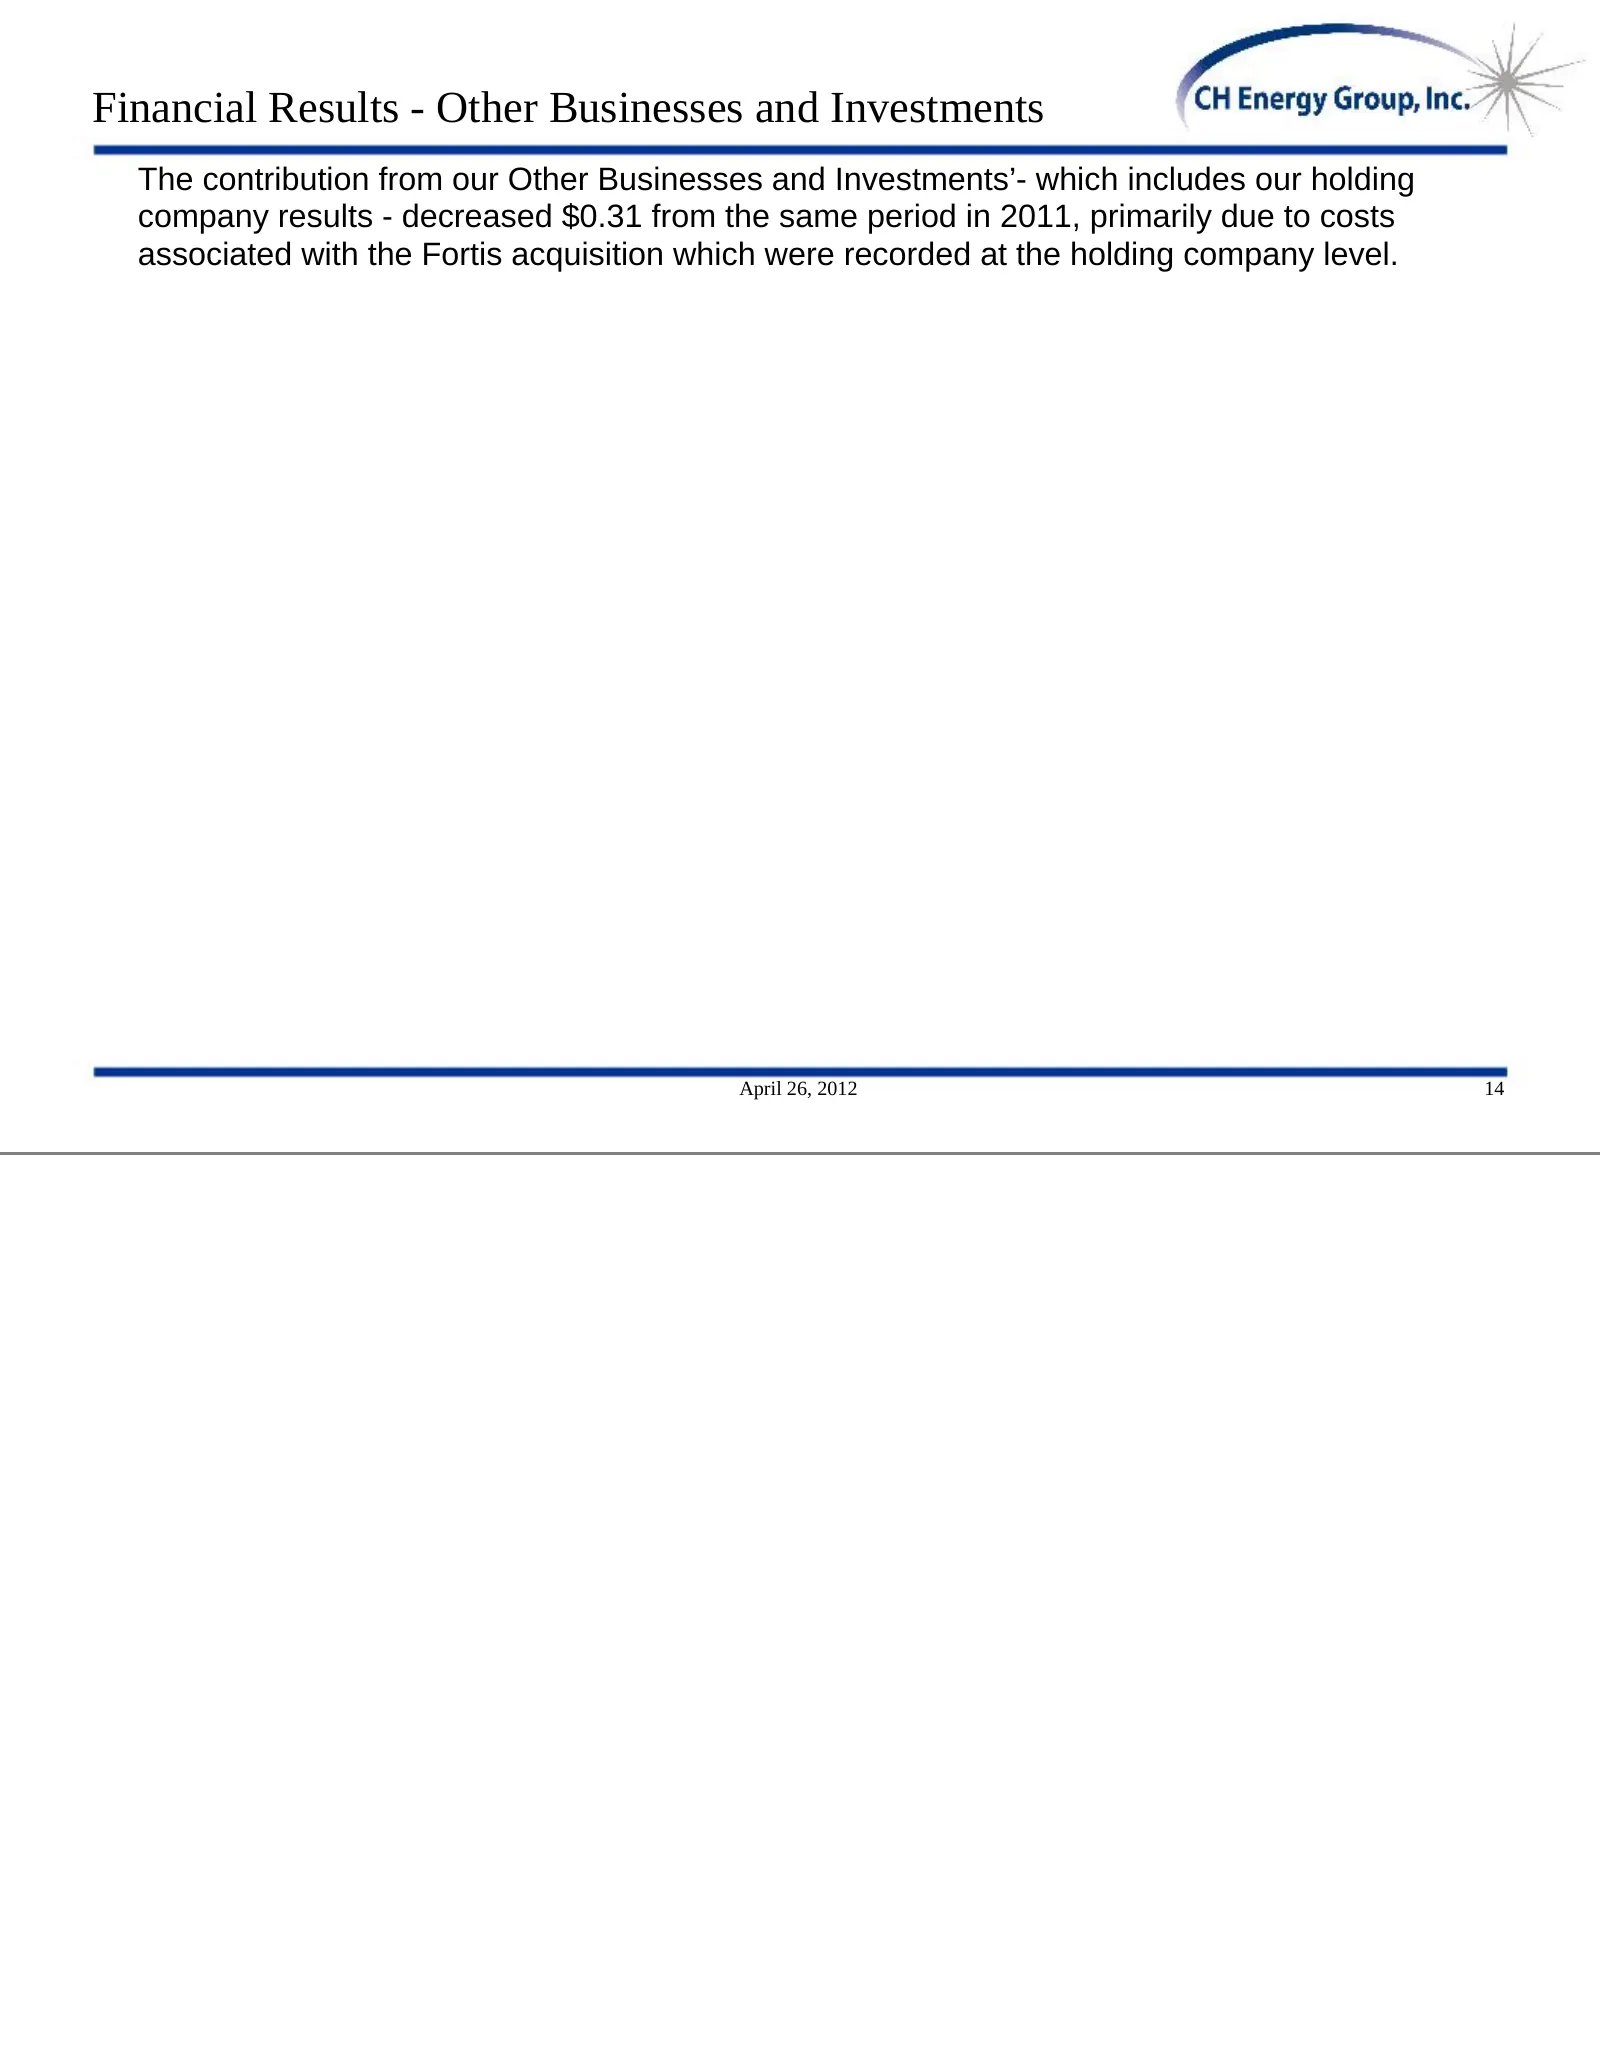
Financial Results - Other Businesses and Investments The contribution from our Other Businesses and Investments’- which includes our holding company results - decreased $0.31 from the same period in 2011, primarily due to costs associated with the Fortis acquisition which were recorded at the holdin
Slide 23: Comments on Business Conditions, Strategy and Outlook
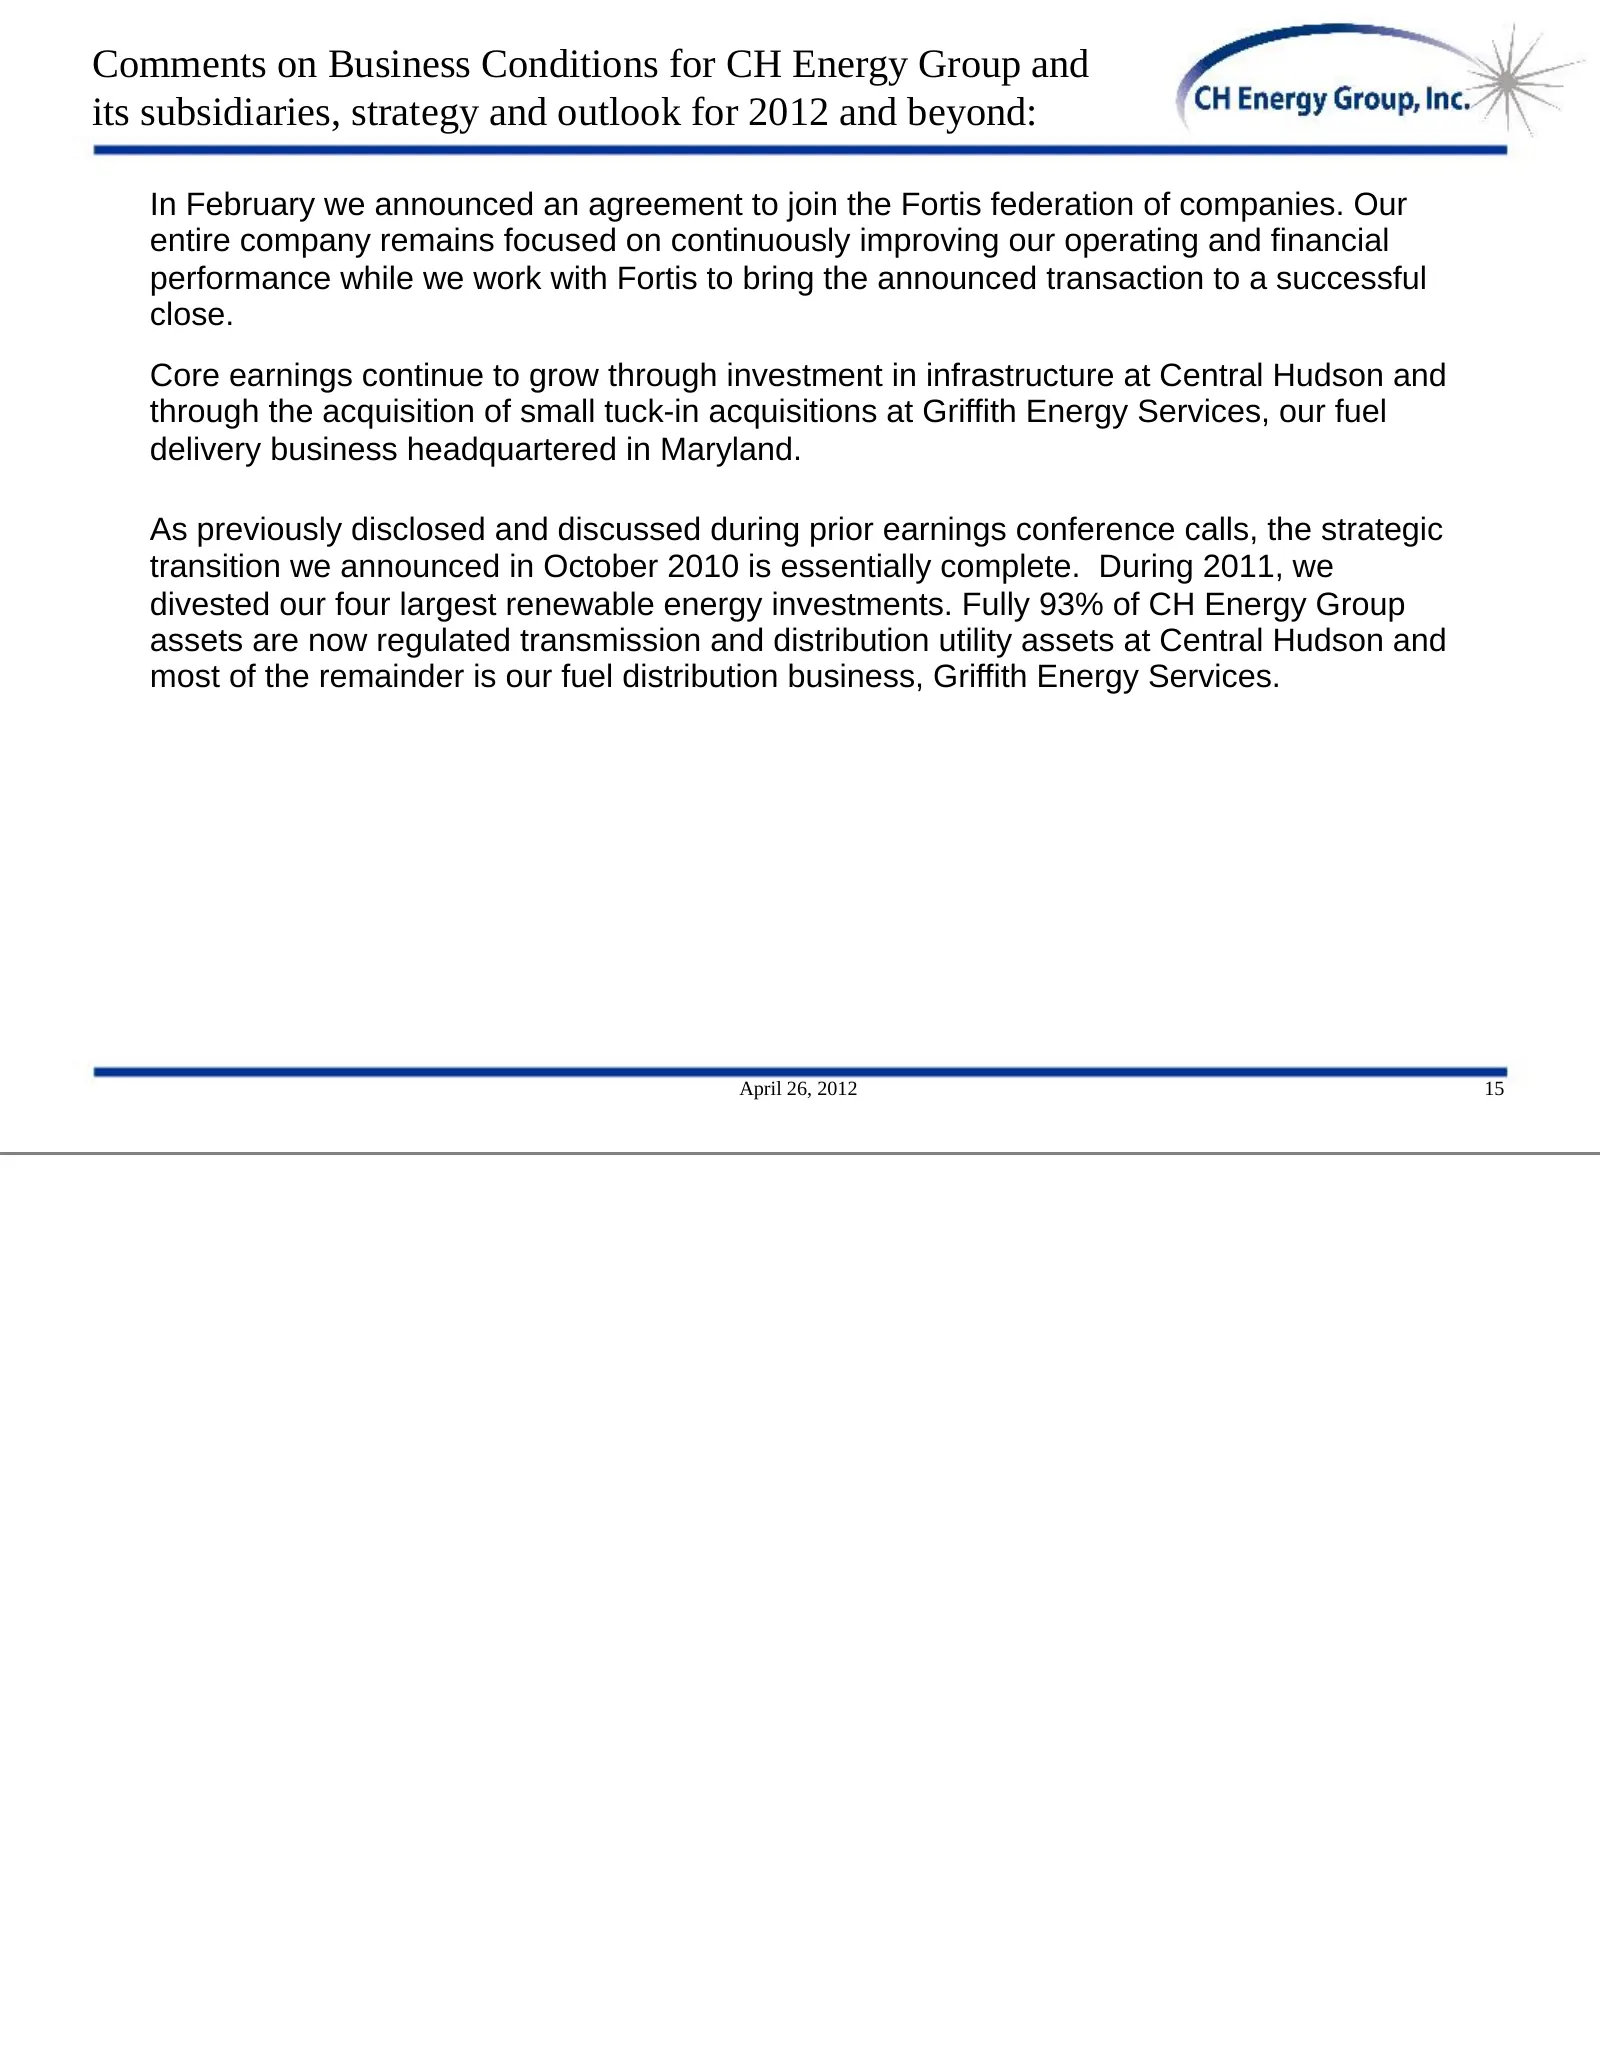
Comments on Business Conditions for CH Energy Group and its subsidiaries, strategy and outlook for 2012 and beyond: In February we announced an agreement to join the Fortis federation of companies. Our entire company remains focused on continuously improving our operating and financial performance w
Slide 24: Business Conditions - Central Hudson
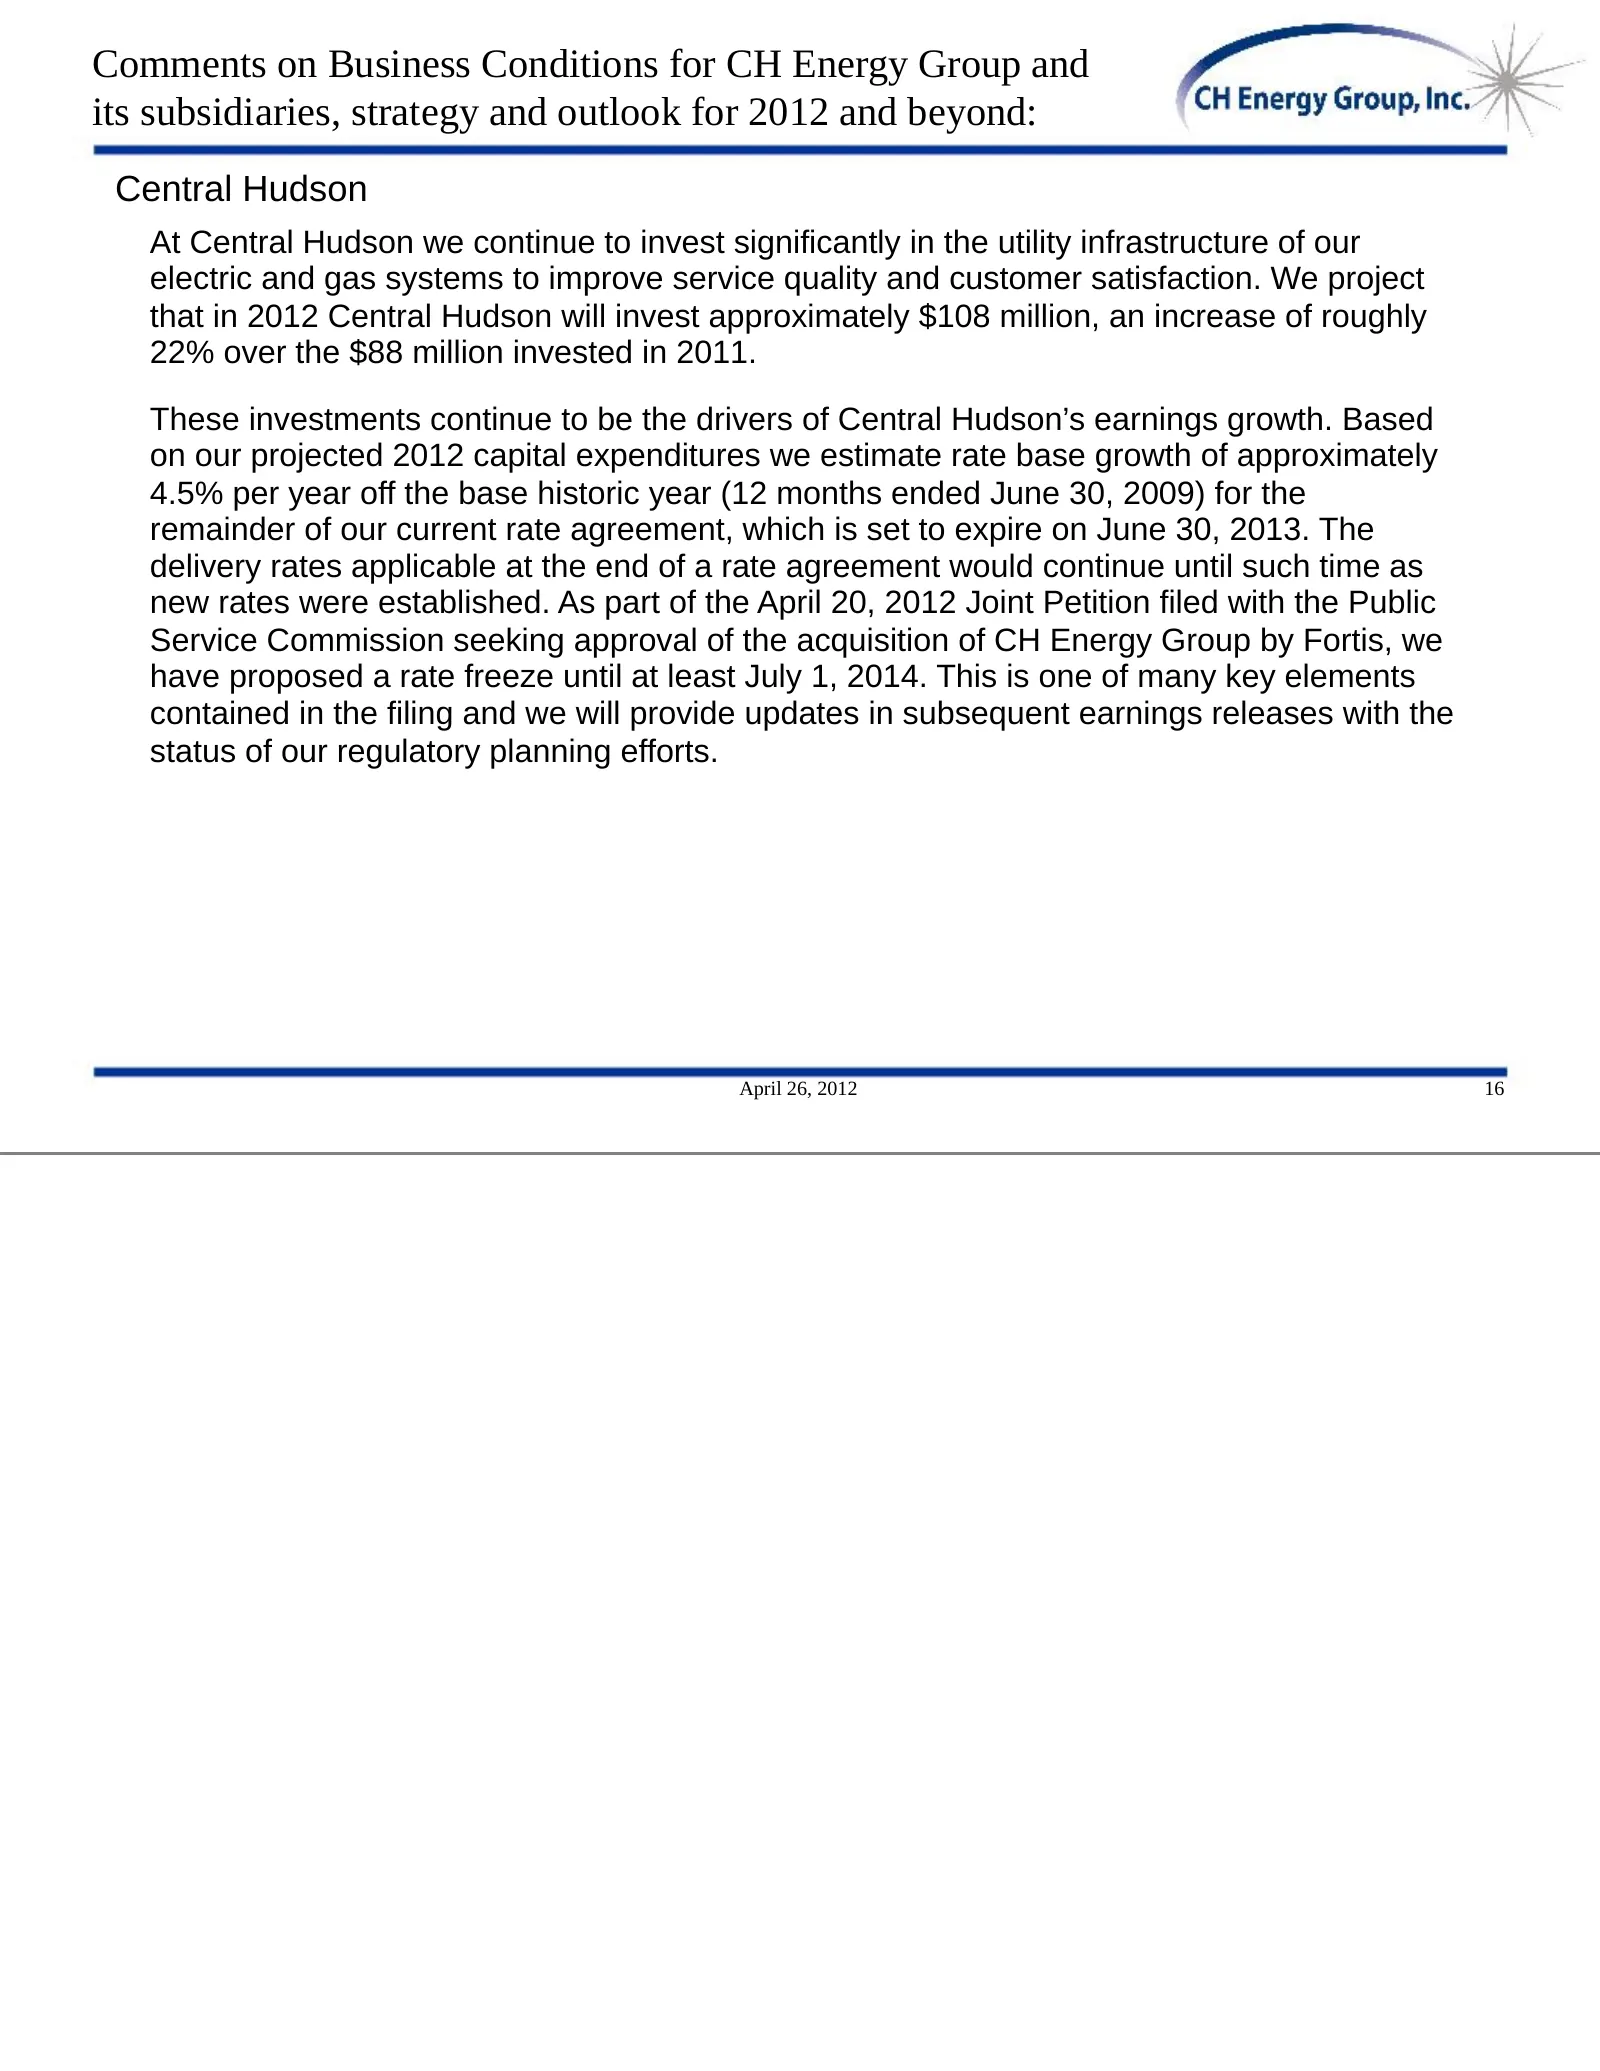
Comments on Business Conditions for CH Energy Group and its subsidiaries, strategy and outlook for 2012 and beyond: Central Hudson At Central Hudson we continue to invest significantly in the utility infrastructure of our electric and gas systems to improve service quality and customer satisfaction.
Slide 25: Business Conditions - Central Hudson
Comments on Business Conditions for CH Energy Group and its subsidiaries, strategy and outlook for 2012 and beyond: Central Hudson The long-term outlook for capital investment at Central Hudson indicates similar or higher levels of growth in rate base, but it will ultimately depend on a number of fa
Slide 26: Business Conditions - Griffith Energy Services
Comments on Business Conditions for CH Energy Group and its subsidiaries, strategy and outlook for 2012 and beyond: Griffith Energy Services The fuel distribution business continues to be challenging during periods of escalating heating oil prices. Over the last 15 months, prices have increased by a
Slide 27: Business Conditions - Other Businesses and Fortis
Comments on Business Conditions for CH Energy Group and its subsidiaries, strategy and outlook for 2012 and beyond: Other Businesses and Investments-CHEC As mentioned previously, we divested four non-regulated renewable energy investments in 2011 that represented most of our entire portfolio. At thi
Slide 28: Earnings Release Supplement
Earnings Release Supplement ØSegment EPS Reconciliation ØSegment Information, Revenue ØSegment Information, Net Income ØSegment Information, Assets ØSelected Operational Information April 26, 2012 20
Slide 29: Segment Information, Revenue
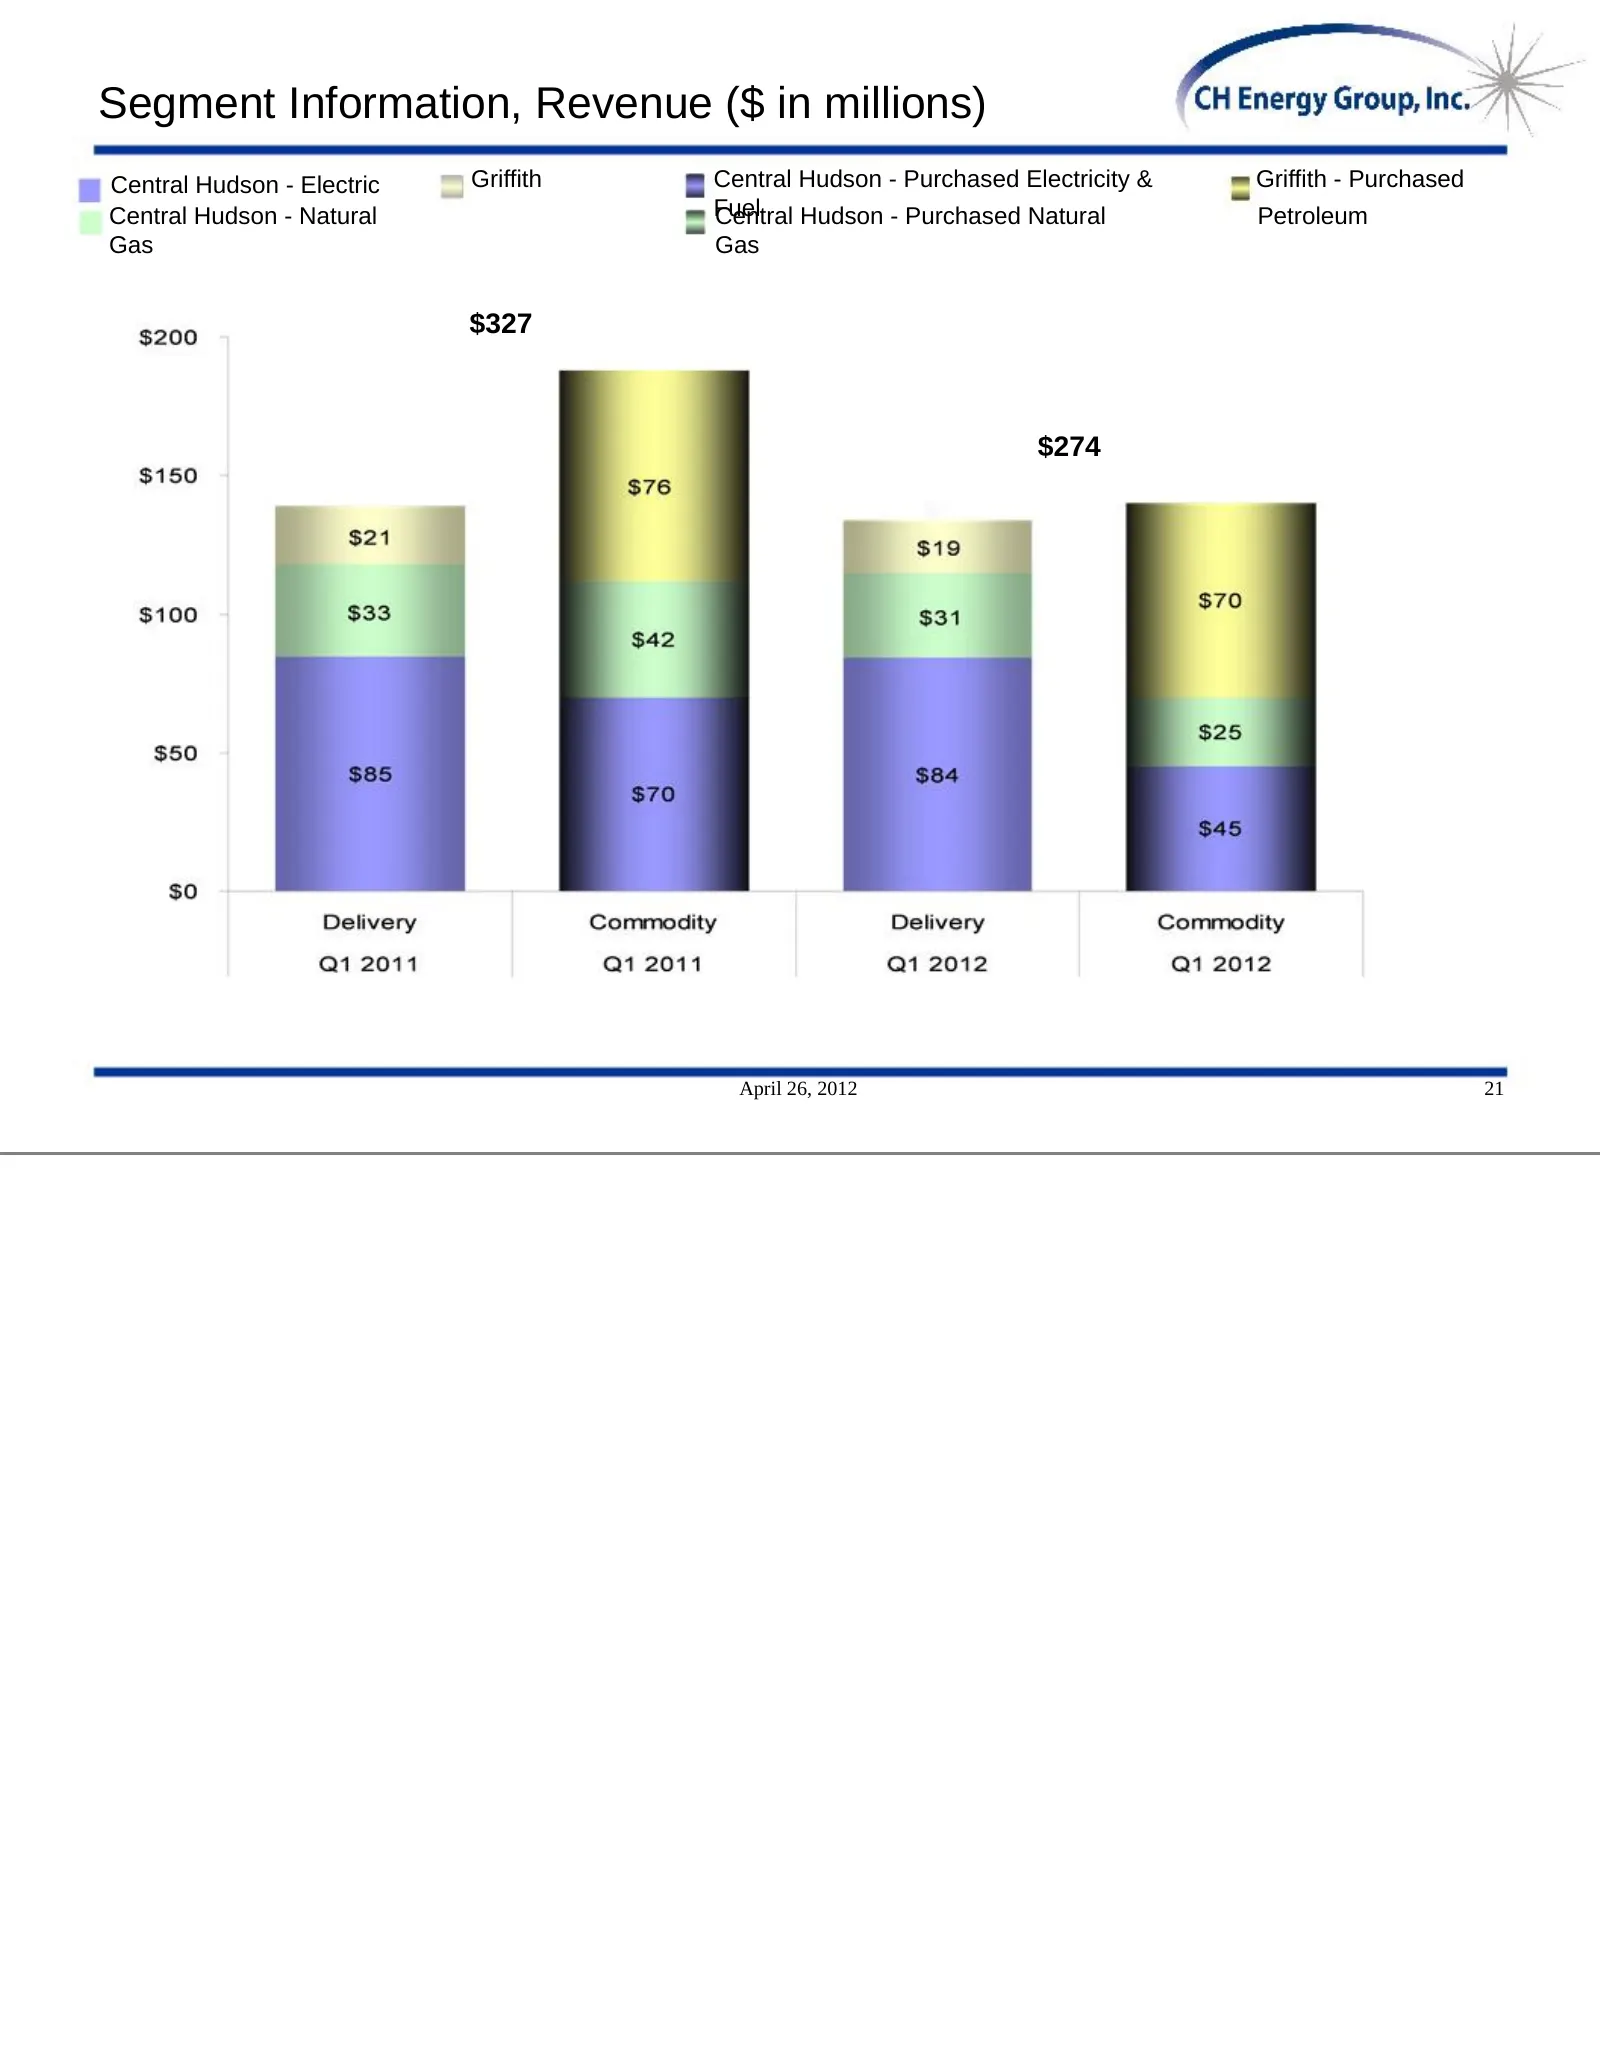
Segment Information, Revenue ($ in millions) Central Hudson - Electric Griffith Central Hudson - Purchased Electricity & Griffith - Purchased Central Hudson - Natural Fuel Central Hudson - Purchased Natural Petroleum Gas Gas $327 $274 April 26, 2012 21
Slide 30: Segment Information, Net Income
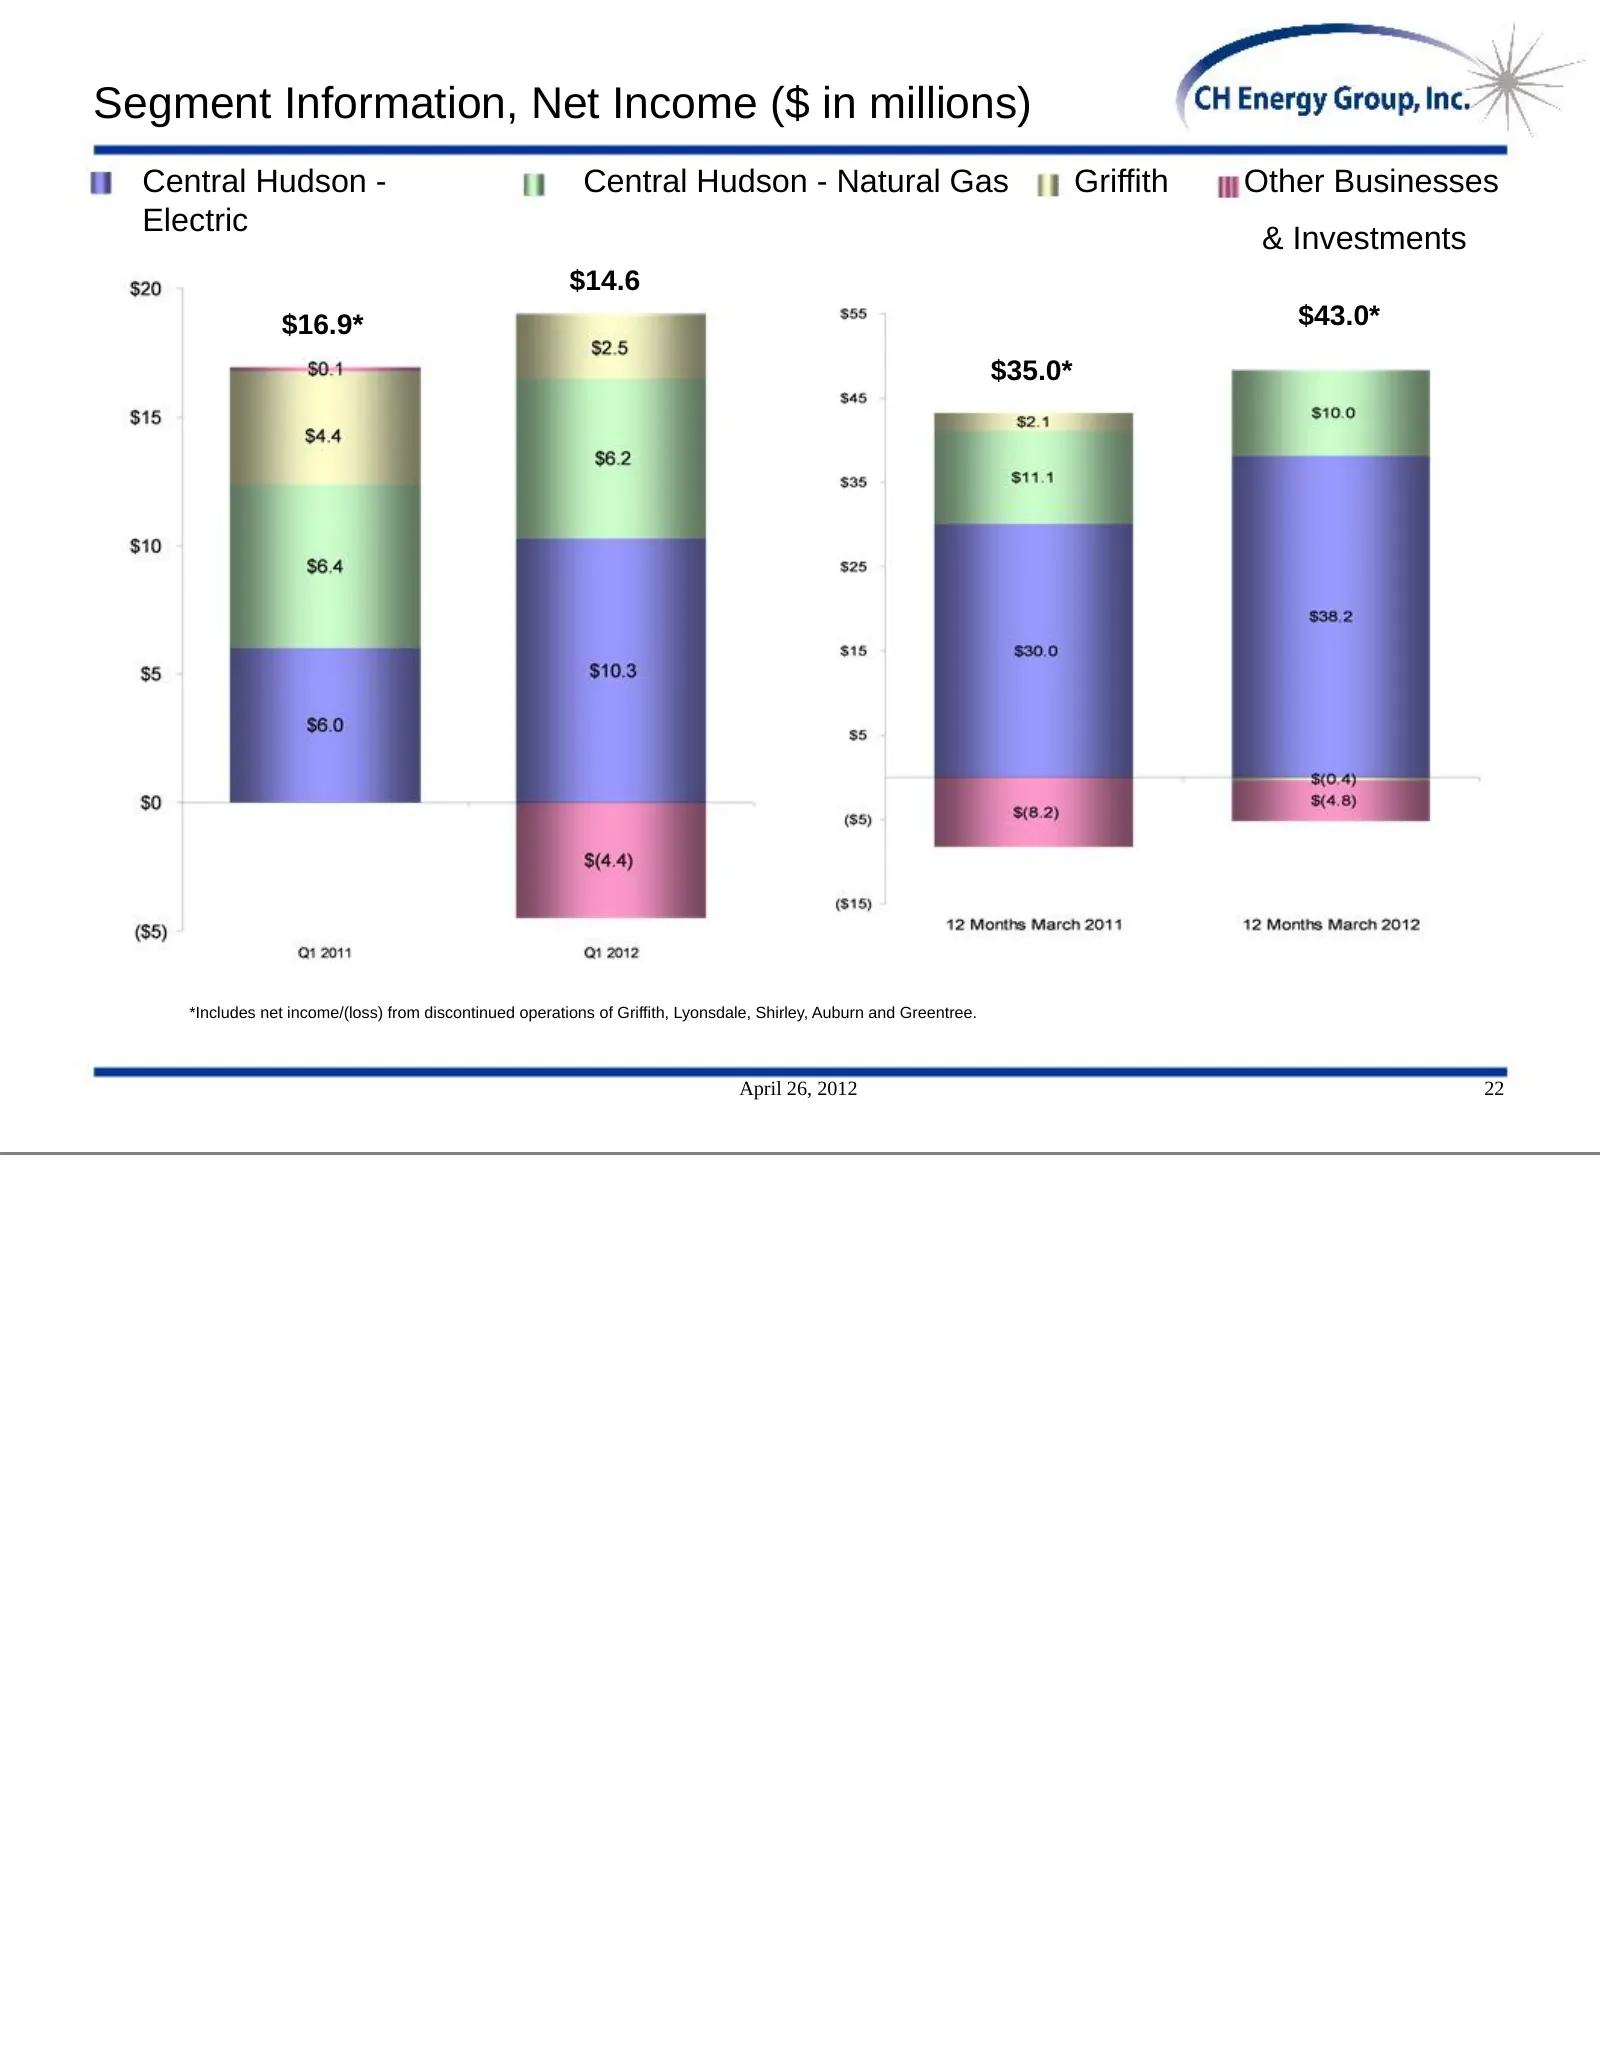
Segment Information, Net Income ($ in millions) Central Hudson - Central Hudson - Natural Gas Griffith Other Businesses Electric & Investments $14.6 $16.9* $43.0* $35.0* *Includes net income/(loss) from discontinued operations of Griffith, Lyonsdale, Shirley, Auburn and Greentree. April 26, 2012 22
Slide 31: Segment Information, Assets
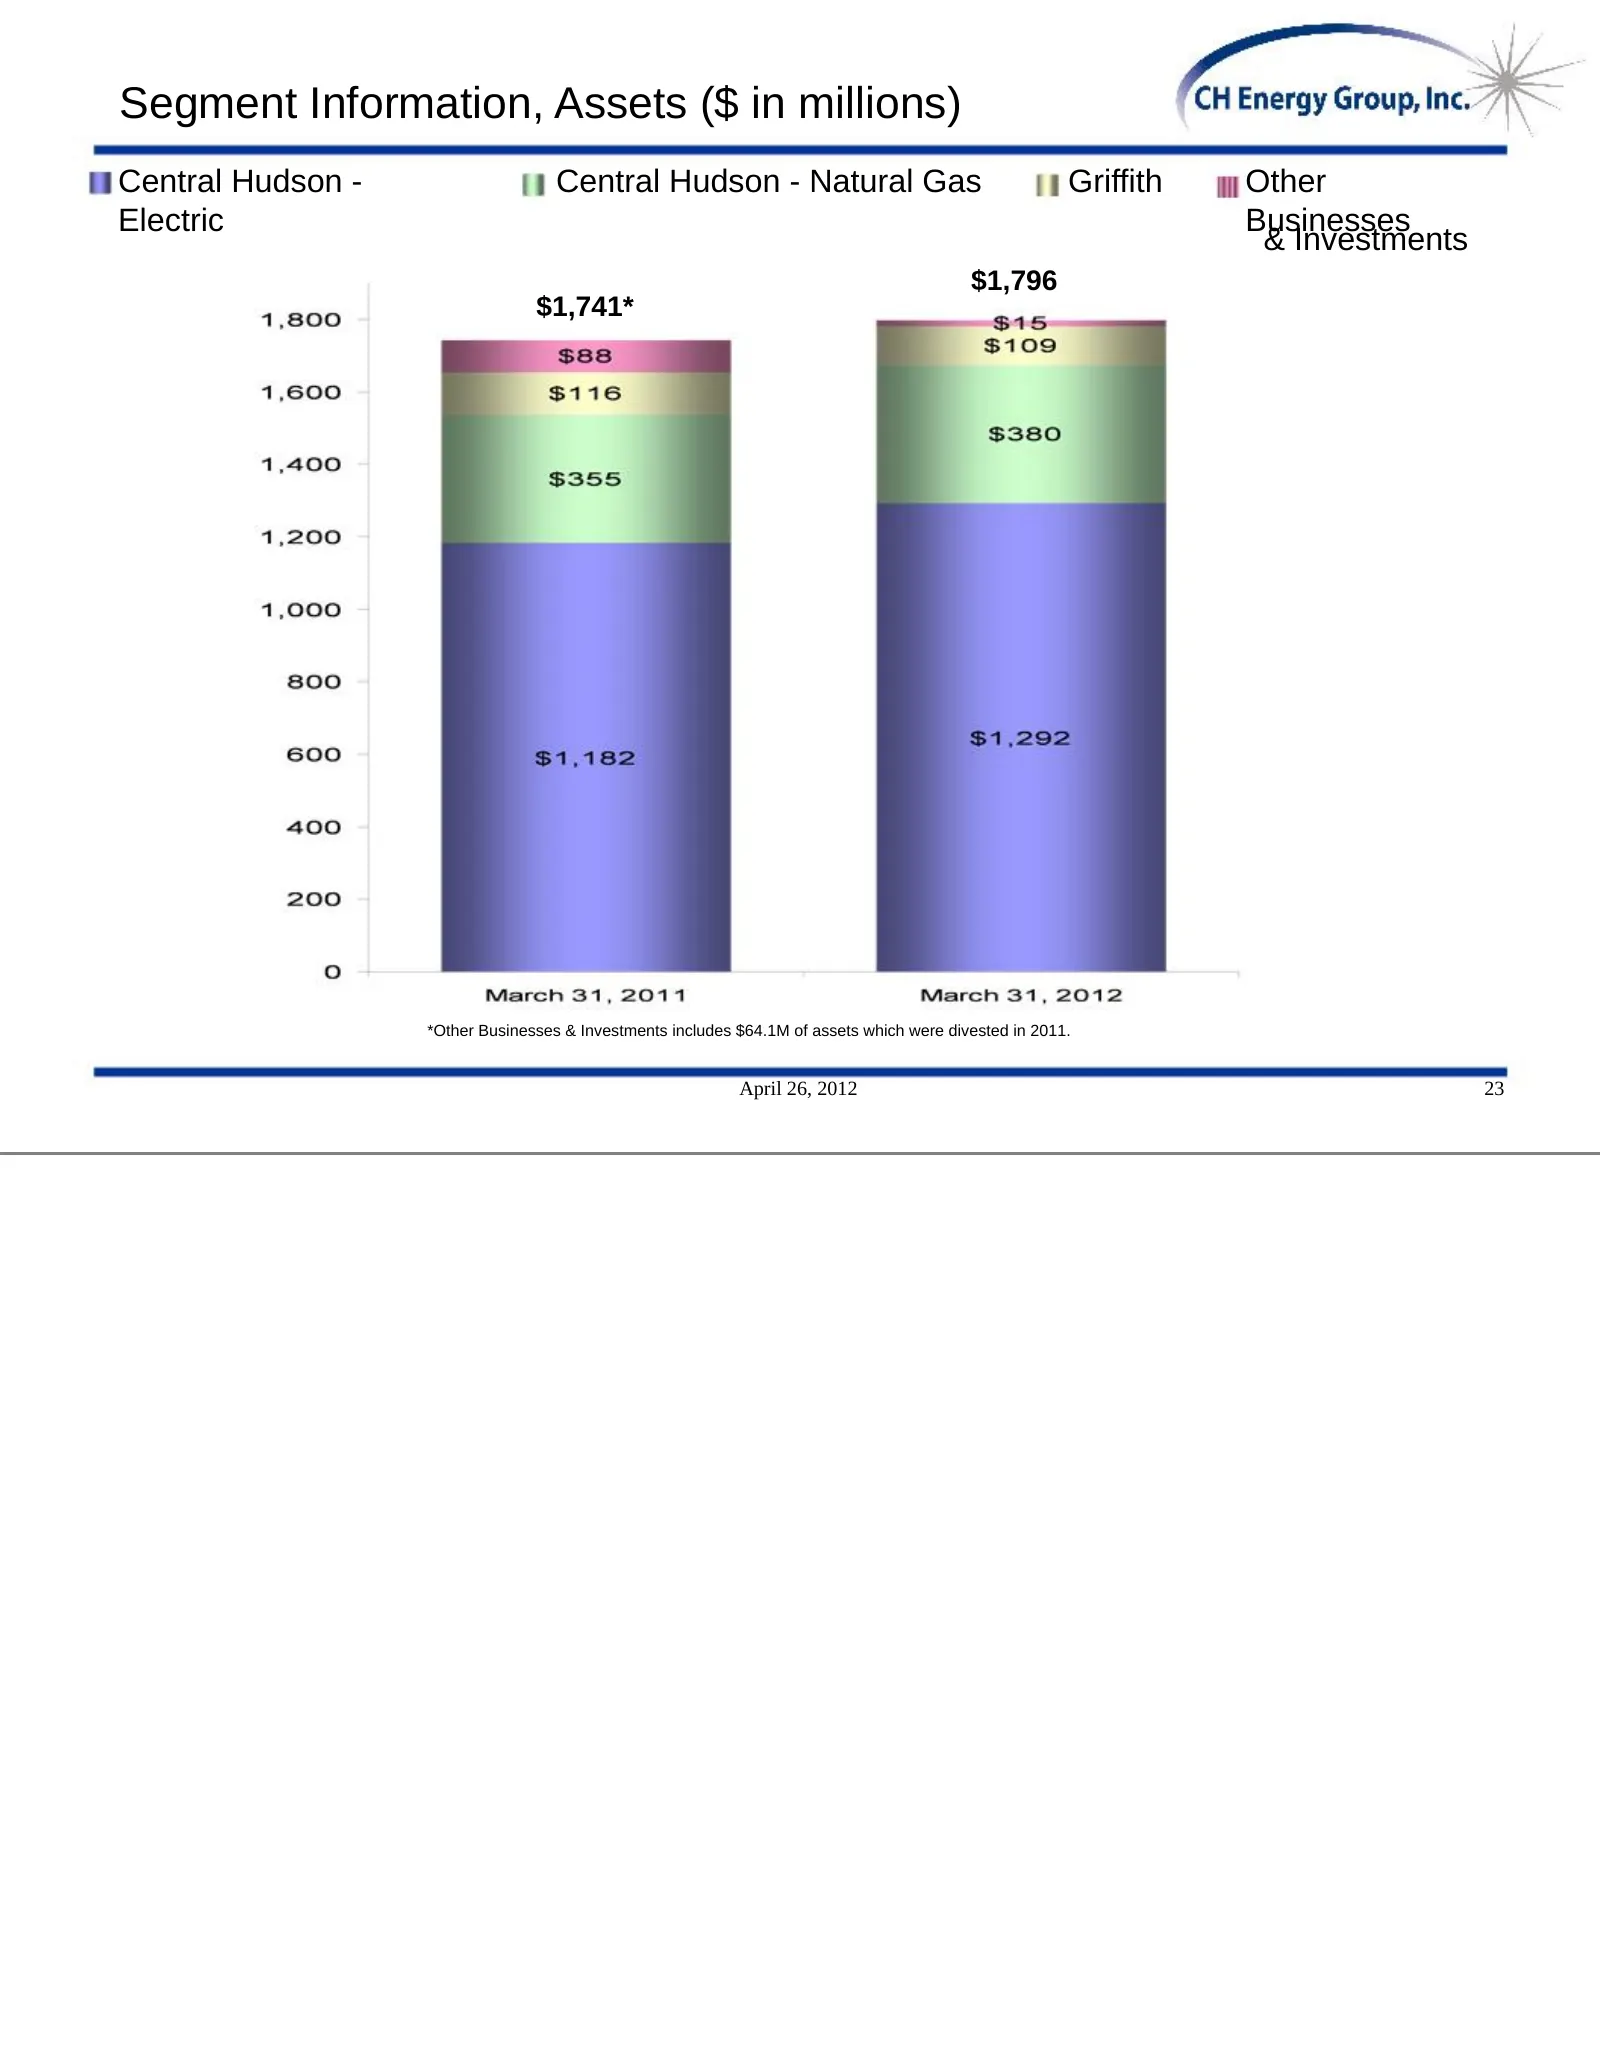
Segment Information, Assets ($ in millions) Central Hudson - Central Hudson - Natural Gas Griffith Other Electric Businesses & Investments $1,796 $1,741* *Other Businesses & Investments includes $64.1M of assets which were divested in 2011. April 26, 2012 23
Slide 32: Segment Information, Equity
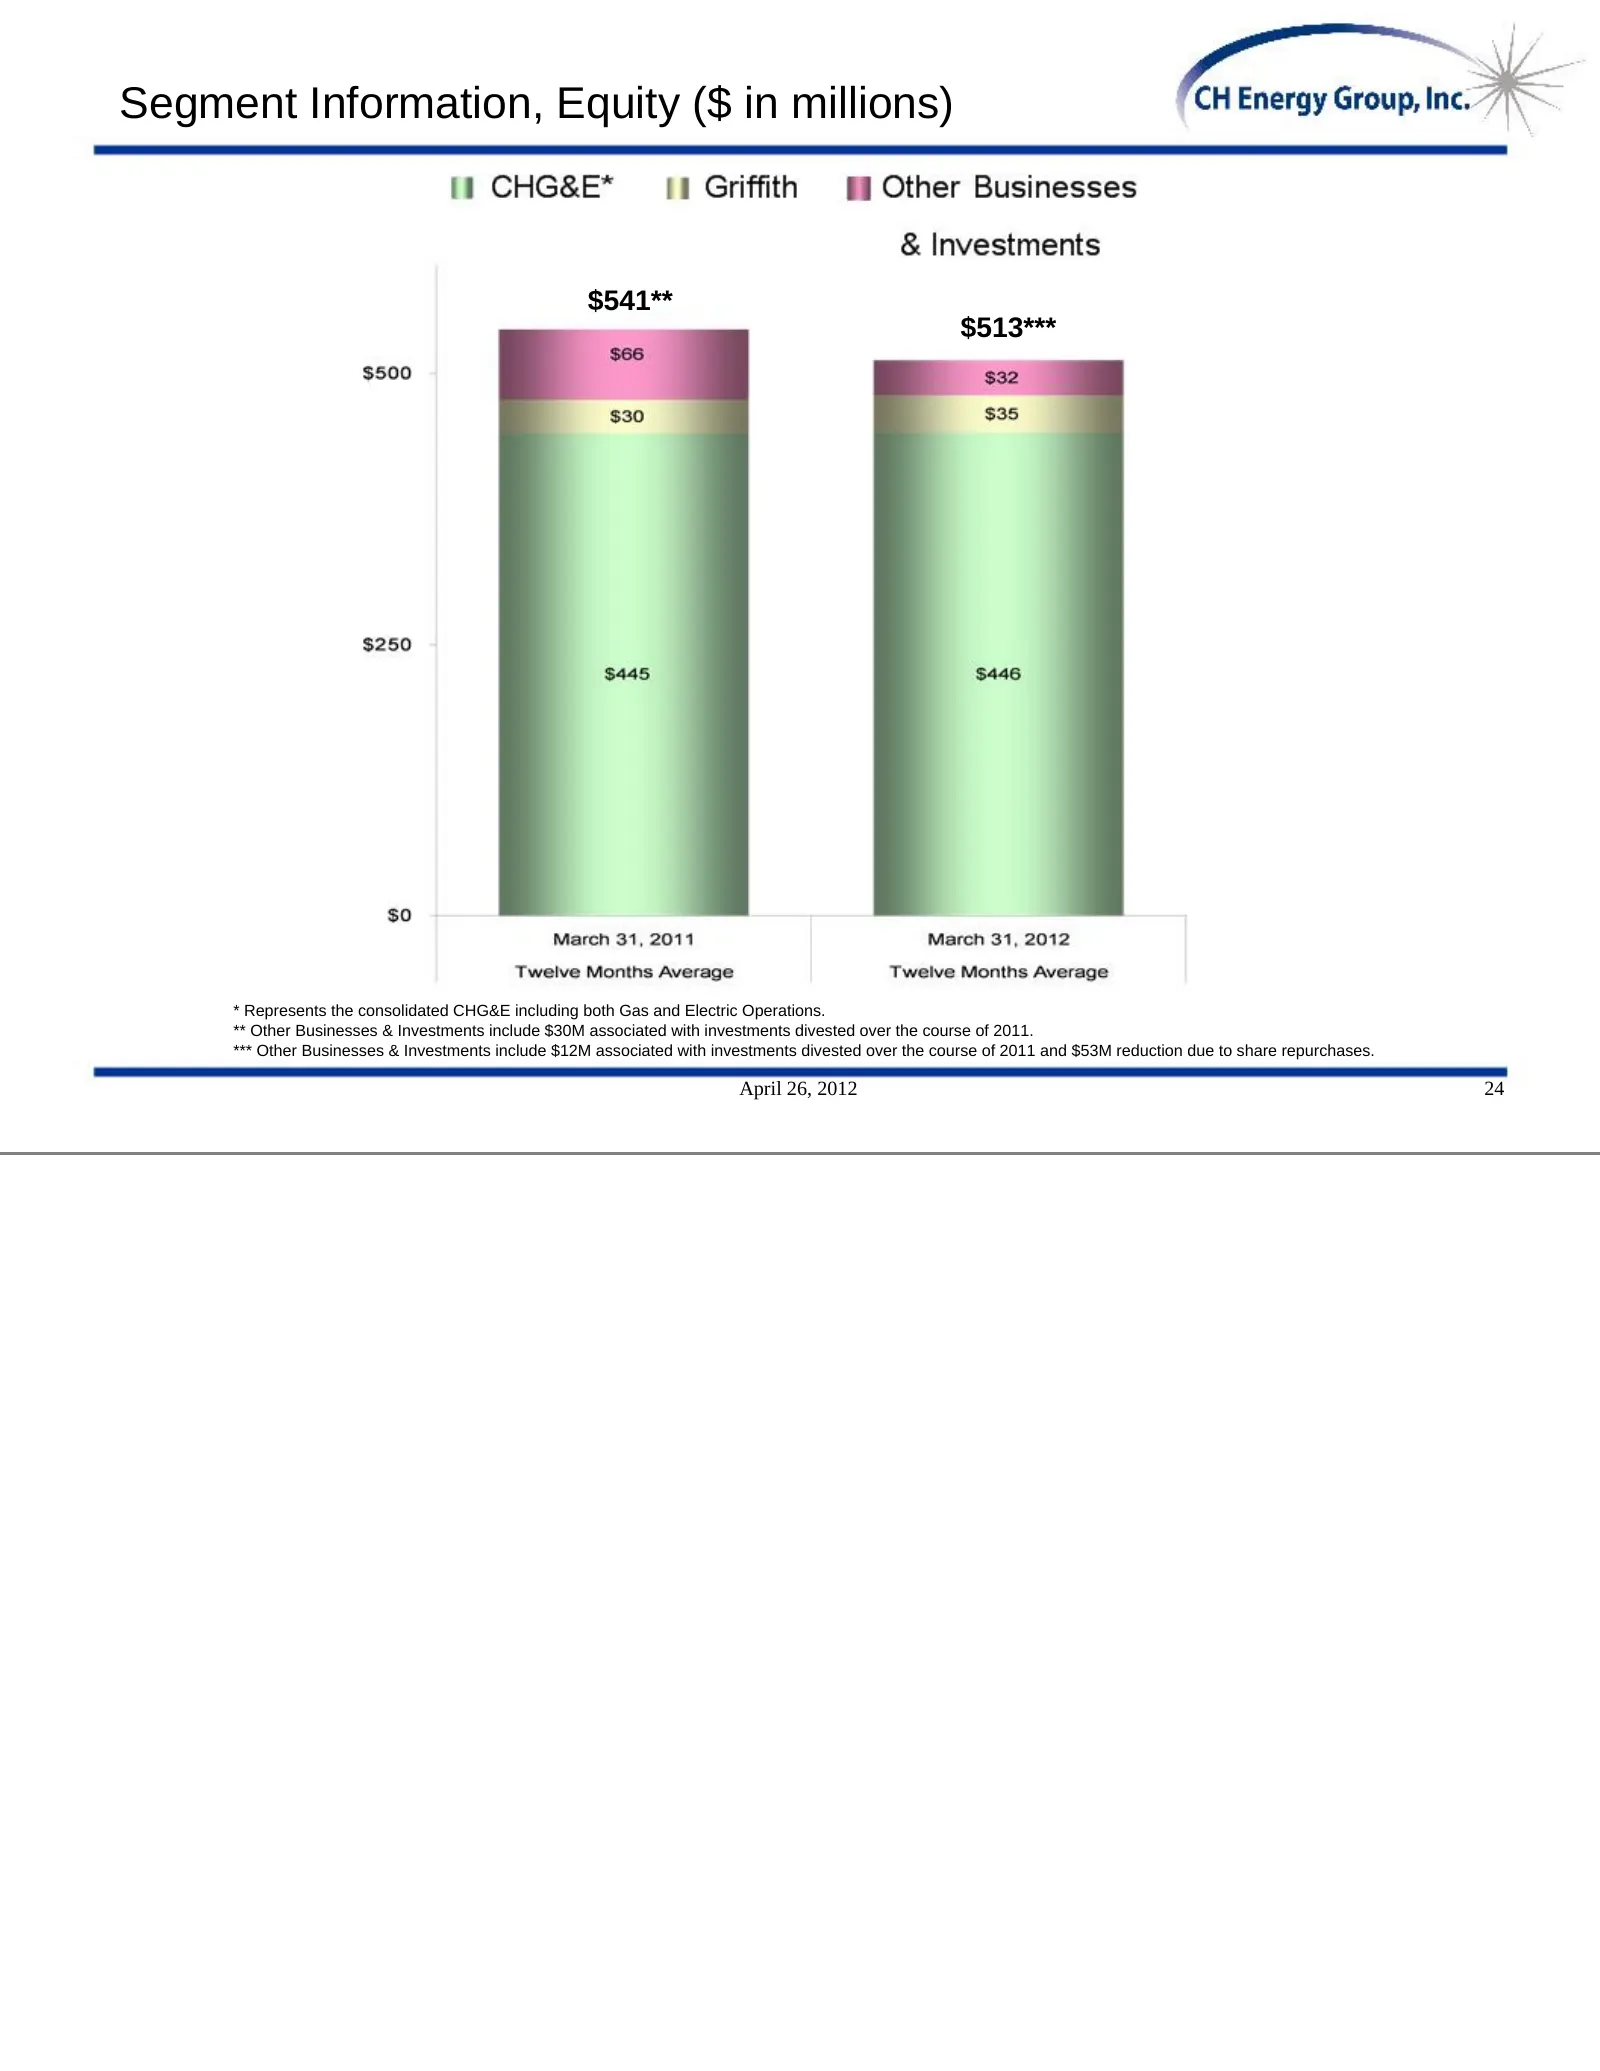
Segment Information, Equity ($ in millions) $541** $513*** * Represents the consolidated CHG&E including both Gas and Electric Operations. ** Other Businesses & Investments include $30M associated with investments divested over the course of 2011. *** Other Businesses & Investments include $12M asso
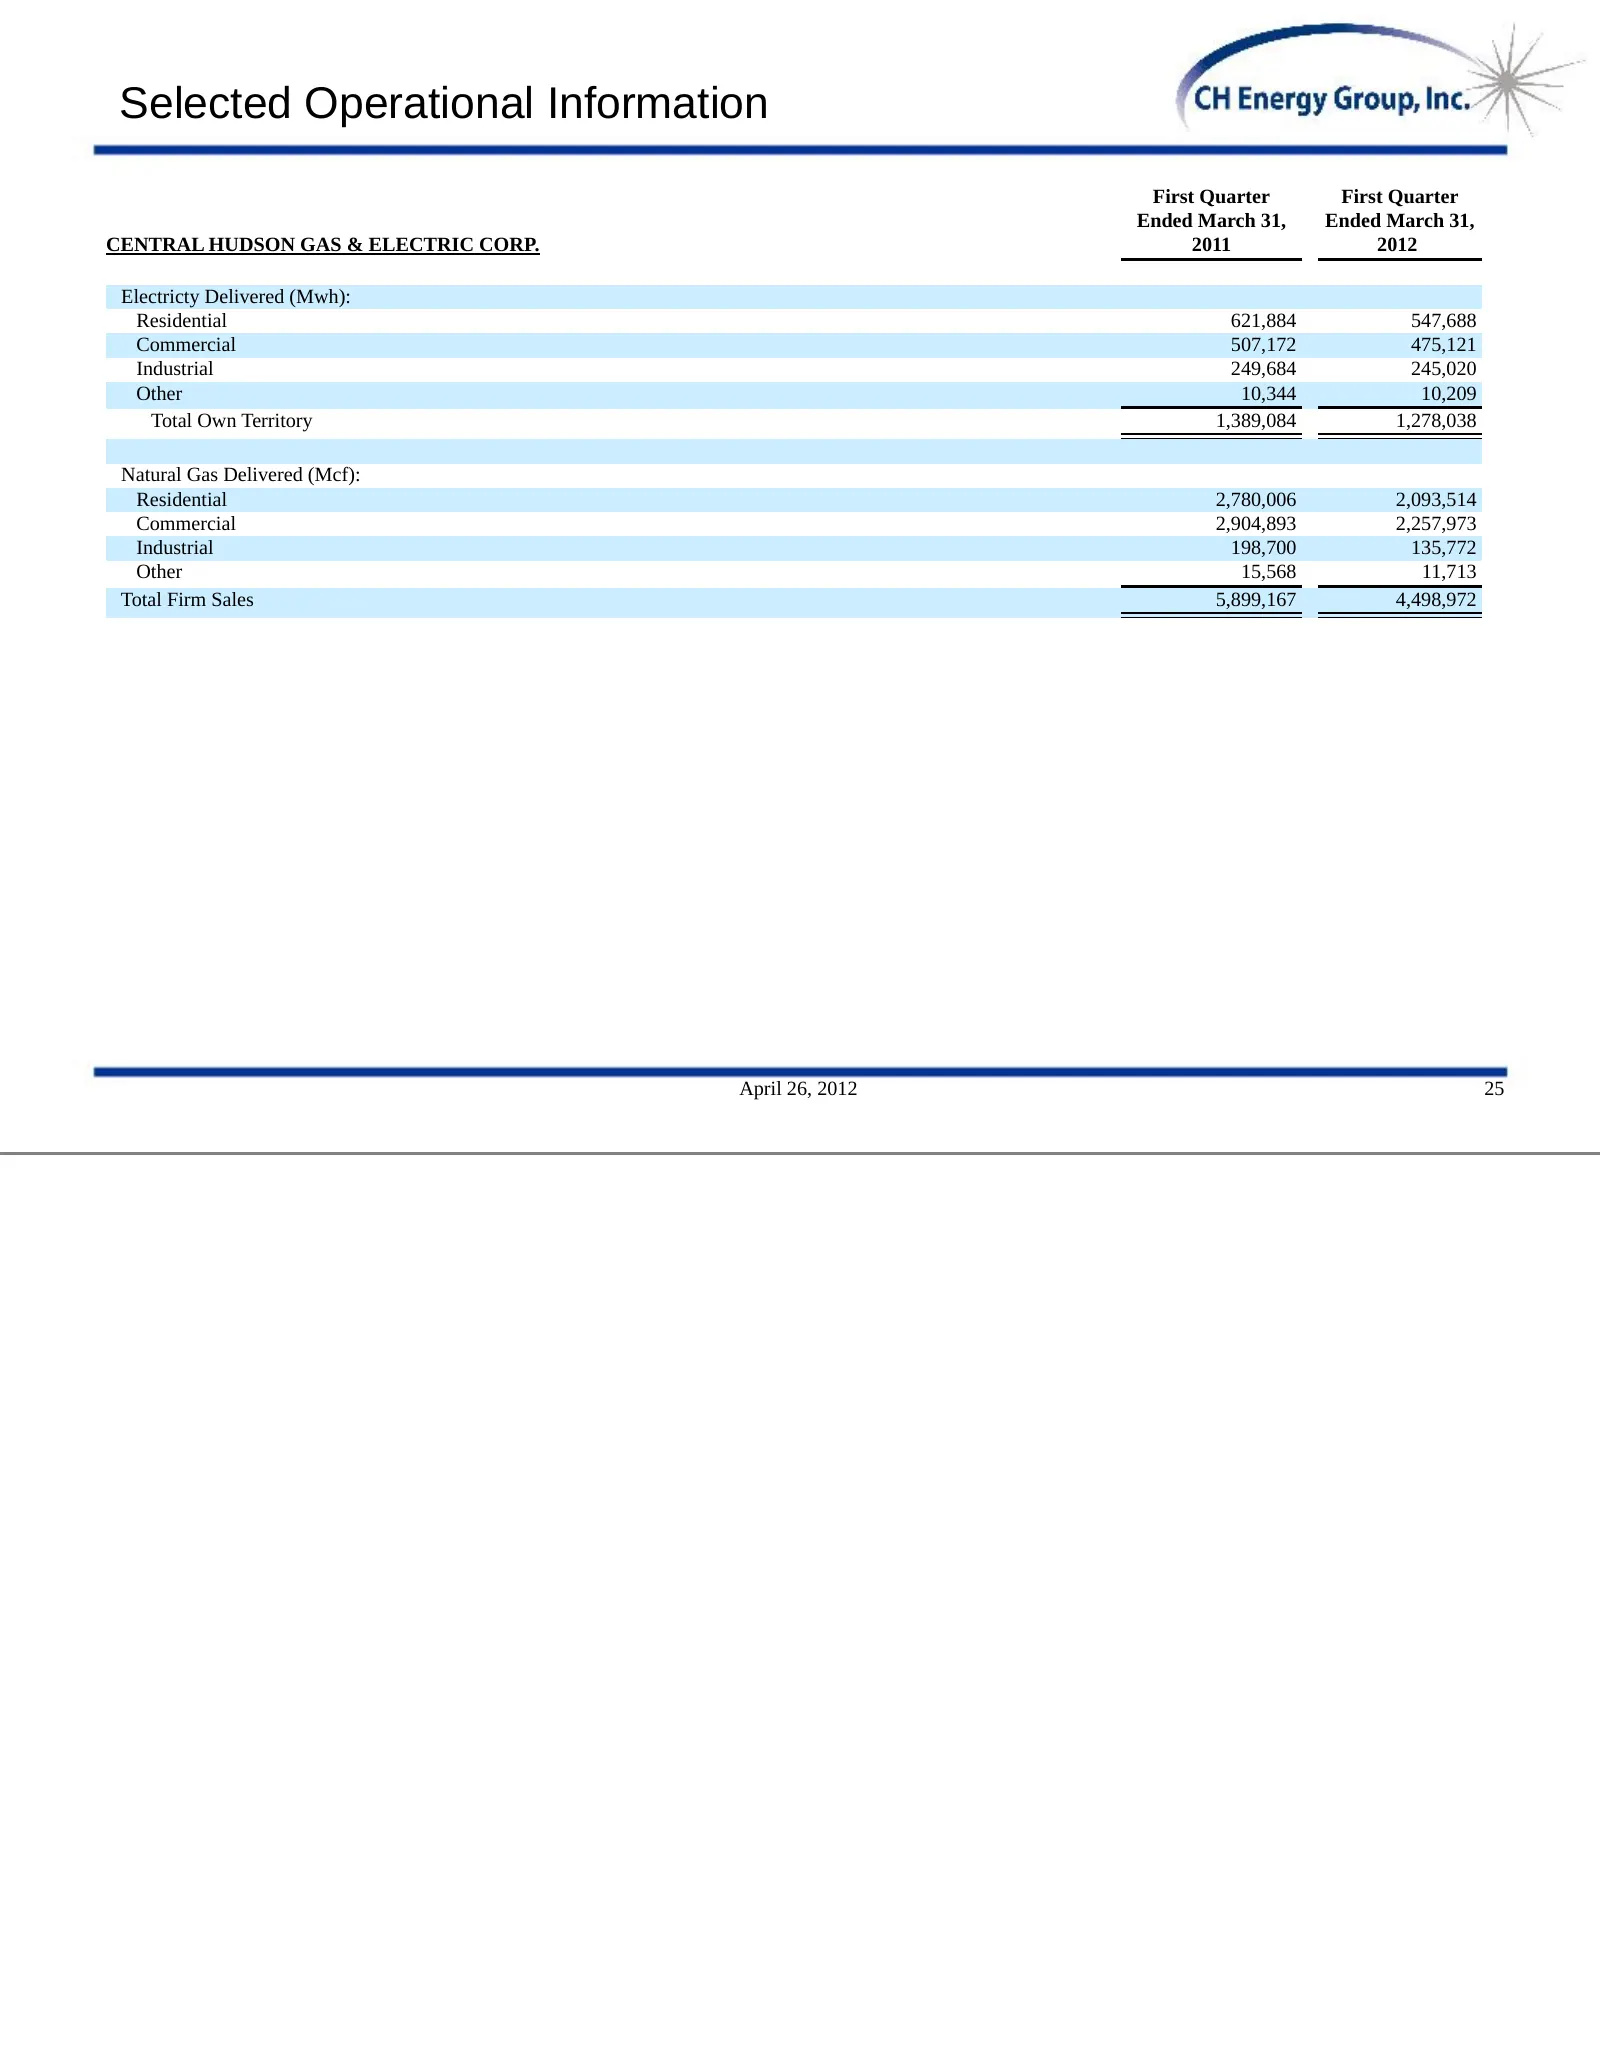
Slide 33: Selected Operational Information
Selected Operational Information First Quarter First Quarter Ended March 31, Ended March 31, CENTRAL HUDSON GAS & ELECTRIC CORP. 2011 2012 Electricty Delivered (Mwh): Residential 621,884 547,688 Commercial 507,172 475,121 Industrial 249,684 245,020 Other 10,344 10,209 Total Own Territory 1,389,084 1
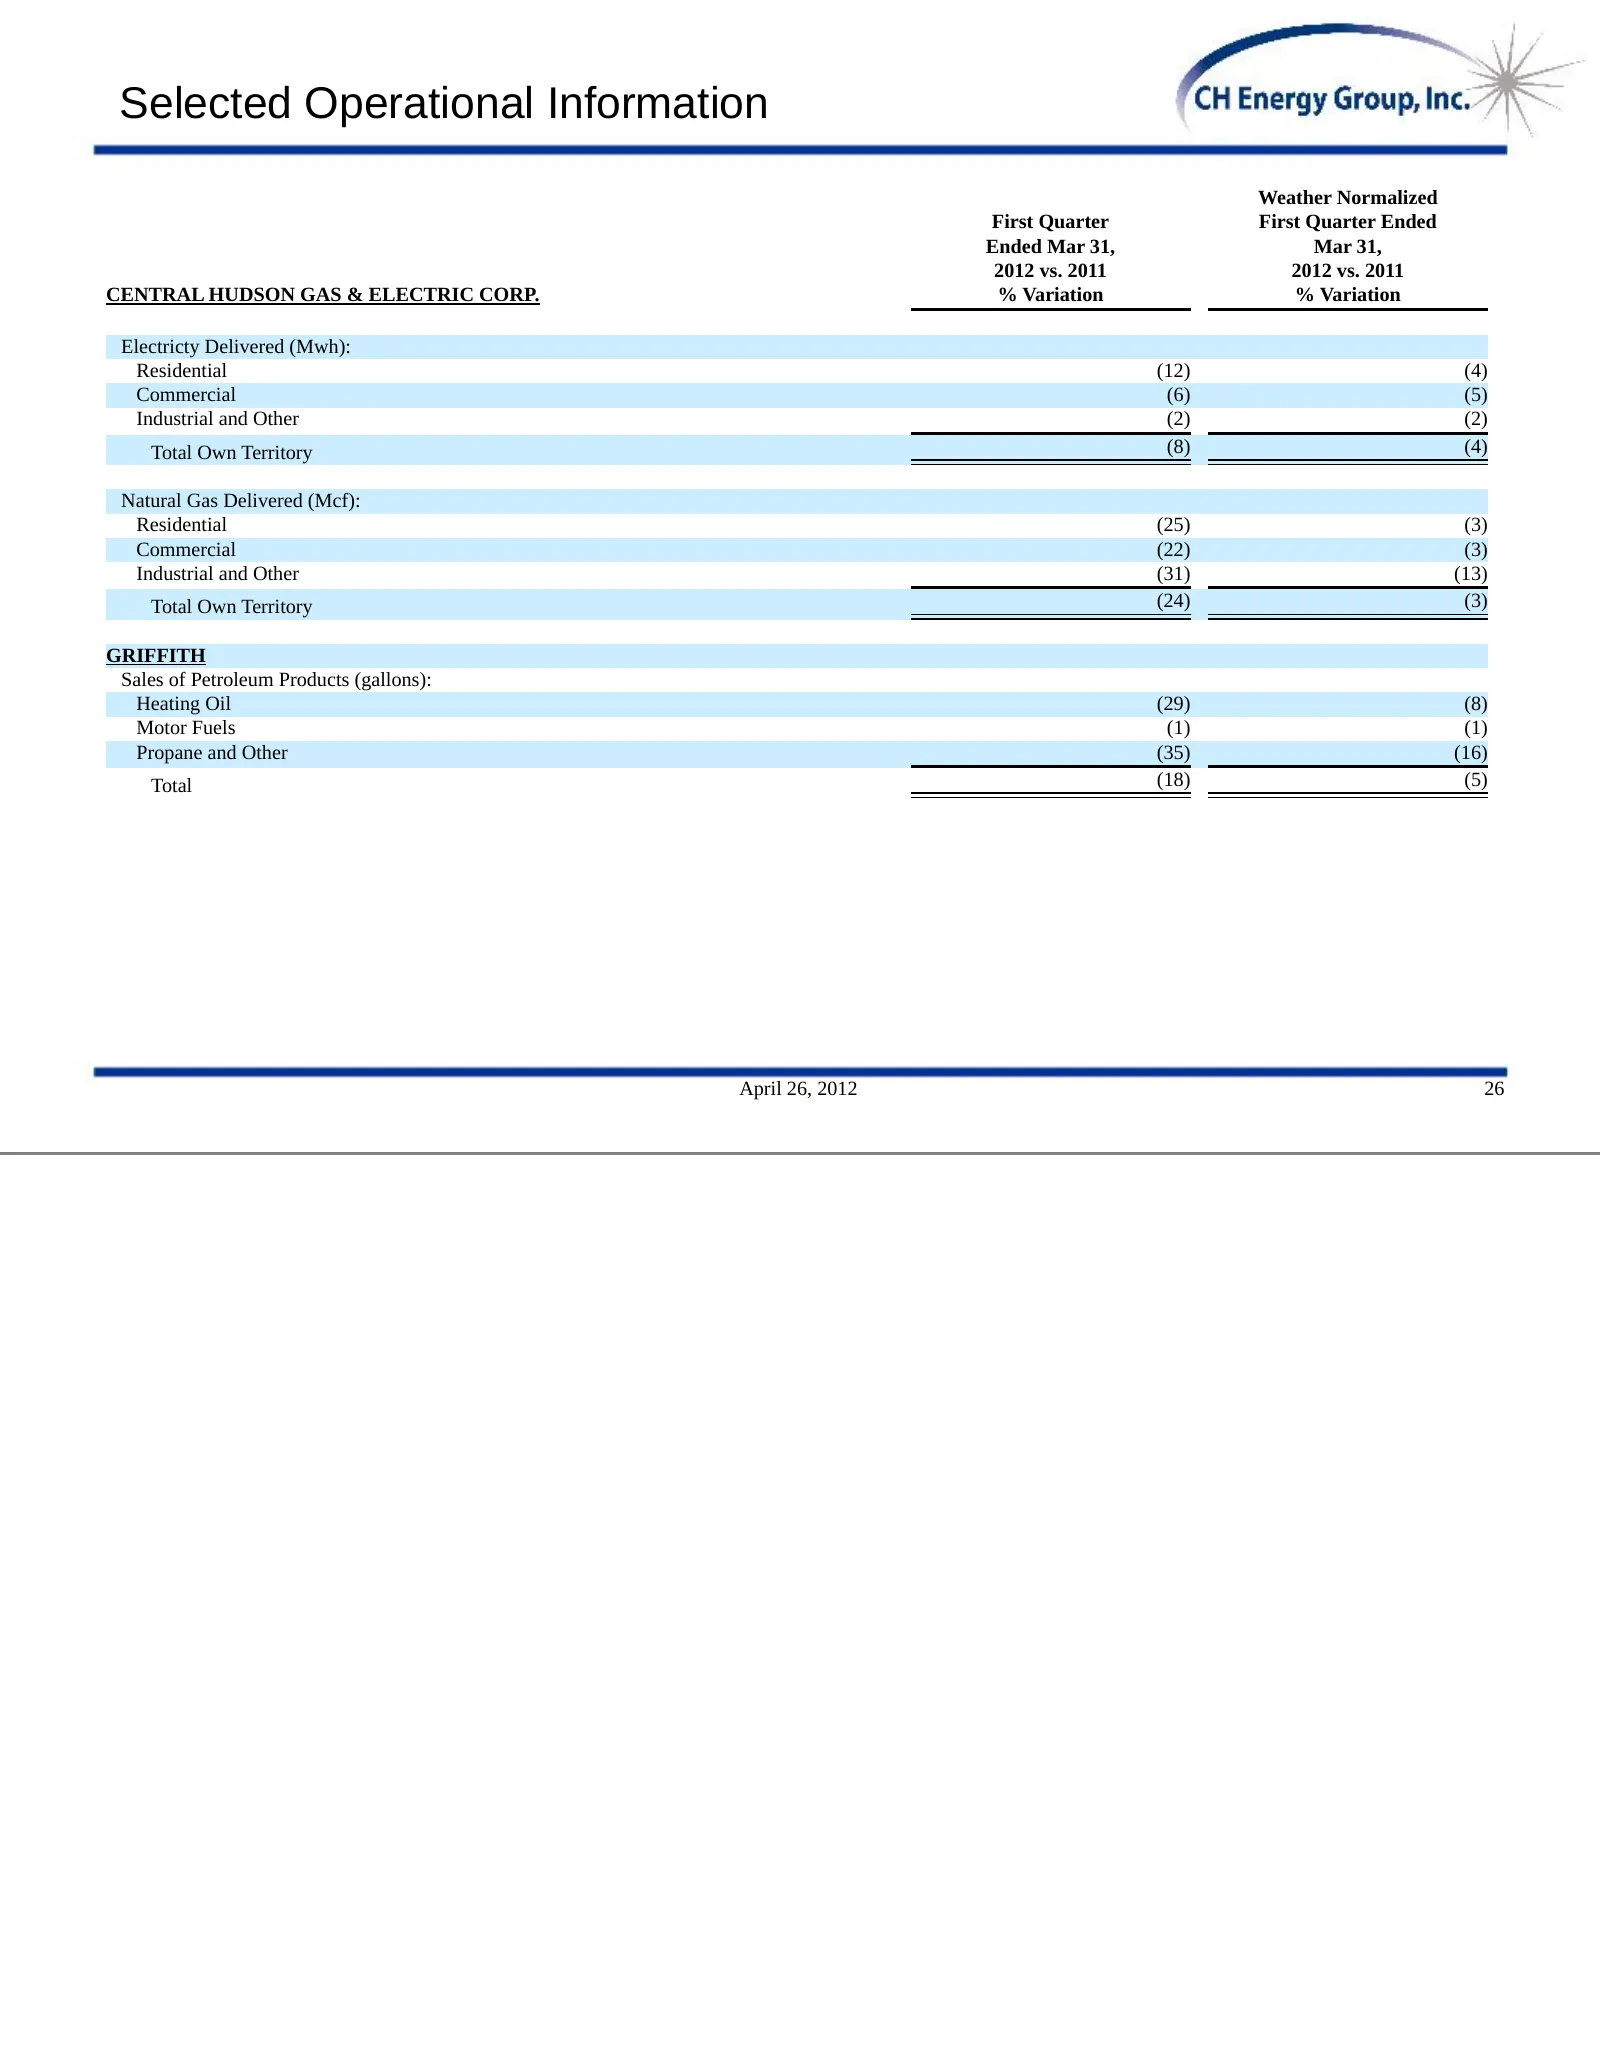
Slide 34: Selected Operational Information
Selected Operational Information Weather Normalized First Quarter First Quarter Ended Ended Mar 31, Mar 31, 2012 vs. 2011 2012 vs. 2011 CENTRAL HUDSON GAS & ELECTRIC CORP. % Variation % Variation Electricty Delivered (Mwh): Residential (12) (4) Commercial (6) (5) Industrial and Other (2) (2) Total O
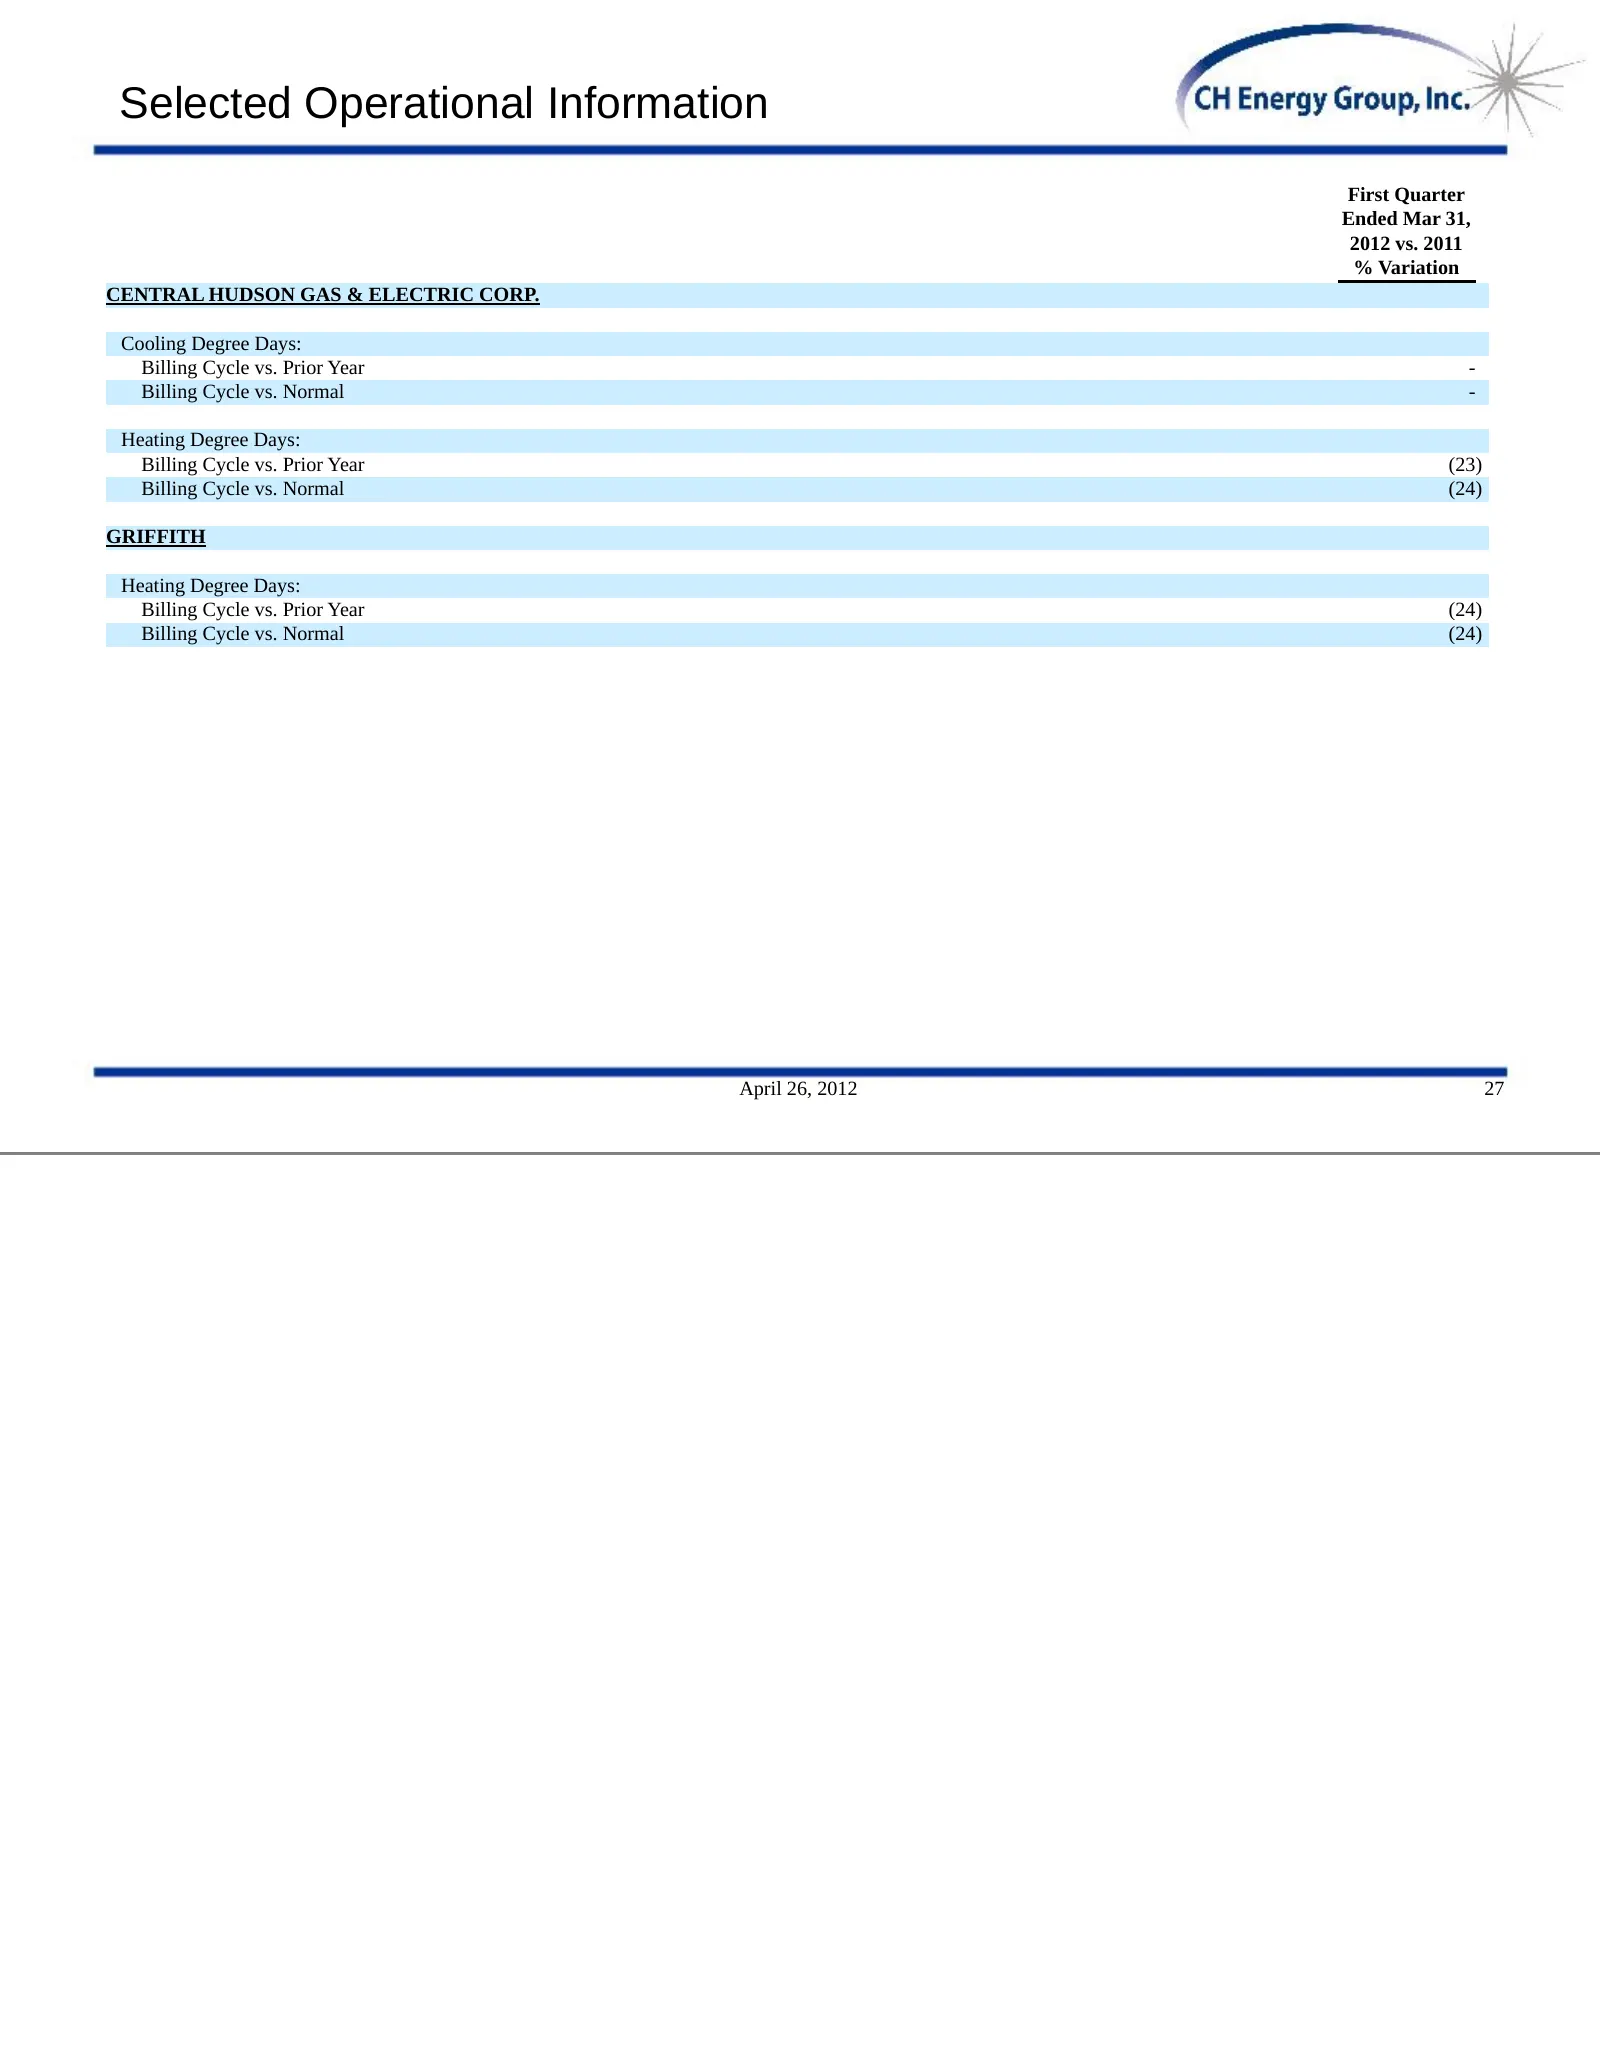
Slide 35: Selected Operational Information
Selected Operational Information First Quarter Ended Mar 31, 2012 vs. 2011 % Variation CENTRAL HUDSON GAS & ELECTRIC CORP. Cooling Degree Days: Billing Cycle vs. Prior Year - Billing Cycle vs. Normal - Heating Degree Days: Billing Cycle vs. Prior Year (23) Billing Cycle vs. Normal (24) GRIFFITH Heat

Slide 36
Source: SEC EDGAR · DEFA14A filed Apr 26, 2012