Pepco — Investor Day (April 2011)
121 slides from Pepco's investor day presentation, Apr 8, 2011

Slide 1: Delivering Value… for Customers and Investors
ANALYST CONFERENCE • WASHINGTON, DC • APRIL 8, 2011 Delivering Value… for Customers and Investors
Slide 2: Safe Harbor Statement
Safe Harbor Statement Some of the statements contained in today’s presentation are forward-looking statements within the meaning of Section 21E of the Securities Exchange Act of 1934, as amended, and are subject to the safe harbor created by the Private Securities Litigation Reform Act of 1995. Thes
Slide 3: Today’s Agenda
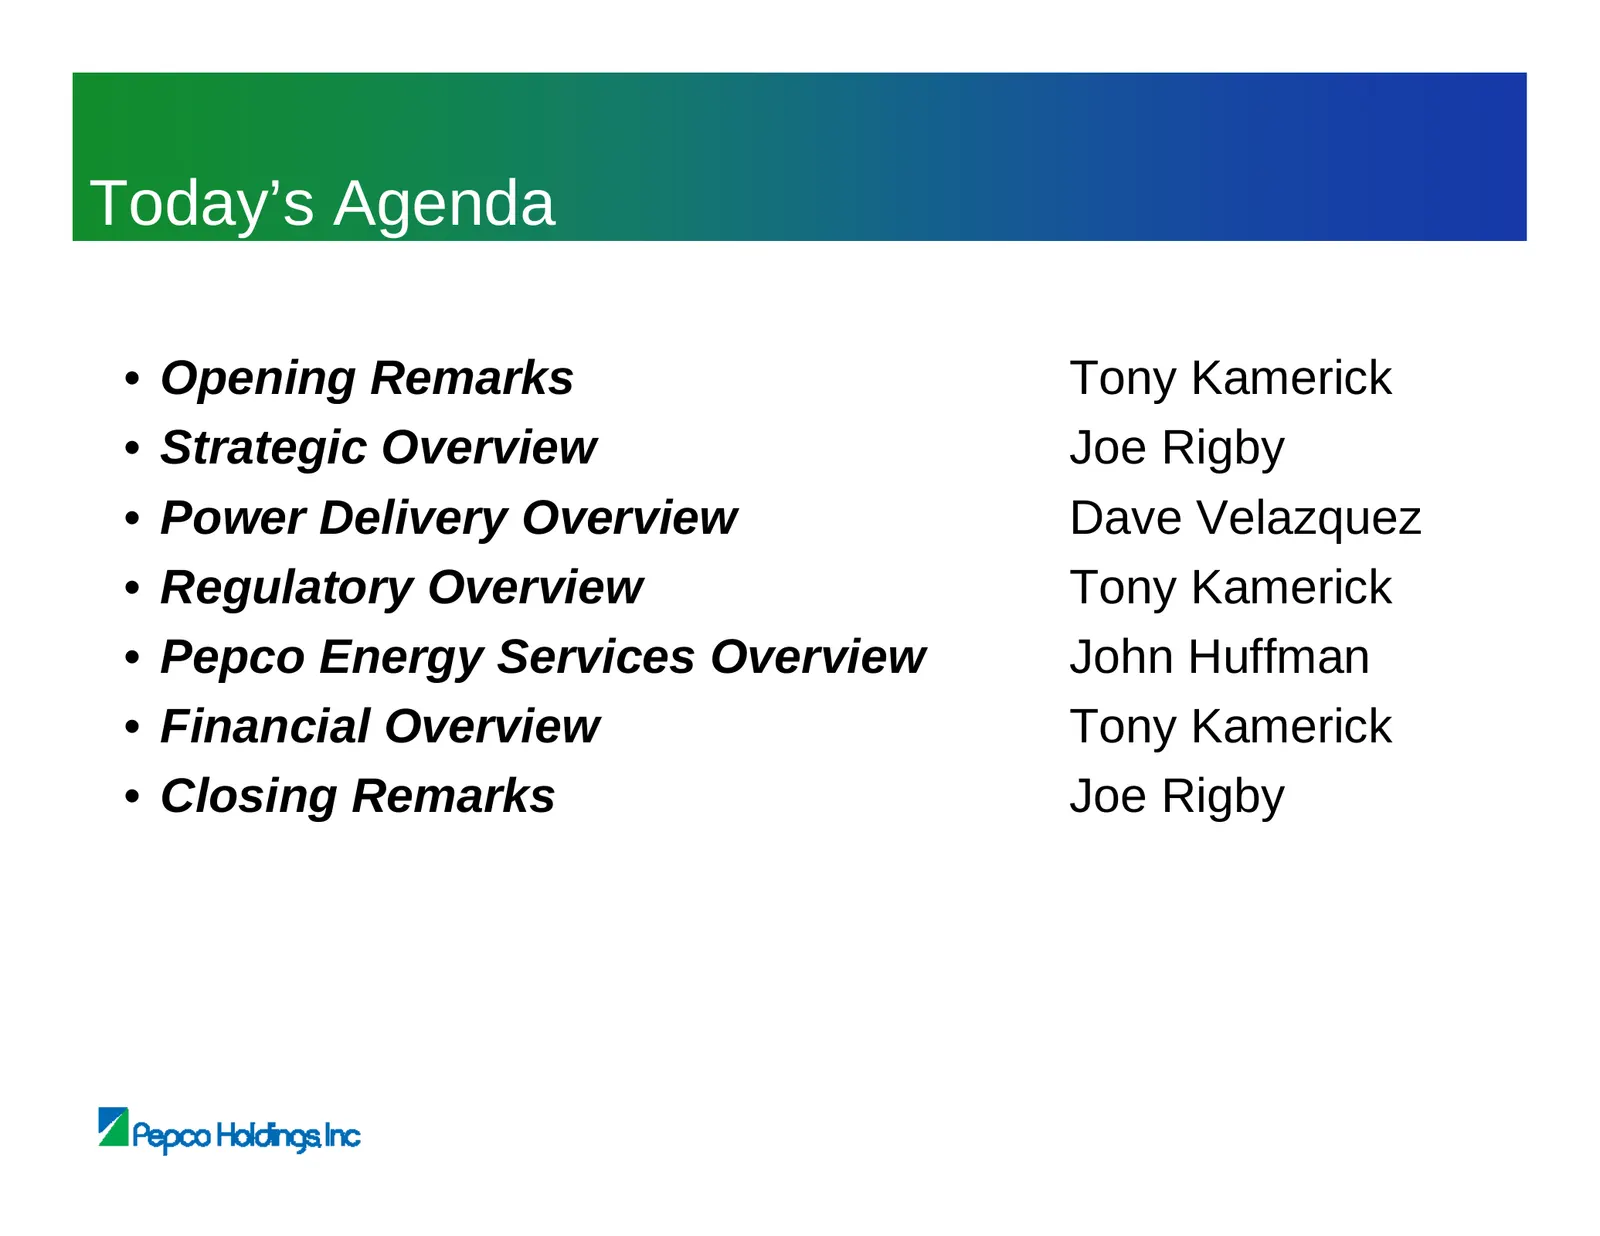
Today’s Agenda • Opening Remarks Tony Kamerick • Strategic Overview Joe Rigby • Power Delivery Overview Dave Velazquez • Regulatory Overview Tony Kamerick • Pepco Energy Services Overview John Huffman • Financial Overview Tony Kamerick • Closing Remarks Joe Rigby
Slide 4: Strategic Overview
Strategic Overview Joe Rigby Chairman, President & Chief Executive Officer
Slide 5: Strategic Overview: PHI Today
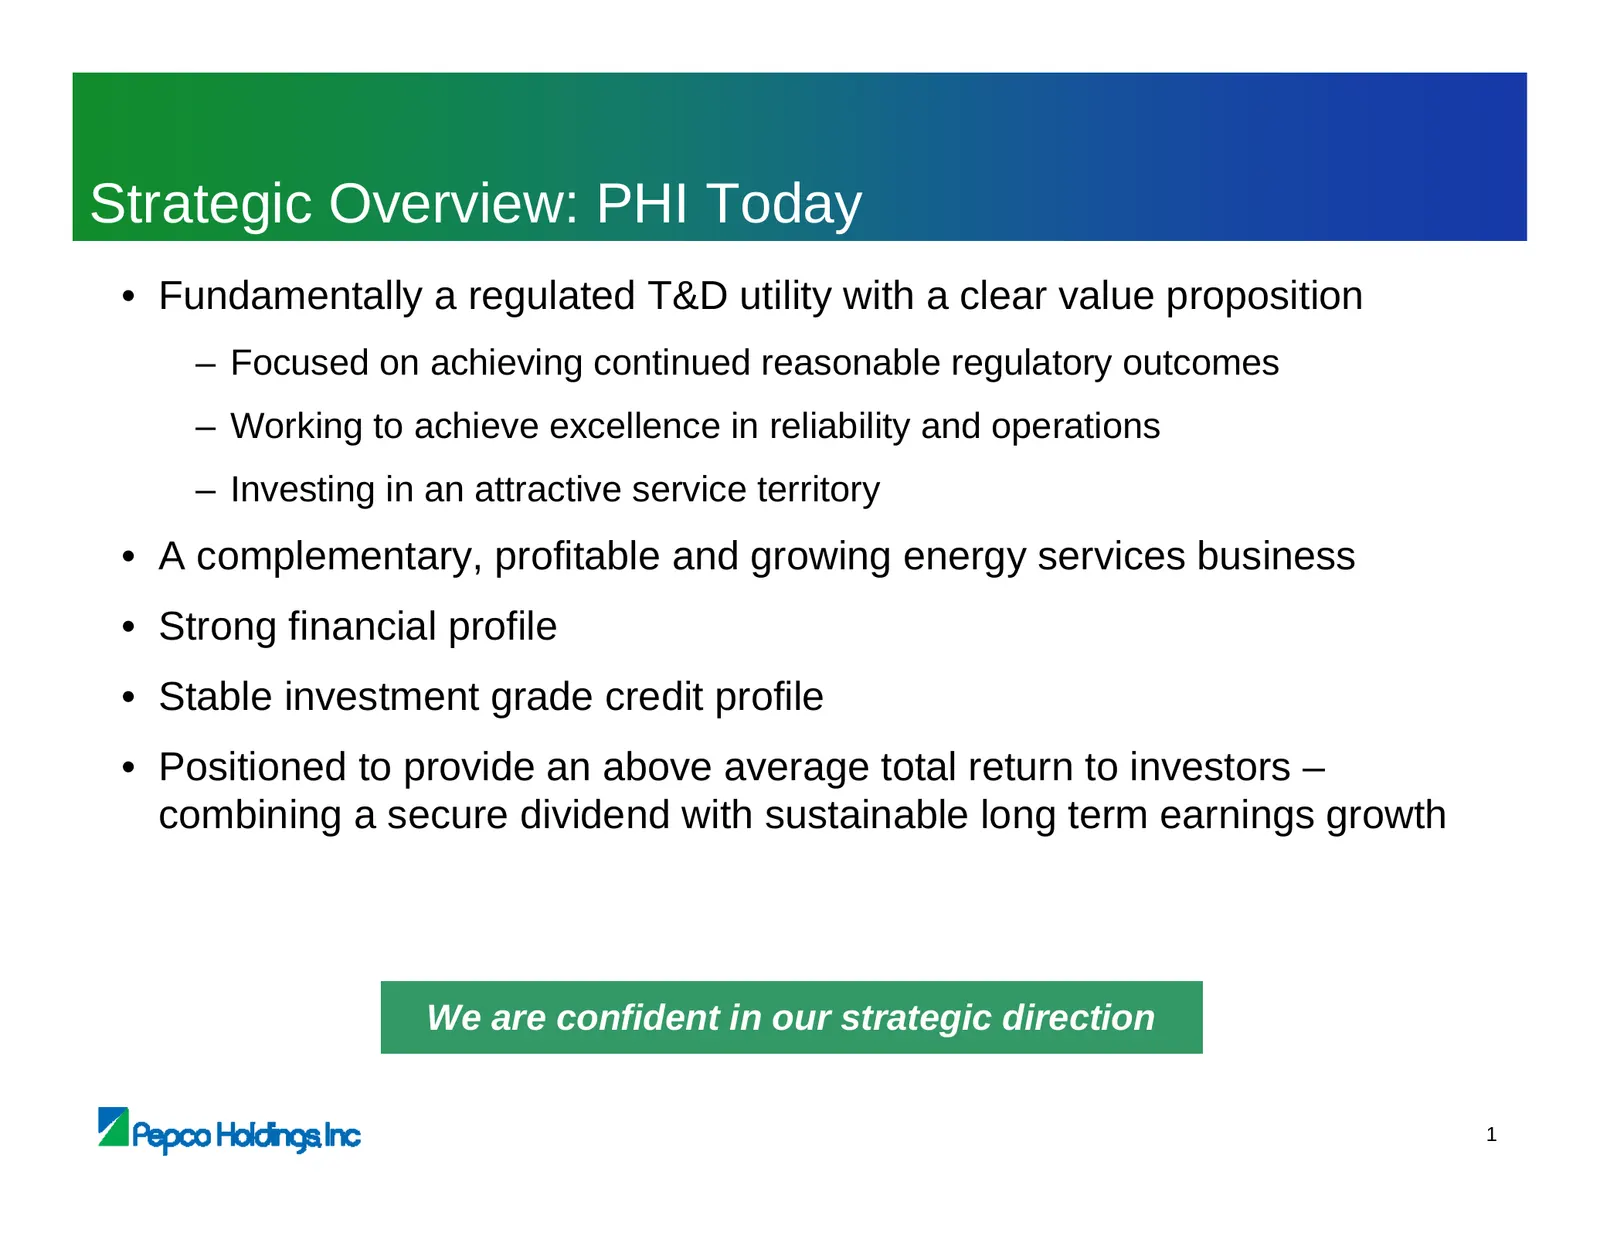
Strategic Overview: PHI Today • Fundamentally a regulated T&D utility with a clear value proposition – Focused on achieving continued reasonable regulatory outcomes – Working to achieve excellence in reliability and operations – Investing in an attractive service territory • A complementary, profita
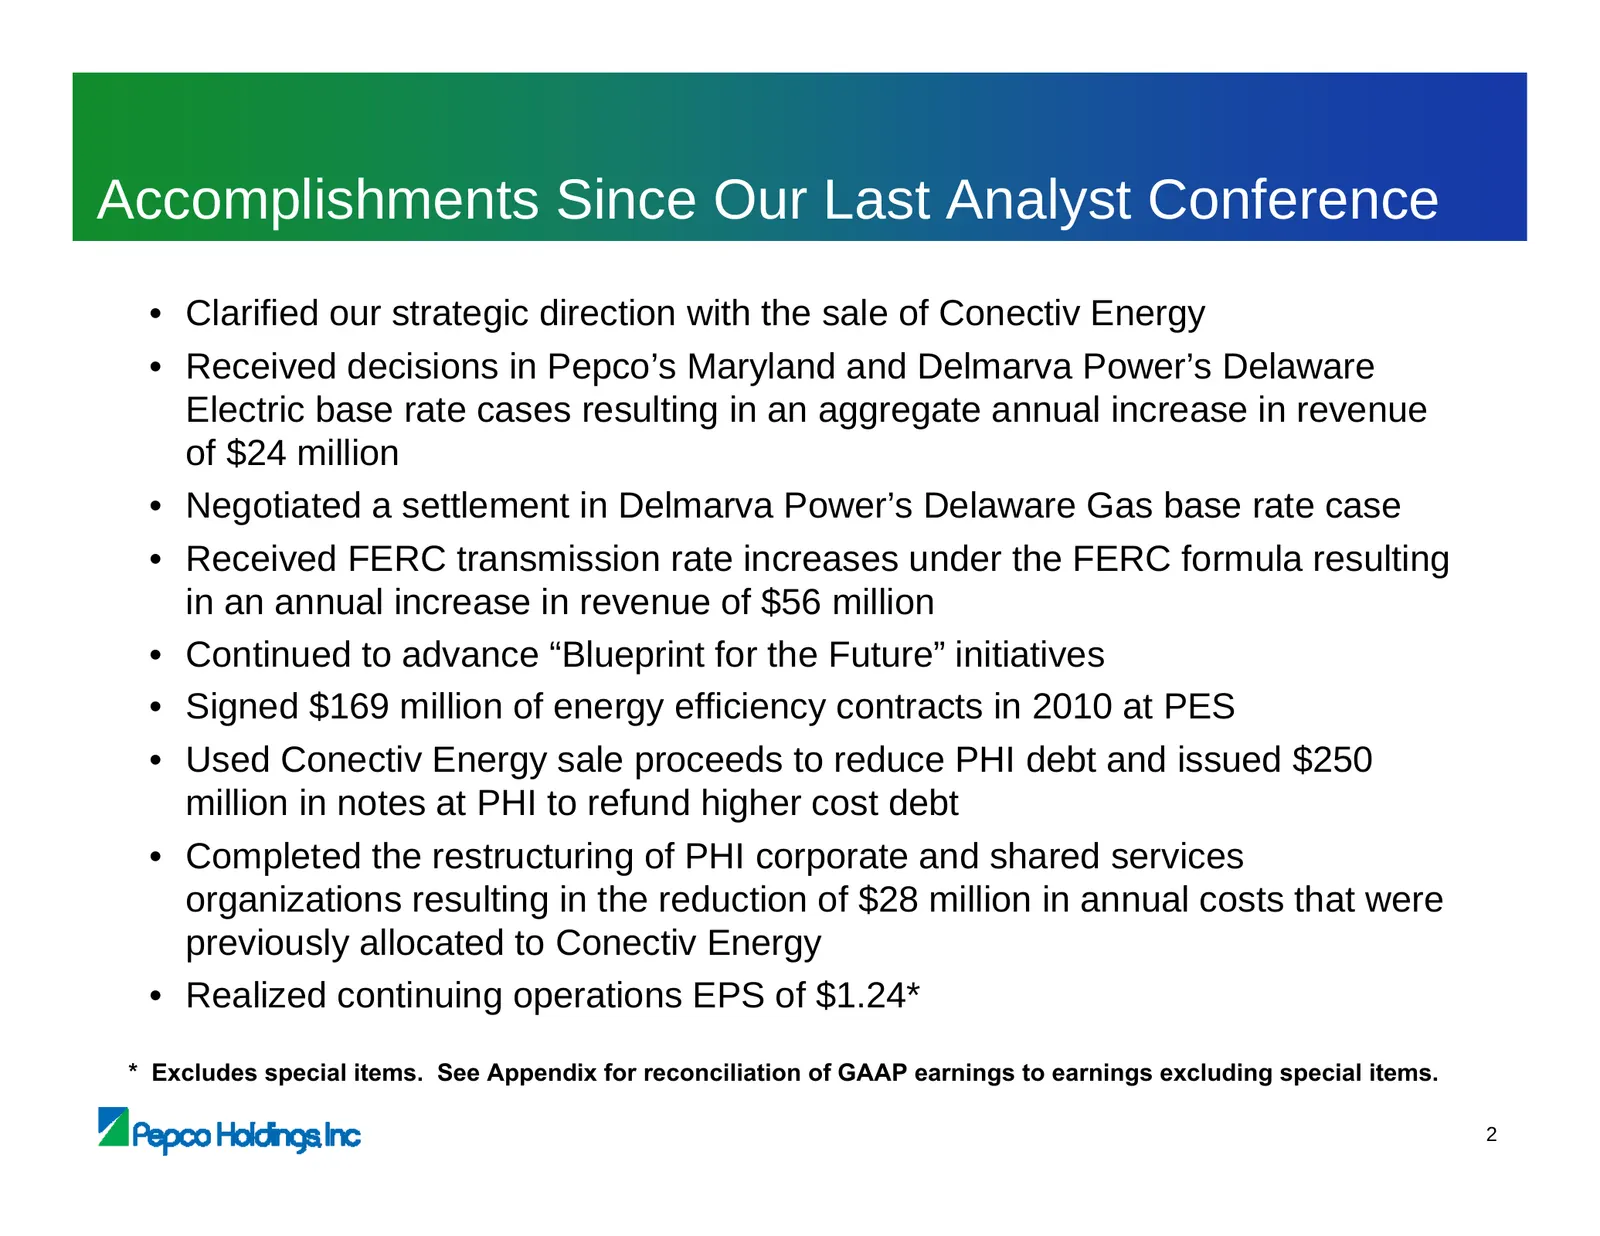
Slide 6: Accomplishments Since Our Last Analyst Conference
Accomplishments Since Our Last Analyst Conference • Clarified our strategic direction with the sale of Conectiv Energy • Received decisions in Pepco’s Maryland and Delmarva Power’s Delaware Electric base rate cases resulting in an aggregate annual increase in revenue of $24 million • Negotiated a se
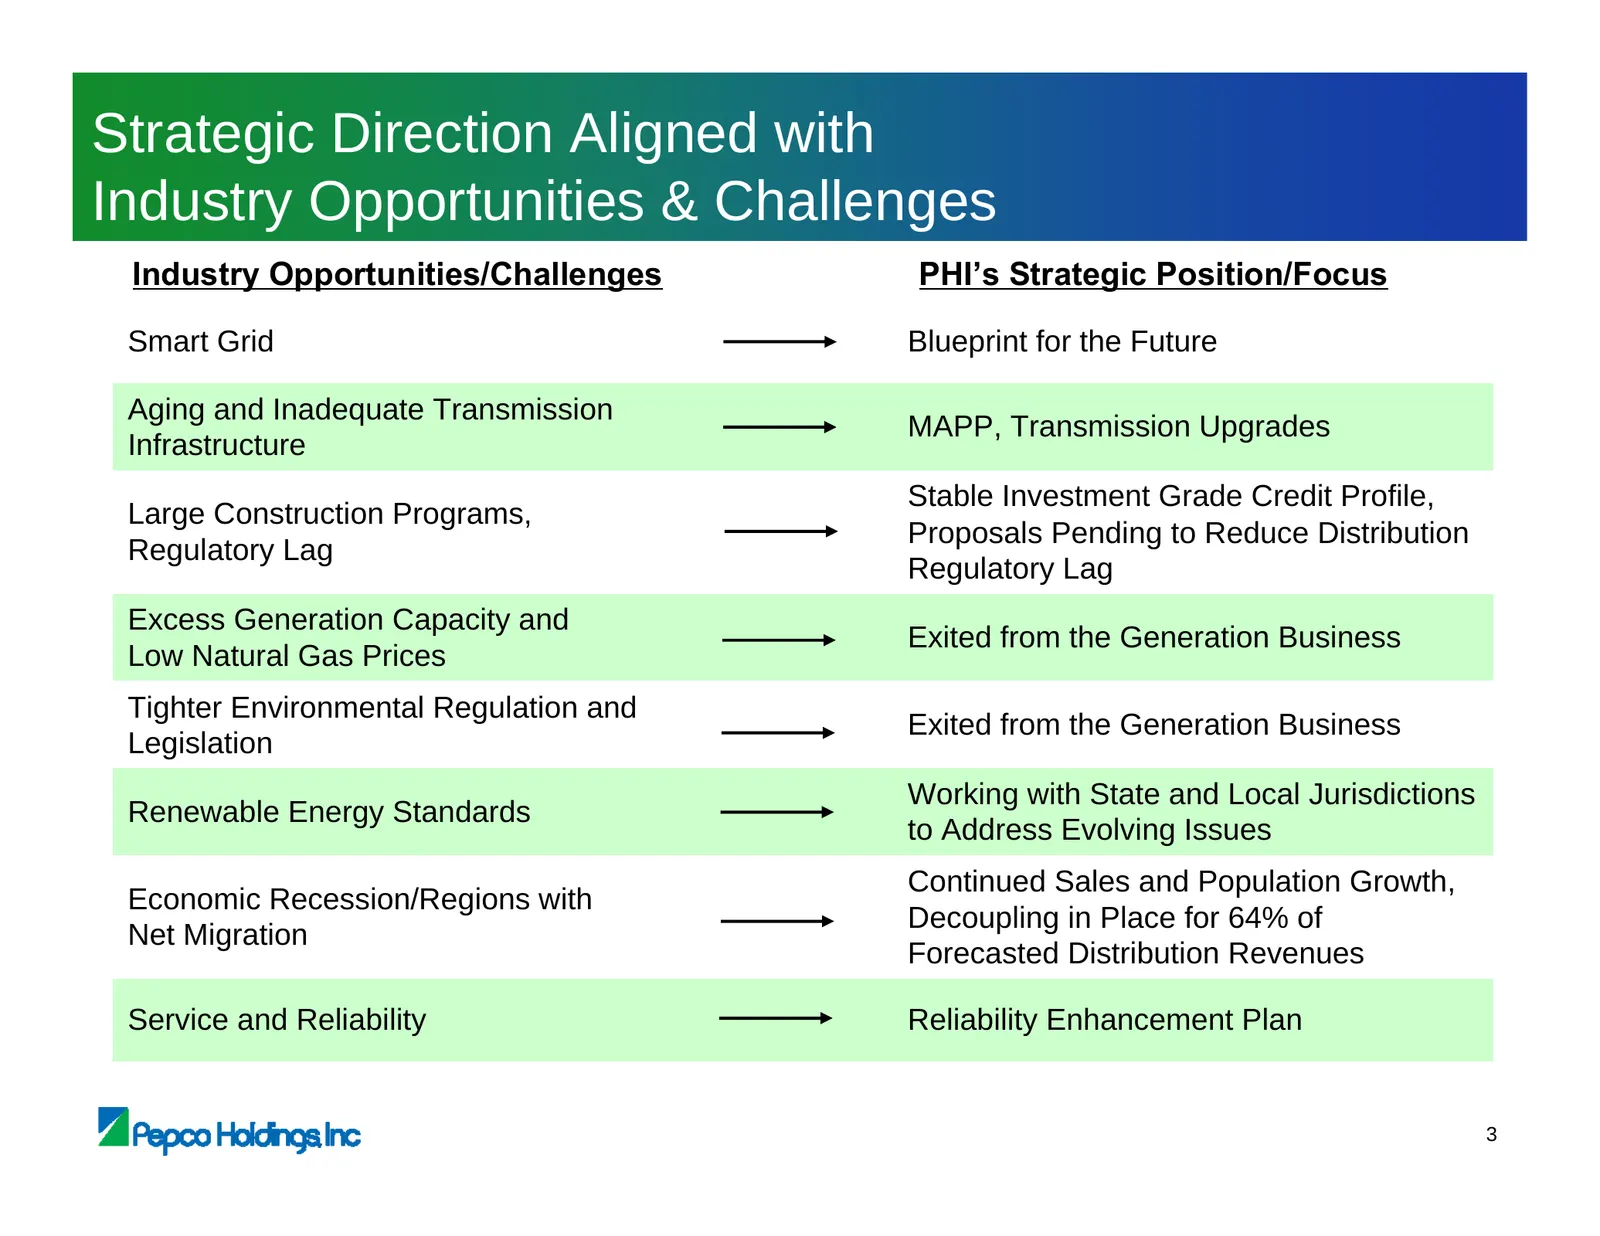
Slide 7: Strategic Direction Aligned with Industry Opportunities & Challenges
Strategic Direction Aligned with Industry Opportunities & Challenges Industry Opportunities/Challenges PHI’s Strategic Position/Focus Smart Grid Blueprint for the Future Aging and Inadequate Transmission MAPP, Transmission Upgrades Infrastructure Stable Investment Grade Credit Profile, Large Constru
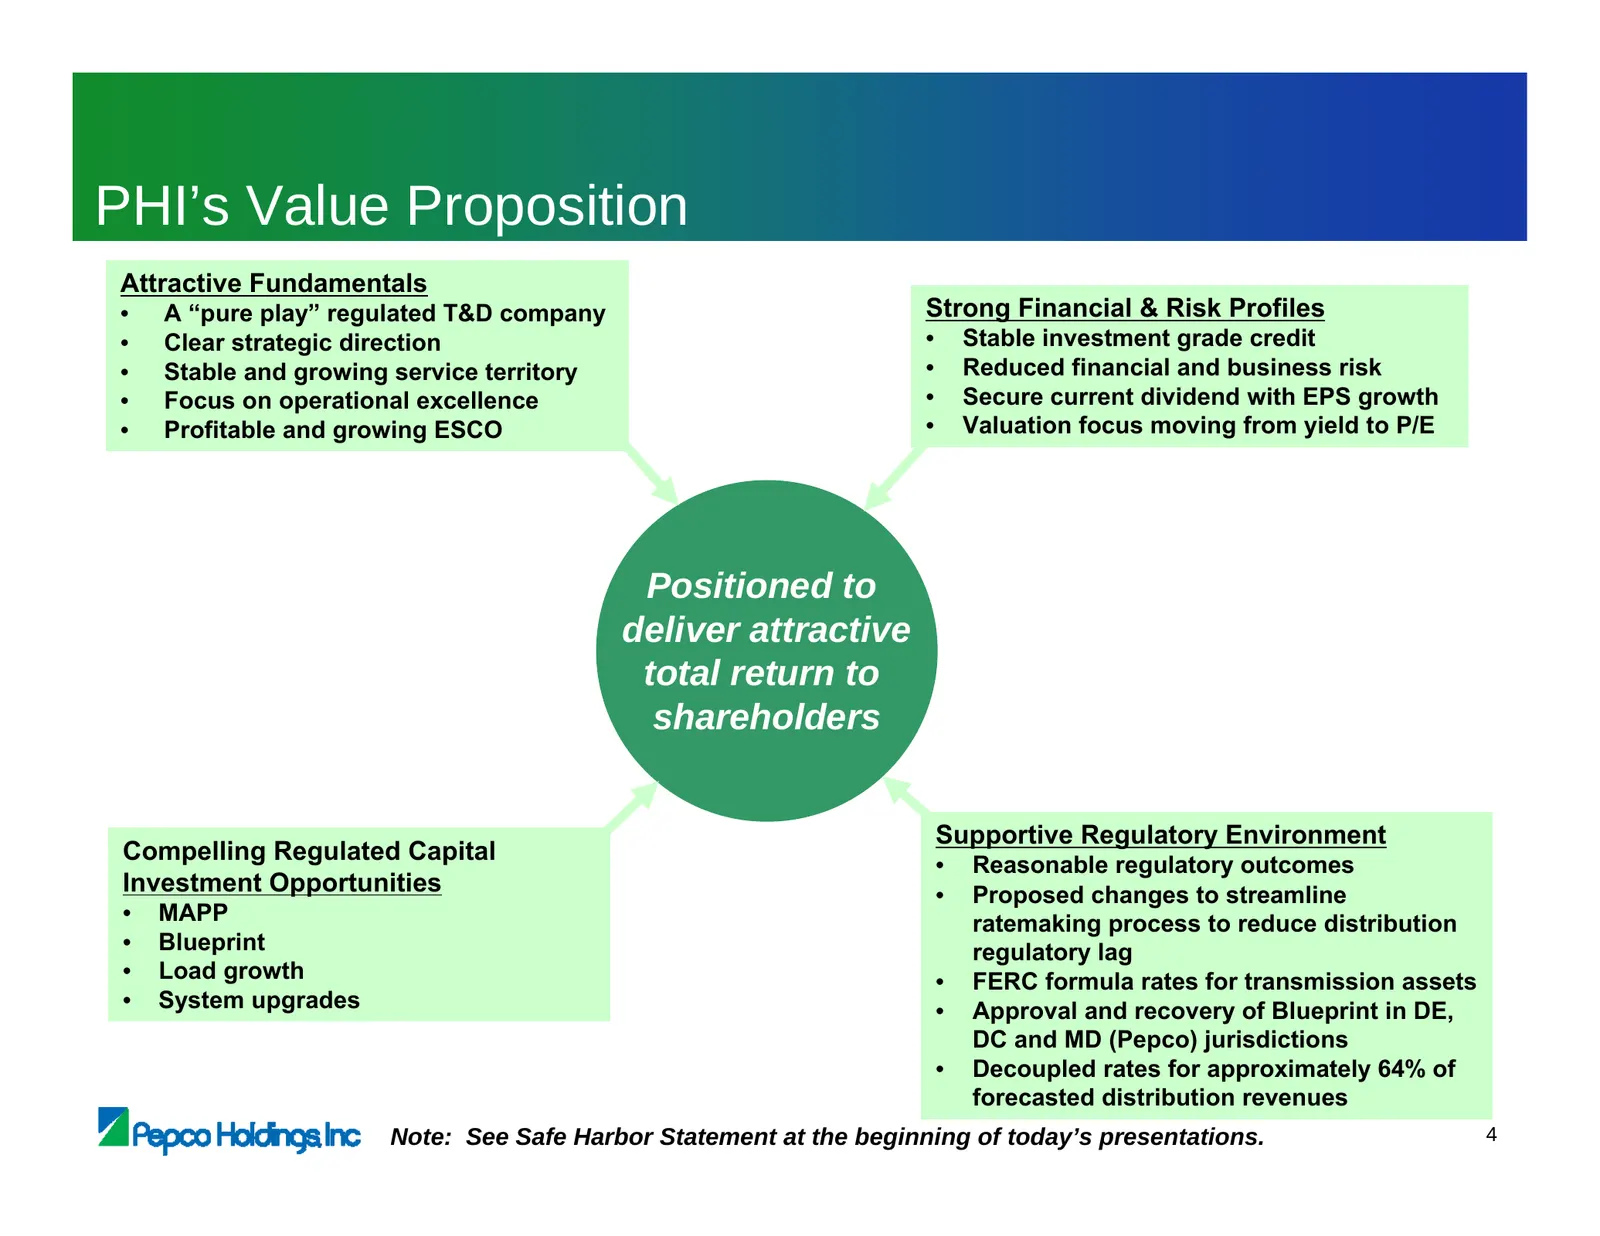
Slide 8: PHI’s Value Proposition
PHI’s Value Proposition Attractive Fundamentals • A “pure play” regulated T&D company Strong Financial & Risk Profiles • Clear strategic direction • Stable investment grade credit • Stable and growing service territory • Reduced financial and business risk • Focus on operational excellence • Secure
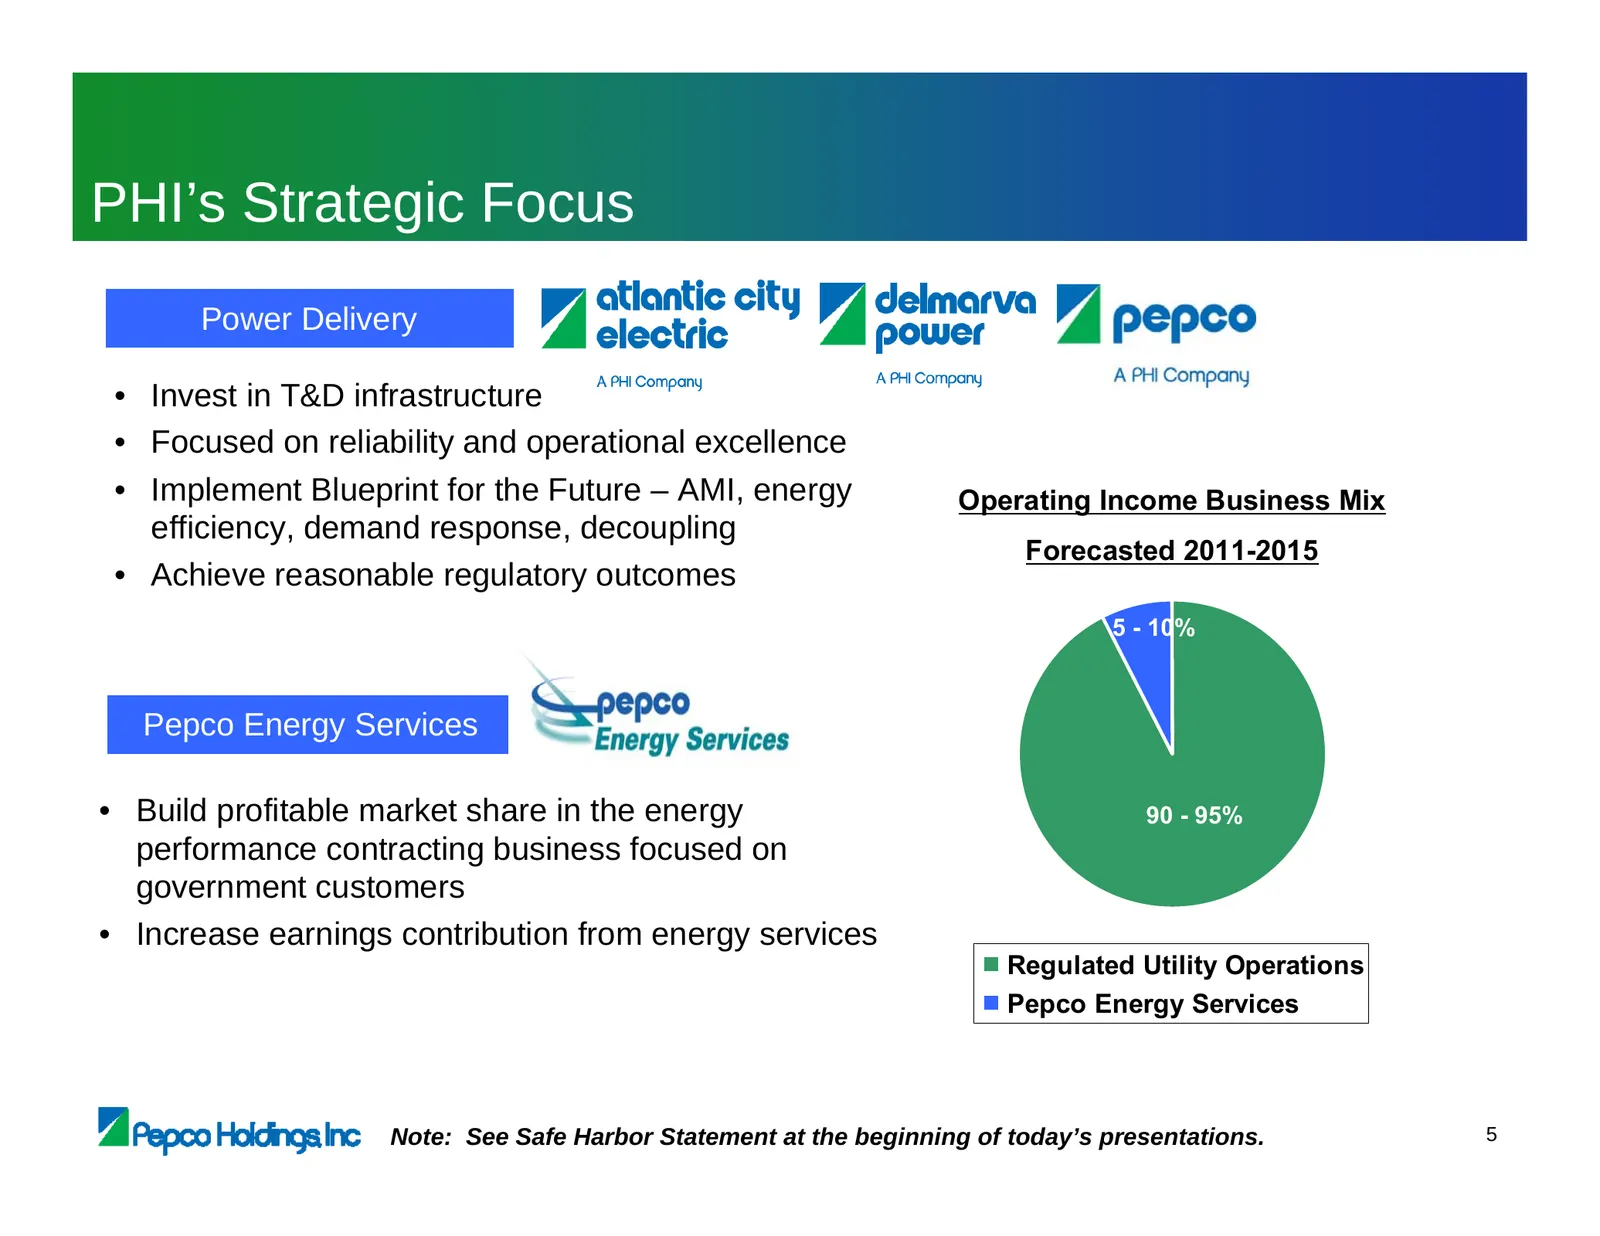
Slide 9: PHI’s Strategic Focus
PHI’s Strategic Focus Power Delivery • Invest in T&D infrastructure • Focused on reliability and operational excellence • Implement Blueprint for the Future – AMI, energy Operating Income Business Mix efficiency, demand response, decoupling Forecasted 2011-2015 • Achieve reasonable regulatory outcom
Slide 10: Strong T&D Infrastructure Investment Growth
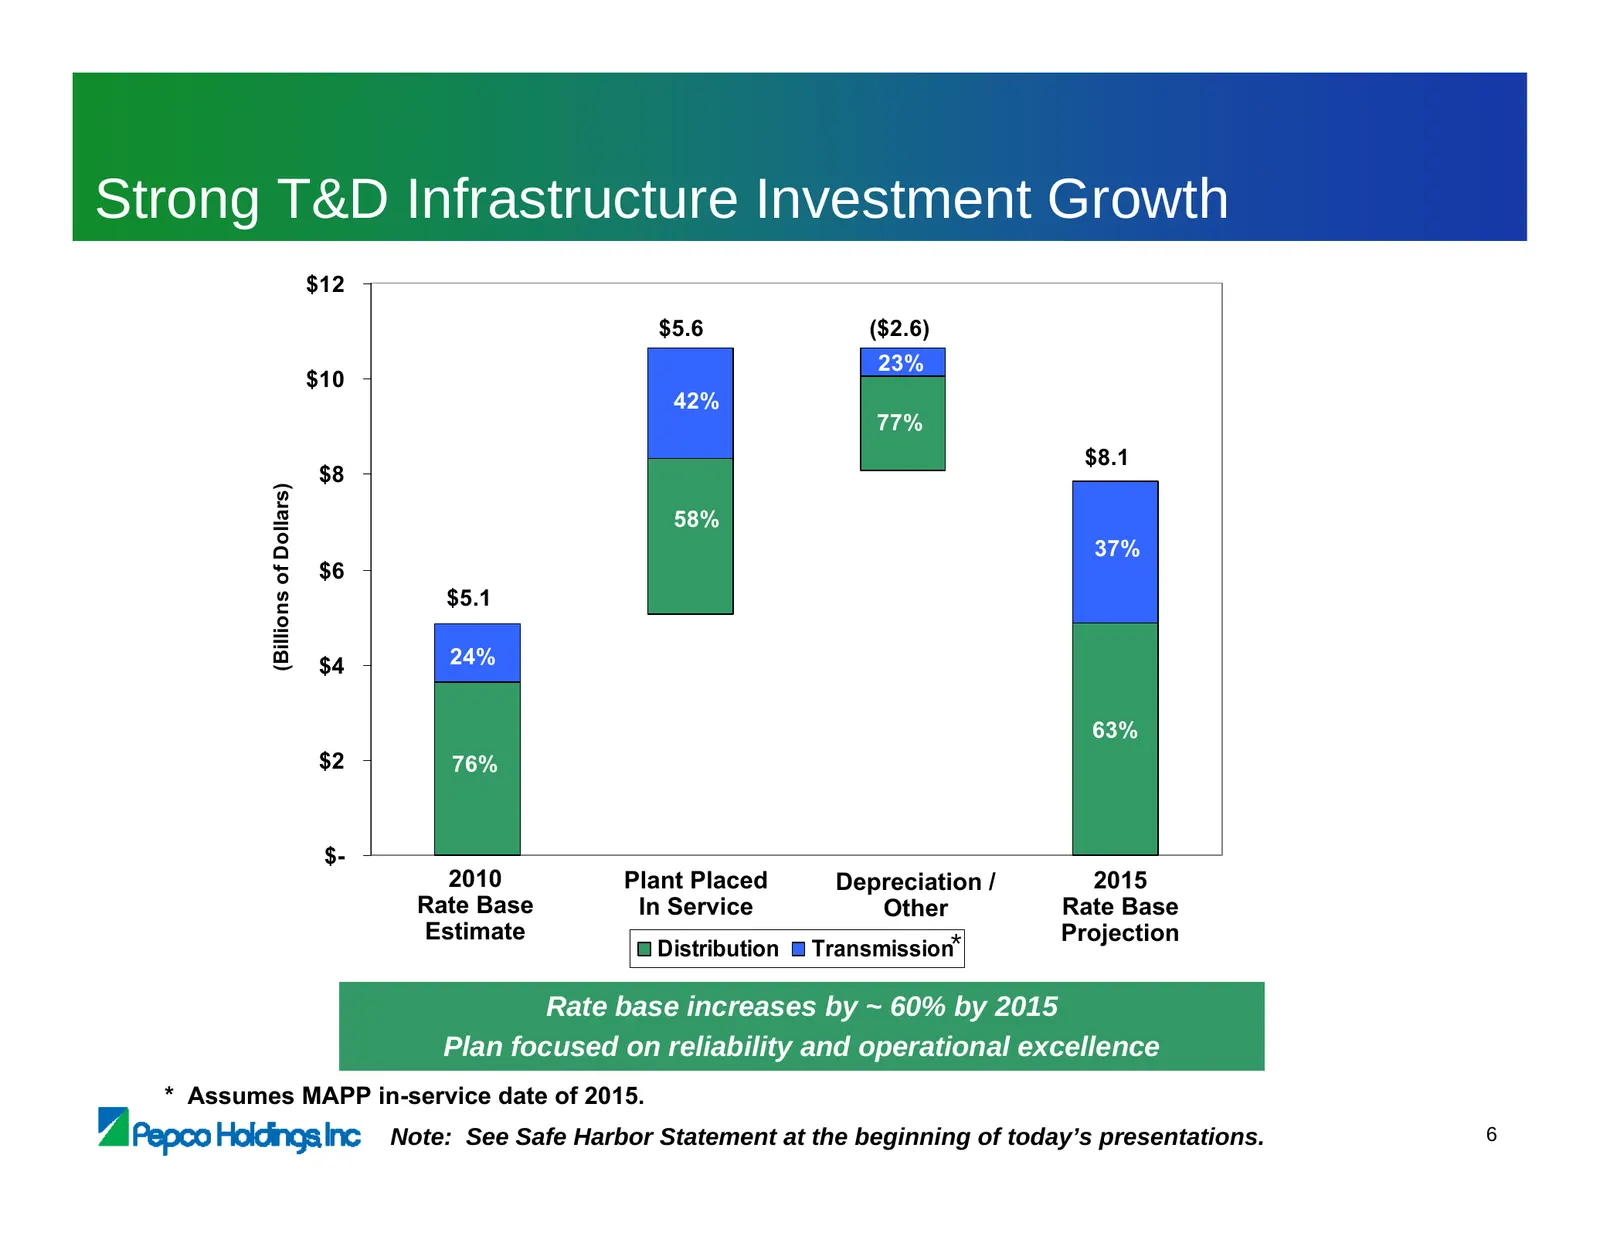
Strong T&D Infrastructure Investment Growth $12 $5.6 ($2.6) 23% $10 42% 77% $8.1 $8 (Billions of Dollars) 58% 37% $6 $5.1 $4 24% 63% $2 76% $- 2010 Plant Placed Depreciation / 2015 Rate Base In Service Other Rate Base Estimate Projection Distribution Transmission* Rate base increases by ~ 60% by 201
Slide 11: PHI Key Challenges
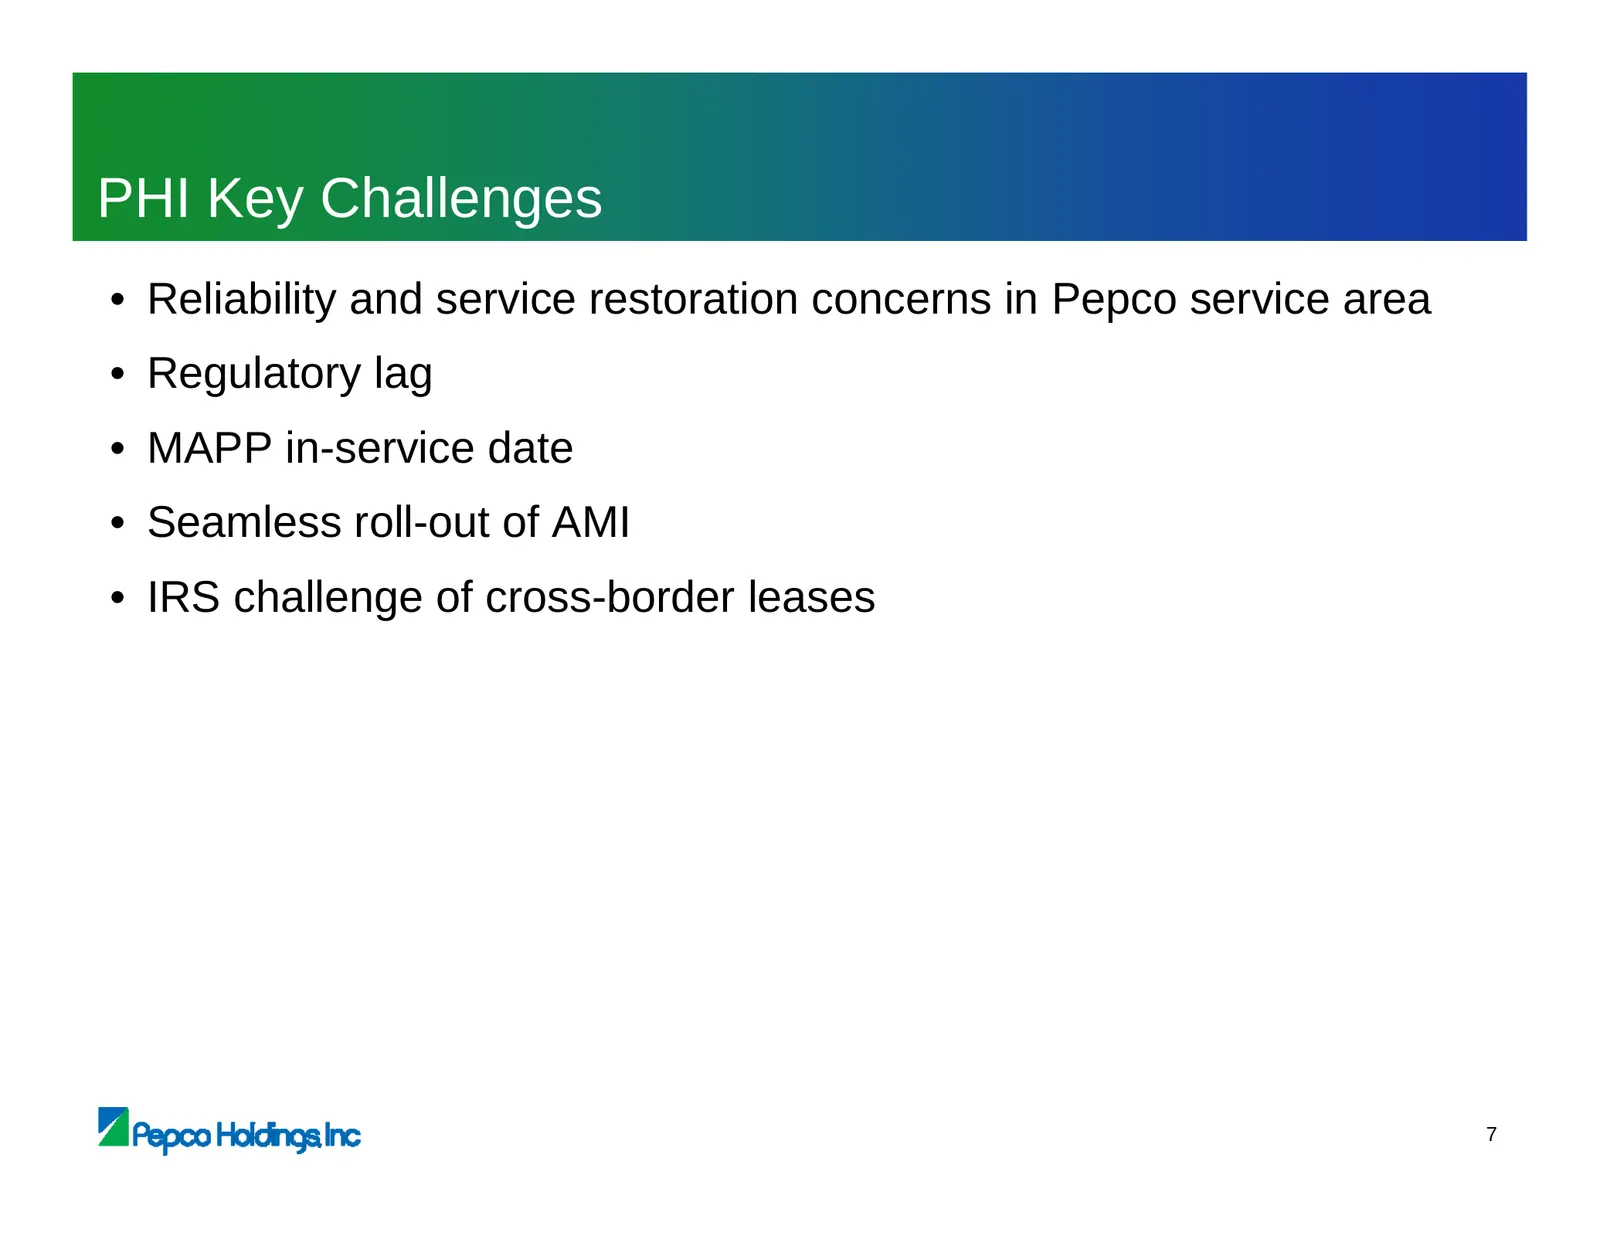
PHI Key Challenges • Reliability and service restoration concerns in Pepco service area • Regulatory lag • MAPP in-service date • Seamless roll-out of AMI • IRS challenge of cross-border leases 7
Slide 12: 2011 Focus
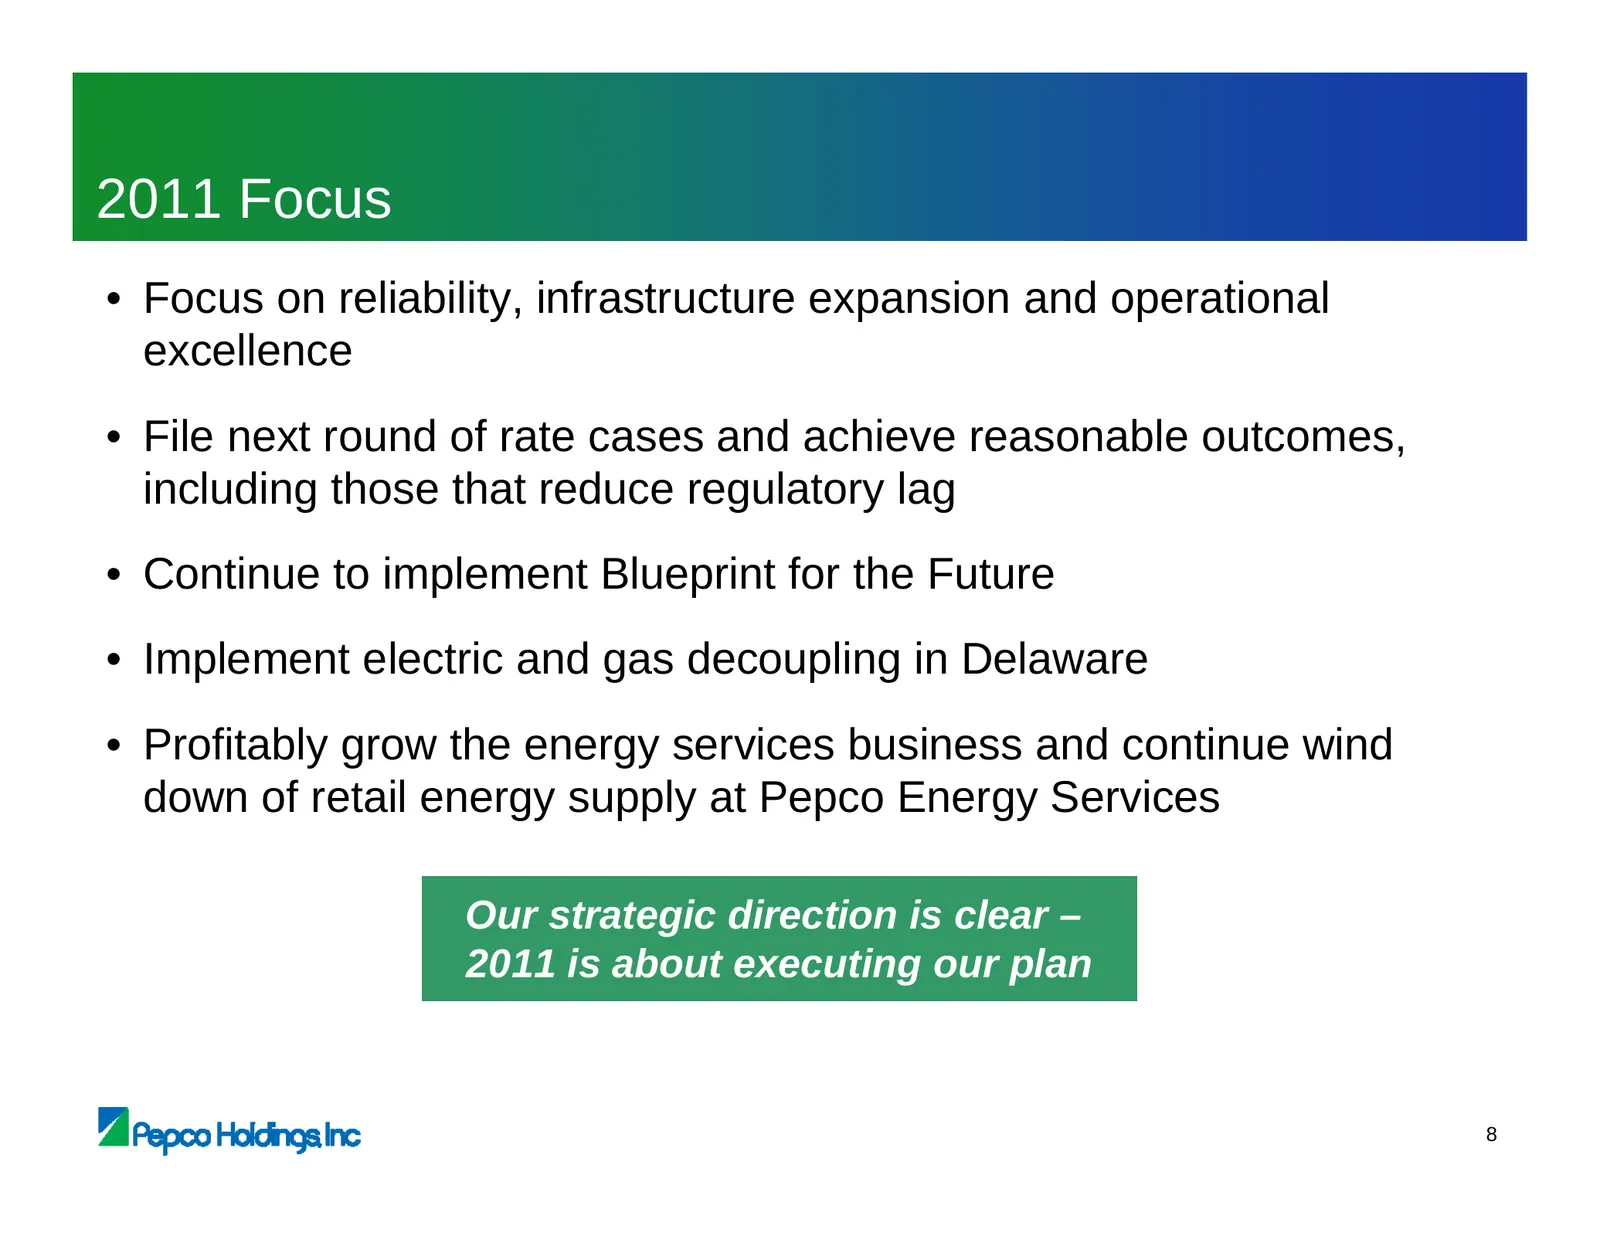
2011 Focus • Focus on reliability, infrastructure expansion and operational excellence • File next round of rate cases and achieve reasonable outcomes, including those that reduce regulatory lag • Continue to implement Blueprint for the Future • Implement electric and gas decoupling in Delaware • Pr
Slide 13: PHI – Well Positioned
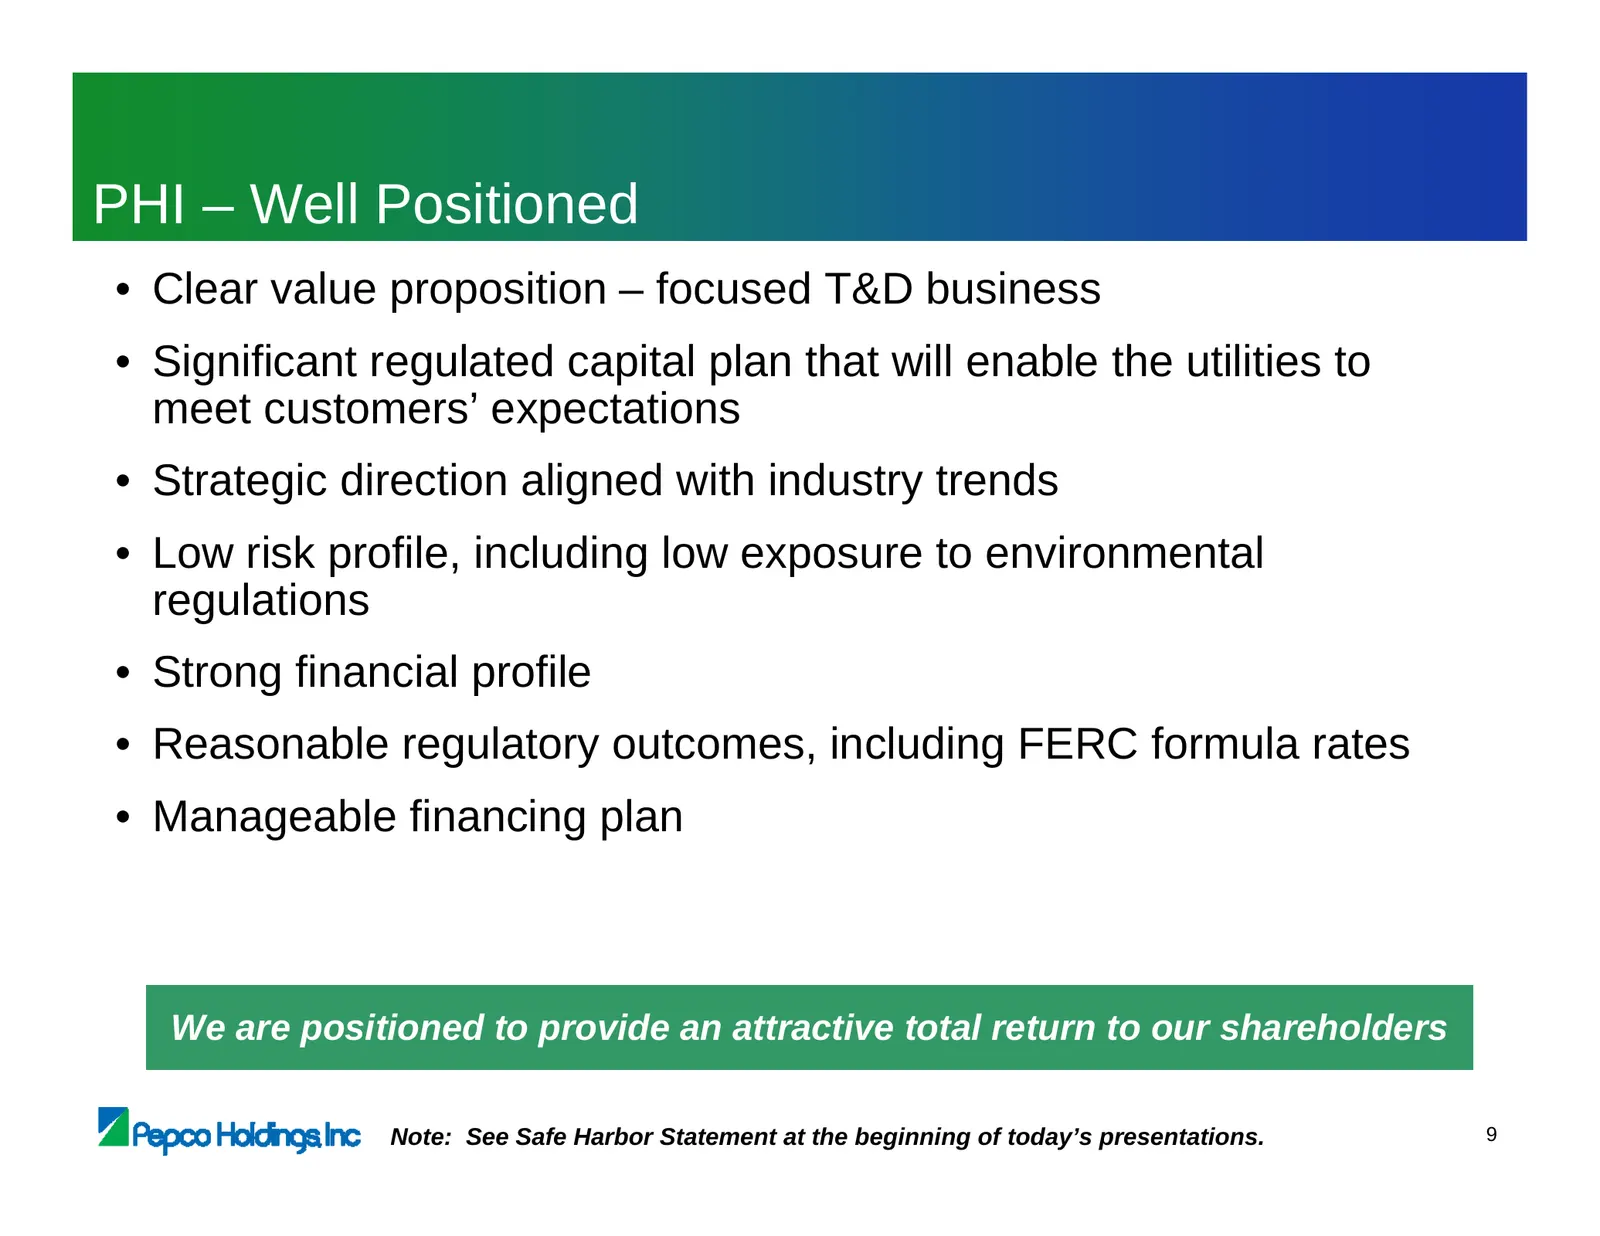
PHI – Well Positioned • Clear value proposition – focused T&D business • Significant regulated capital plan that will enable the utilities to meet customers’ expectations • Strategic direction aligned with industry trends • Low risk profile, including low exposure to environmental regulations • Stro
Slide 14: Strategic Overview
Strategic Overview Joe Rigby Chairman, President & Chief Executive Officer
Slide 15: Appendix
Appendix VA Pepco Holdings inc
Slide 16: Reconciliation of GAAP Earnings to Earnings Excluding Special Items
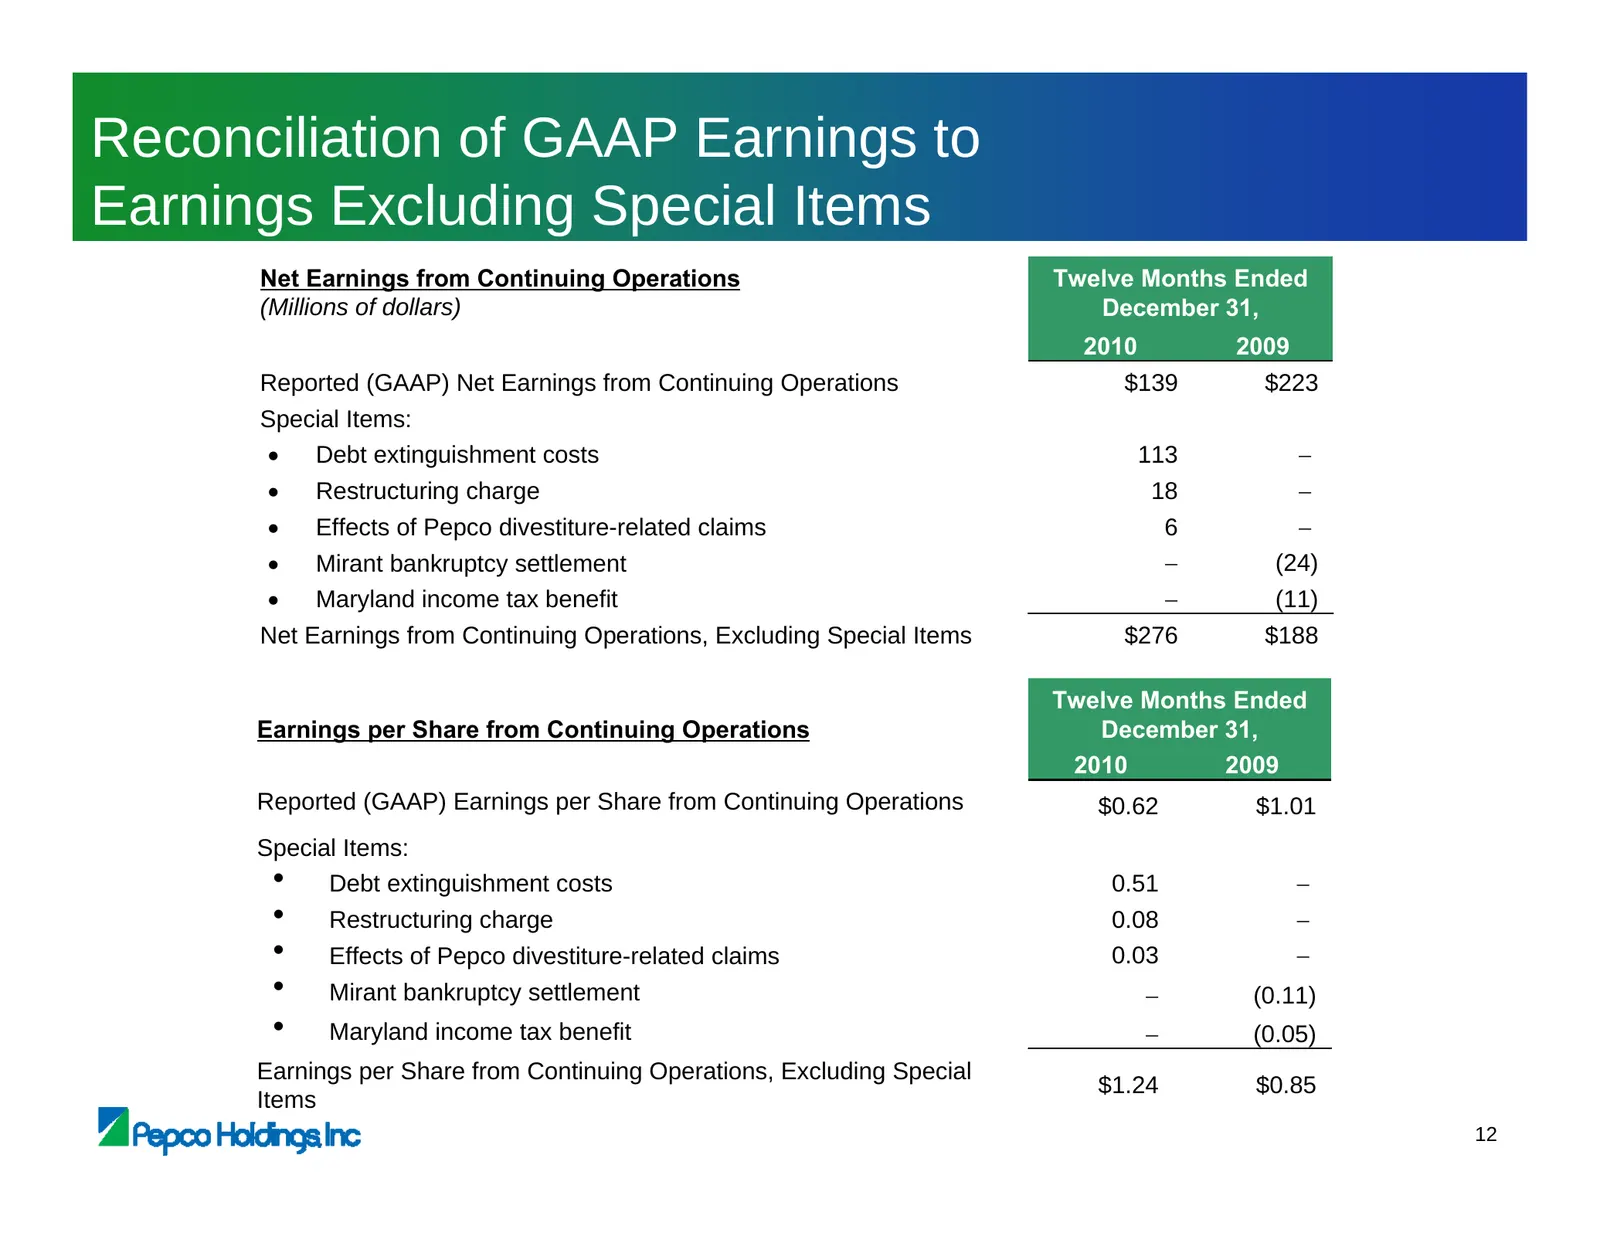
Reconciliation of GAAP Earnings to Earnings Excluding Special Items Net Earnings from Continuing Operations Twelve Months Ended (Millions of dollars) December 31, 2010 2009 Reported (GAAP) Net Earnings from Continuing Operations $139 $223 Special Items: • Debt extinguishment costs 113 − • Restructur
Slide 17: Power Delivery
Power Delivery Dave Velazquez Executive Vice President, Power Delivery
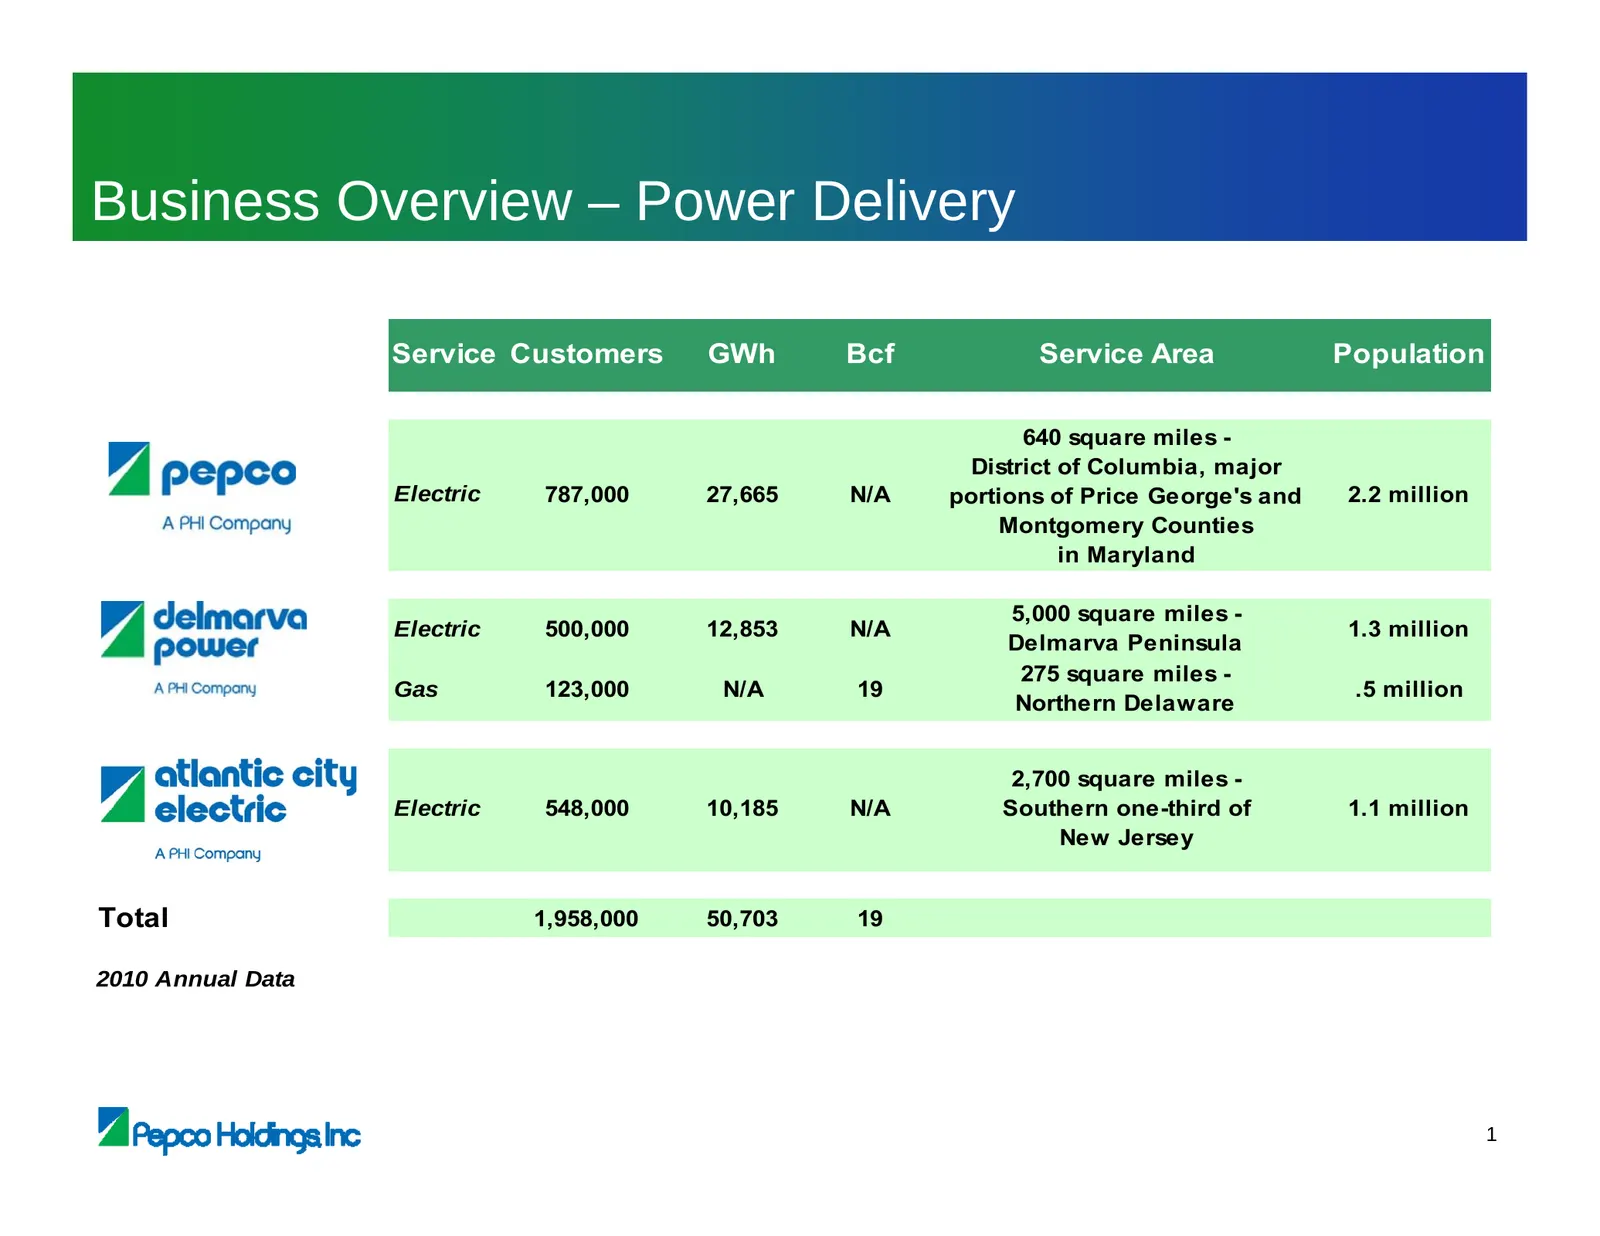
Slide 18: Business Overview – Power Delivery
Business Overview – Power Delivery Service Customers GWh Bcf Service Area Population 640 square miles - District of Columbia, major Electric 787,000 27,665 N/A portions of Price George's and 2.2 million Montgomery Counties in Maryland 5,000 square miles - Electric 500,000 12,853 N/A 1.3 million Delm
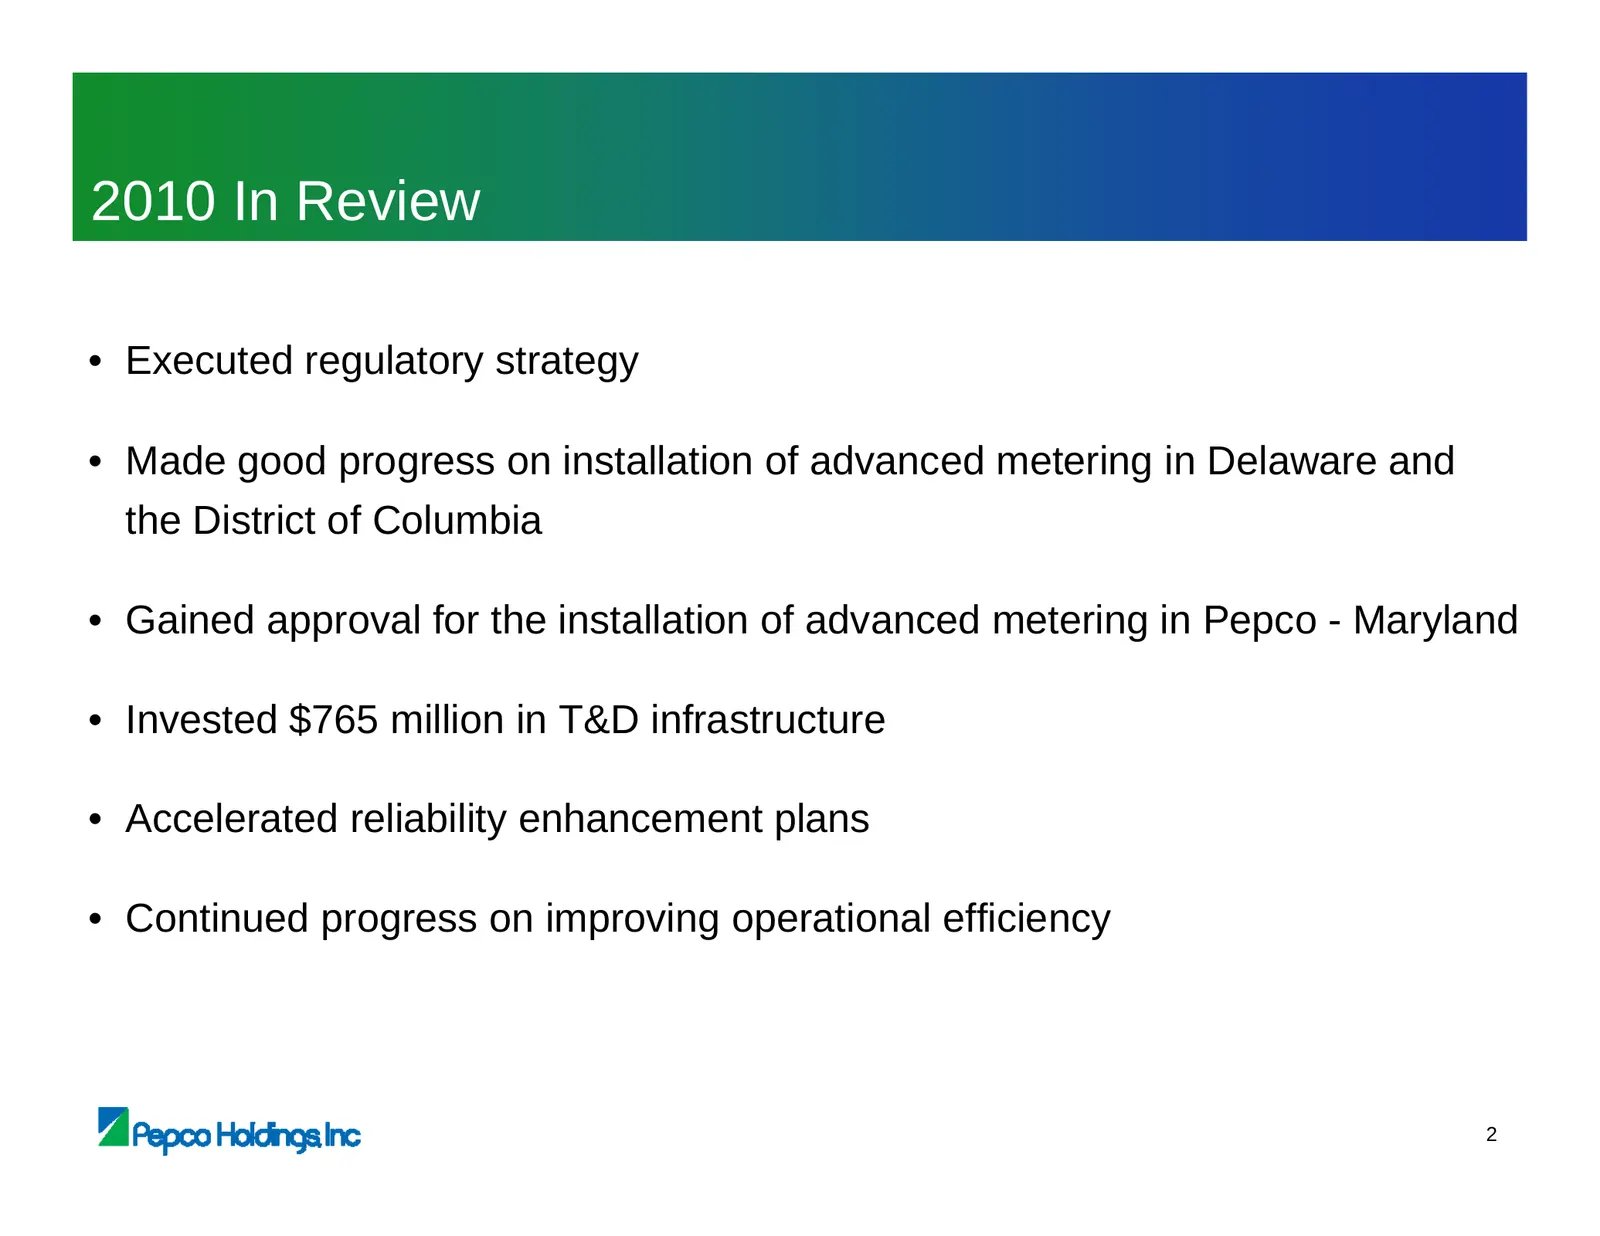
Slide 19: 2010 In Review
2010 In Review • Executed regulatory strategy • Made good progress on installation of advanced metering in Delaware and the District of Columbia • Gained approval for the installation of advanced metering in Pepco - Maryland • Invested $765 million in T&D infrastructure • Accelerated reliability enh
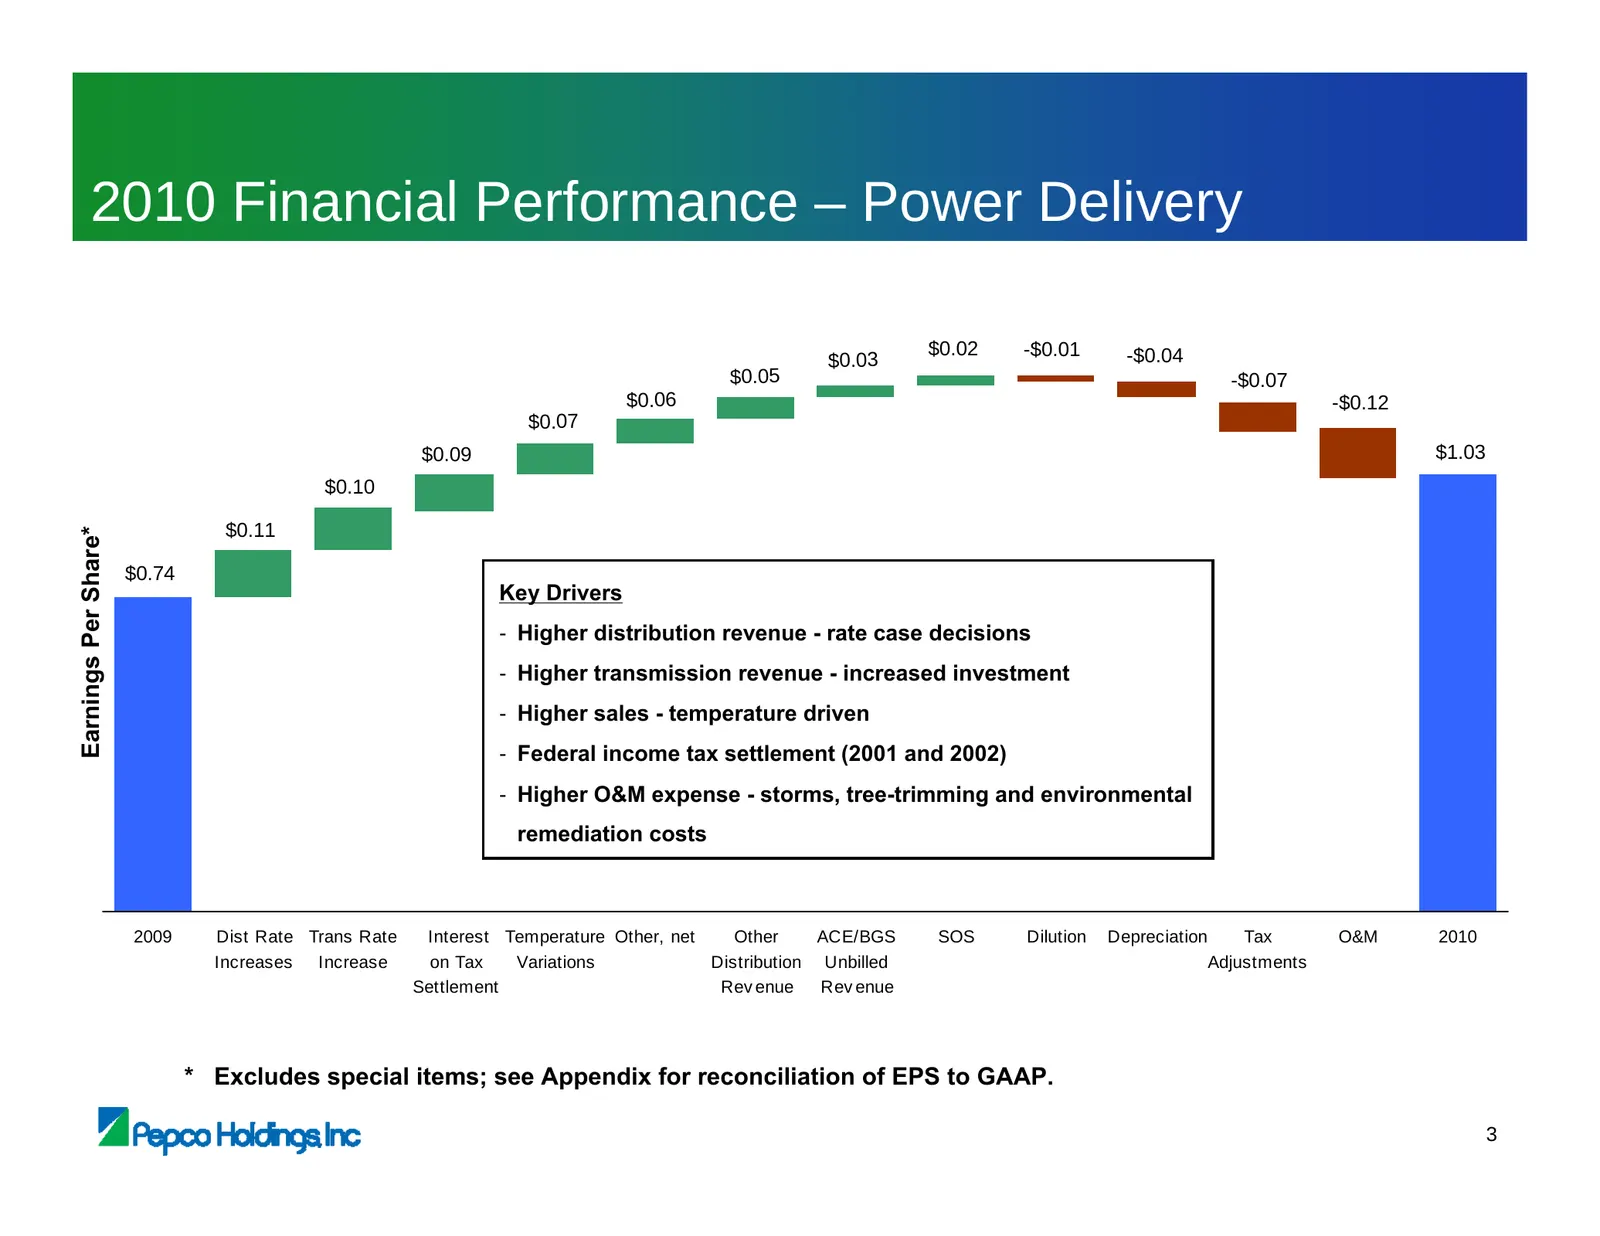
Slide 20: 2010 Financial Performance – Power Delivery
2010 Financial Performance – Power Delivery $0.02 -$0.01 -$0.04 $0.03 $0.05 -$0.07 $0.06 -$0.12 $0.07 $0.09 $1.03 $0.10 $0.11 Earnings Per Share* $0.74 Key Drivers - Higher distribution revenue - rate case decisions - Higher transmission revenue - increased investment - Higher sales - temperature dr
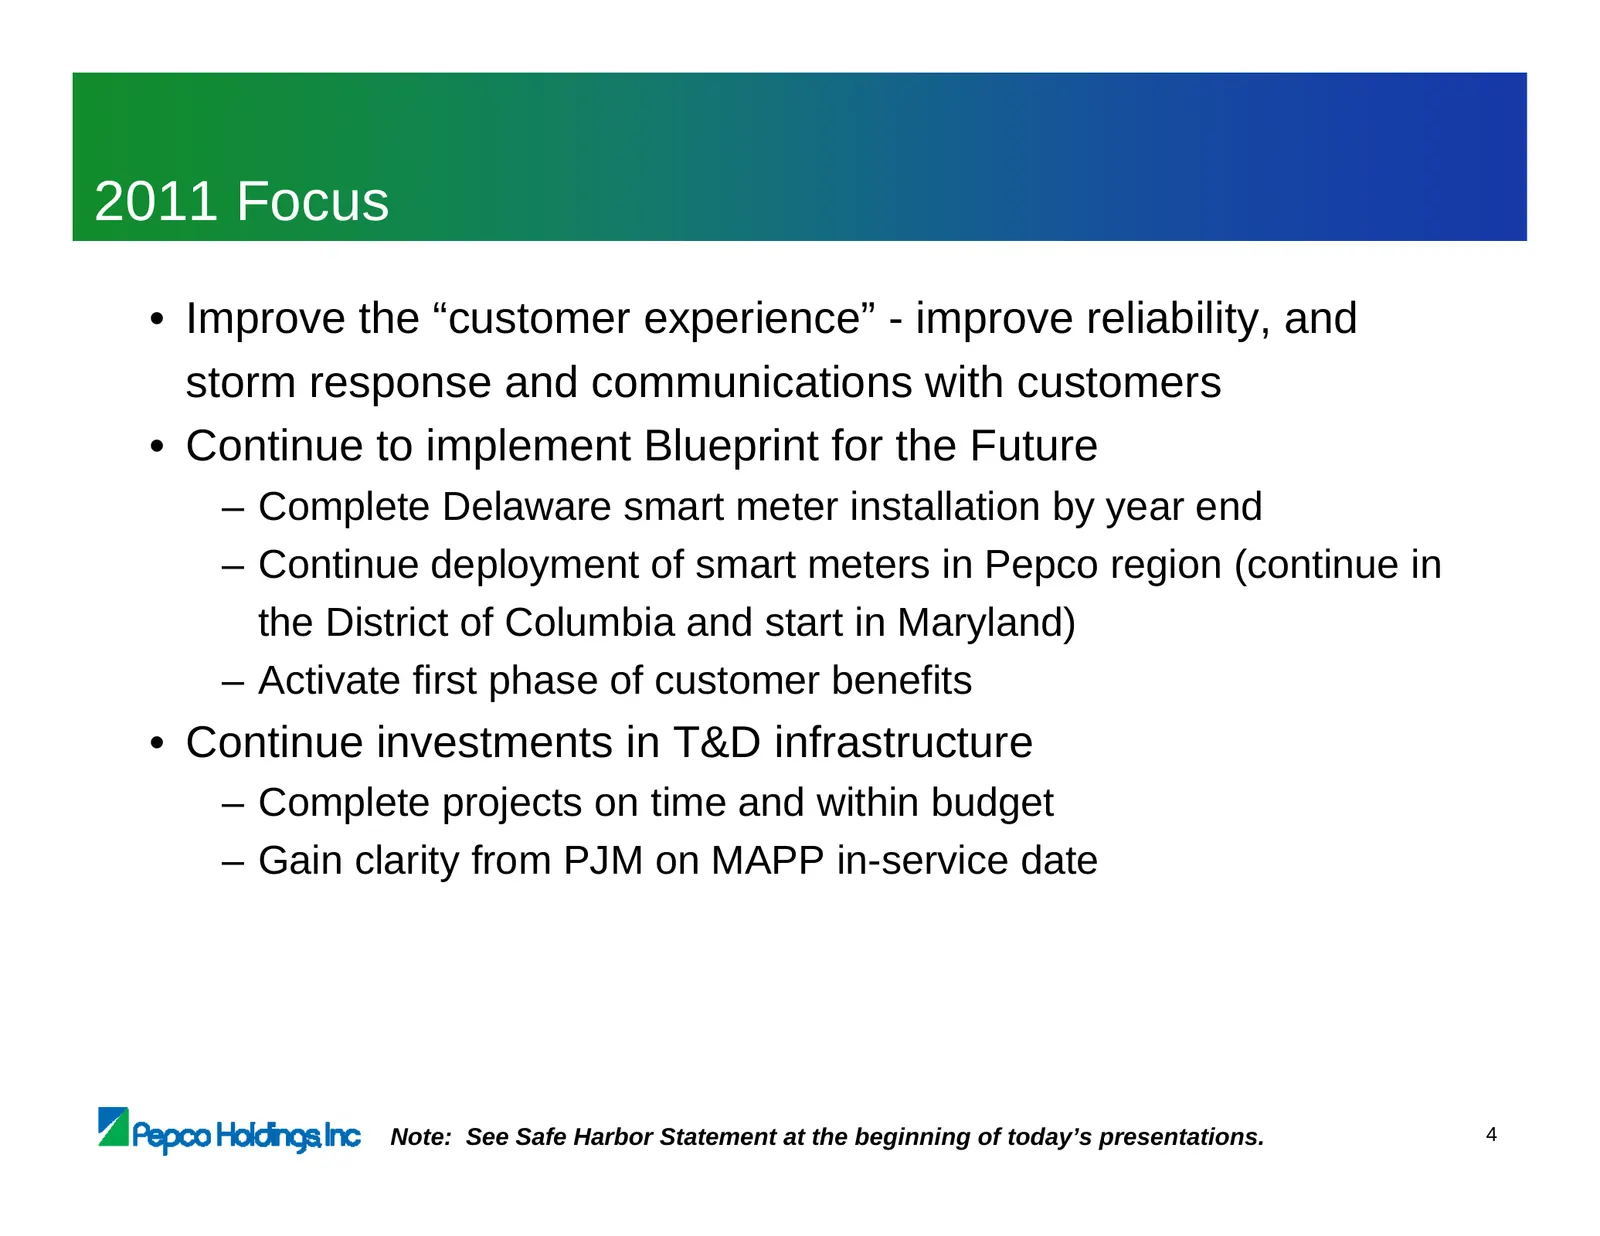
Slide 21: 2011 Focus
2011 Focus • Improve the “customer experience” - improve reliability, and storm response and communications with customers • Continue to implement Blueprint for the Future – Complete Delaware smart meter installation by year end – Continue deployment of smart meters in Pepco region (continue in the
Slide 22: Diverse, Stable Service Territory
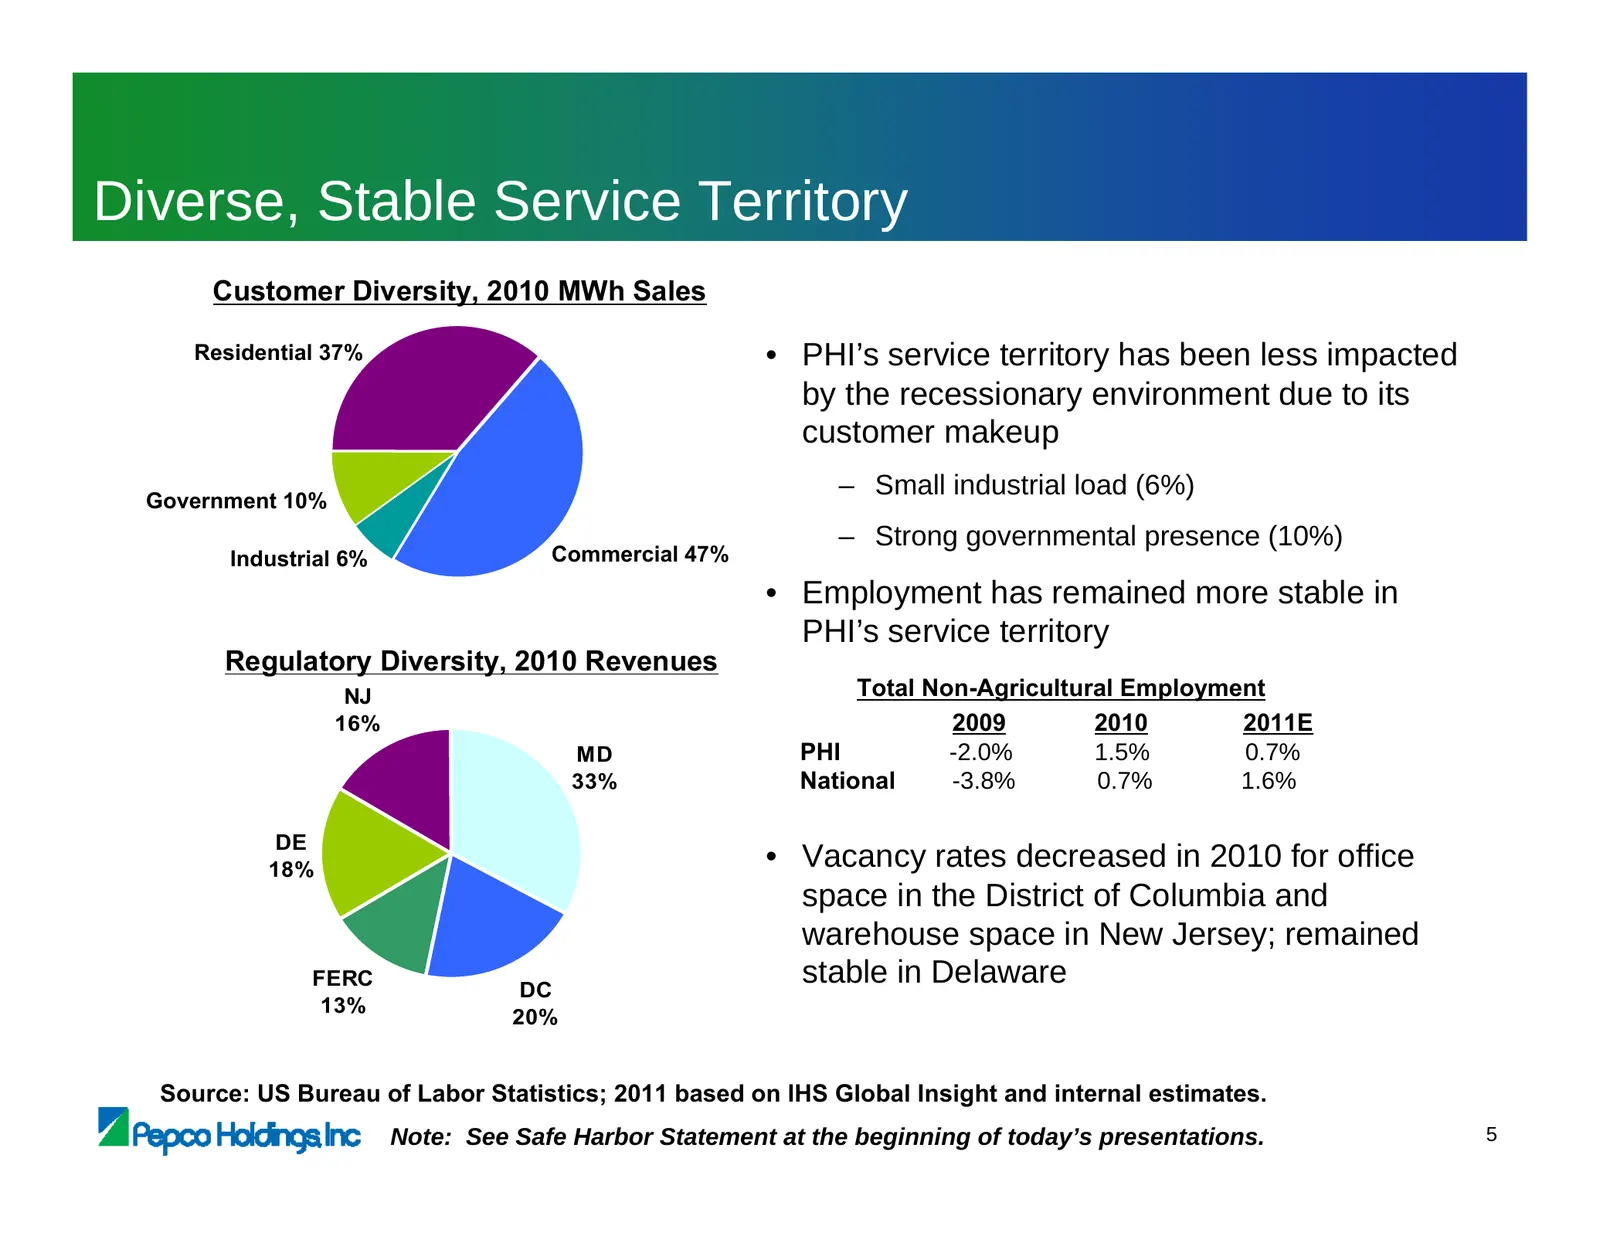
Diverse, Stable Service Territory Customer Diversity, 2010 MWh Sales Residential 37% • PHI’s service territory has been less impacted by the recessionary environment due to its customer makeup Government 10% – Small industrial load (6%) – Strong governmental presence (10%) Industrial 6% Commercial 4
Slide 23: Sales and Customer Growth
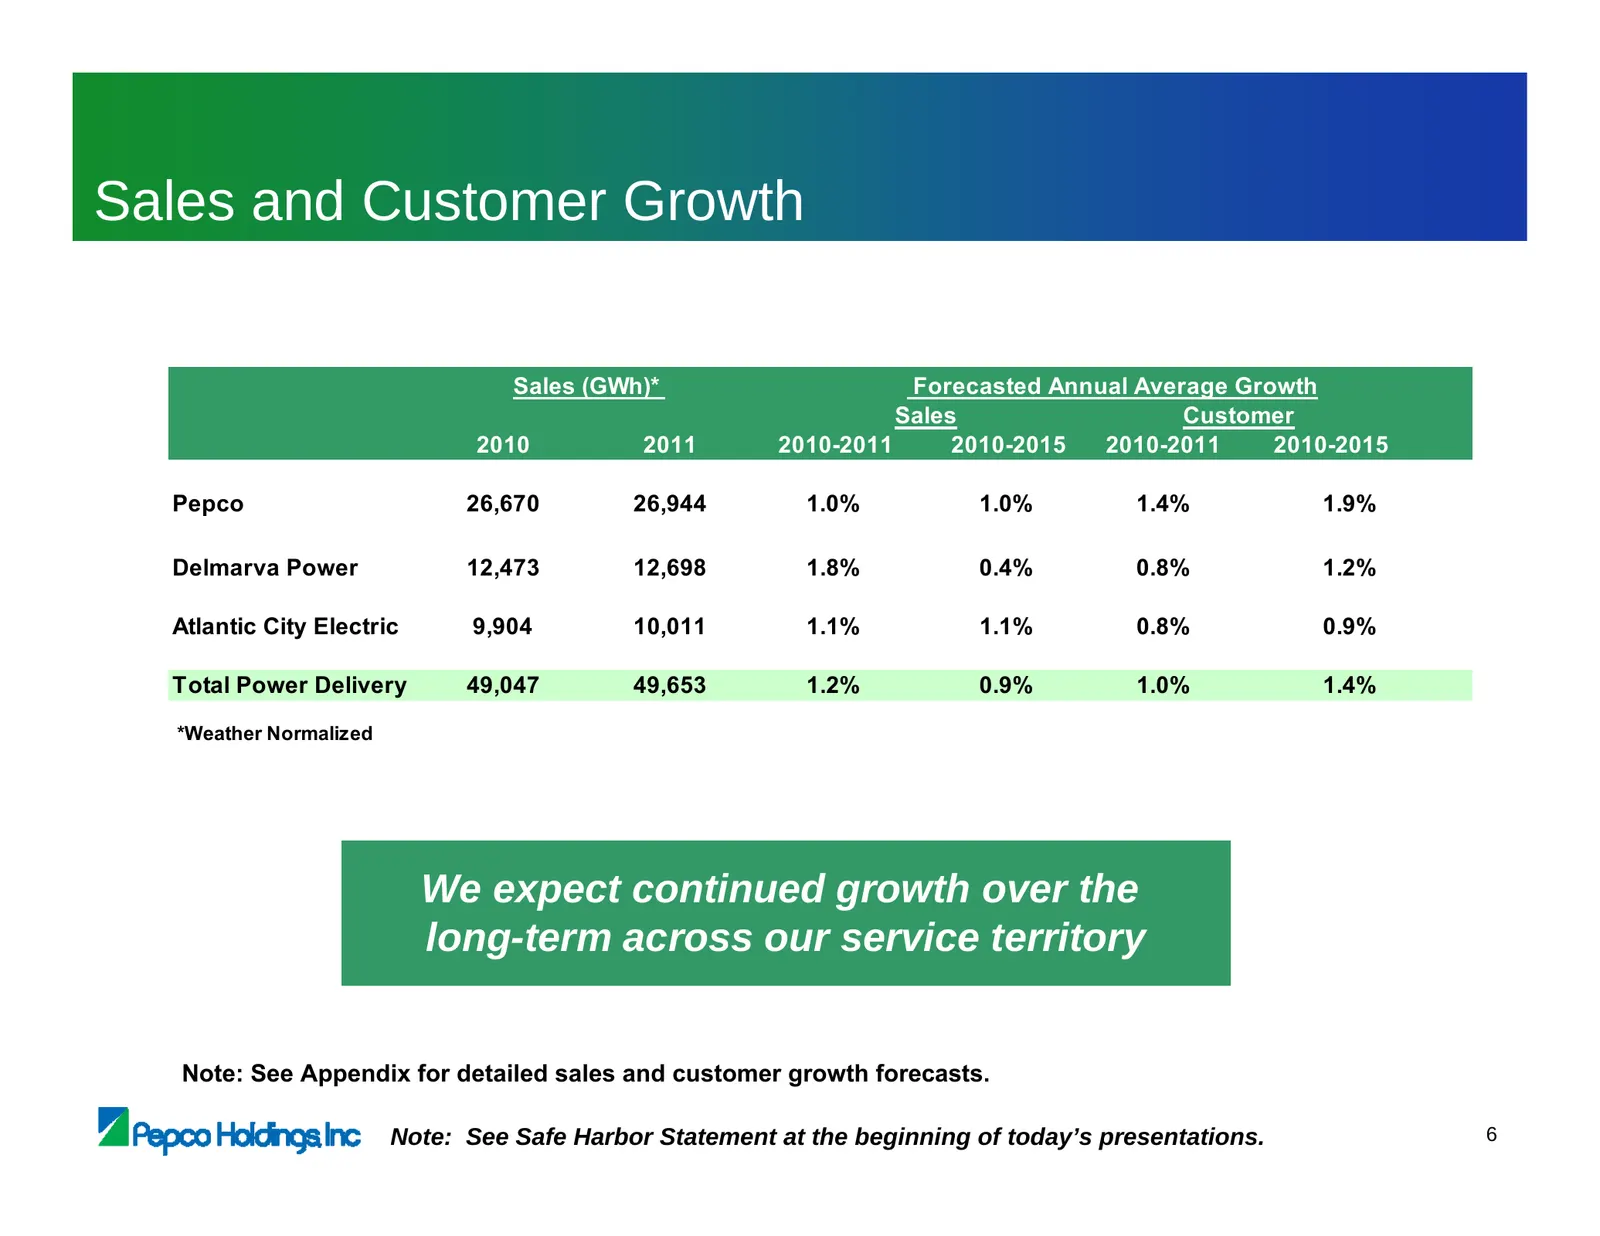
Sales and Customer Growth Sales (GWh)* Forecasted Annual Average Growth Sales Customer 2010 2011 2010-2011 2010-2015 2010-2011 2010-2015 Pepco 26,670 26,944 1.0% 1.0% 1.4% 1.9% Delmarva Power 12,473 12,698 1.8% 0.4% 0.8% 1.2% Atlantic City Electric 9,904 10,011 1.1% 1.1% 0.8% 0.9% Total Power Delive
Slide 24: Power Delivery – O&M
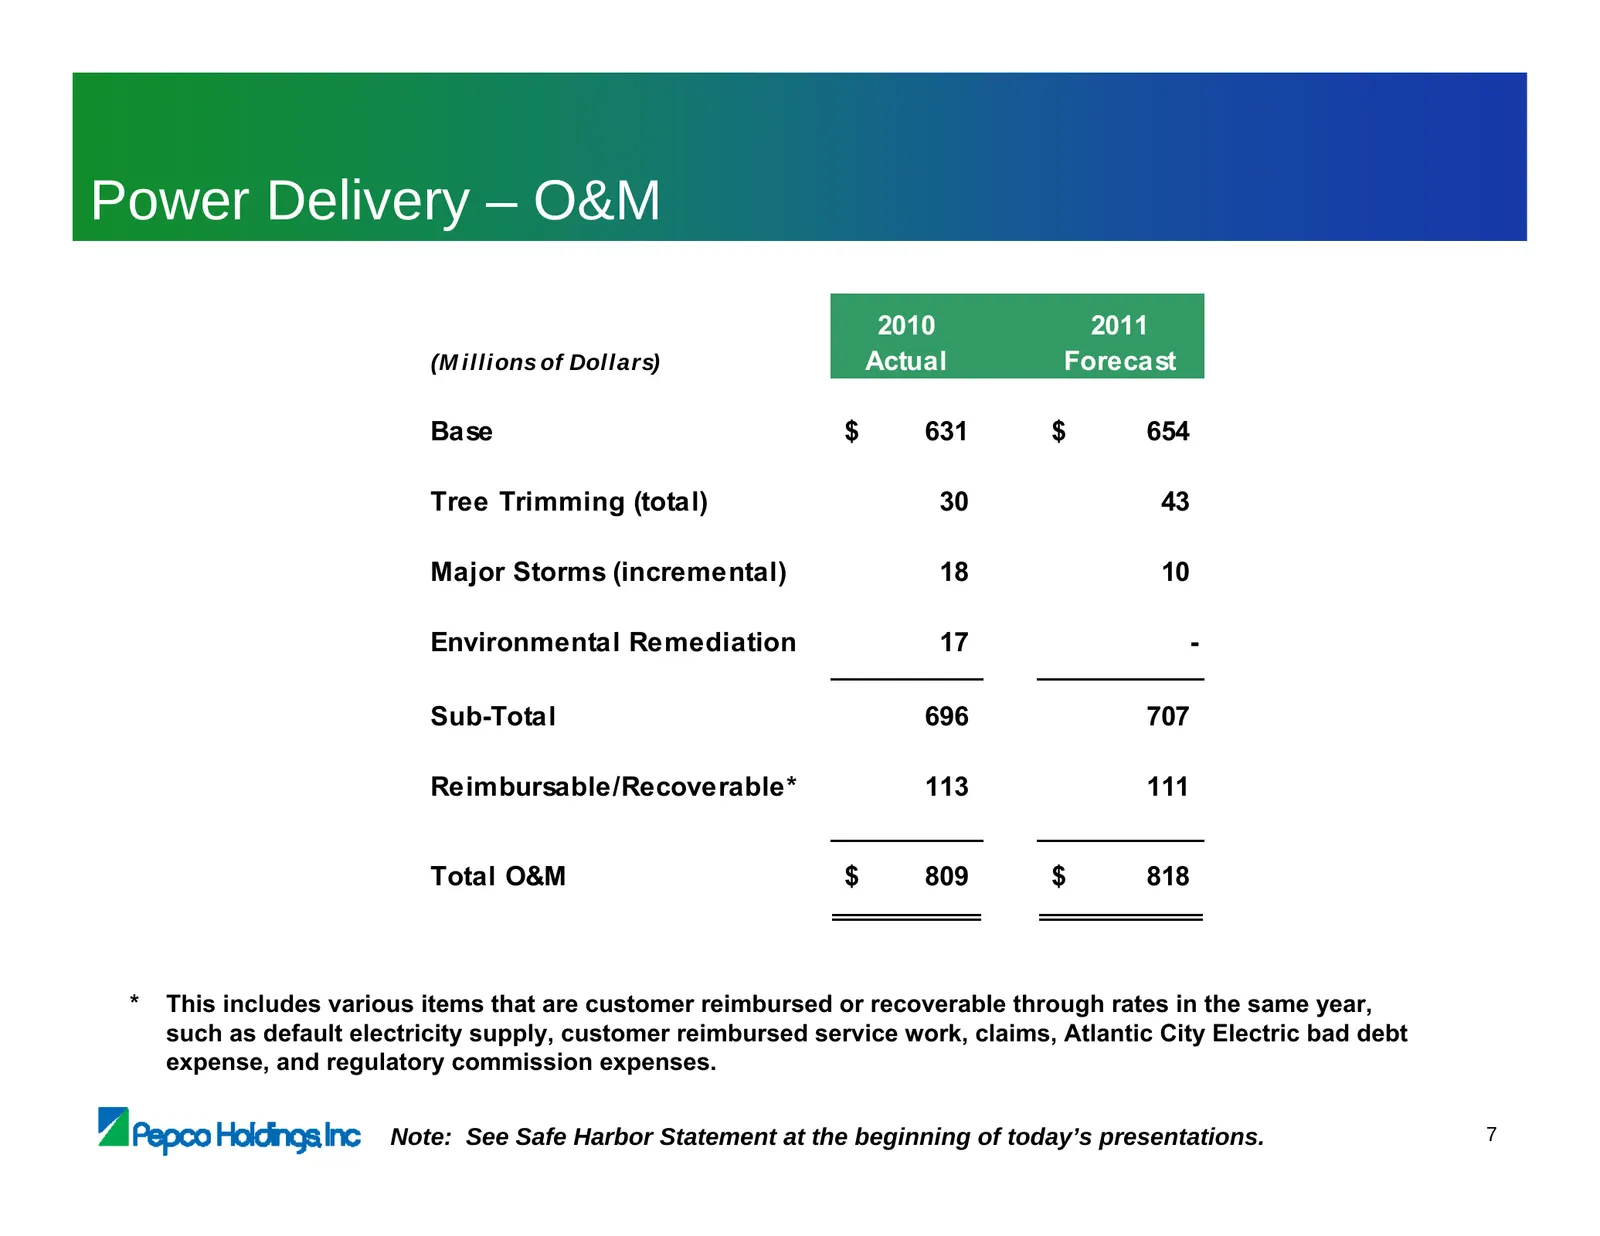
Power Delivery – O&M 2010 2011 (M illions of Dollars) Actual Forecast Base $ 631 $ 654 Tree Trimming (total) 30 43 Major Storms (incremental) 18 10 Environmental Remediation 17 - Sub-Total 696 707 Reimbursable/Recoverable* 113 111 Total O&M $ 809 $ 818 * This includes various items that are customer
Slide 25: Forecast Construction Expenditures – 2011 - 2015
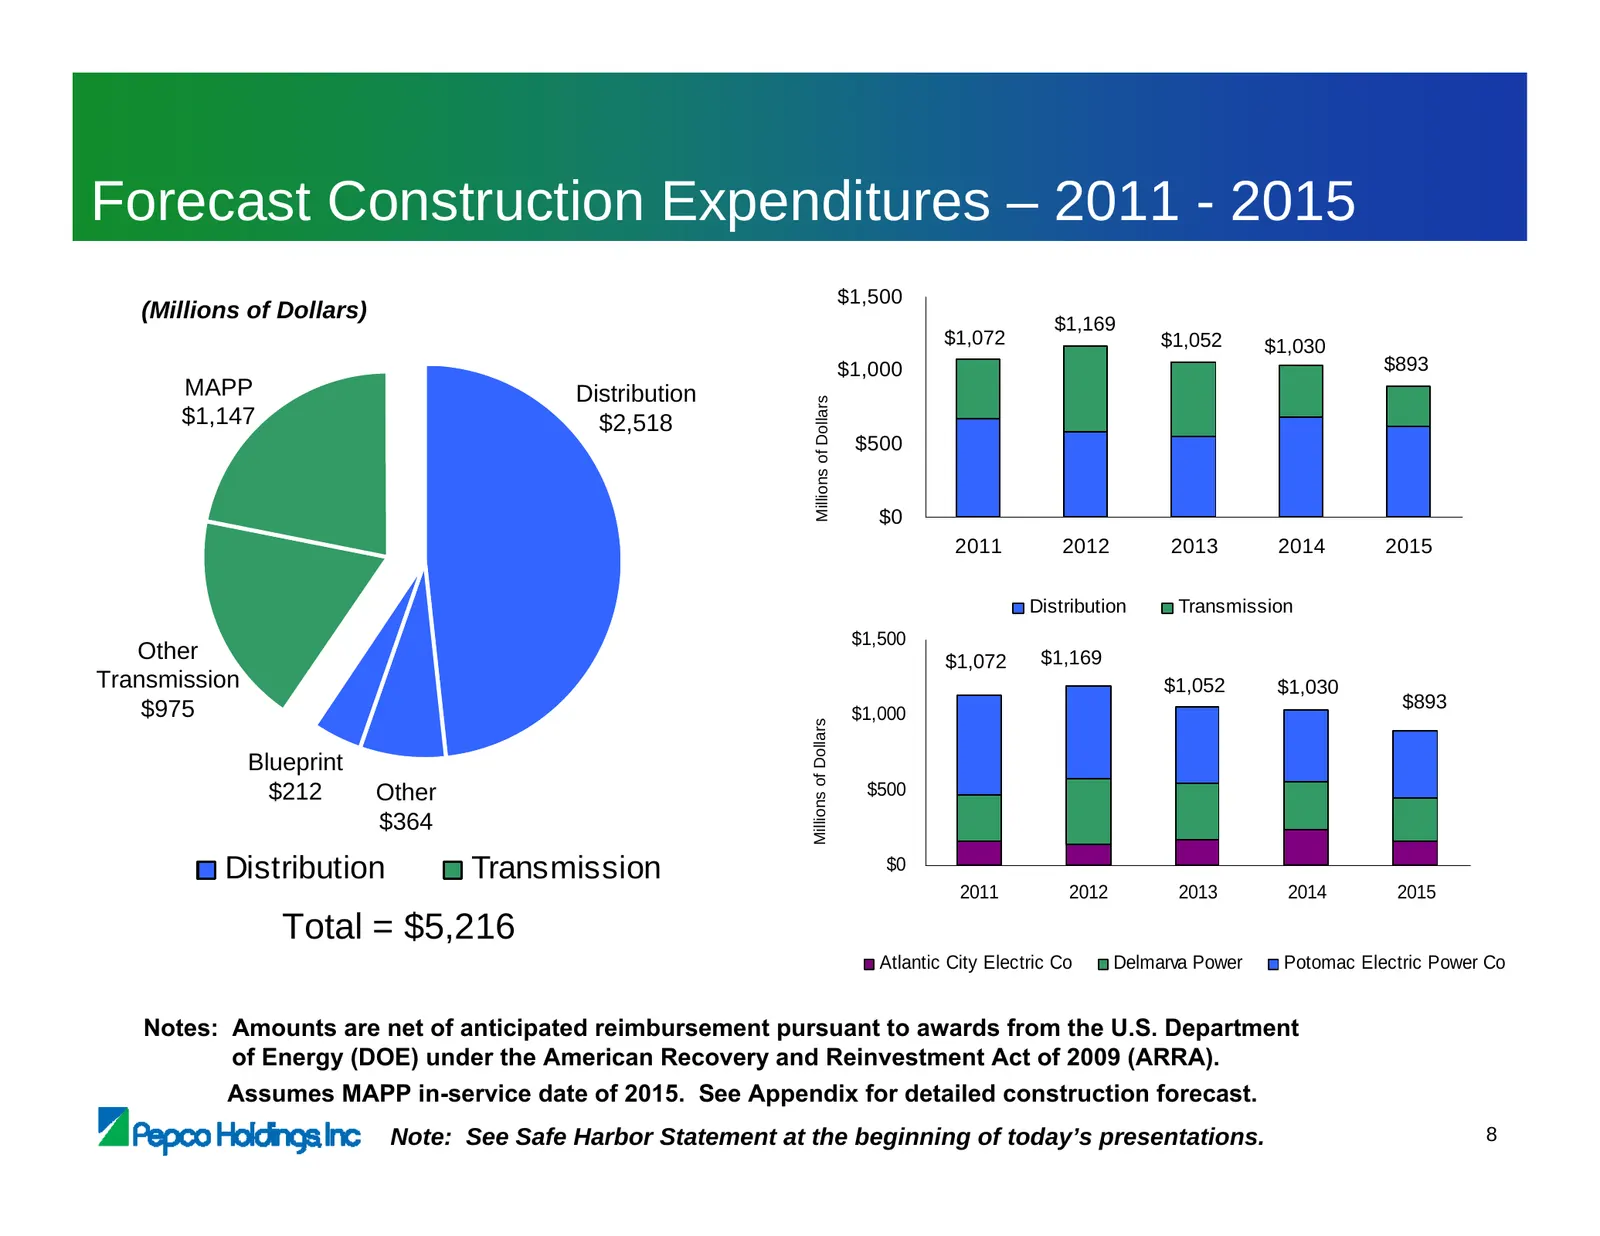
Forecast Construction Expenditures – 2011 - 2015 $1,500 (Millions of Dollars) $1,169 $1,072 $1,052 $1,030 $1,000 $893 MAPP Distribution Millions of Dollars $1,147 $2,518 $500 $0 2011 2012 2013 2014 2015 Distribution Transmission $1,500 Other $1,072 $1,169 Transmission $1,052 $1,030 $975 $893 $1,000
Slide 26: Forecast Construction Comparison
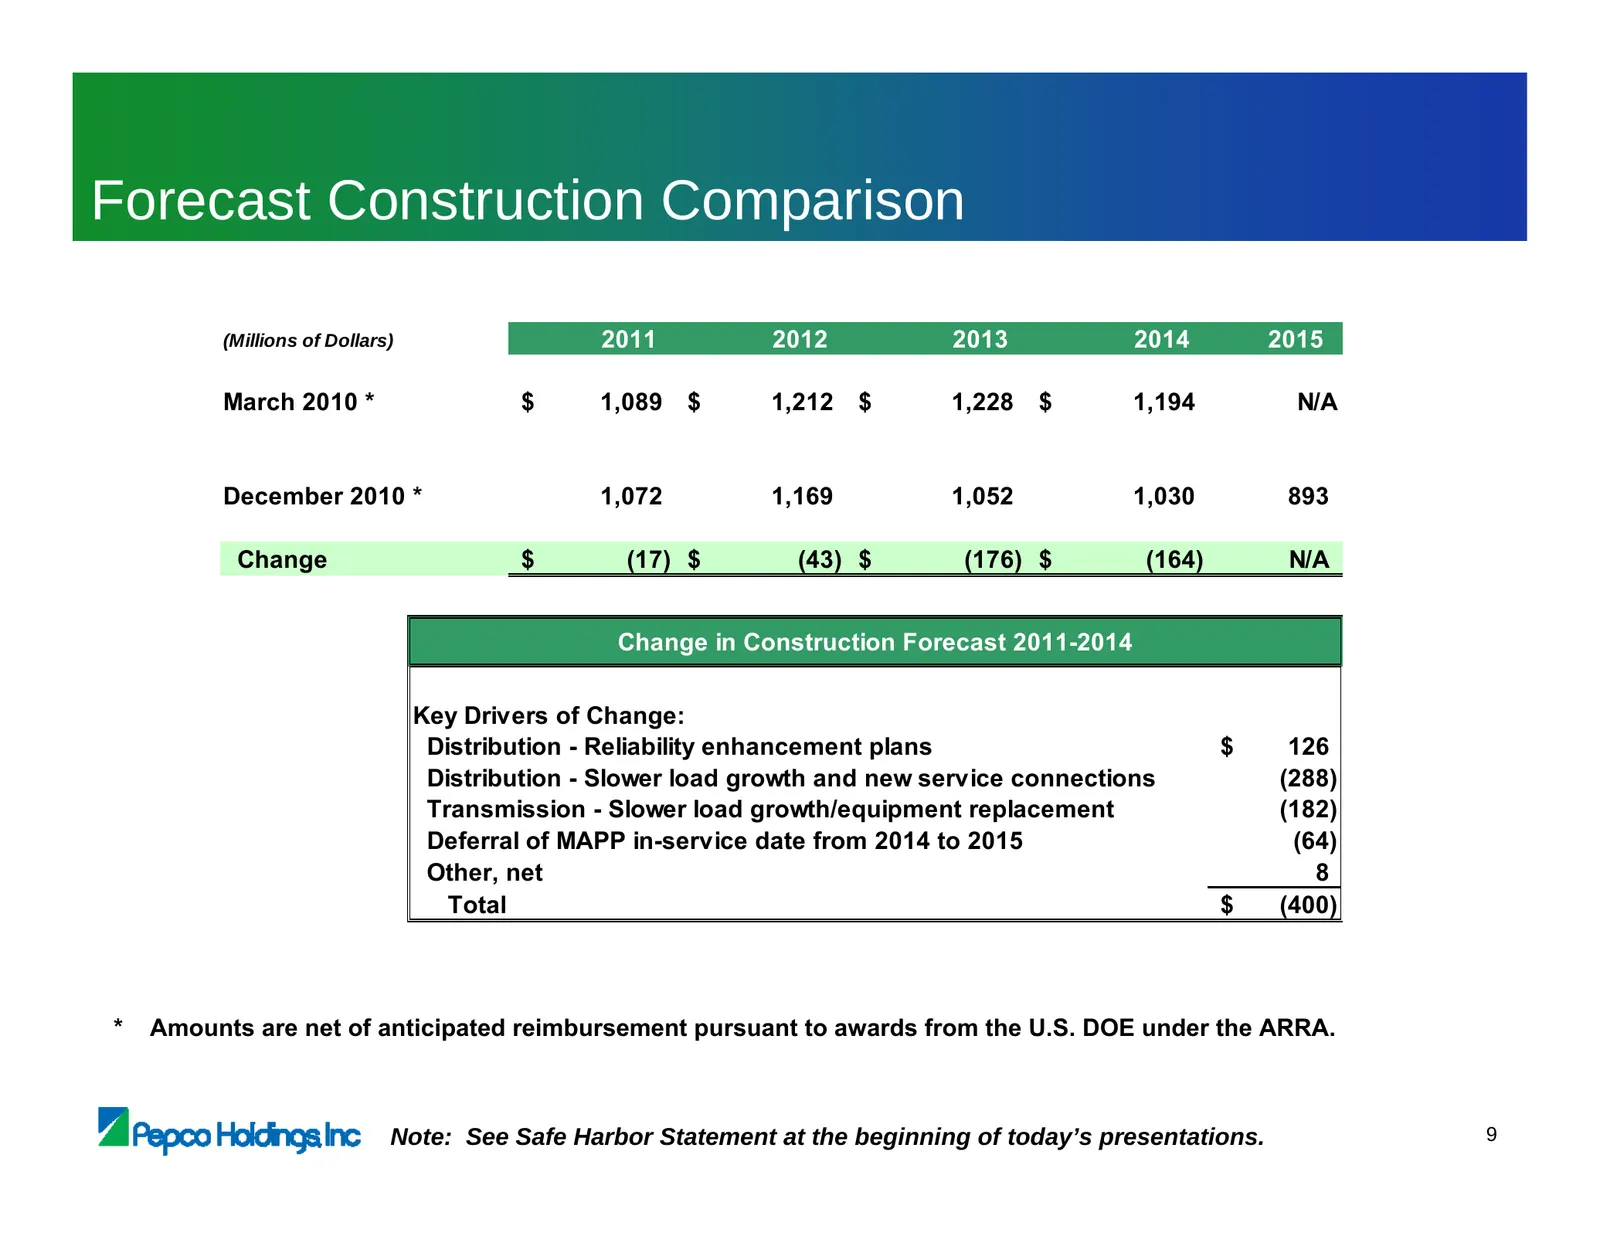
Forecast Construction Comparison (Millions of Dollars) 2011 2012 2013 2014 2015 March 2010 * $ 1,089 $ 1,212 $ 1,228 $ 1,194 N/A December 2010 * 1,072 1,169 1,052 1,030 893 Change $ (17) $ (43) $ (176) $ (164) N/A Change in Construction Forecast 2011-2014 Key Drivers of Change: Distribution - Reliab
Slide 27: Construction Program - 2011 – 2015
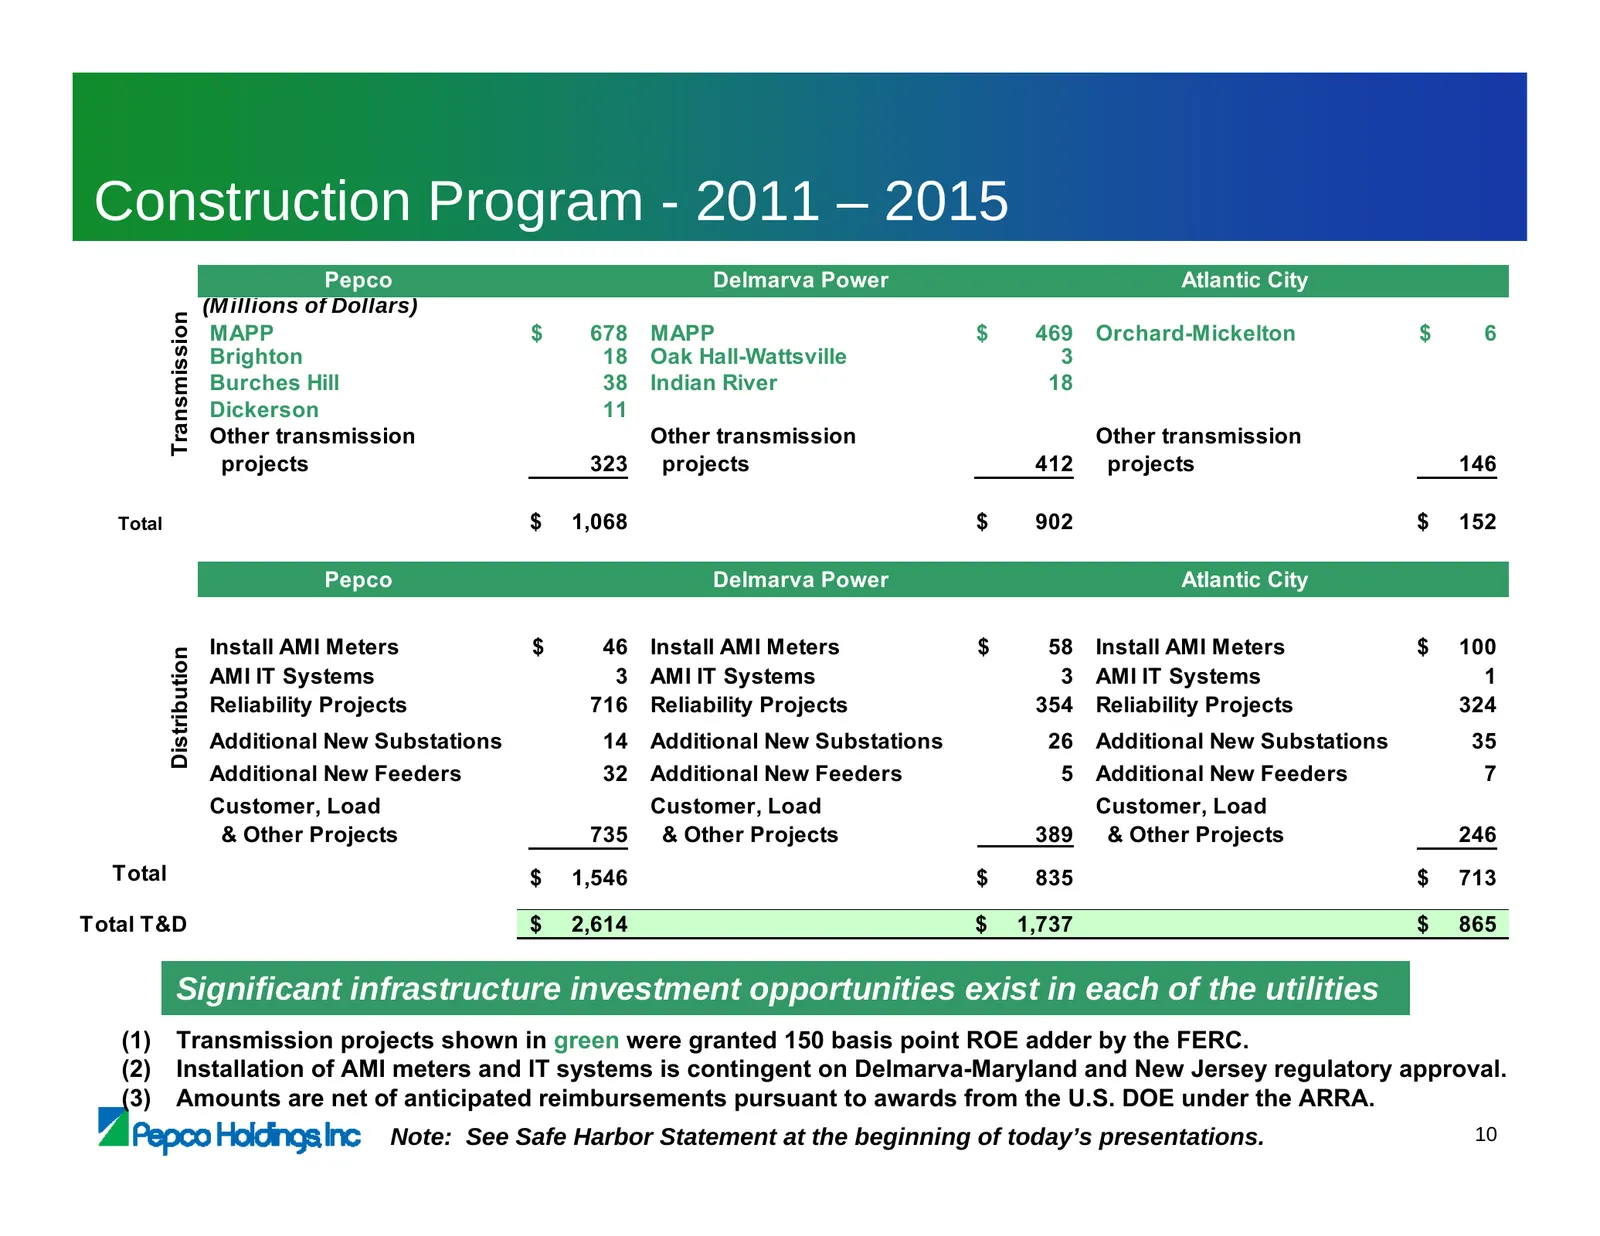
Construction Program - 2011 – 2015 Pepco Delmarva Power Atlantic City (M illions of Dollars) Transmission MAPP $ 678 MAPP $ 469 Orchard-Mickelton $ 6 Brighton 18 Oak Hall-Wattsville 3 Burches Hill 38 Indian River 18 Dickerson 11 Other transmission Other transmission Other transmission projects 323 p
Slide 28: Mid-Atlantic Power Pathway (MAPP) – Project Update
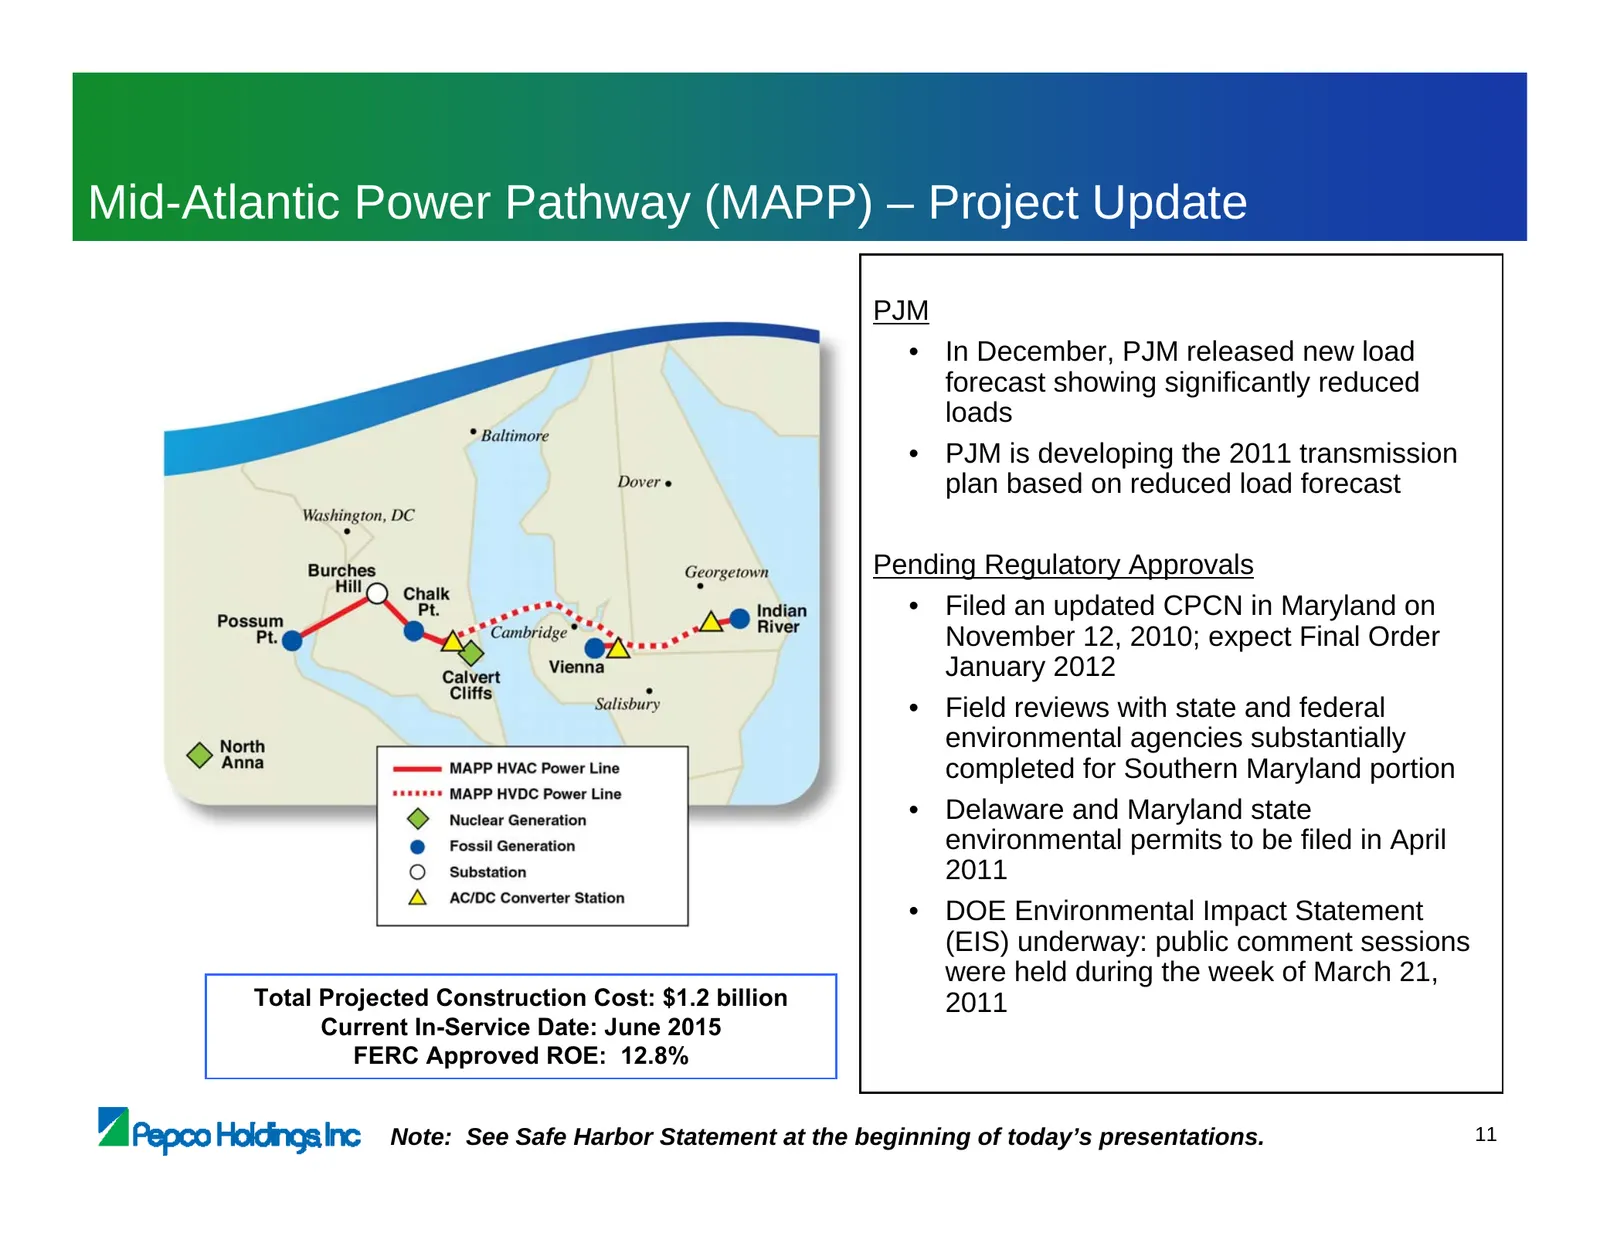
Mid-Atlantic Power Pathway (MAPP) – Project Update PJM • In December, PJM released new load forecast showing significantly reduced loads • PJM is developing the 2011 transmission plan based on reduced load forecast Pending Regulatory Approvals • Filed an updated CPCN in Maryland on November 12, 2010
Slide 29: Forecast Construction Expenditures – MAPP In-Service Date Scenarios
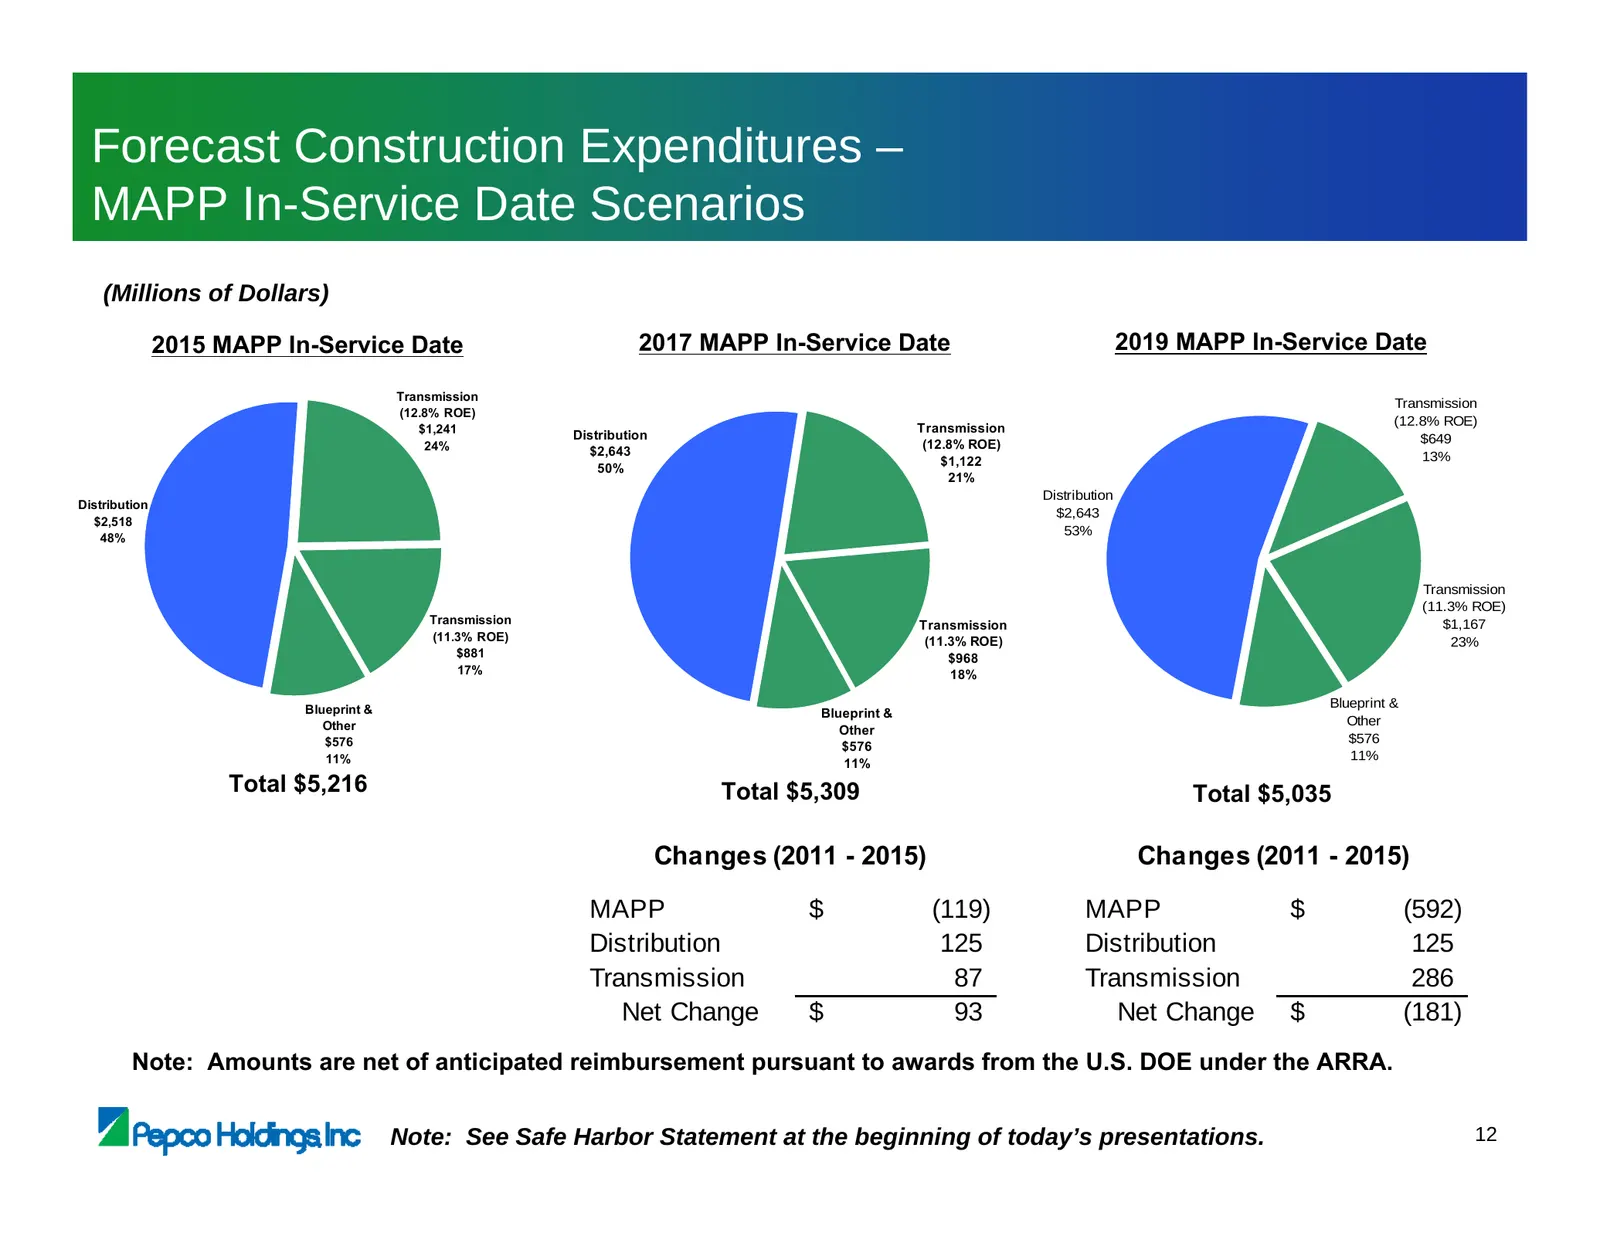
Forecast Construction Expenditures – MAPP In-Service Date Scenarios (Millions of Dollars) 2015 MAPP In-Service Date 2017 MAPP In-Service Date 2019 MAPP In-Service Date Transmission Transmission (12.8% ROE) (12.8% ROE) $1,241 Transmission Distribution $649 24% (12.8% ROE) $2,643 13% $1,122 50% 21% Di
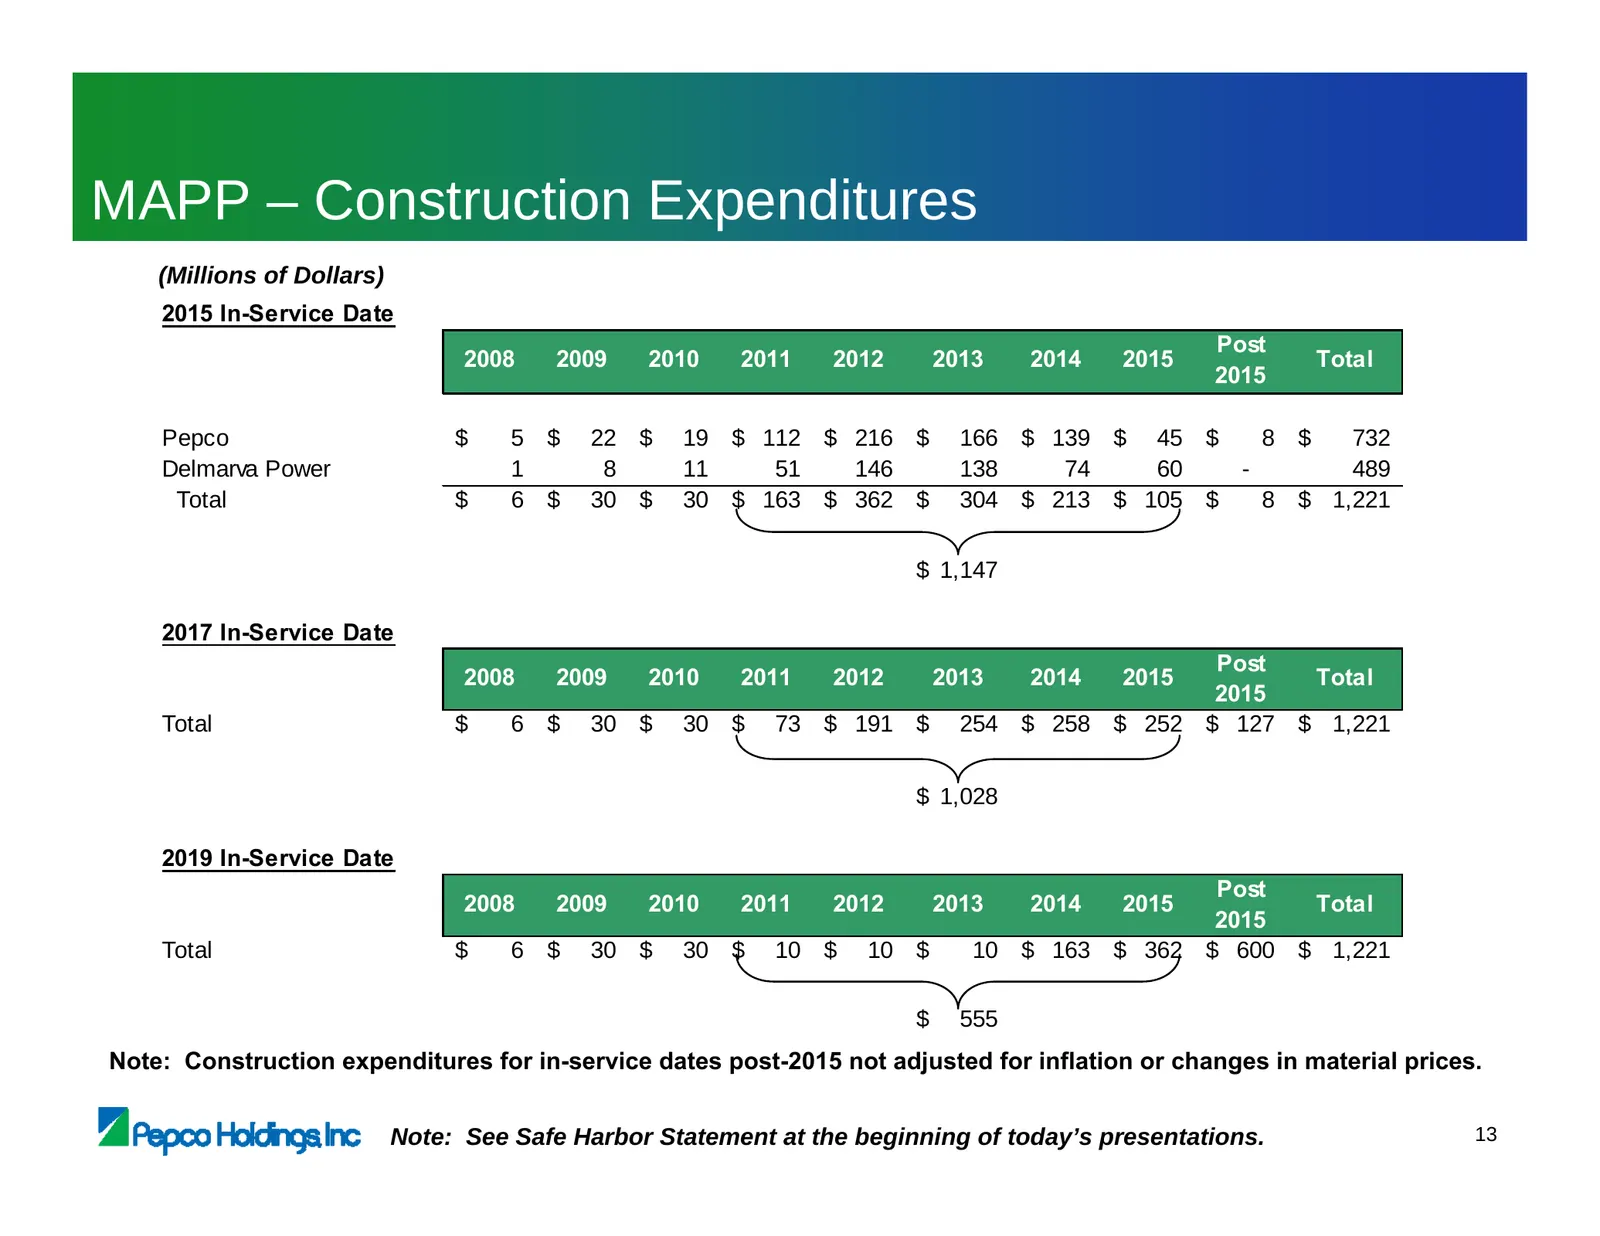
Slide 30: MAPP – Construction Expenditures
MAPP – Construction Expenditures (Millions of Dollars) 2015 In-Service Date Post 2008 2009 2010 2011 2012 2013 2014 2015 Total 2015 Pepco $ 5 $ 22 $ 19 $ 112 $ 216 $ 166 $ 139 $ 45 $ 8 $ 732 Delmarva Power 1 8 11 51 146 138 74 60 - 489 Total $ 6 $ 30 $ 30 $ 163 $ 362 $ 304 $ 213 $ 105 $ 8 $ 1,221 $
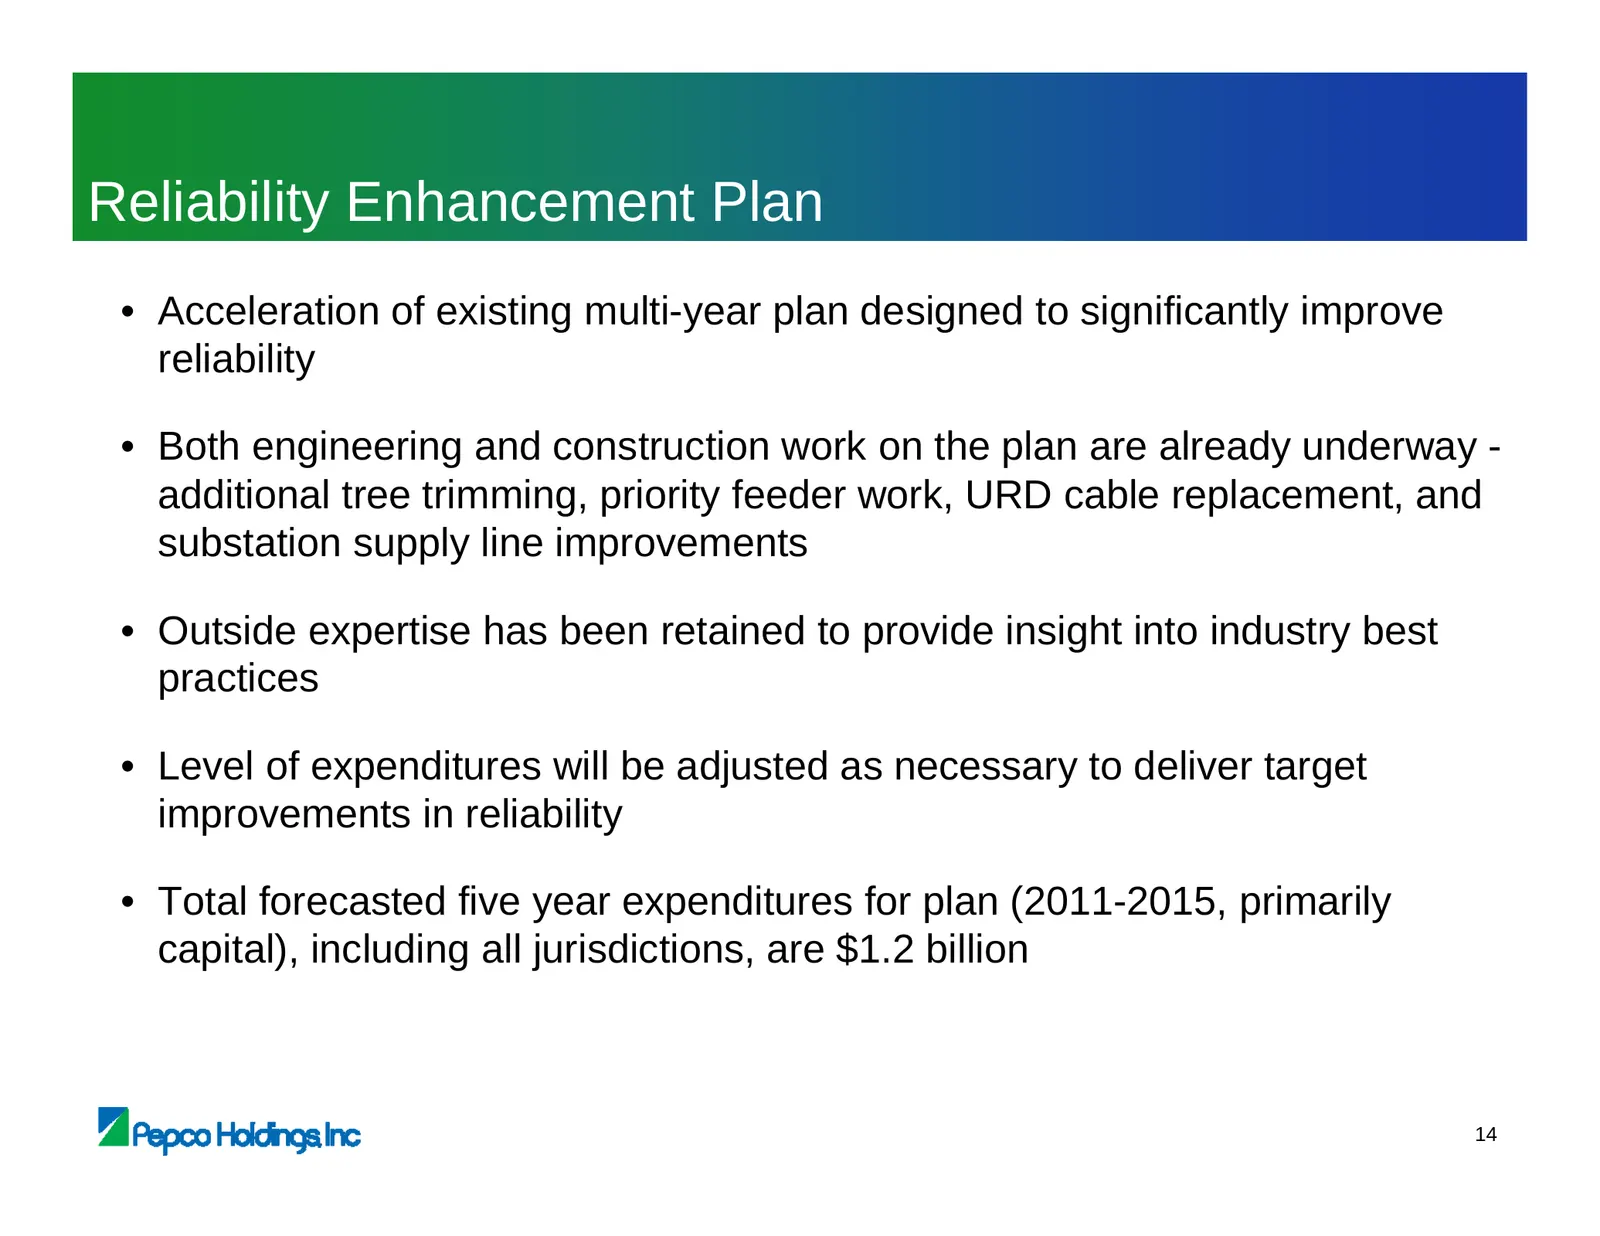
Slide 31: Reliability Enhancement Plan
Reliability Enhancement Plan • Acceleration of existing multi-year plan designed to significantly improve reliability • Both engineering and construction work on the plan are already underway - additional tree trimming, priority feeder work, URD cable replacement, and substation supply line improvem
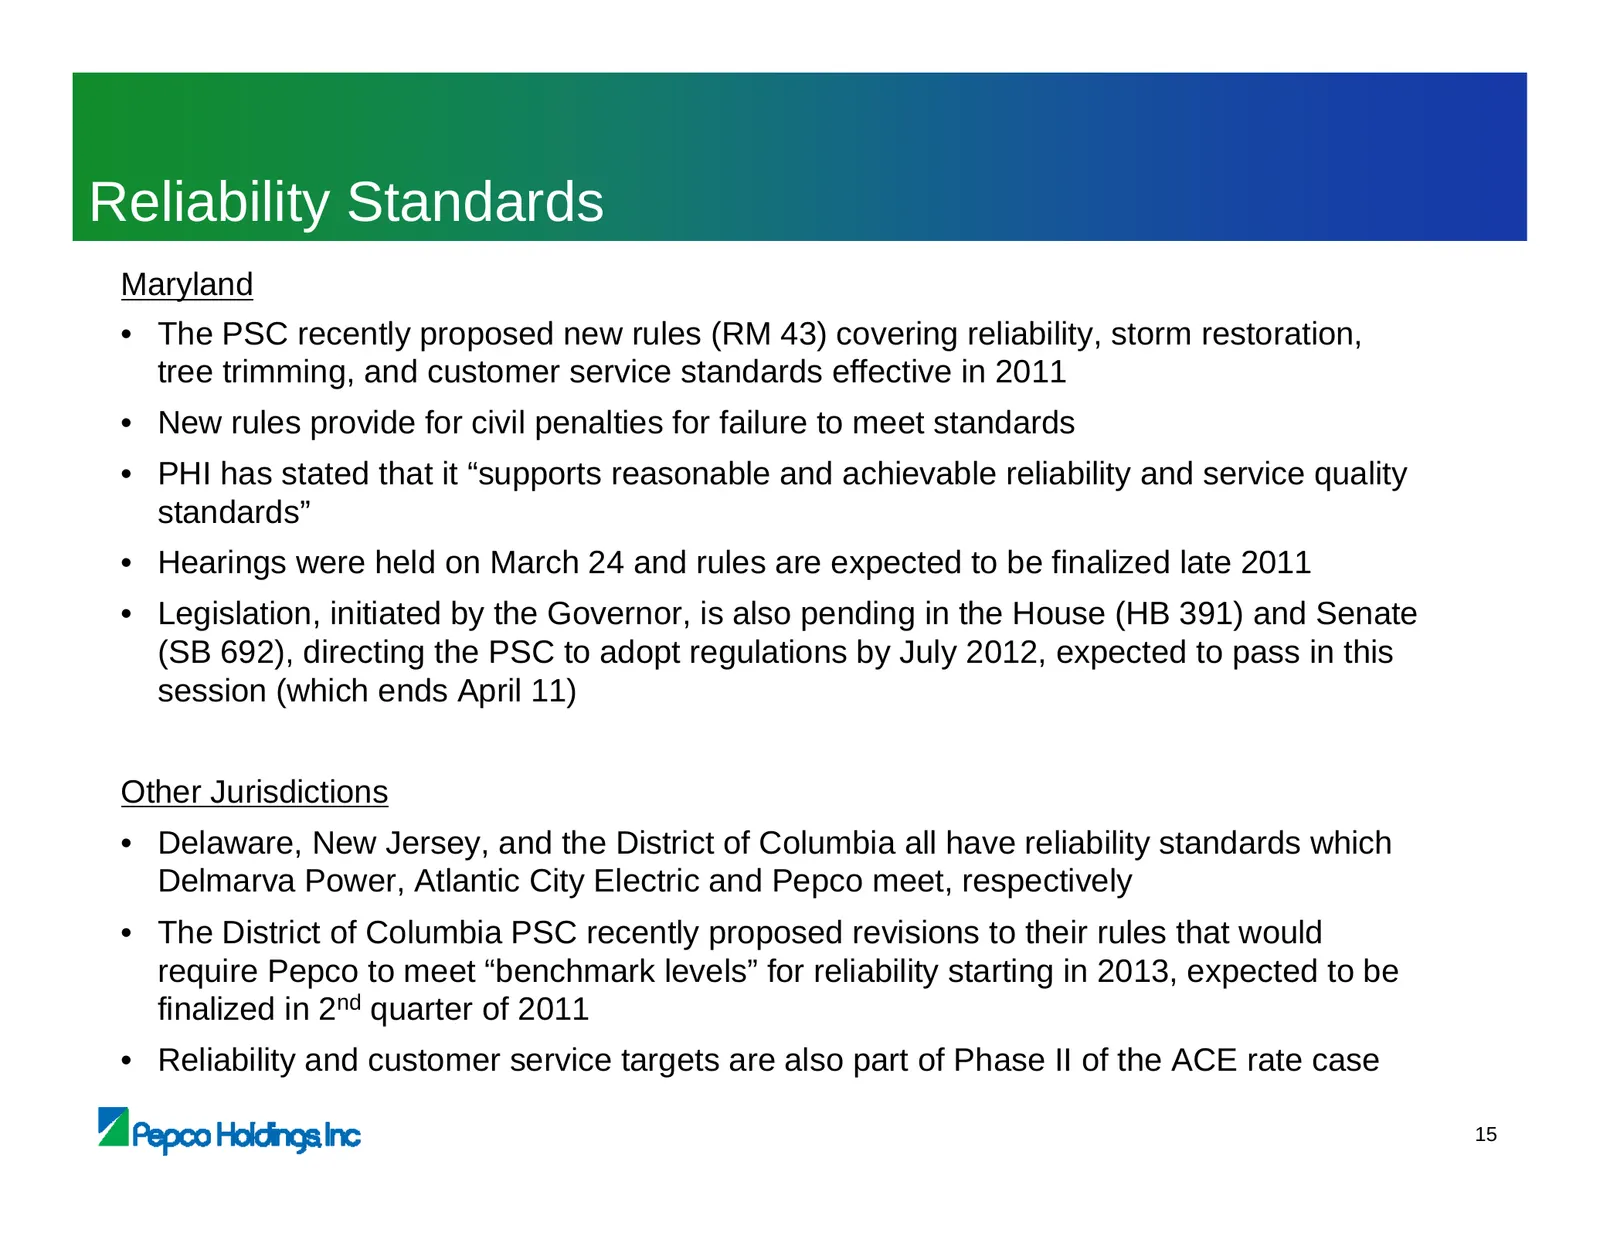
Slide 32: Reliability Standards
Reliability Standards Maryland • The PSC recently proposed new rules (RM 43) covering reliability, storm restoration, tree trimming, and customer service standards effective in 2011 • New rules provide for civil penalties for failure to meet standards • PHI has stated that it “supports reasonable an
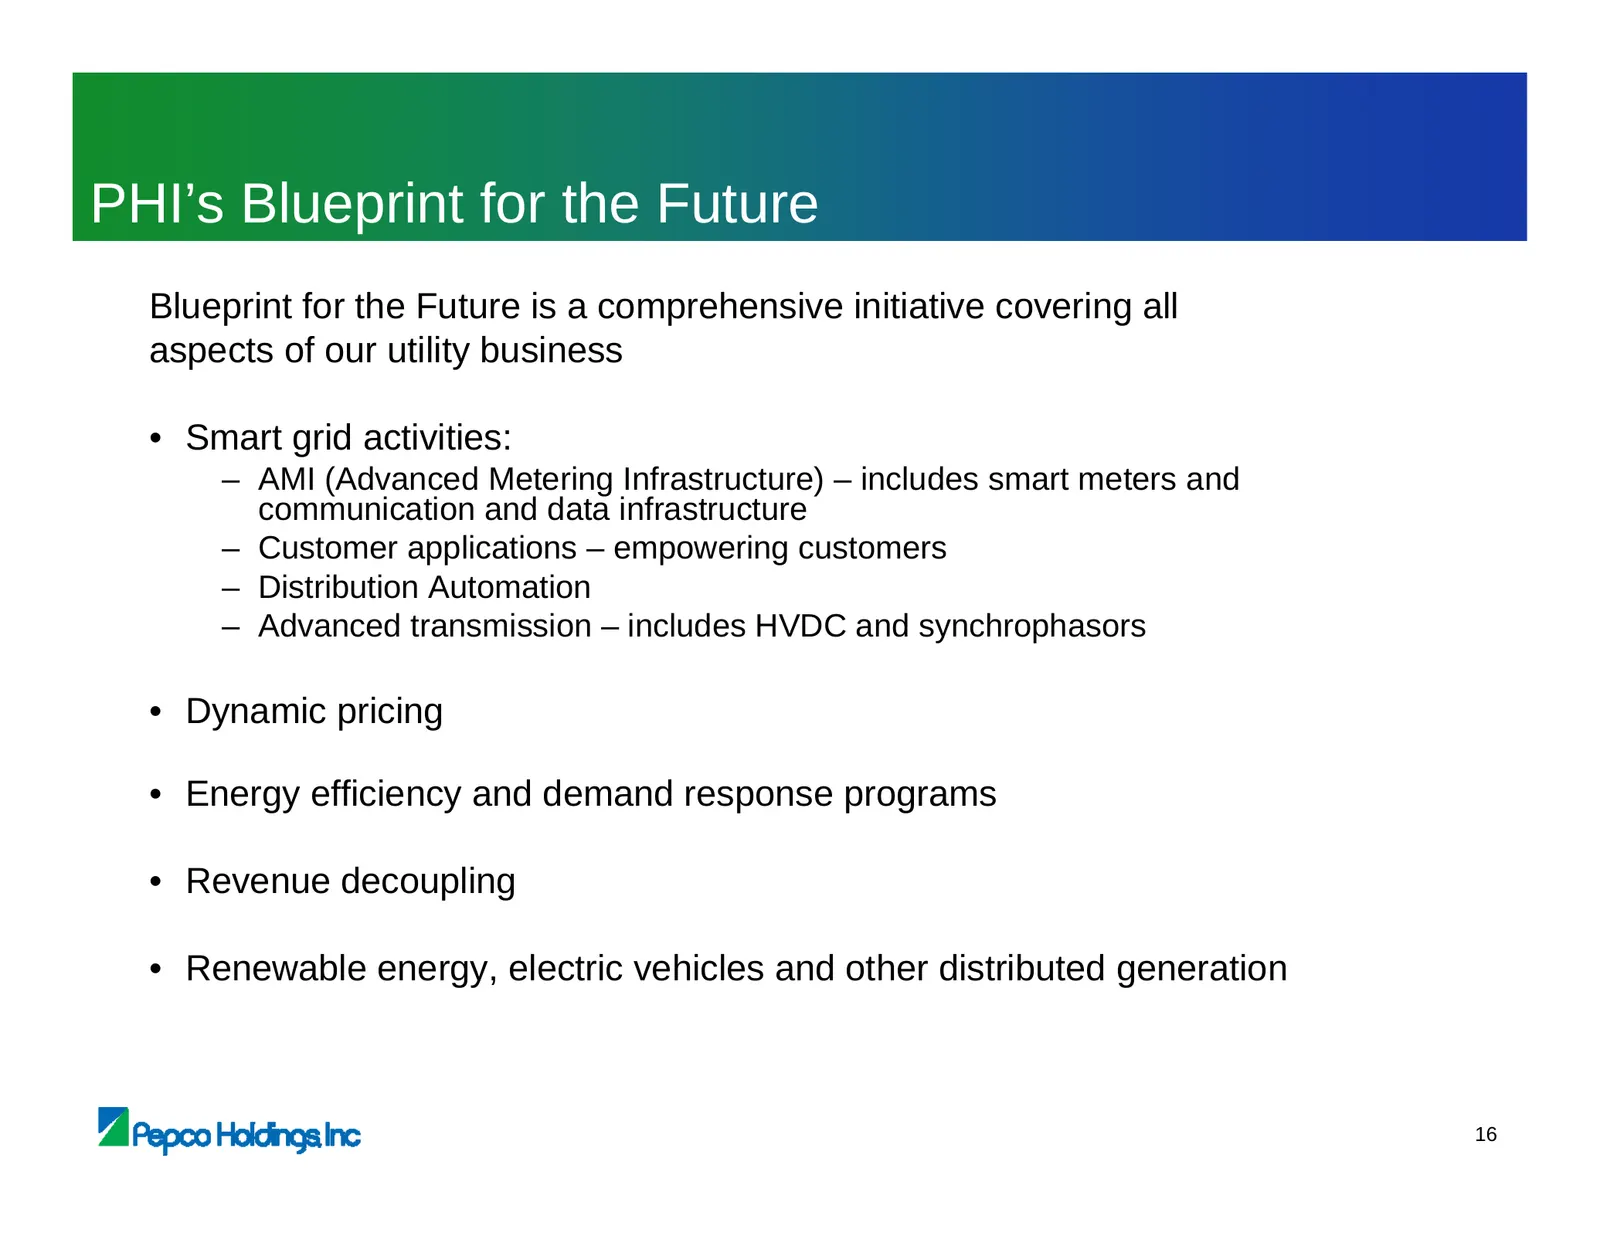
Slide 33: PHI’s Blueprint for the Future
PHI’s Blueprint for the Future Blueprint for the Future is a comprehensive initiative covering all aspects of our utility business • Smart grid activities: – AMI (Advanced Metering Infrastructure) – includes smart meters and communication and data infrastructure – Customer applications – empowering
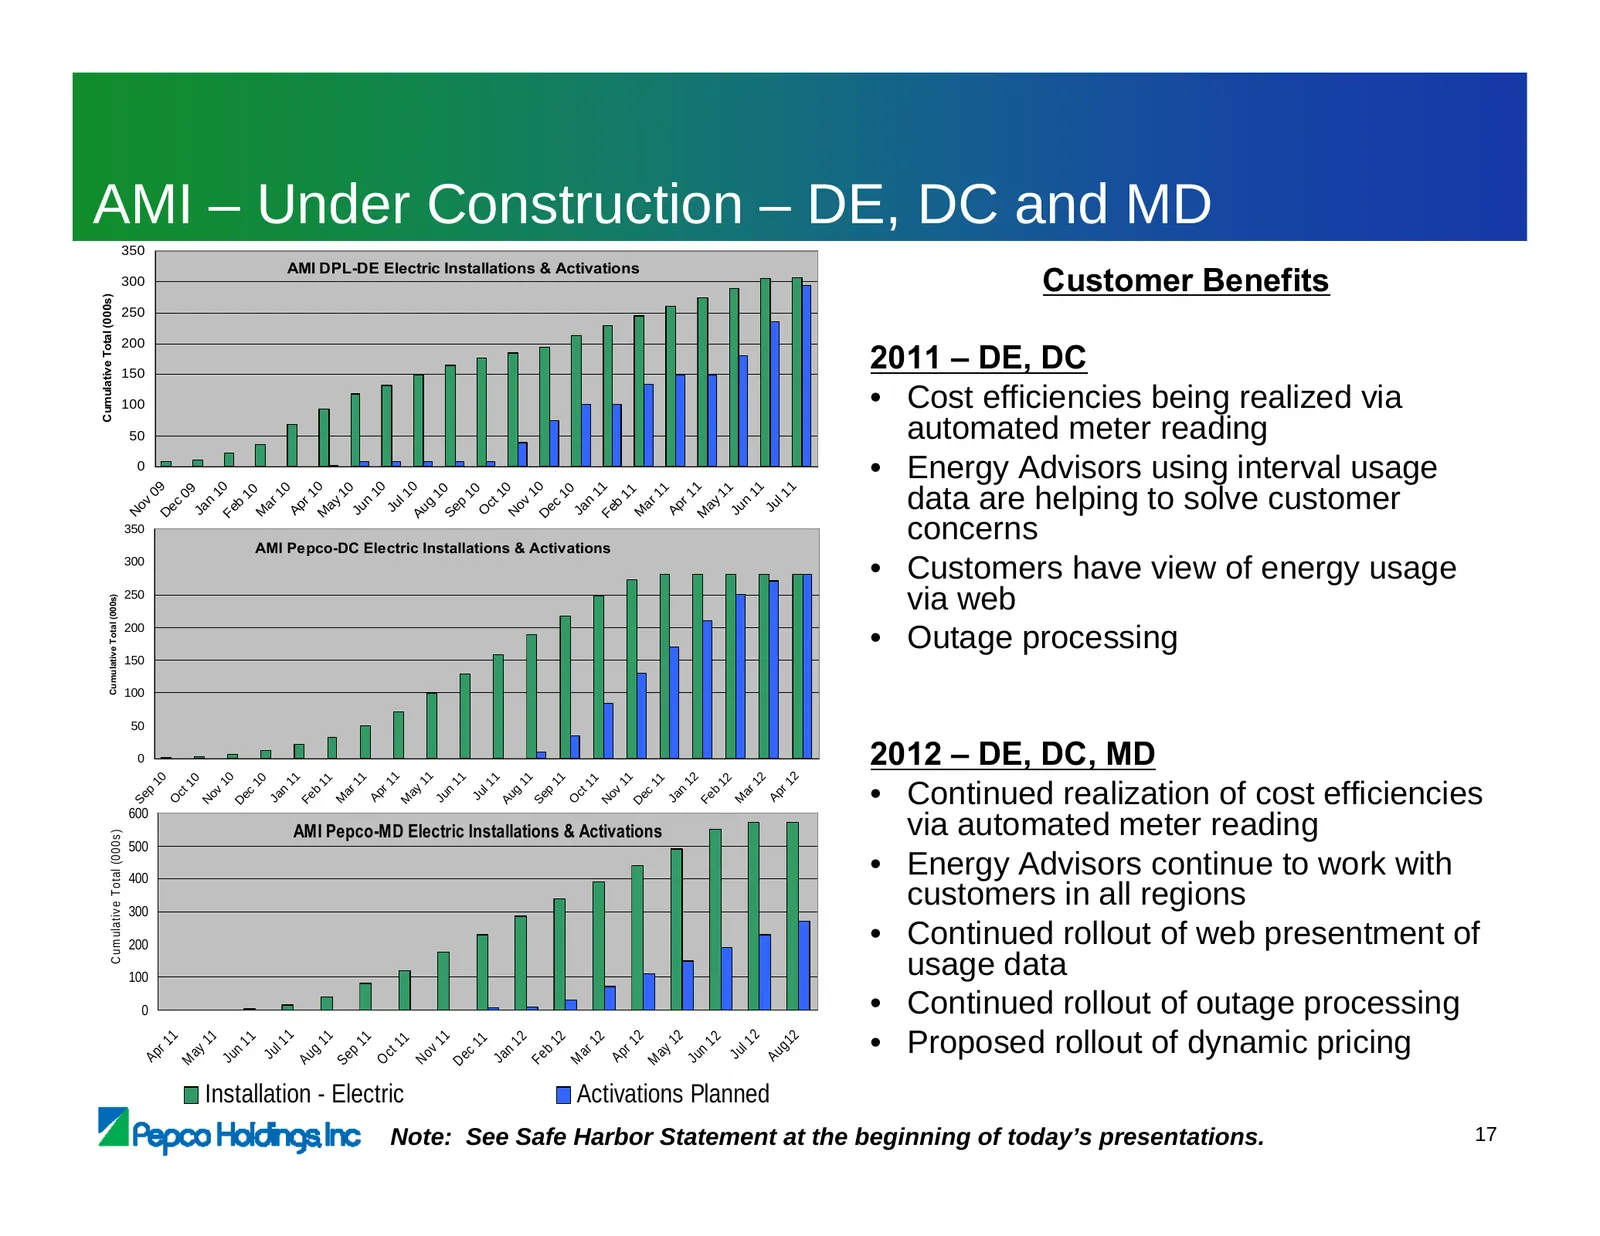
Slide 34: AMI – Under Construction – DE, DC and MD
AMI – Under Construction – DE, DC and MD 350 AMI DPL-DE Electric Installations & Activations 300 Customer Benefits Cumulative Total (000s) 250 200 150 2011 – DE, DC 100 • Cost efficiencies being realized via 50 automated meter reading 0 • Energy Advisors using interval usage data are helping to solv
Slide 35: Dynamic Pricing – Status
Dynamic Pricing – Status • Have filed with Delaware, Maryland, and the District of Columbia for implementation of dynamic pricing. Deferred in New Jersey, pending AMI • Proposing either Critical Peak Rebate (CPR) or a combination of CPR and Critical Peak Pricing (CPP) rate structures • Maryland appr
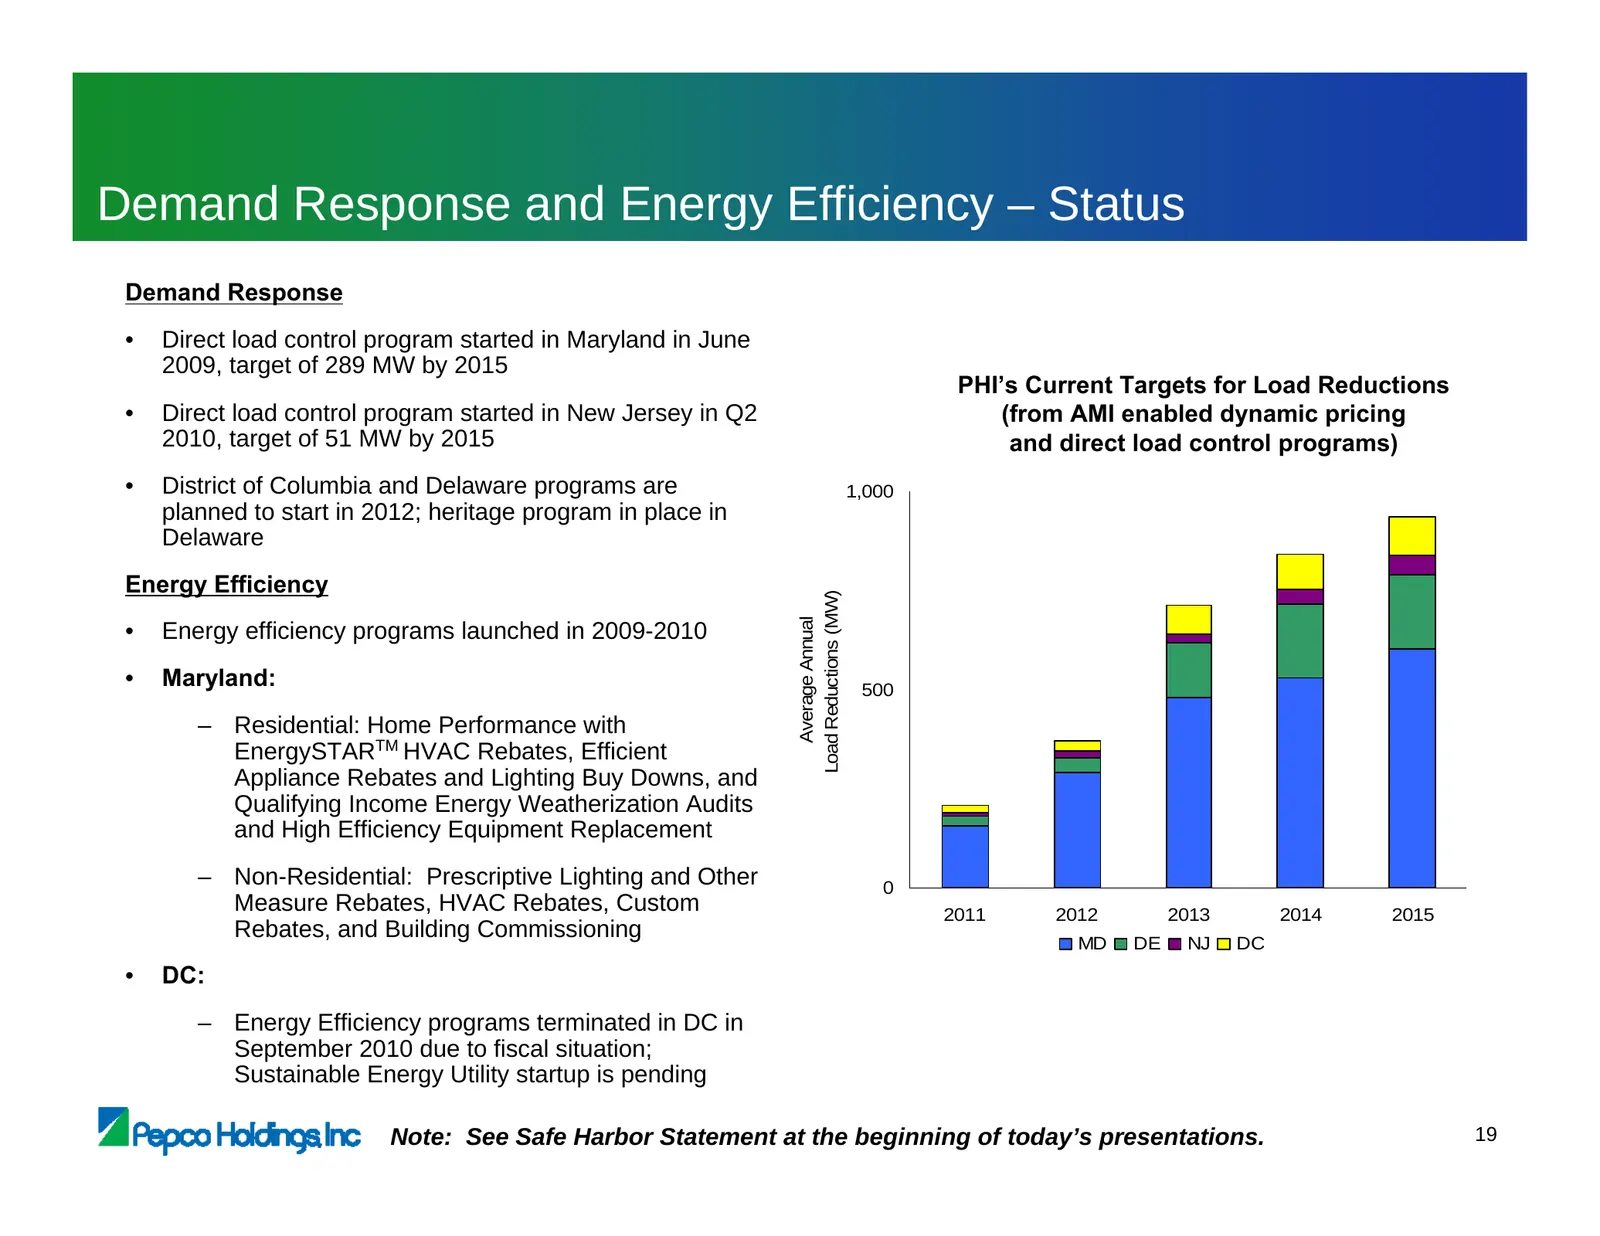
Slide 36: Demand Response and Energy Efficiency – Status
Demand Response and Energy Efficiency – Status Demand Response • Direct load control program started in Maryland in June 2009, target of 289 MW by 2015 PHI’s Current Targets for Load Reductions • Direct load control program started in New Jersey in Q2 (from AMI enabled dynamic pricing 2010, target o
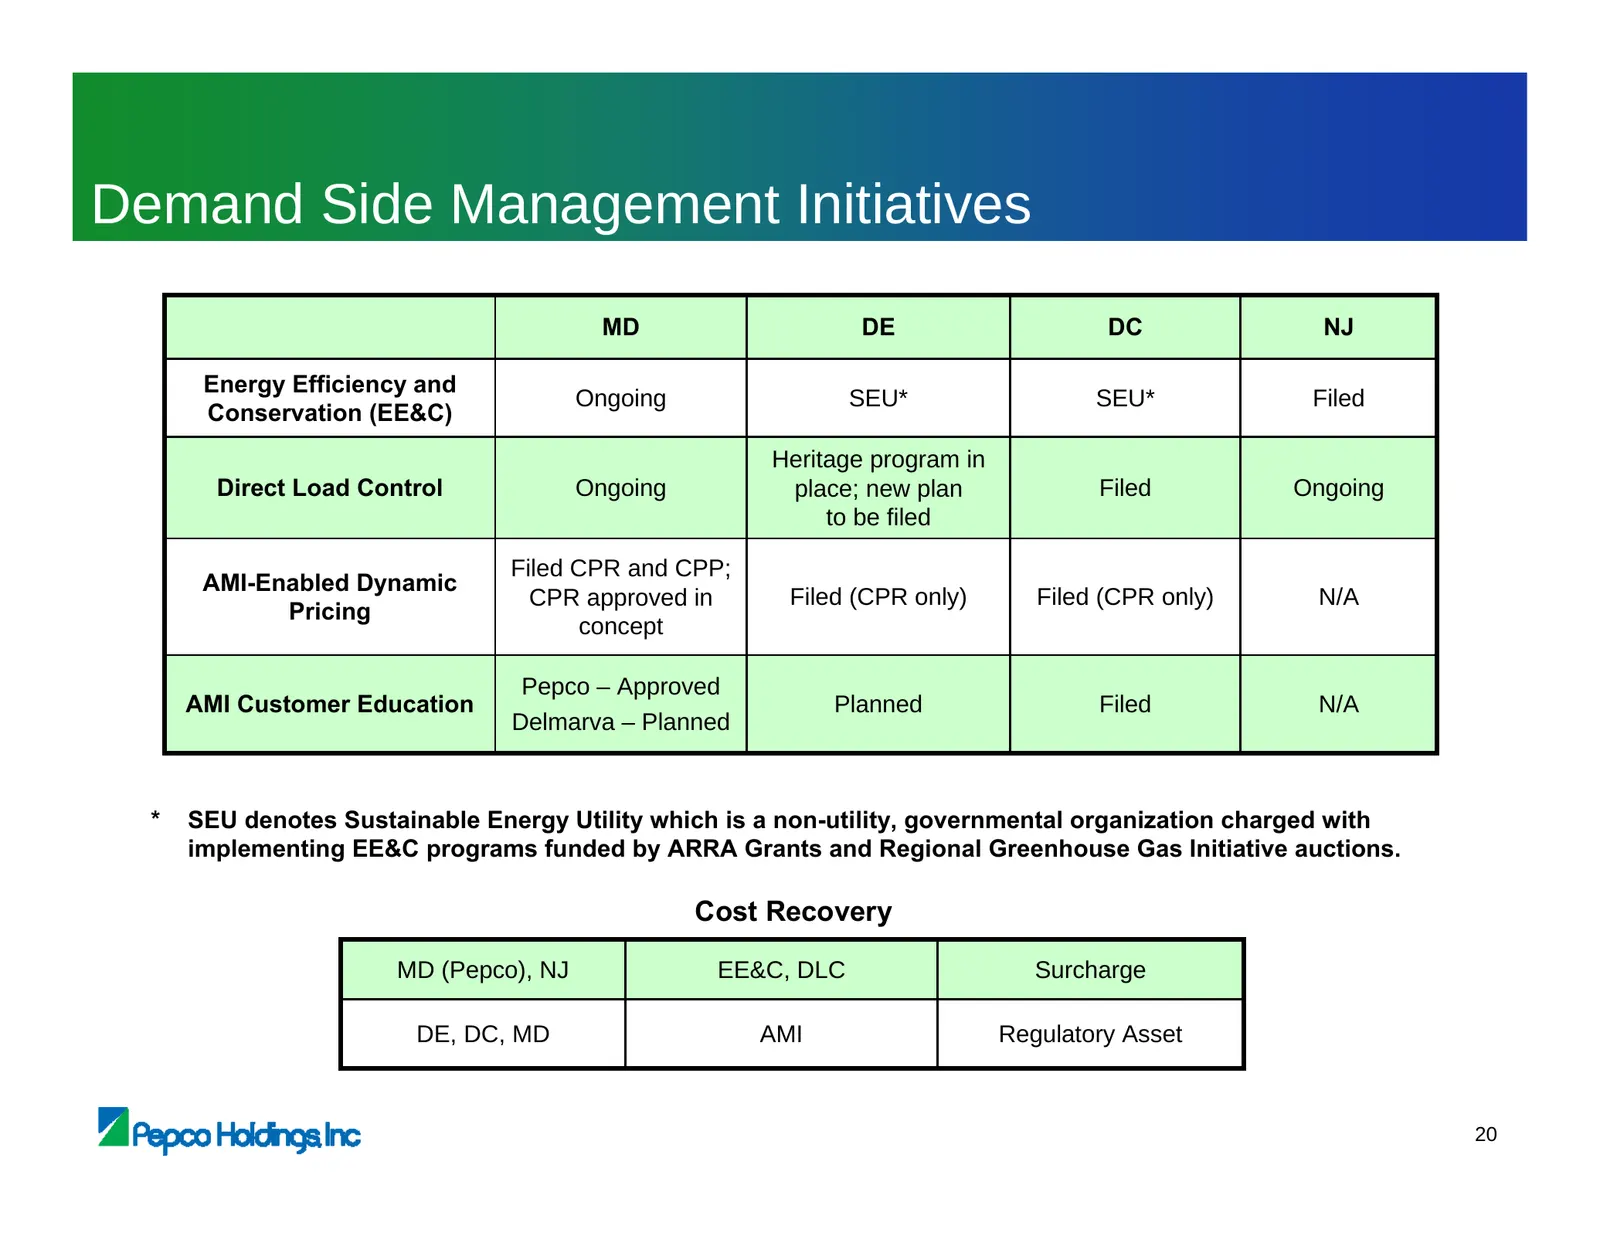
Slide 37: Demand Side Management Initiatives
Demand Side Management Initiatives MD DE DC NJ Energy Efficiency and Ongoing SEU* SEU* Filed Conservation (EE&C) Heritage program in Direct Load Control Ongoing place; new plan Filed Ongoing to be filed Filed CPR and CPP; AMI-Enabled Dynamic CPR approved in Filed (CPR only) Filed (CPR only) N/A Pric
Slide 38: Blueprint for the Future – Some Key Considerations
Blueprint for the Future – Some Key Considerations • Public education, understanding and perception is a key focus • Customer and operational benefits will be realized over time • Customer adoption and participation is a key enabler of benefits • Customers will begin to manage their energy usage the
Slide 39: Power Delivery Business Outlook
Power Delivery Business Outlook • Continued improvement in operating performance – safety, customer satisfaction, reliability, cost • Over $5.2 billion in planned infrastructure investment over next 5 years - change in MAPP in-service date will not materially change anticipated total spend • Continu
Slide 40: Power Delivery
Power Delivery Dave Velazquez Executive Vice President, Power Delivery
Slide 41: Appendix
Appendix VA Pepco Holdings inc
Slide 42: Construction Expenditure Forecast
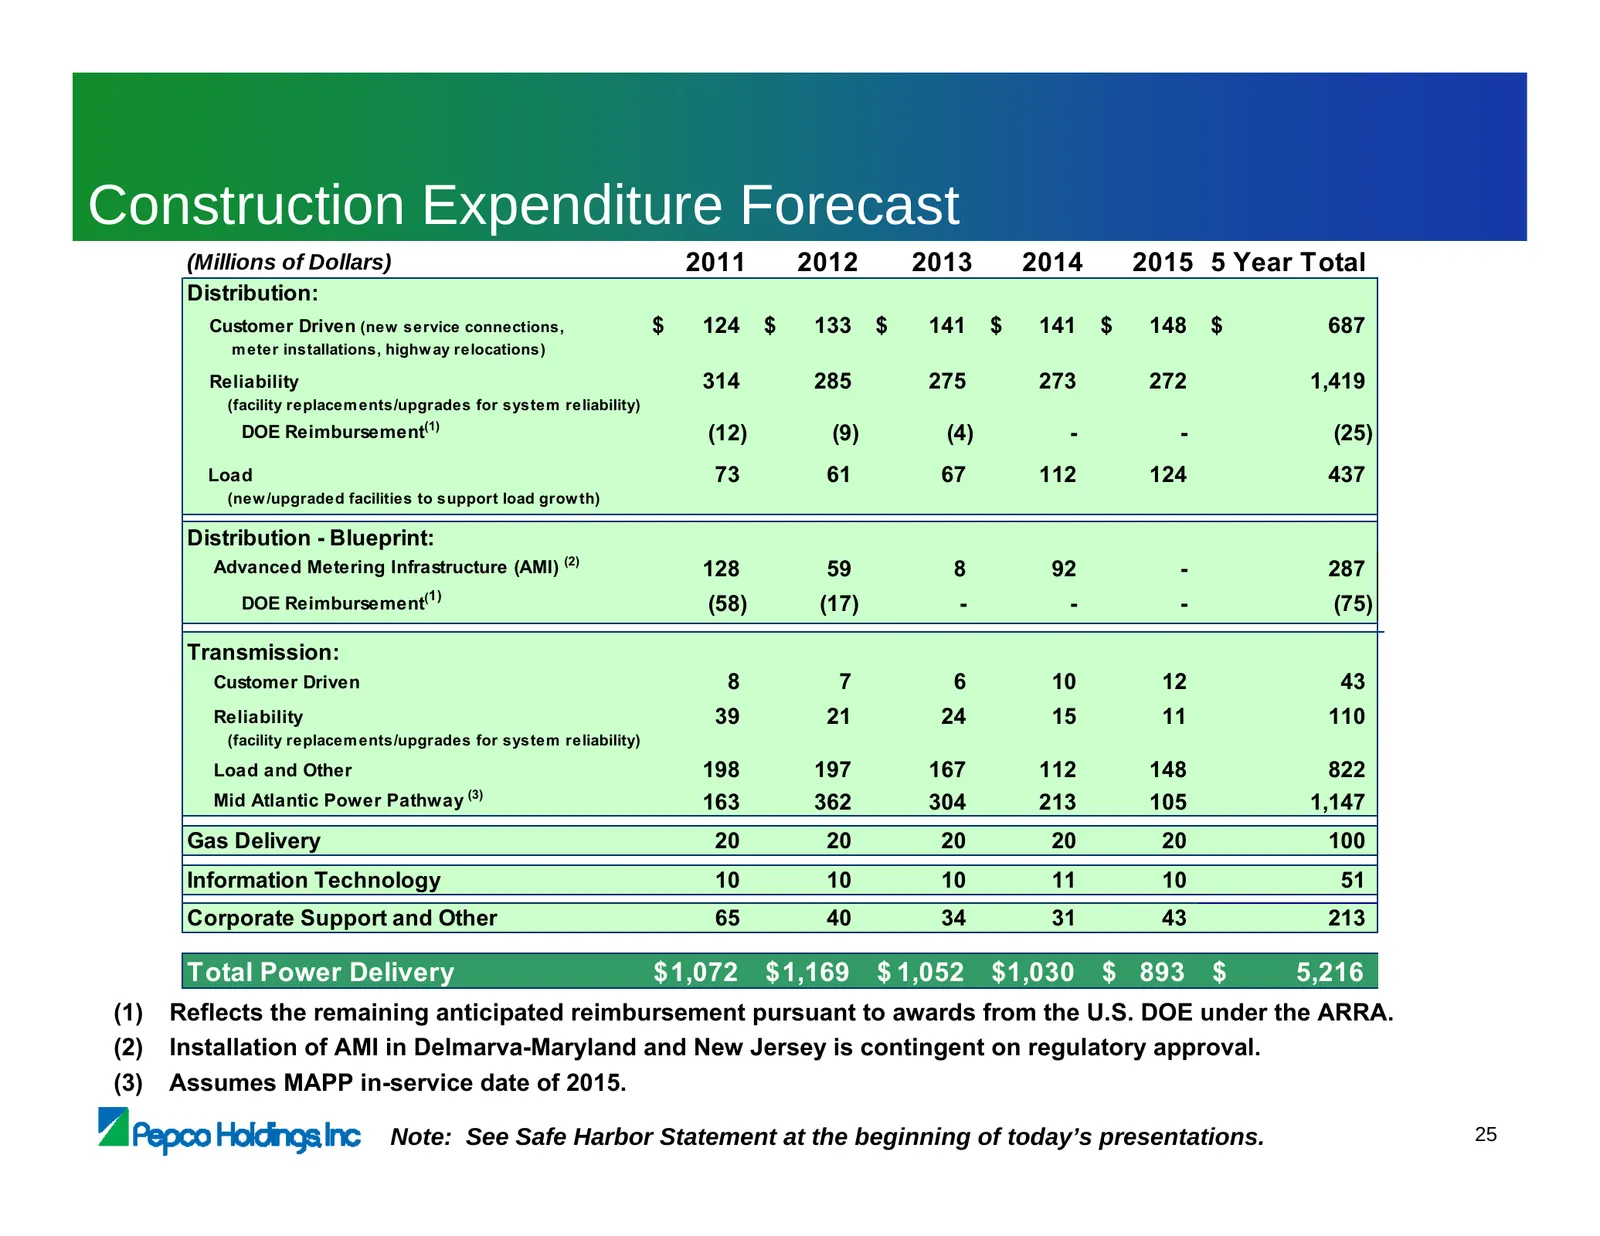
Construction Expenditure Forecast (Millions of Dollars) 2011 2012 2013 2014 2015 5 Year Total Distribution: Customer Driven (new service connections, $ 124 $ 133 $ 141 $ 141 $ 148 $ 687 m eter installations, highw ay relocations) Reliability 314 285 275 273 272 1,419 (facility replacem ents/upgrades
Slide 43: Construction Expenditure Forecast
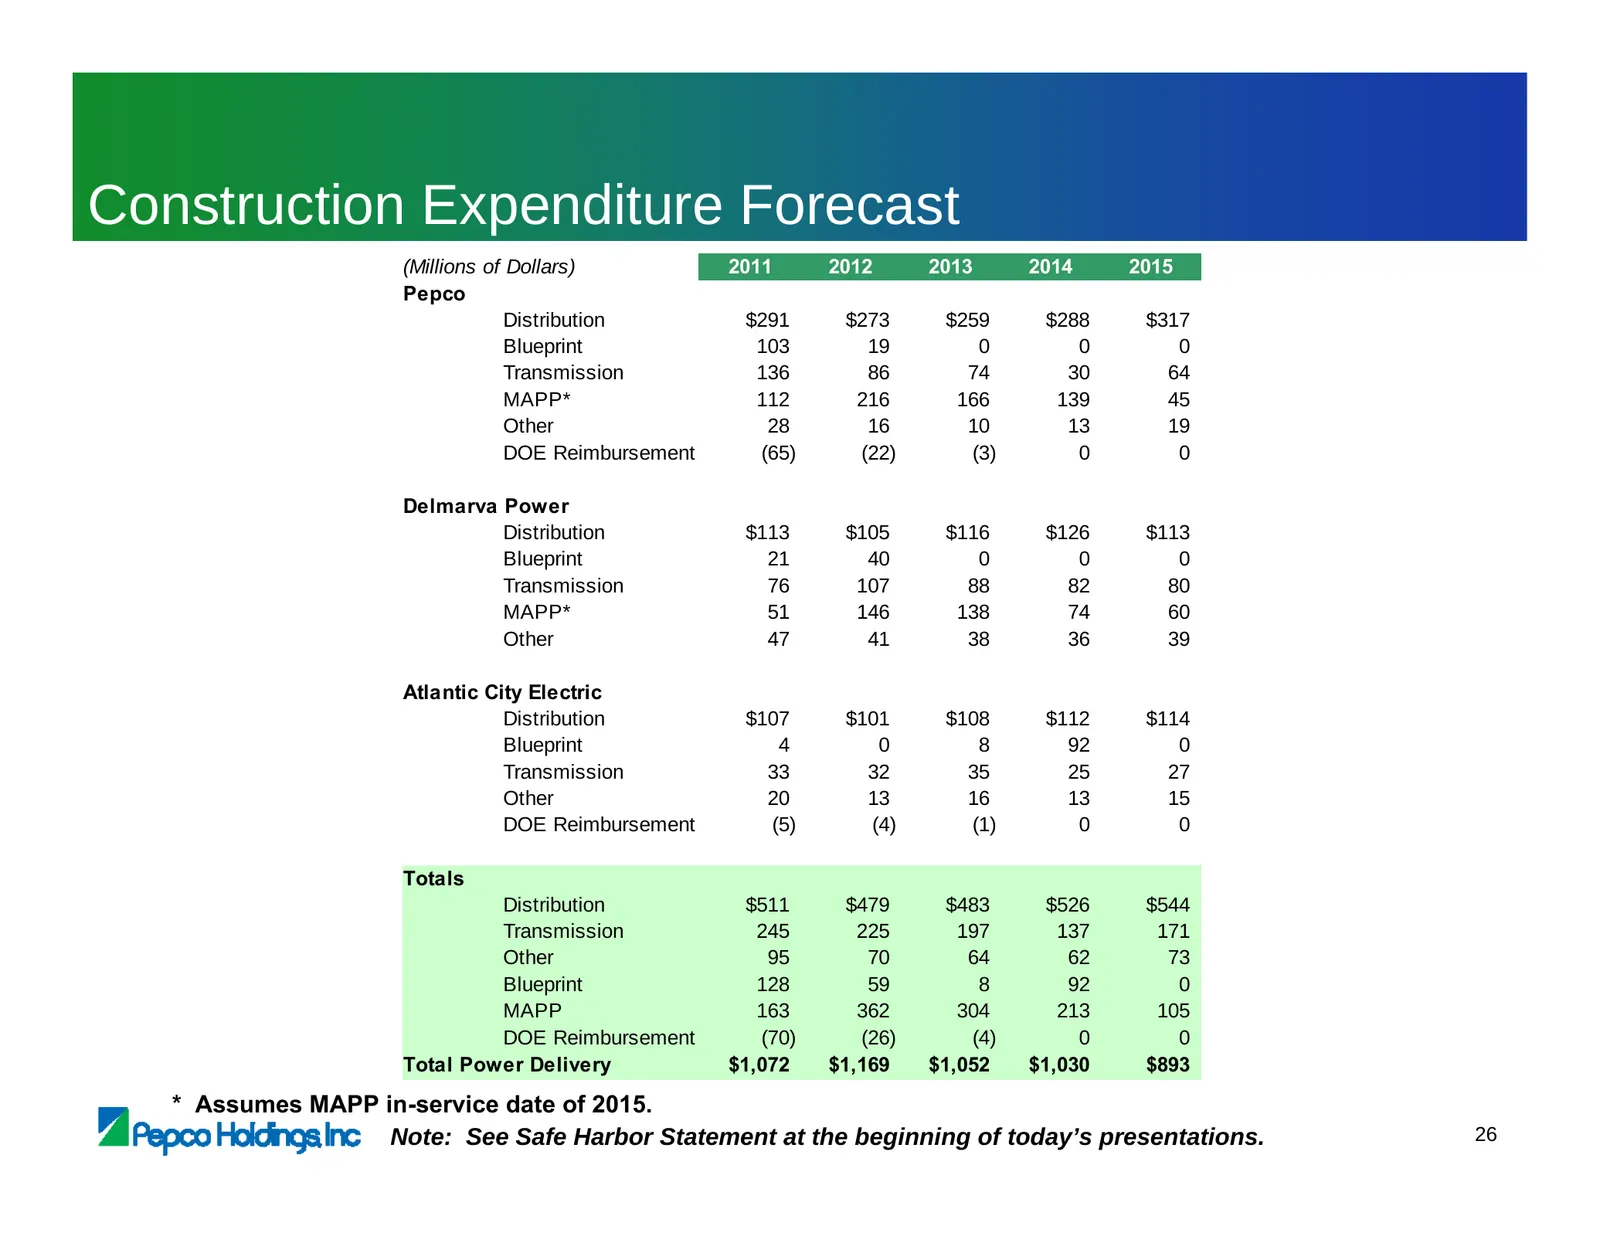
Construction Expenditure Forecast (Millions of Dollars) 2011 2012 2013 2014 2015 Pepco Distribution $291 $273 $259 $288 $317 Blueprint 103 19 0 0 0 Transmission 136 86 74 30 64 MAPP* 112 216 166 139 45 Other 28 16 10 13 19 DOE Reimbursement (65) (22) (3) 0 0 Delmarva Power Distribution $113 $105 $11
Slide 44: Sales Growth
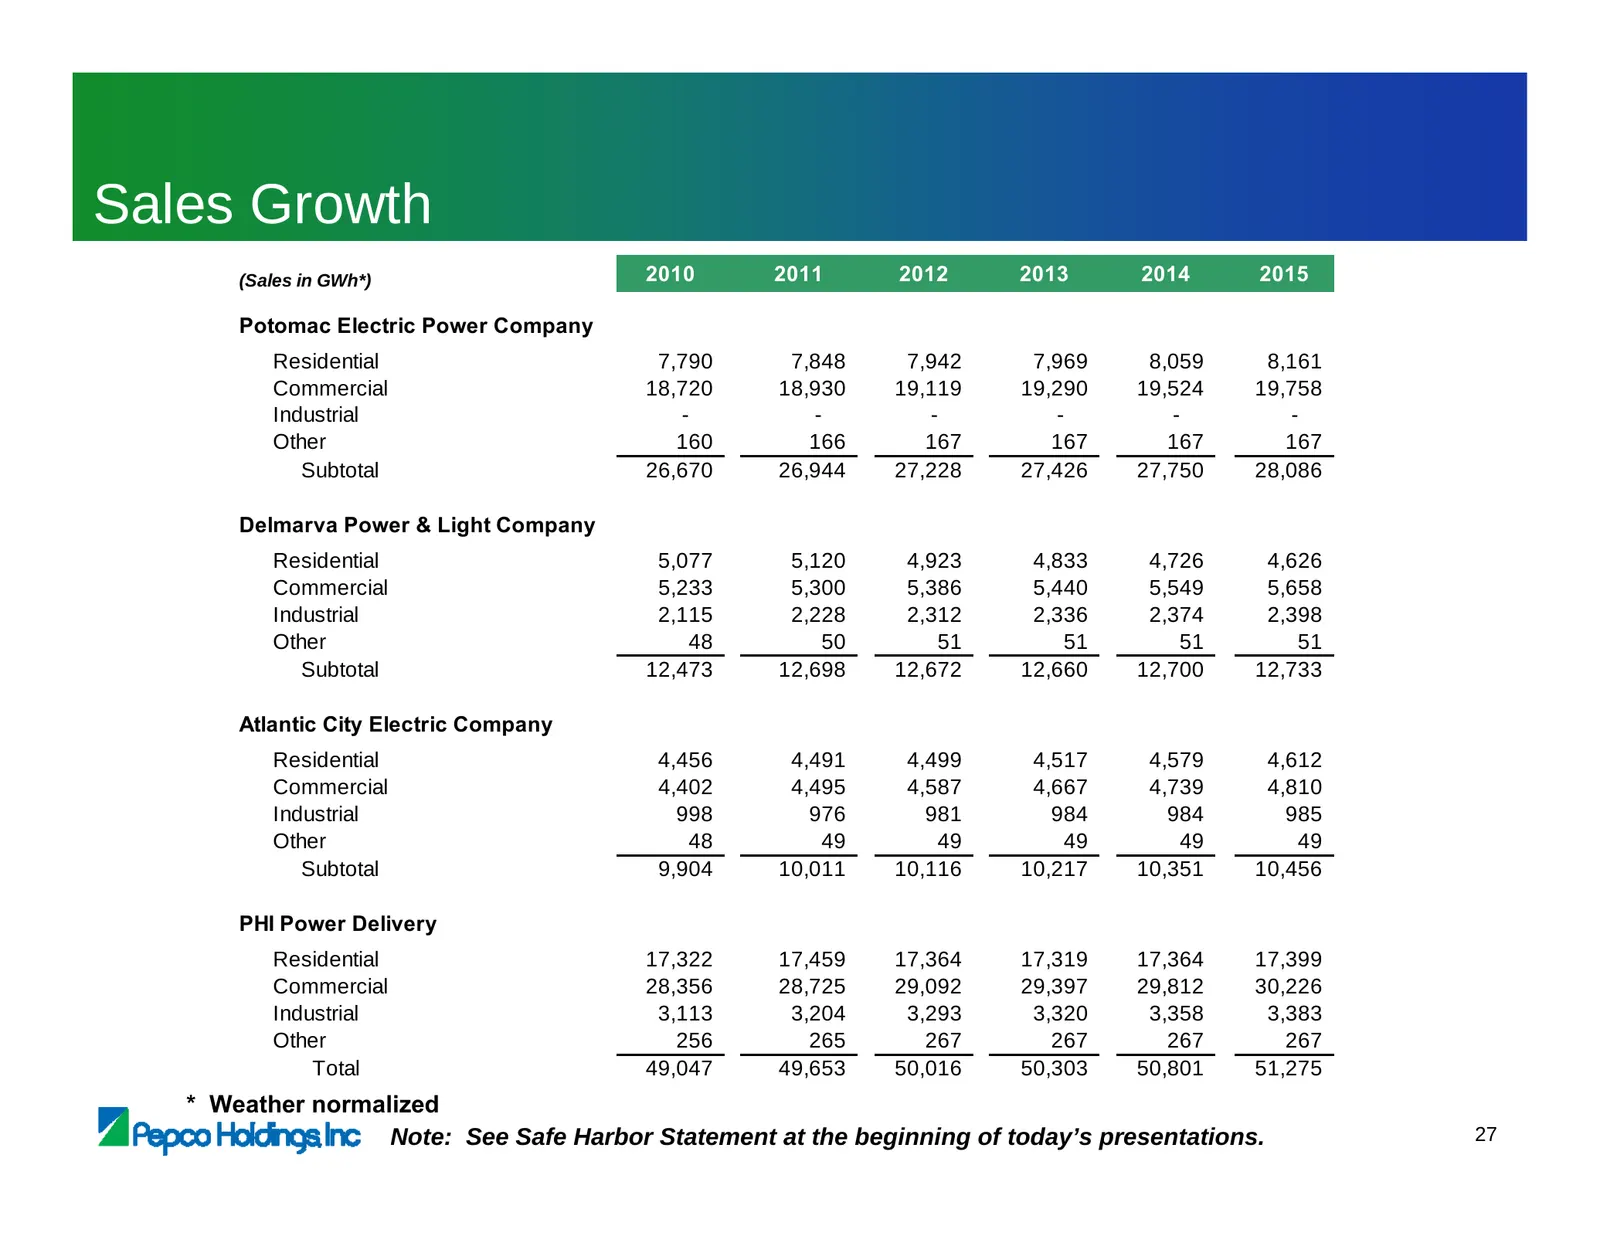
Sales Growth (Sales in GWh*) 2010 2011 2012 2013 2014 2015 Potomac Electric Power Company Residential 7,790 7,848 7,942 7,969 8,059 8,161 Commercial 18,720 18,930 19,119 19,290 19,524 19,758 Industrial - - - - - - Other 160 166 167 167 167 167 Subtotal 26,670 26,944 27,228 27,426 27,750 28,086 Delma
Slide 45: Residential Customer Growth
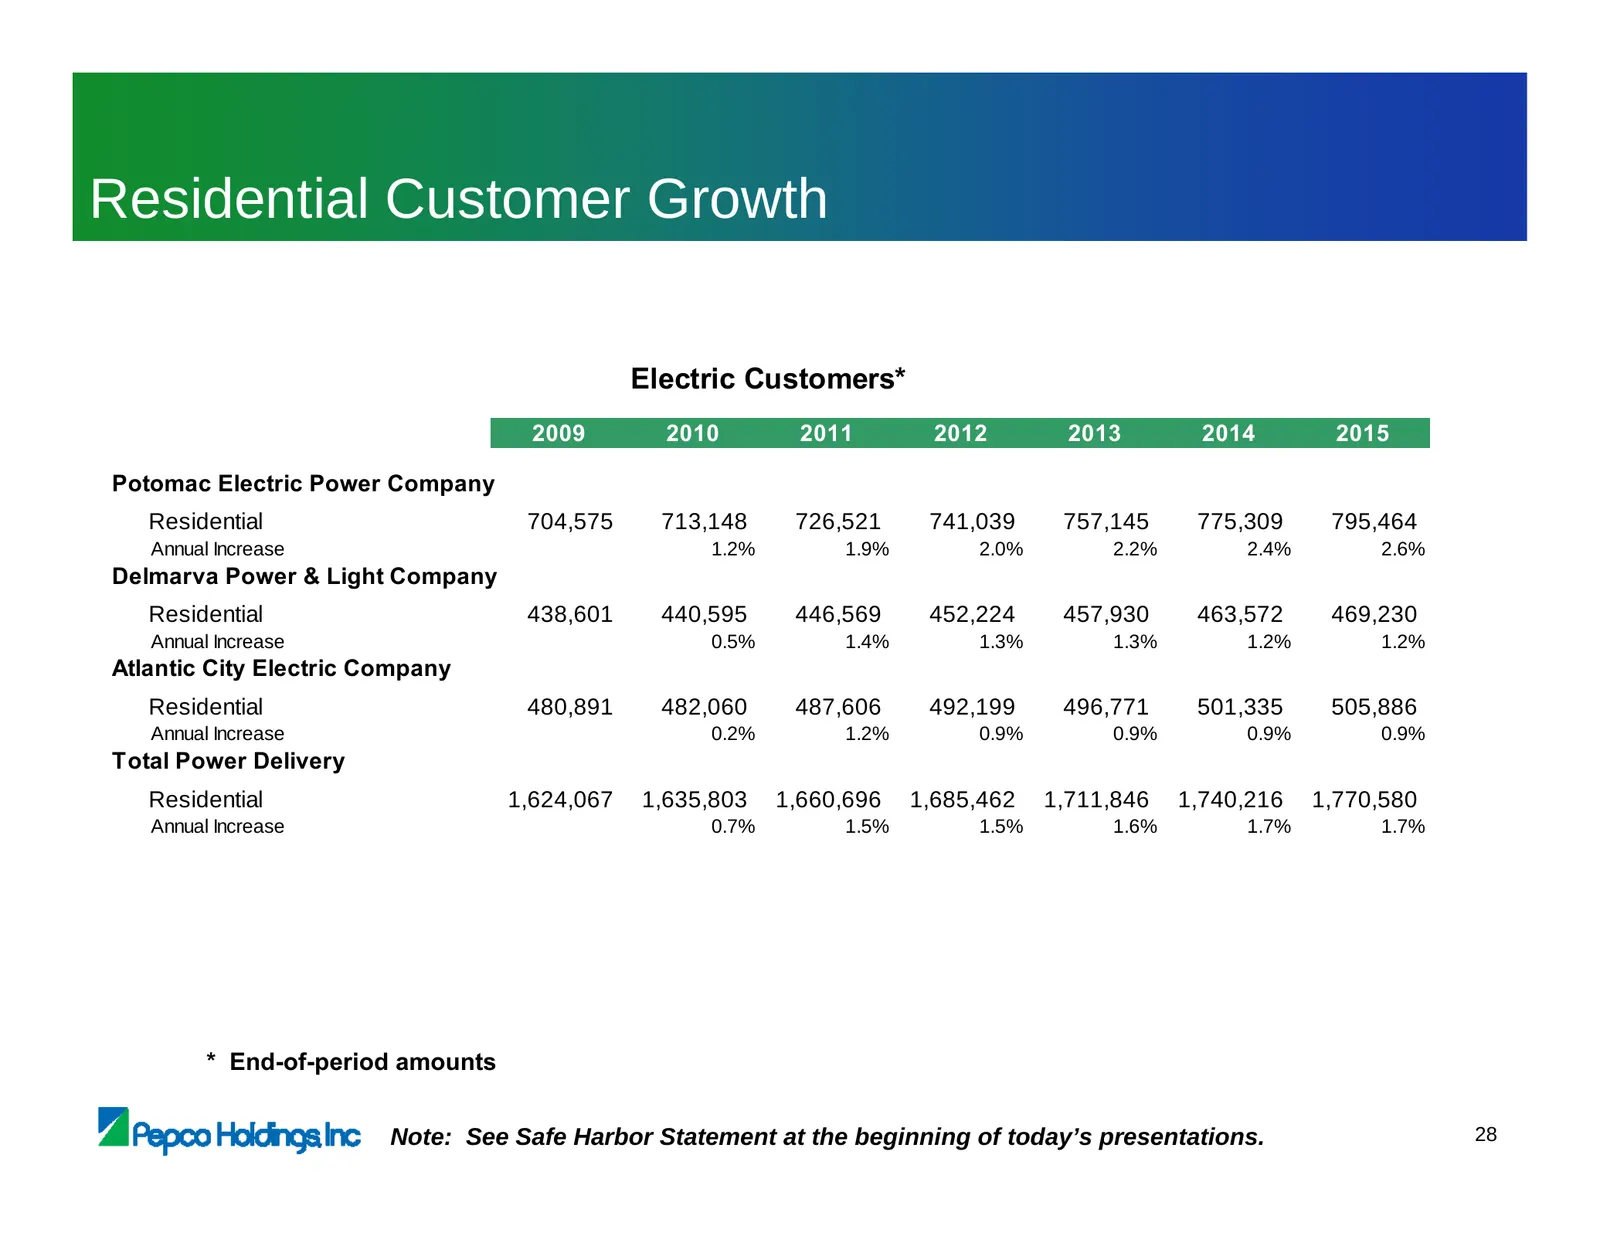
Residential Customer Growth Electric Customers* 2009 2010 2011 2012 2013 2014 2015 Potomac Electric Power Company Residential 704,575 713,148 726,521 741,039 757,145 775,309 795,464 Annual Increase 1.2% 1.9% 2.0% 2.2% 2.4% 2.6% Delmarva Power & Light Company Residential 438,601 440,595 446,569 452,2
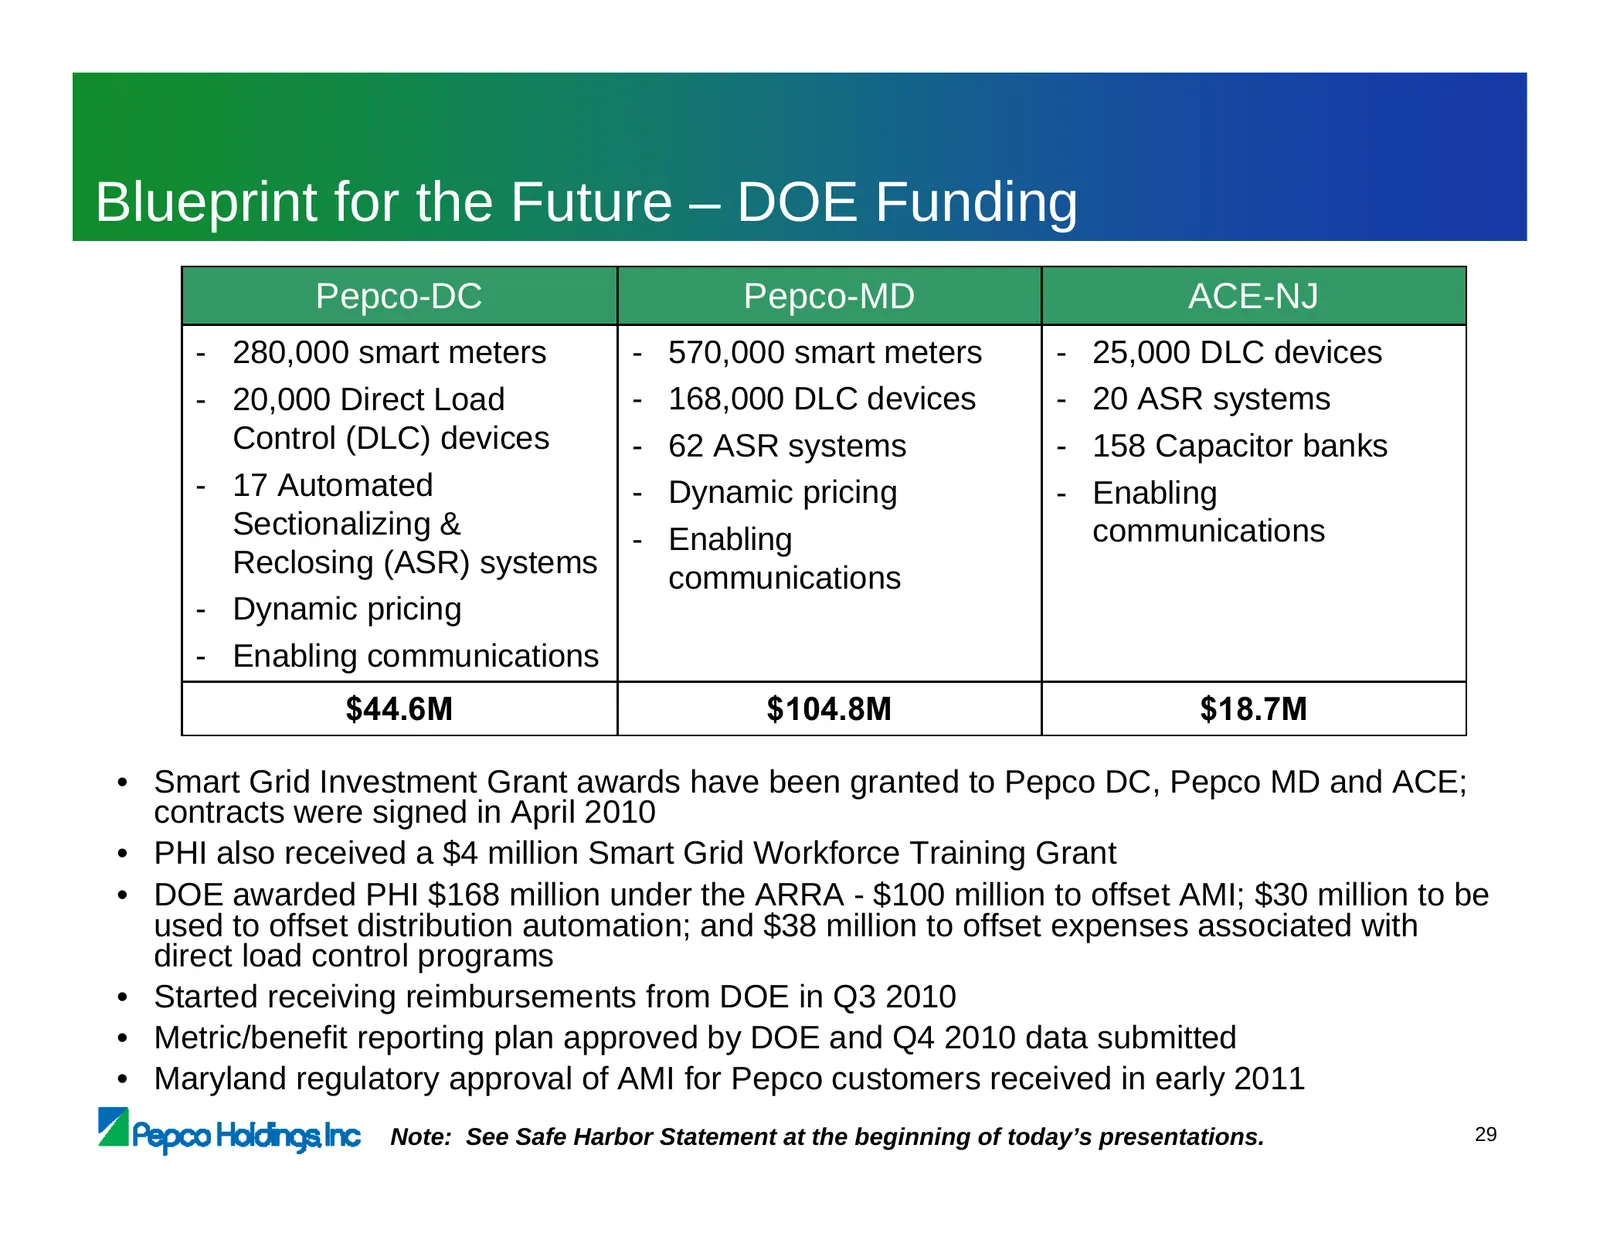
Slide 46: Blueprint for the Future – DOE Funding
Blueprint for the Future – DOE Funding Pepco-DC Pepco-MD ACE-NJ - 280,000 smart meters - 570,000 smart meters - 25,000 DLC devices - 20,000 Direct Load - 168,000 DLC devices - 20 ASR systems Control (DLC) devices - 62 ASR systems - 158 Capacitor banks - 17 Automated - Dynamic pricing - Enabling Sect
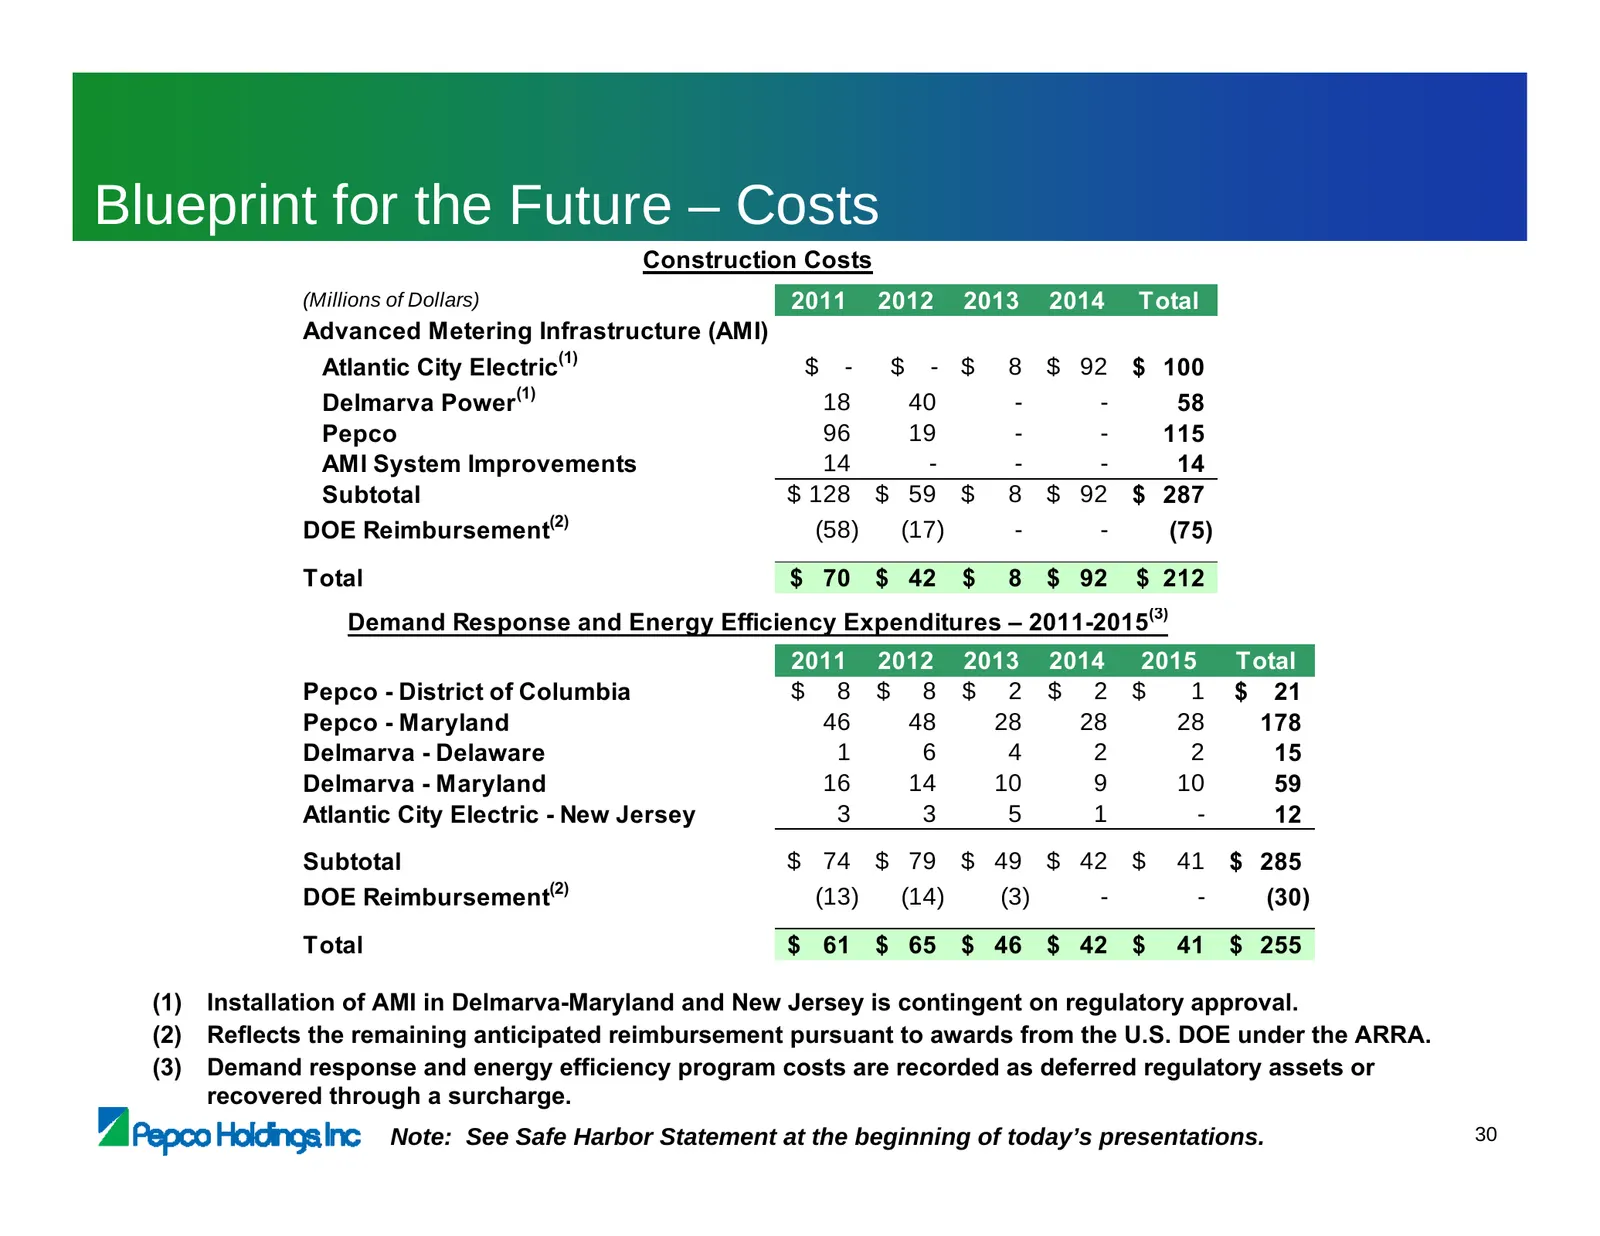
Slide 47: Blueprint for the Future – Costs
Blueprint for the Future – Costs Construction Costs (Millions of Dollars) 2011 2012 2013 2014 Total Advanced Metering Infrastructure (AMI) Atlantic City Electric(1) $ - $ - $ 8 $ 92 $ 100 (1) Delmarva Power 18 40 - - 58 Pepco 96 19 - - 115 AMI System Improvements 14 - - - 14 Subtotal $ 128 $ 59 $ 8
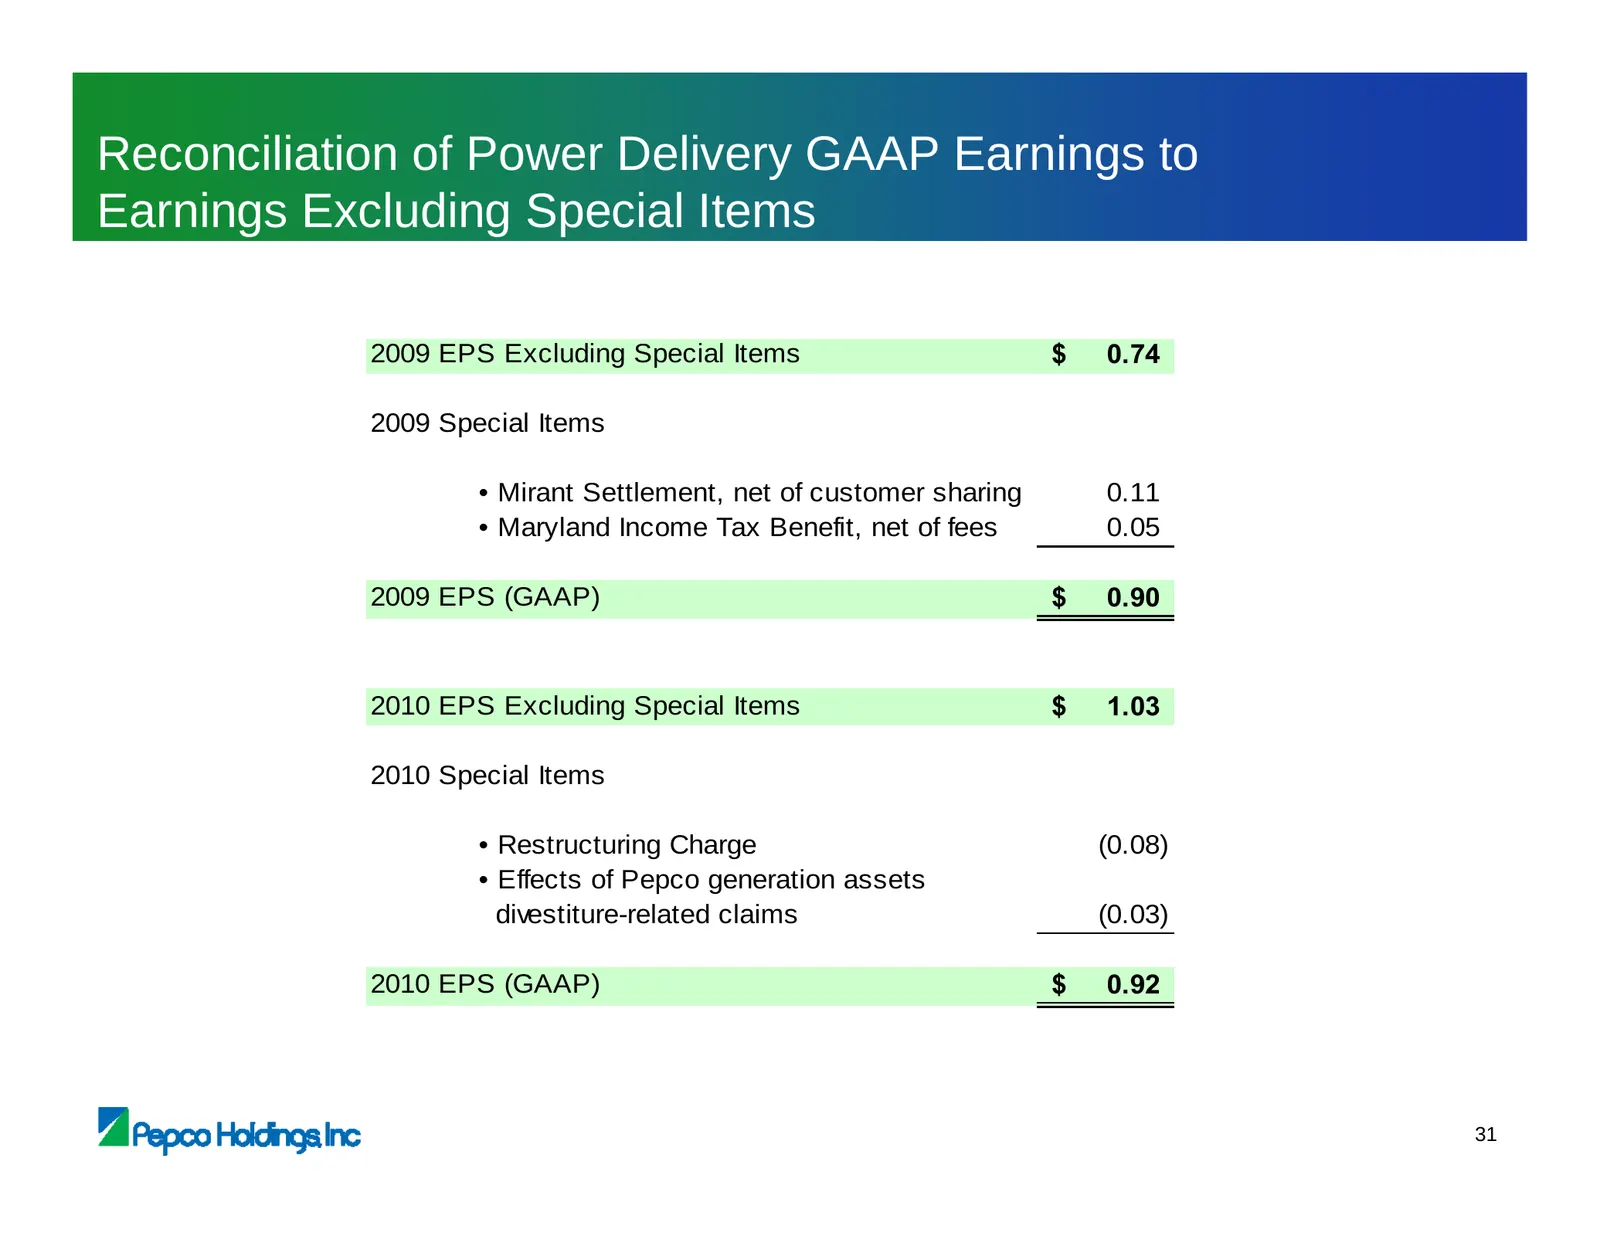
Slide 48: Reconciliation of Power Delivery GAAP Earnings to Earnings Excluding Special Items
Reconciliation of Power Delivery GAAP Earnings to Earnings Excluding Special Items 2009 EPS Excluding Special Items $ 0.74 2009 Special Items • Mirant Settlement, net of customer sharing 0.11 • Maryland Income Tax Benefit, net of fees 0.05 2009 EPS (GAAP) $ 0.90 2010 EPS Excluding Special Items $ 1.
Slide 49: Regulatory Overview
Regulatory Overview Tony Kamerick Senior Vice President & Chief Financial Officer
Slide 50: Executing Our Regulatory Strategy – A Core Competency
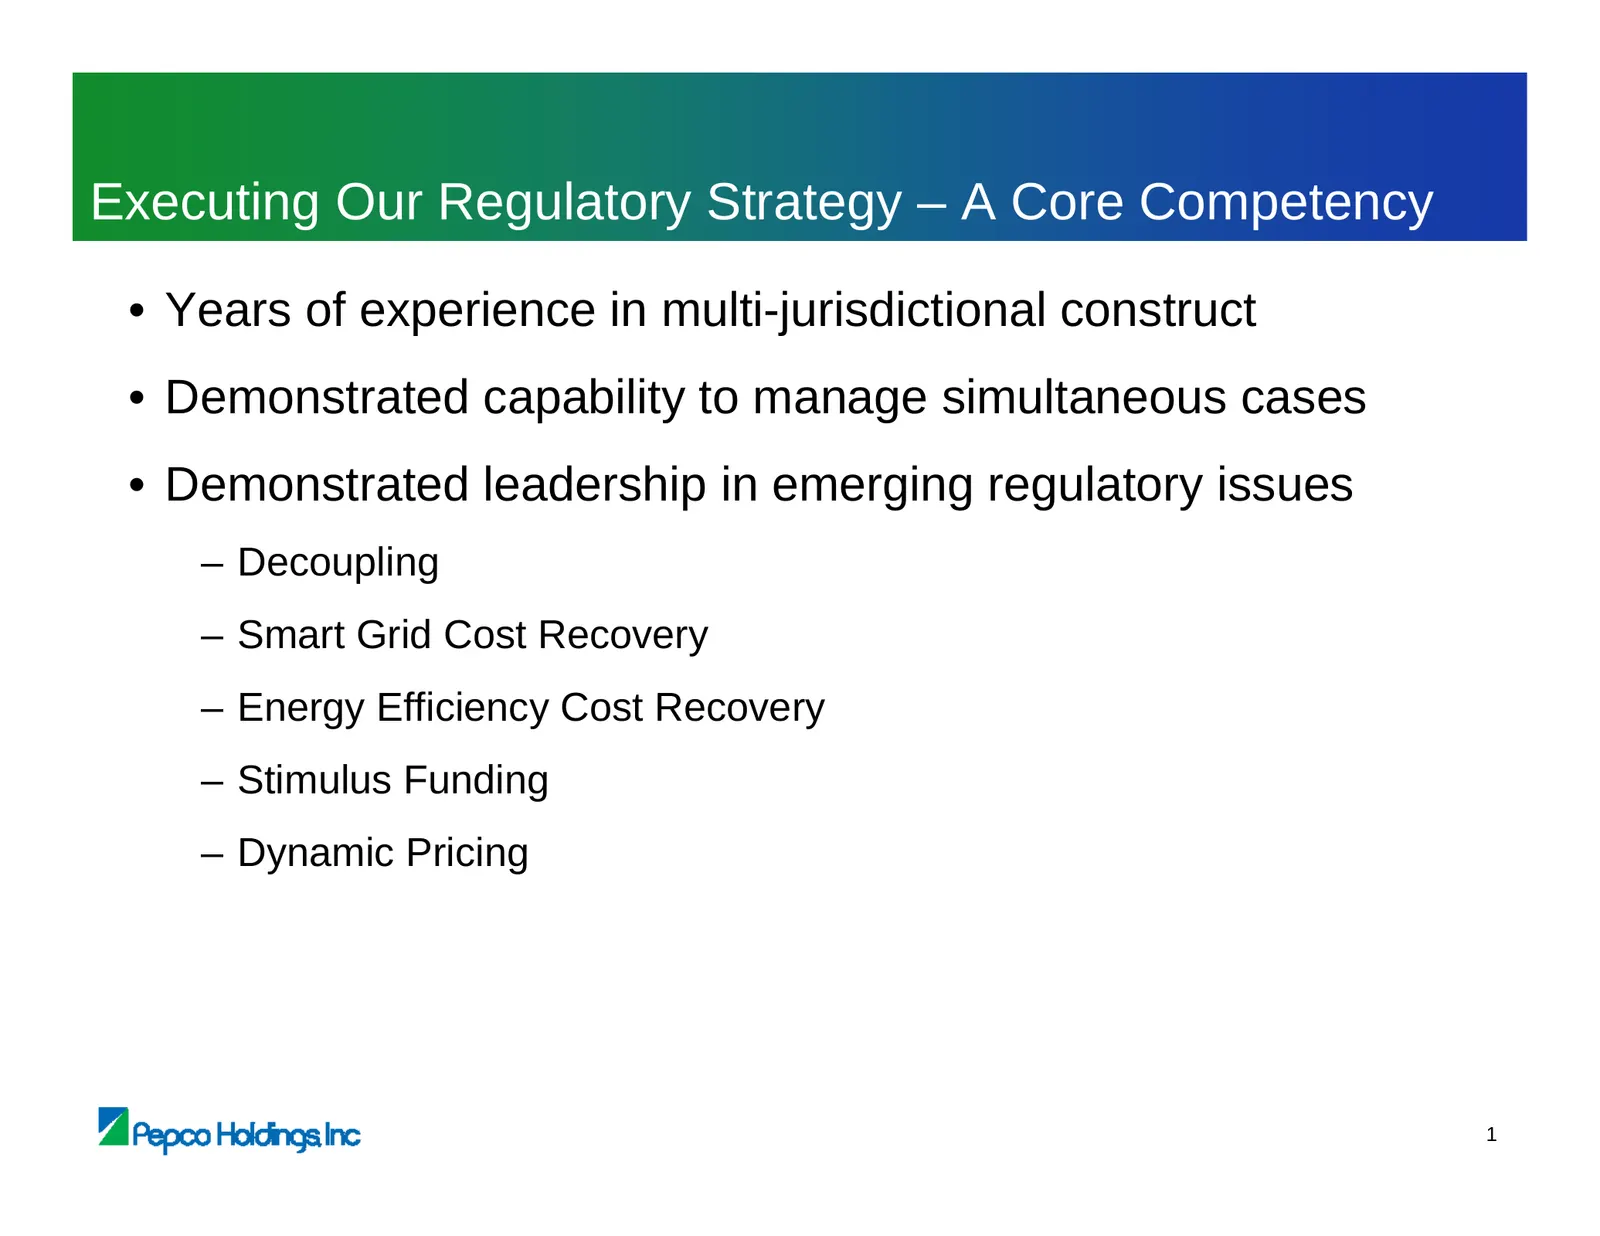
Executing Our Regulatory Strategy – A Core Competency • Years of experience in multi-jurisdictional construct • Demonstrated capability to manage simultaneous cases • Demonstrated leadership in emerging regulatory issues – Decoupling – Smart Grid Cost Recovery – Energy Efficiency Cost Recovery – Sti
Slide 51: Regulatory Highlights – 2010 to Present
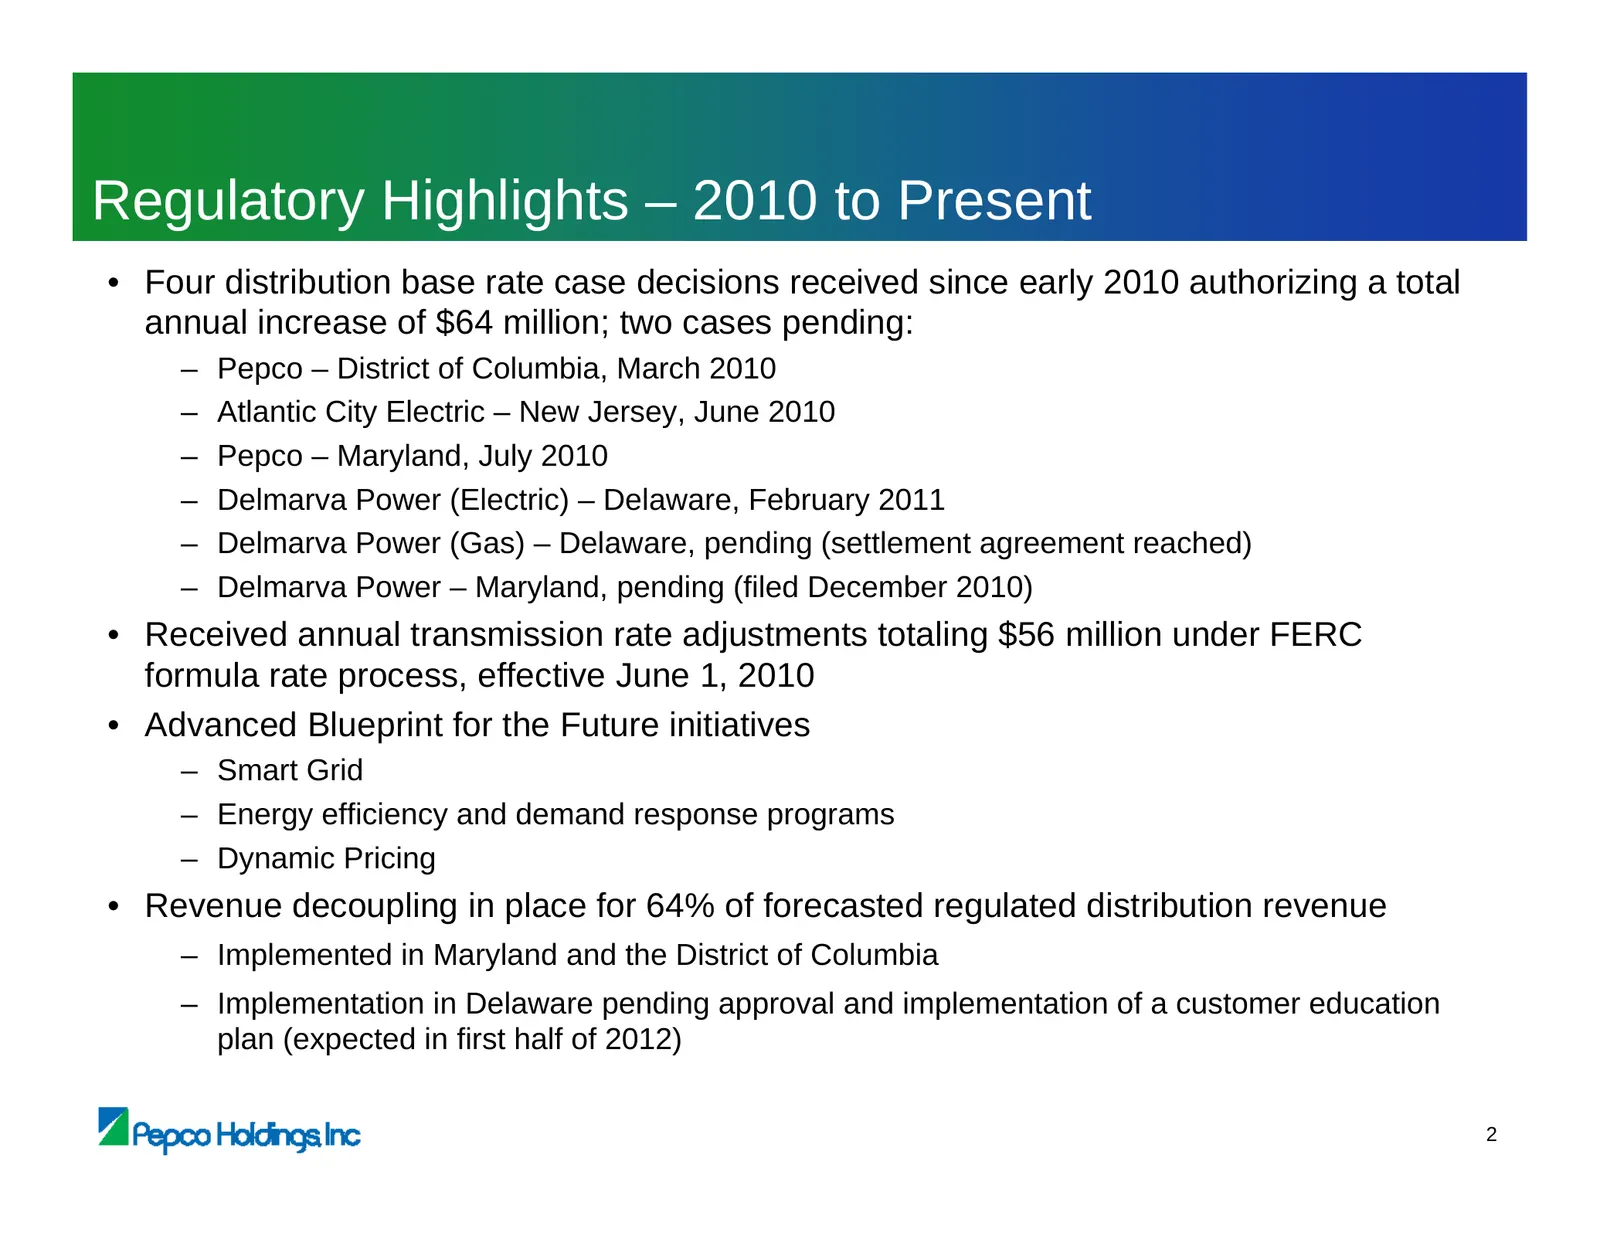
Regulatory Highlights – 2010 to Present • Four distribution base rate case decisions received since early 2010 authorizing a total annual increase of $64 million; two cases pending: – Pepco – District of Columbia, March 2010 – Atlantic City Electric – New Jersey, June 2010 – Pepco – Maryland, July 2
Slide 52: Regulatory Environment
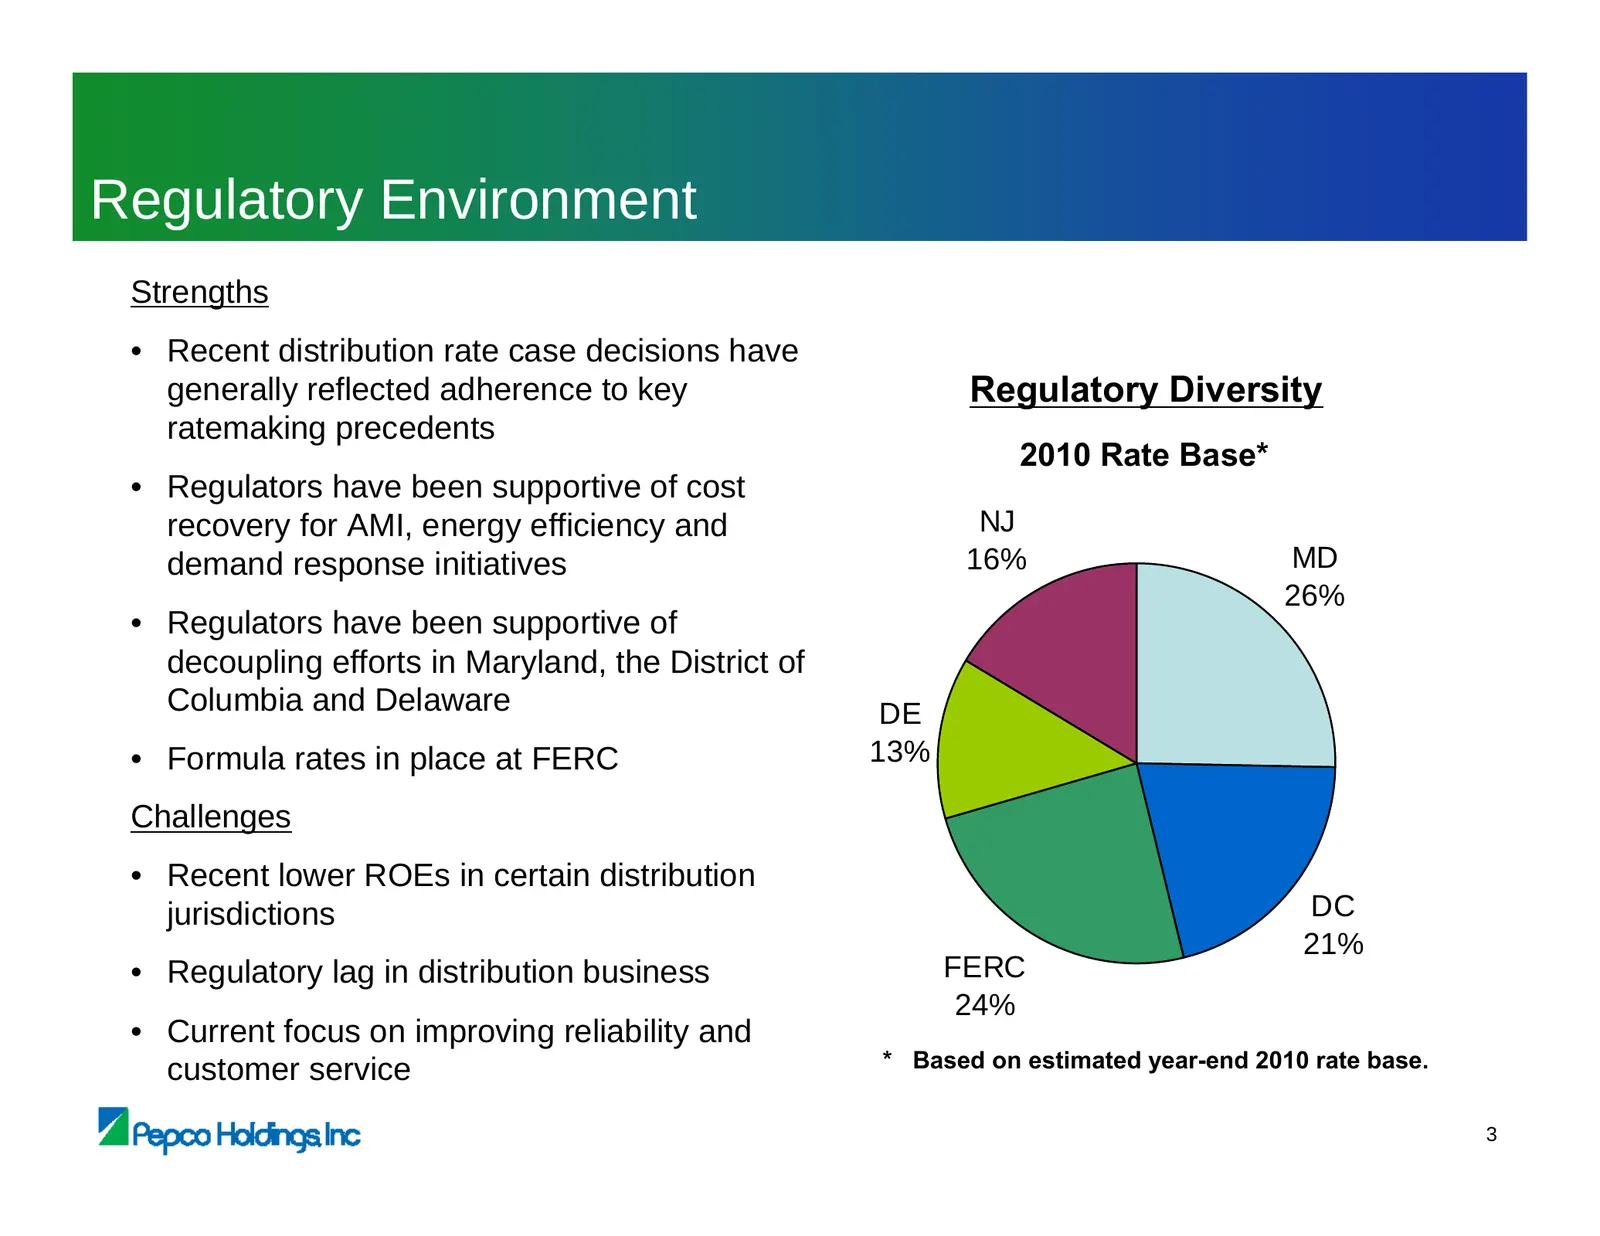
Regulatory Environment Strengths • Recent distribution rate case decisions have generally reflected adherence to key Regulatory Diversity ratemaking precedents 2010 Rate Base* • Regulators have been supportive of cost recovery for AMI, energy efficiency and NJ demand response initiatives 16% MD 26%
Slide 53: Rate Base Summary
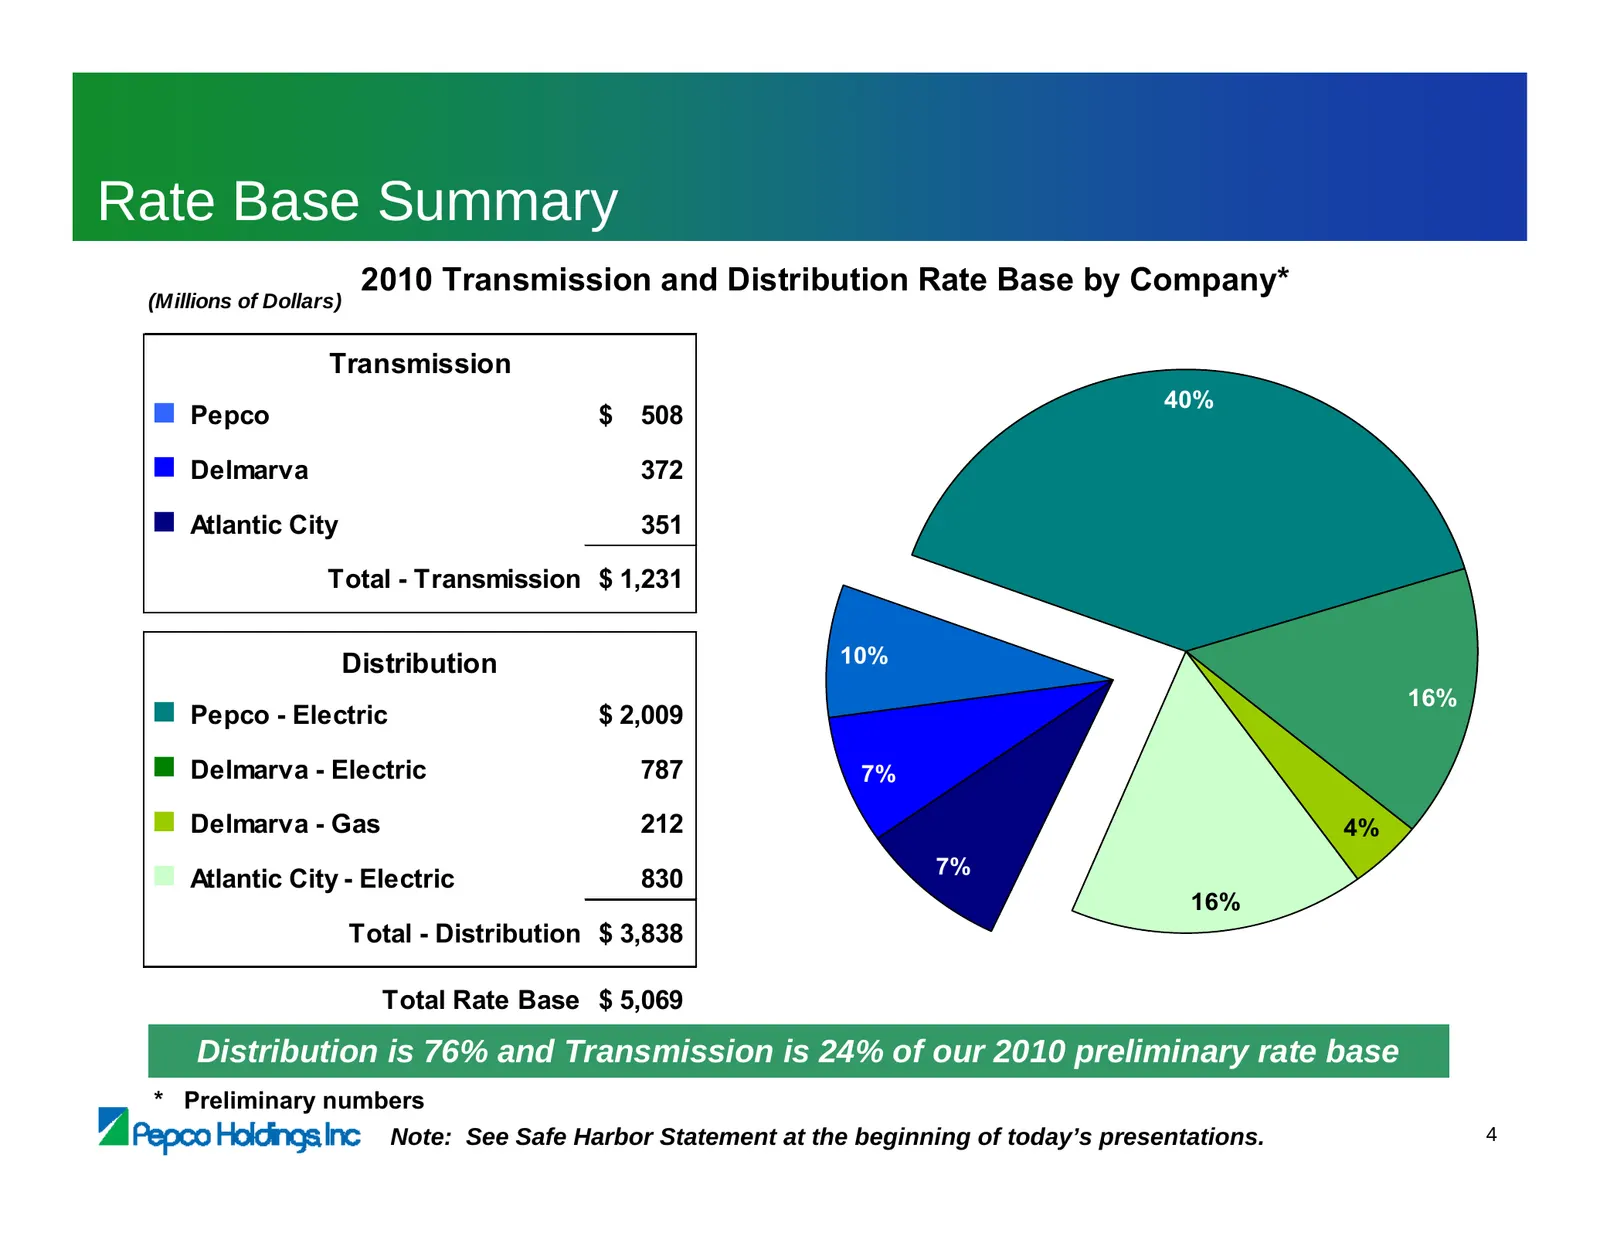
Rate Base Summary 2010 Transmission and Distribution Rate Base by Company* (Millions of Dollars) Transmission ■ Pepco $ 508 40% ■ Delmarva 372 ■ Atlantic City 351 Total - Transmission $ 1,231 7% Distribution 10% ■ Pepco - Electric $ 2,009 16% ■ Delmarva - Electric 787 7% 7% 4 ■ Delmarva - Gas 212 4%
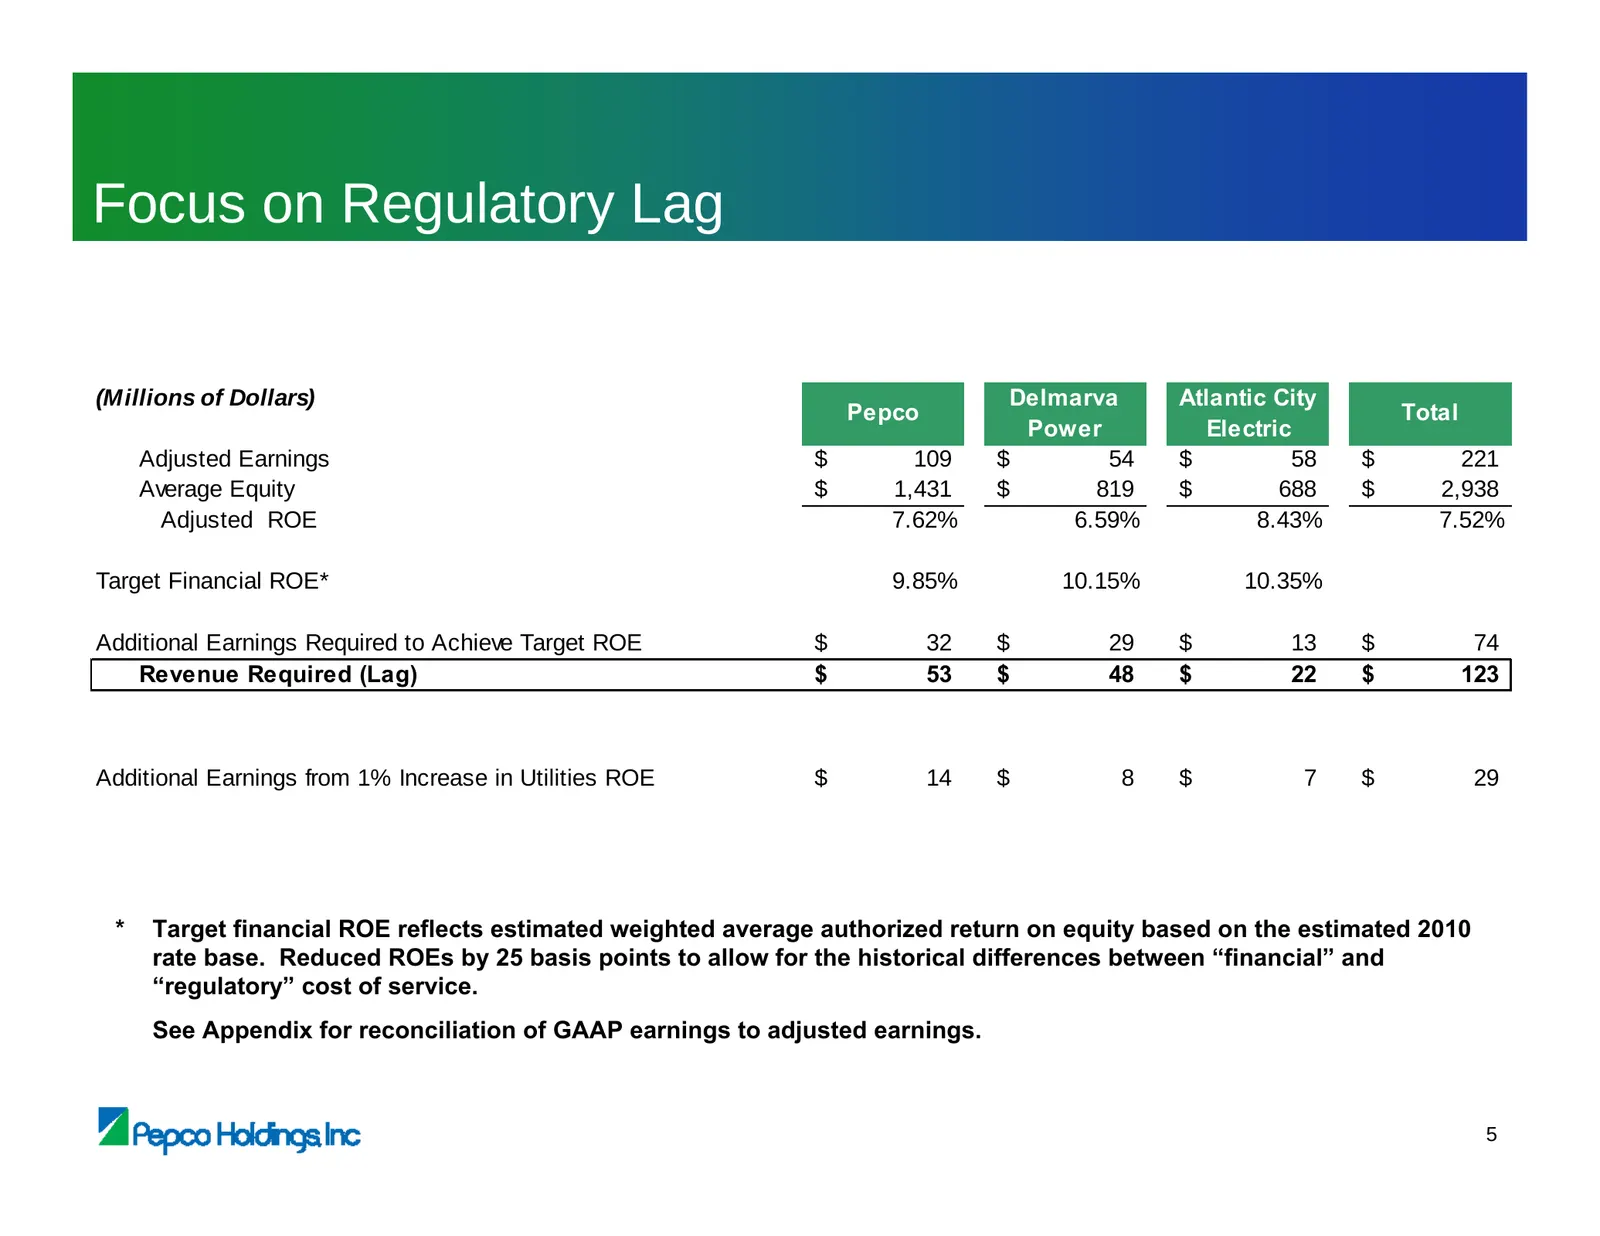
Slide 54: Focus on Regulatory Lag
Focus on Regulatory Lag (Millions of Dollars) Delmarva Atlantic City Pepco Total Power Electric Adjusted Earnings $ 109 $ 54 $ 58 $ 221 Average Equity $ 1,431 $ 819 $ 688 $ 2,938 Adjusted ROE 7.62% 6.59% 8.43% 7.52% Target Financial ROE* 9.85% 10.15% 10.35% Additional Earnings Required to Achieve Ta
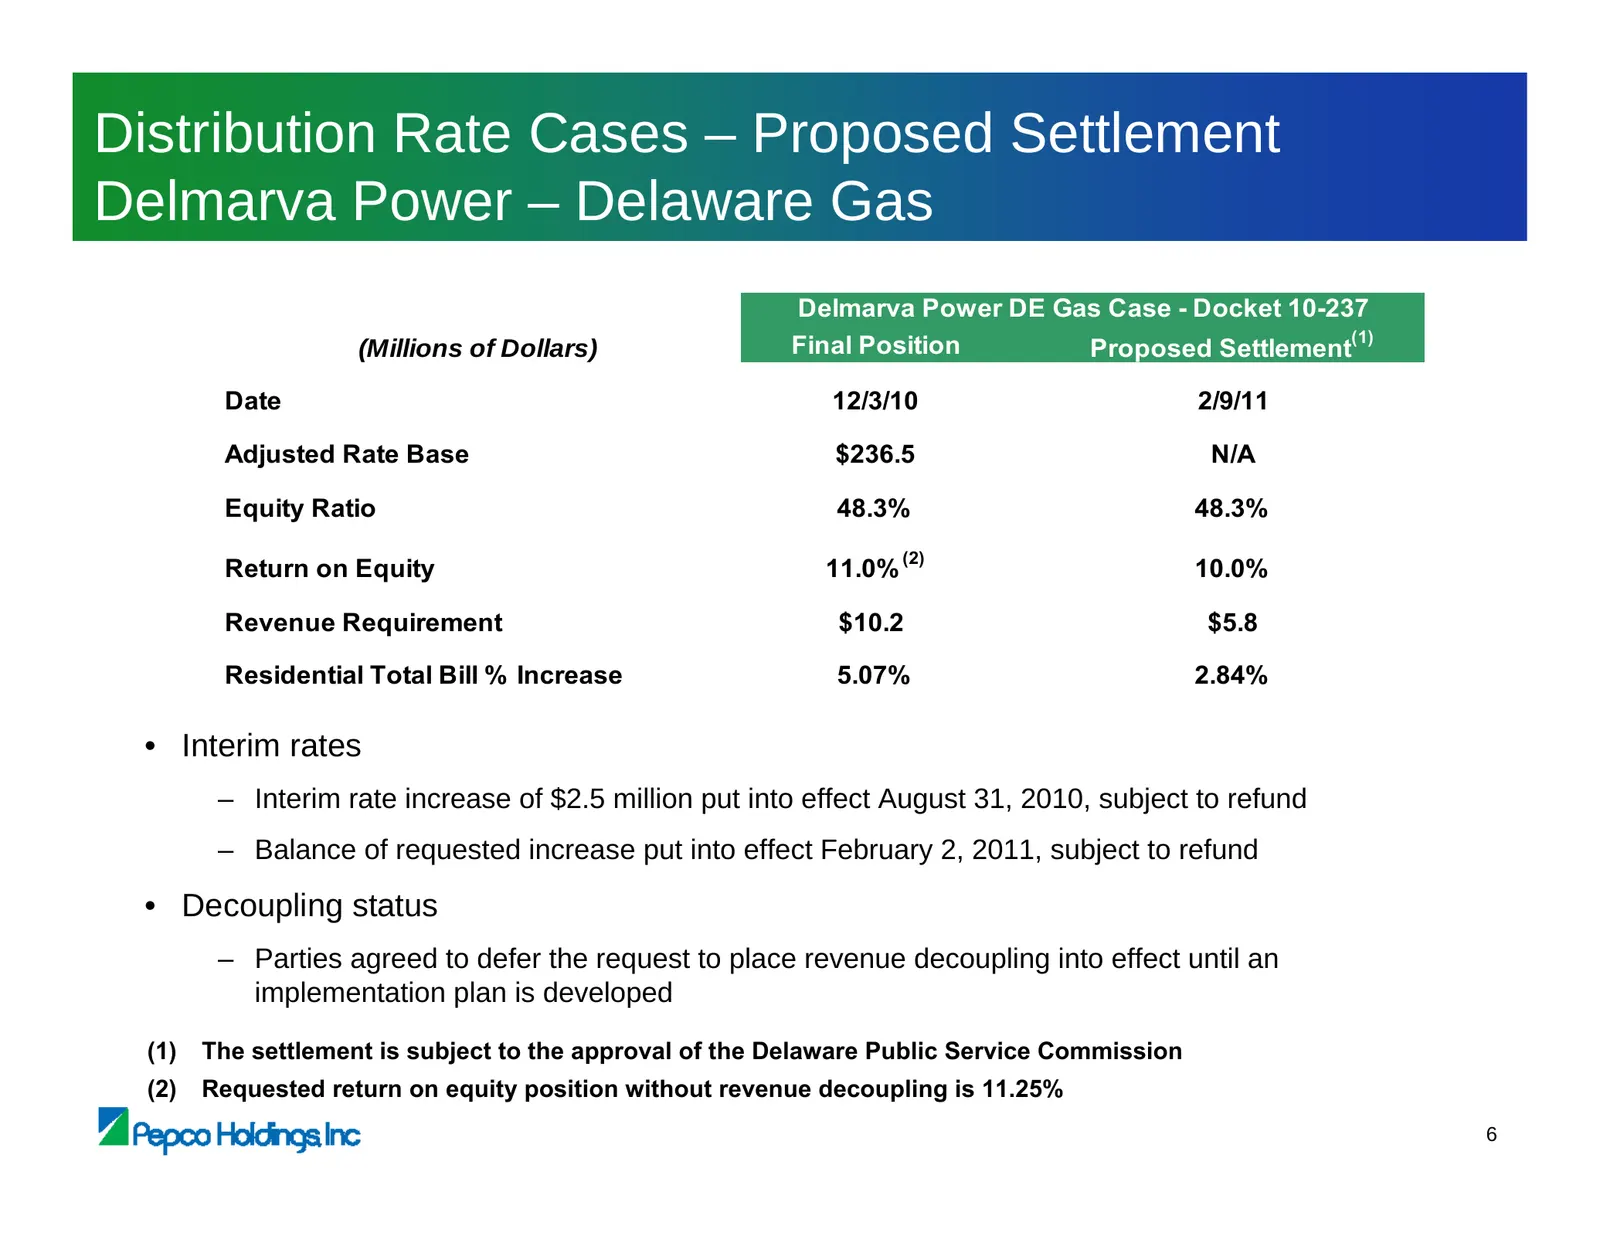
Slide 55: Distribution Rate Cases – Proposed Settlement Delmarva Power – Delaware Gas
Distribution Rate Cases – Proposed Settlement Delmarva Power – Delaware Gas Delmarva Power DE Gas Case - Docket 10-237 (1) (Millions of Dollars) Final Position Proposed Settlement Date 12/3/10 2/9/11 Adjusted Rate Base $236.5 N/A Equity Ratio 48.3% 48.3% (2) Return on Equity 11.0% 10.0% Revenue Requ
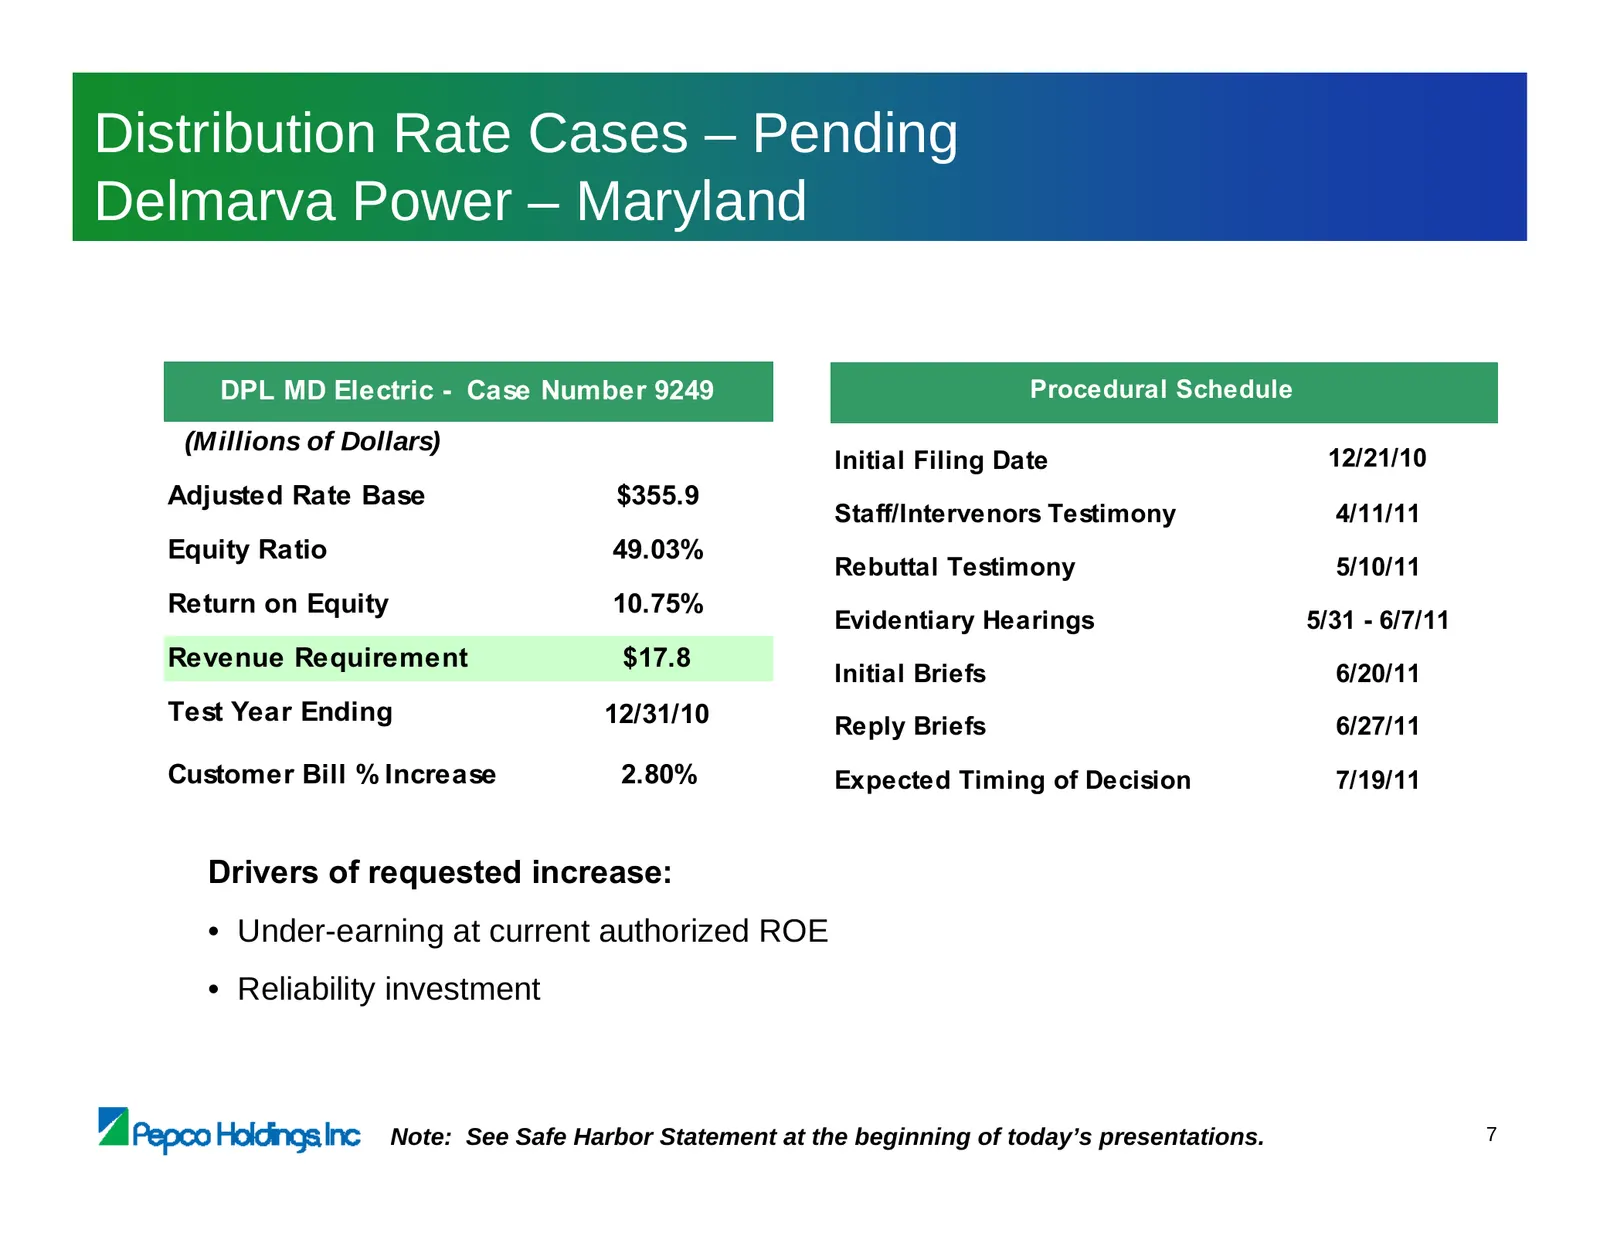
Slide 56: Distribution Rate Cases – Pending Delmarva Power – Maryland
Distribution Rate Cases – Pending Delmarva Power – Maryland DPL MD Electric - Case Number 9249 Procedural Schedule (Millions of Dollars) Initial Filing Date 12/21/10 Adjusted Rate Base $355.9 Staff/Intervenors Testimony 4/11/11 Equity Ratio 49.03% Rebuttal Testimony 5/10/11 Return on Equity 10.75% E
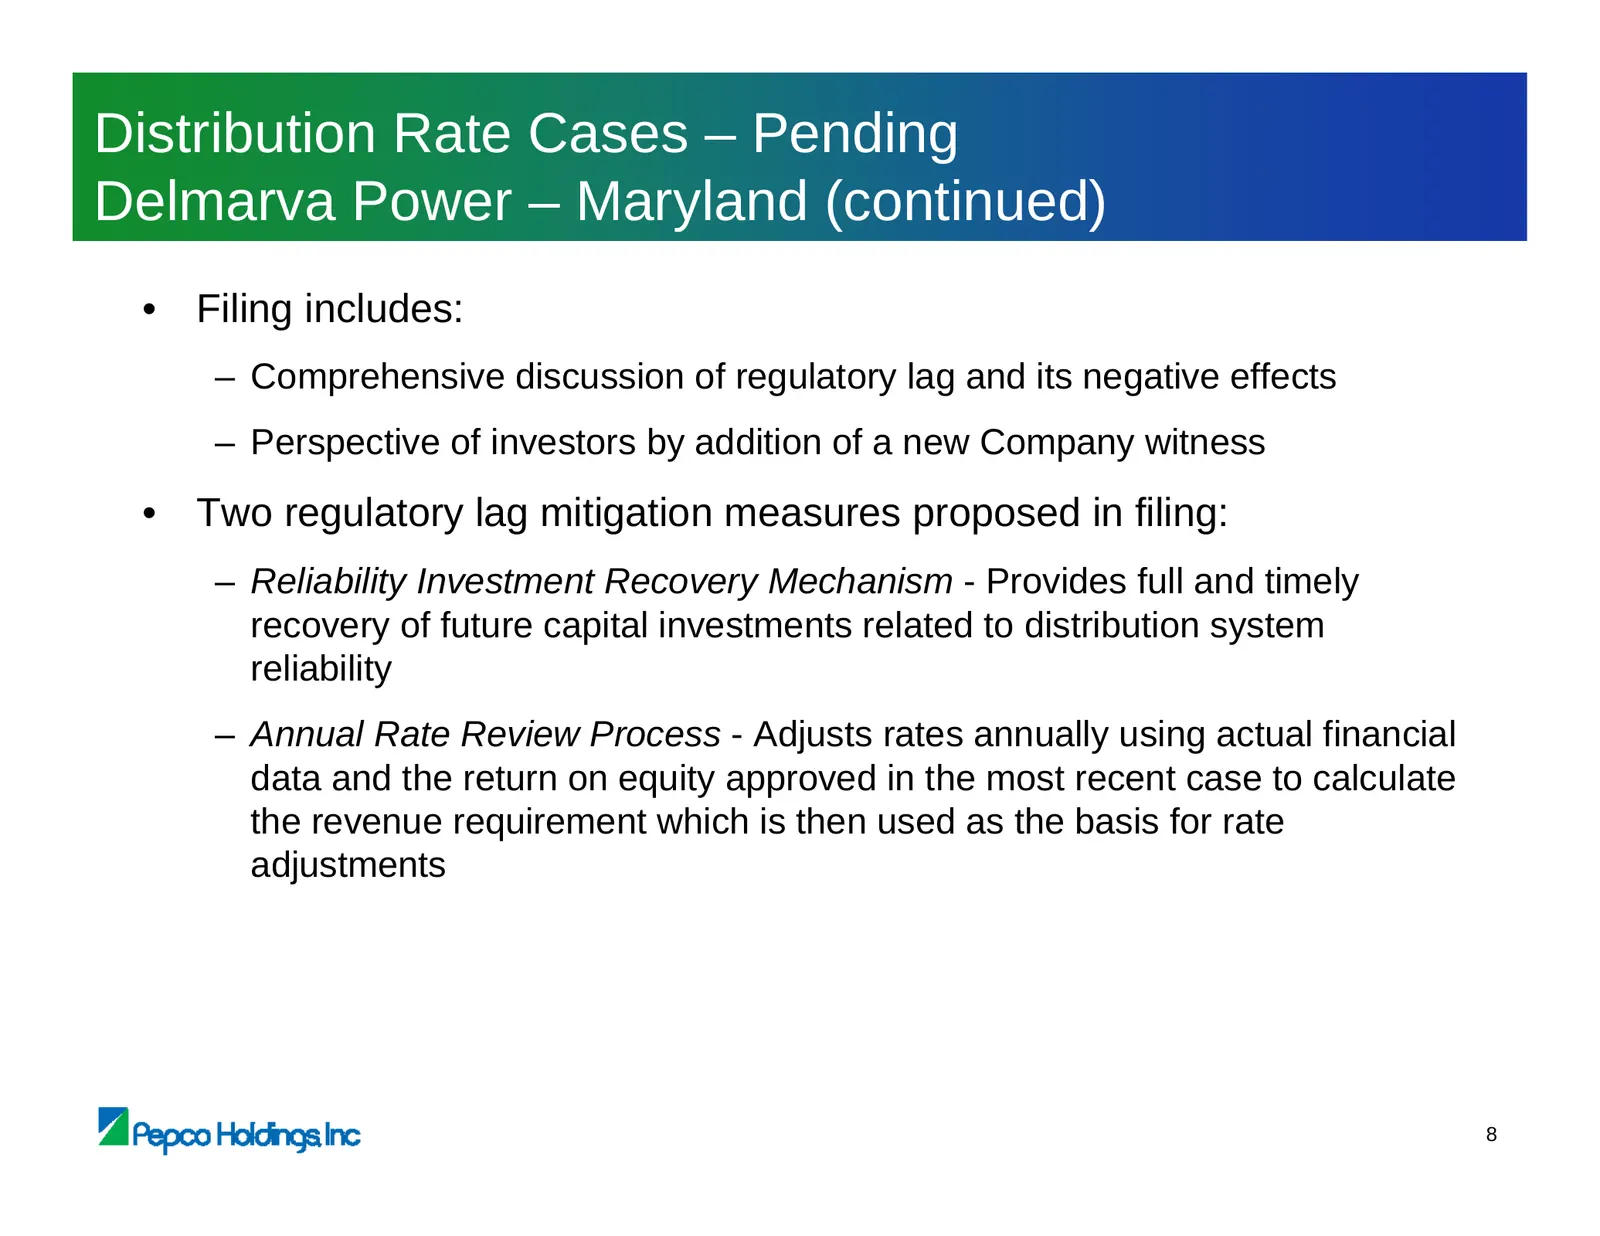
Slide 57: Distribution Rate Cases – Pending Delmarva Power – Maryland (continued)
Distribution Rate Cases – Pending Delmarva Power – Maryland (continued) • Filing includes: – Comprehensive discussion of regulatory lag and its negative effects – Perspective of investors by addition of a new Company witness • Two regulatory lag mitigation measures proposed in filing: – Reliability
Slide 58: Continued Consideration of Regulatory Lag Reduction Mechanisms
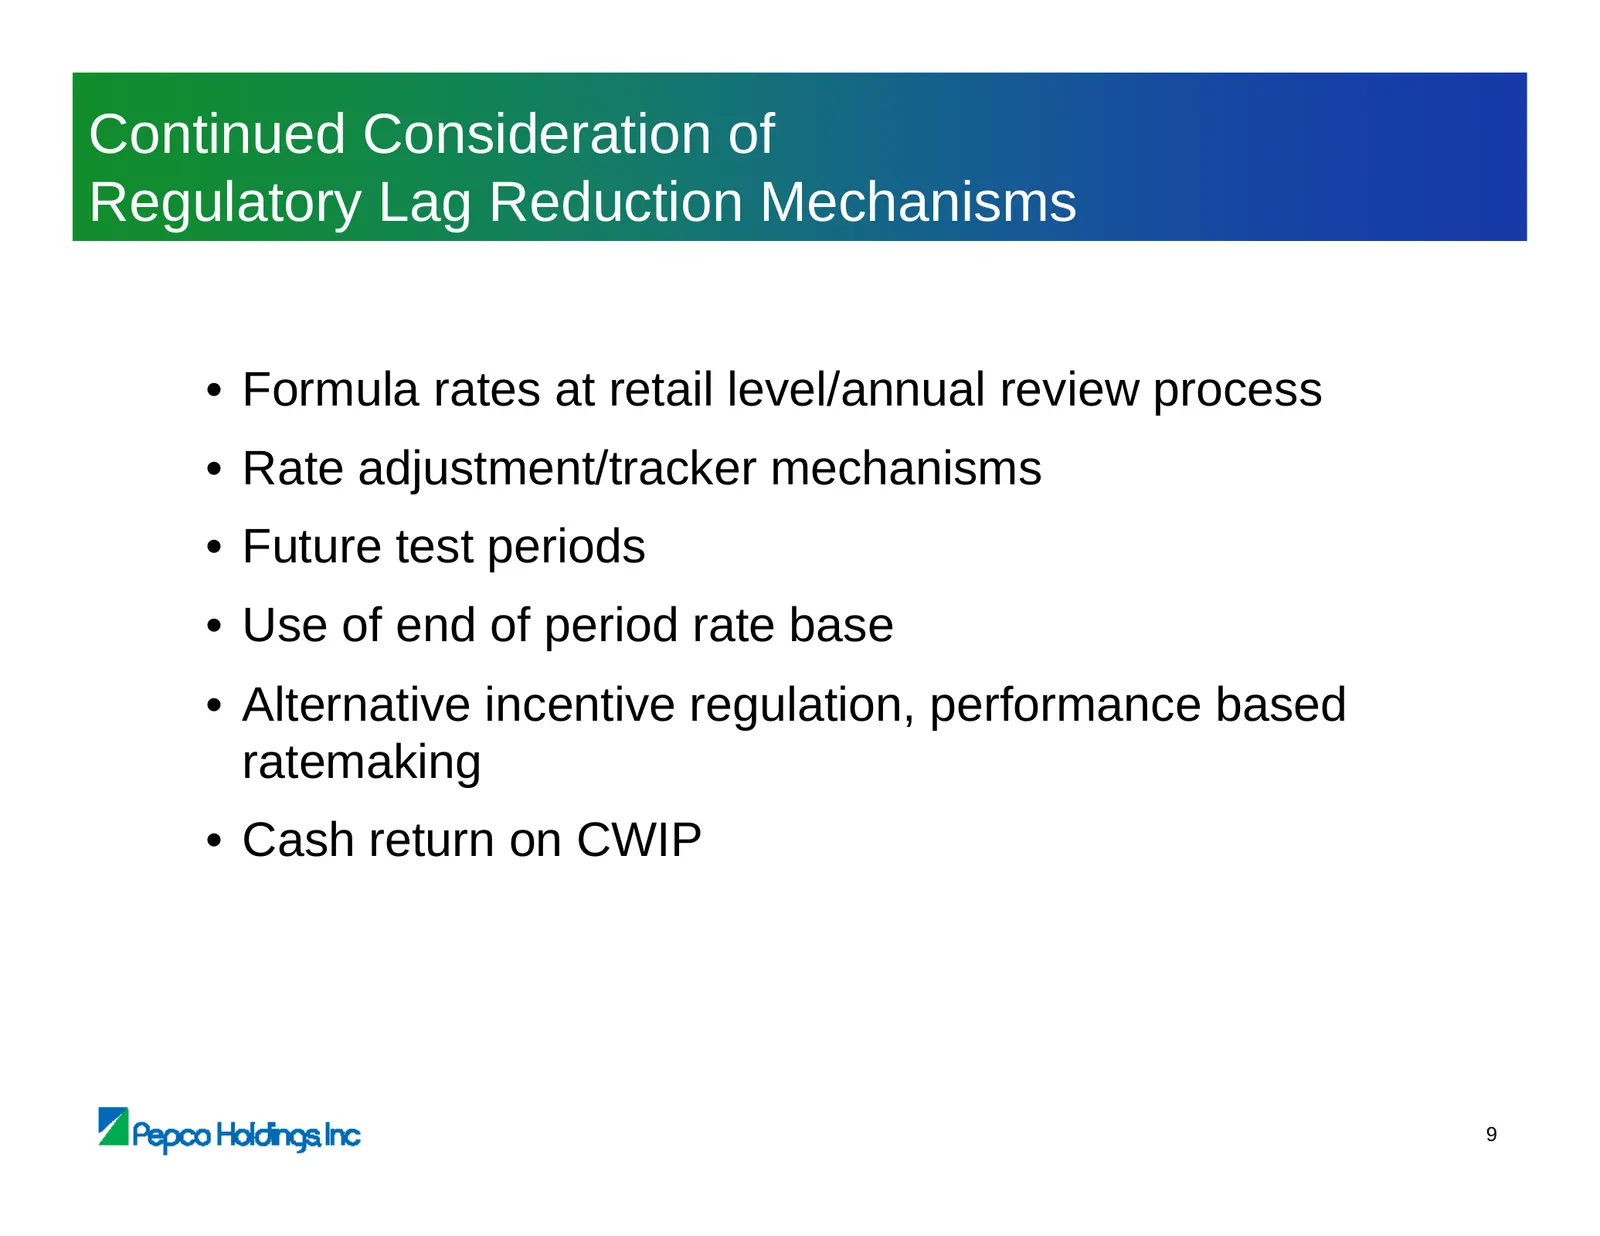
Continued Consideration of Regulatory Lag Reduction Mechanisms • Formula rates at retail level/annual review process • Rate adjustment/tracker mechanisms • Future test periods • Use of end of period rate base • Alternative incentive regulation, performance based ratemaking • Cash return on CWIP 9
Slide 59: Distribution Rate Cases – The Next Cycle
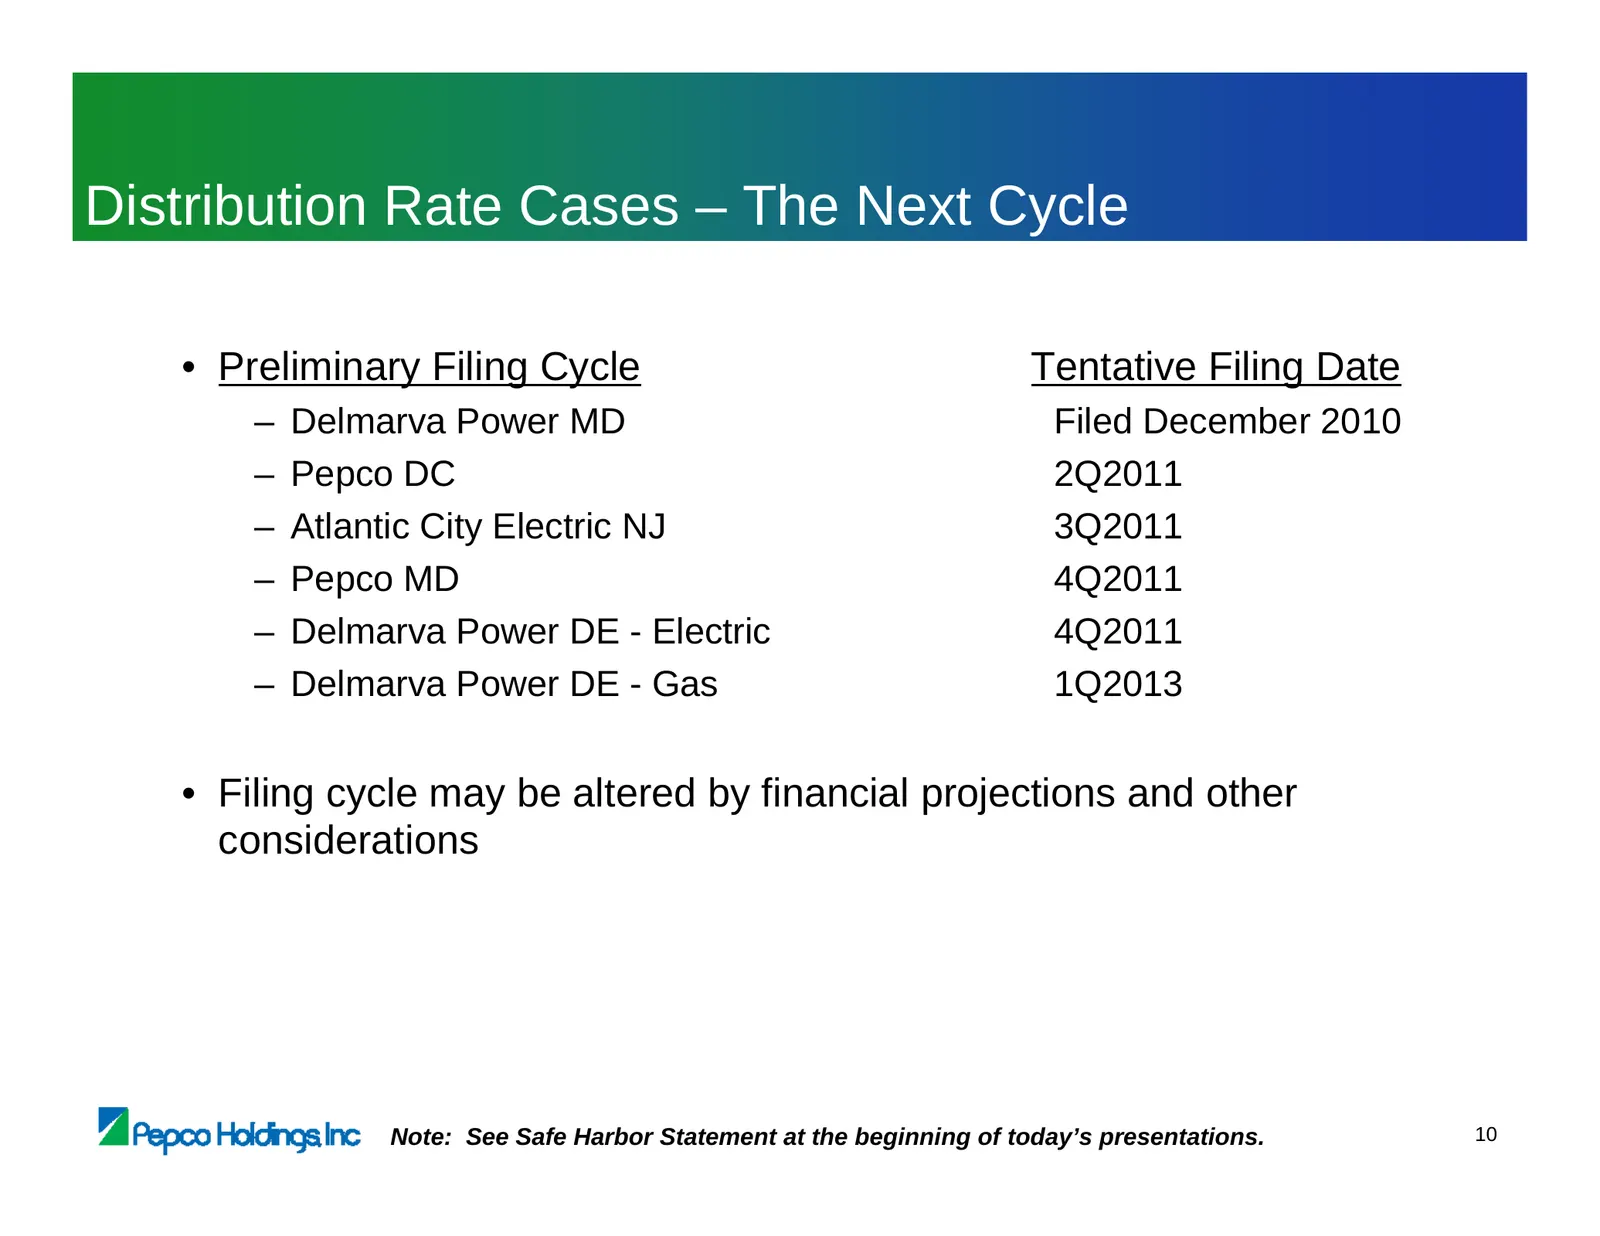
Distribution Rate Cases – The Next Cycle • Preliminary Filing Cycle Tentative Filing Date – Delmarva Power MD Filed December 2010 – Pepco DC 2Q2011 – Atlantic City Electric NJ 3Q2011 – Pepco MD 4Q2011 – Delmarva Power DE - Electric 4Q2011 – Delmarva Power DE - Gas 1Q2013 • Filing cycle may be altere
Slide 60: Blueprint – Project Status by Jurisdiction
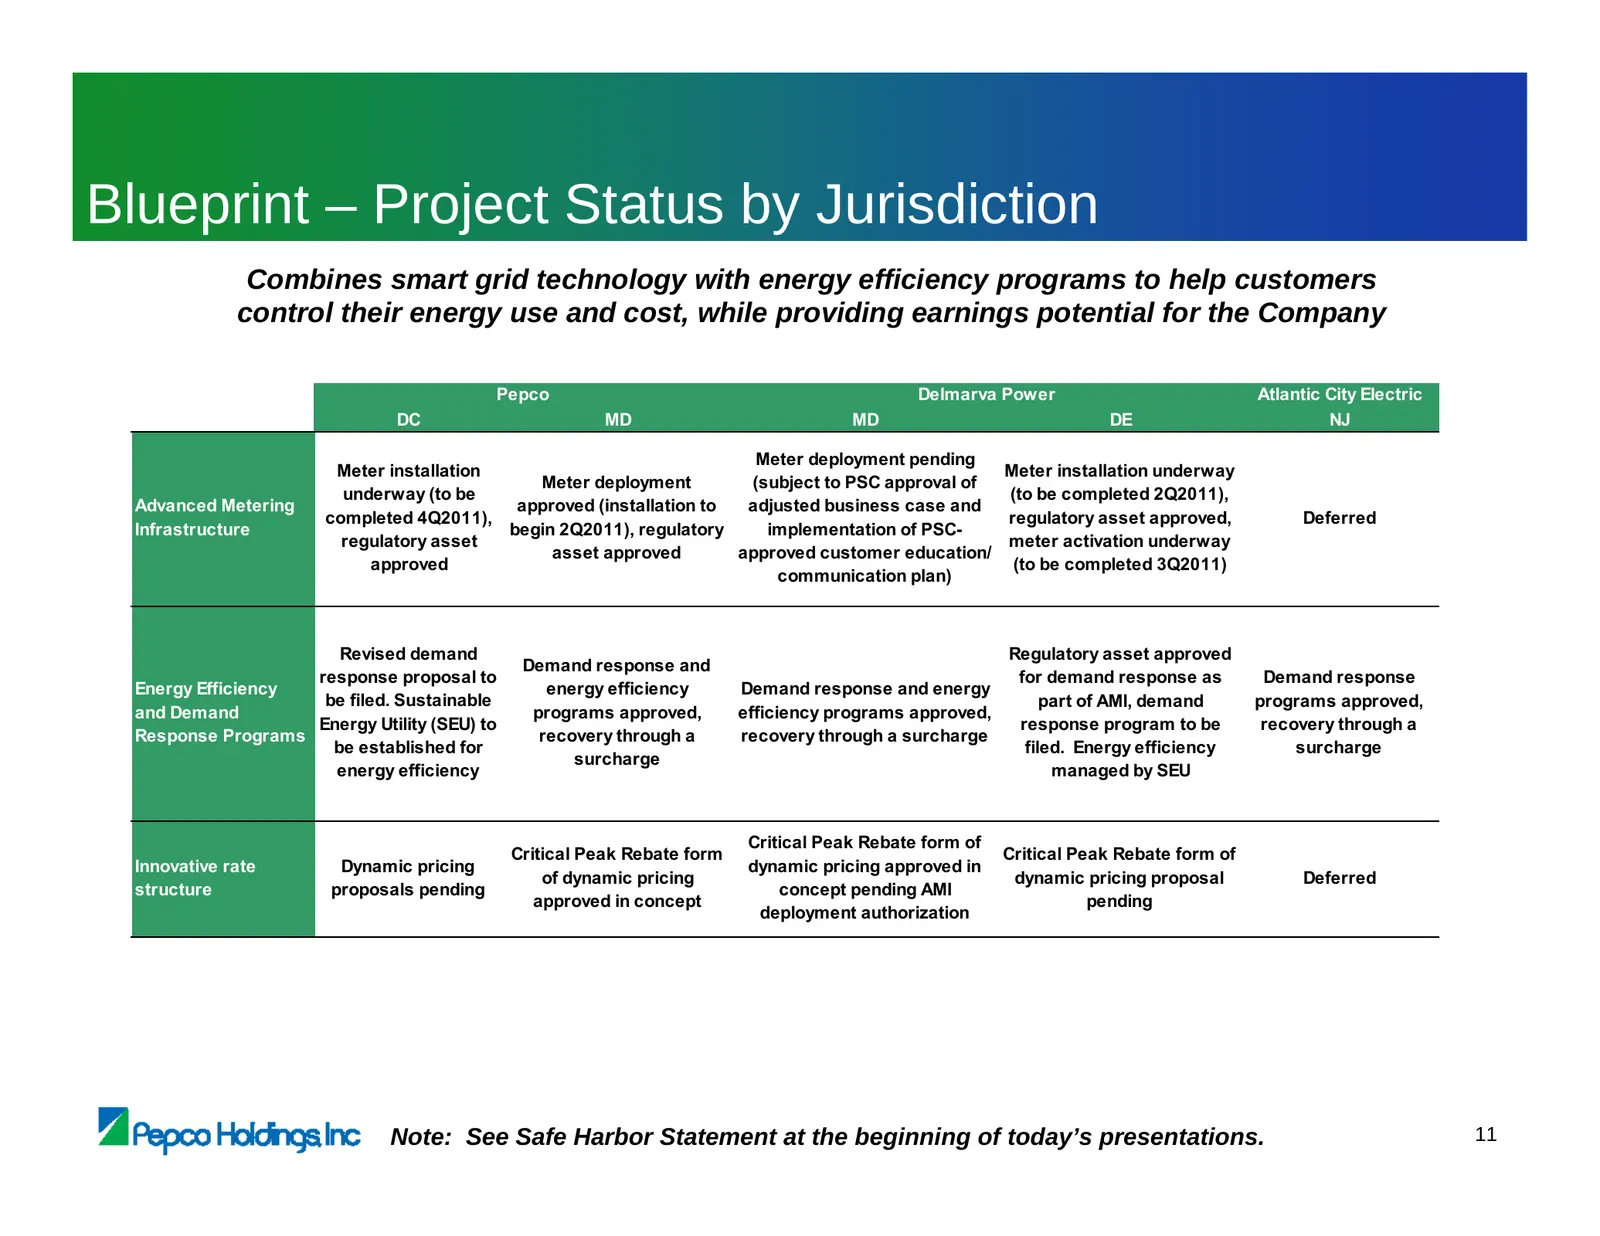
Blueprint – Project Status by Jurisdiction Combines smart grid technology with energy efficiency programs to help customers control their energy use and cost, while providing earnings potential for the Company Pepco Delmarva Power Atlantic City Electric DC MD MD DE NJ Meter deployment pending Meter
Slide 61: Decoupling Status
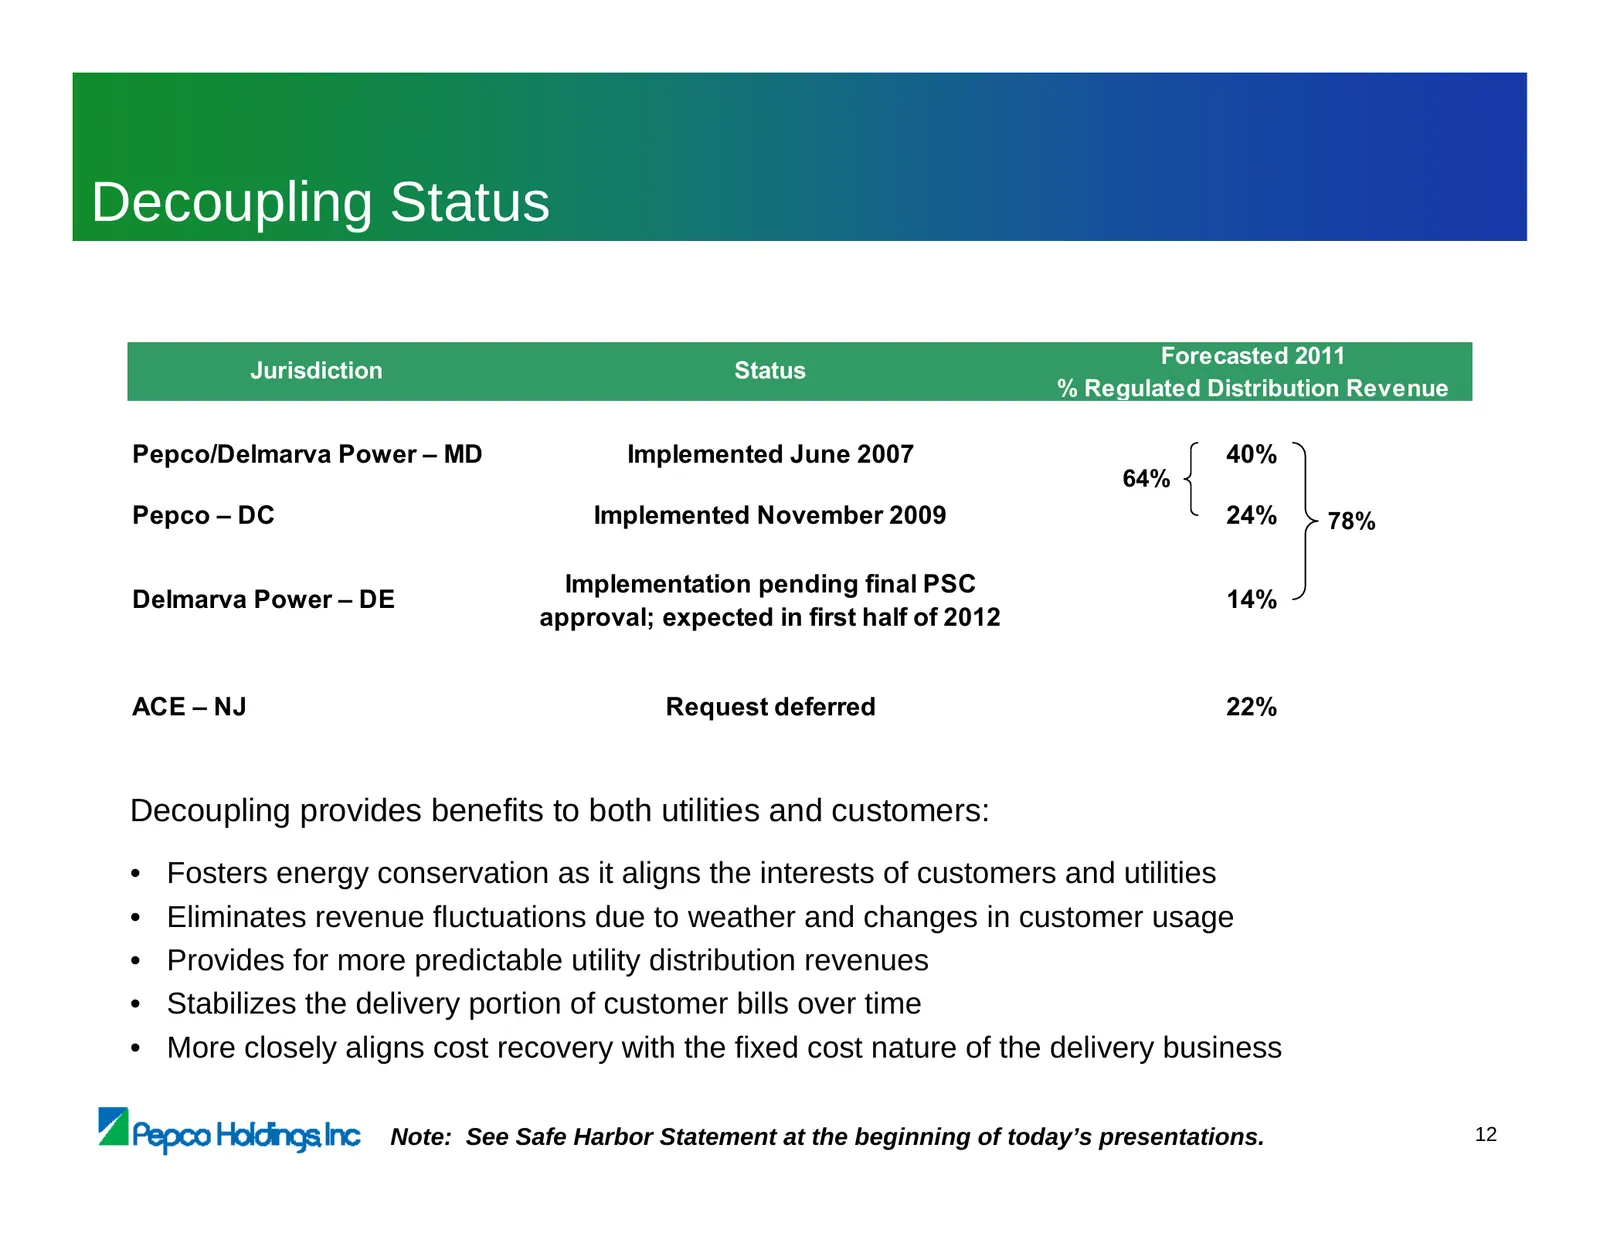
Decoupling Status Forecasted 2011 Jurisdiction Status % Regulated Distribution Revenue Pepco/Delmarva Power – MD Implemented June 2007 40% 64% Pepco – DC Implemented November 2009 24% 78% Implementation pending final PSC Delmarva Power – DE 14% approval; expected in first half of 2012 ACE – NJ Reque
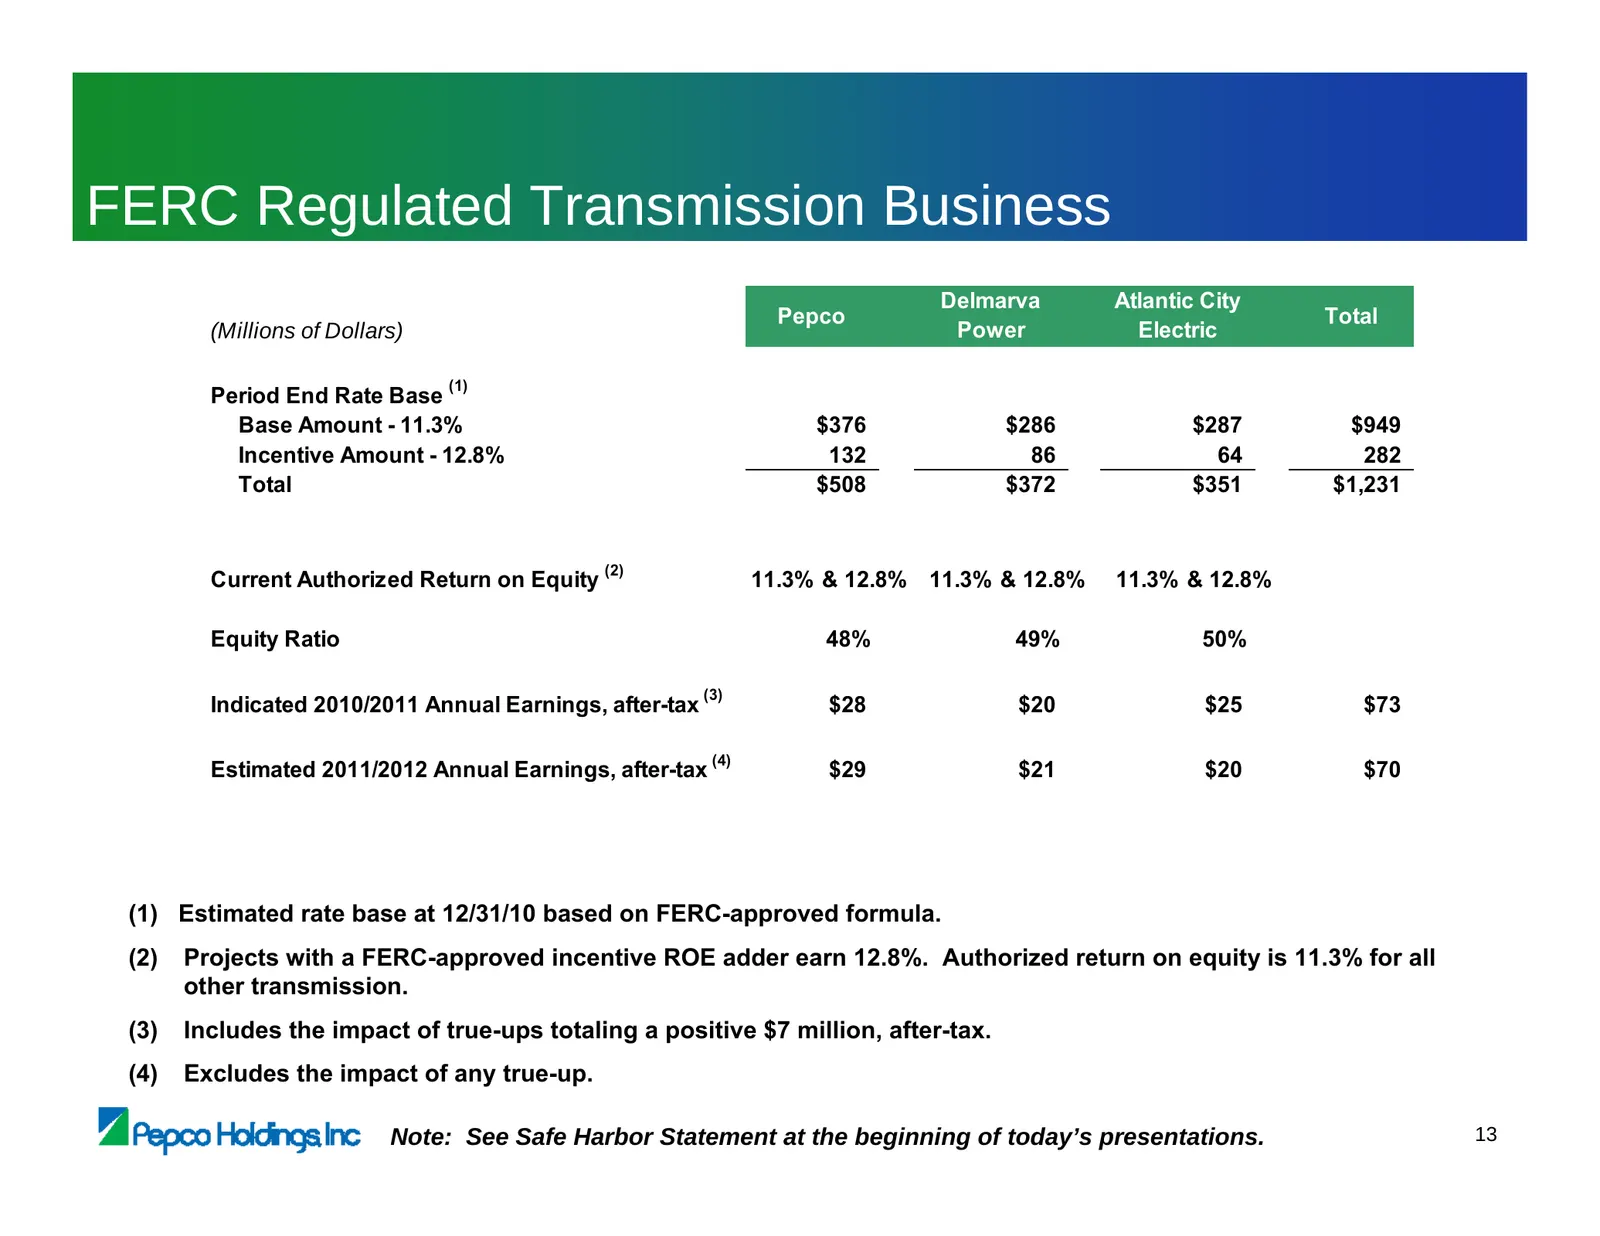
Slide 62: FERC Regulated Transmission Business
FERC Regulated Transmission Business Delmarva Atlantic City Pepco Total (Millions of Dollars) Power Electric (1) Period End Rate Base Base Amount - 11.3% $376 $286 $287 $949 Incentive Amount - 12.8% 132 86 64 282 Total $508 $372 $351 $1,231 (2) Current Authorized Return on Equity 11.3% & 12.8% 11.3%
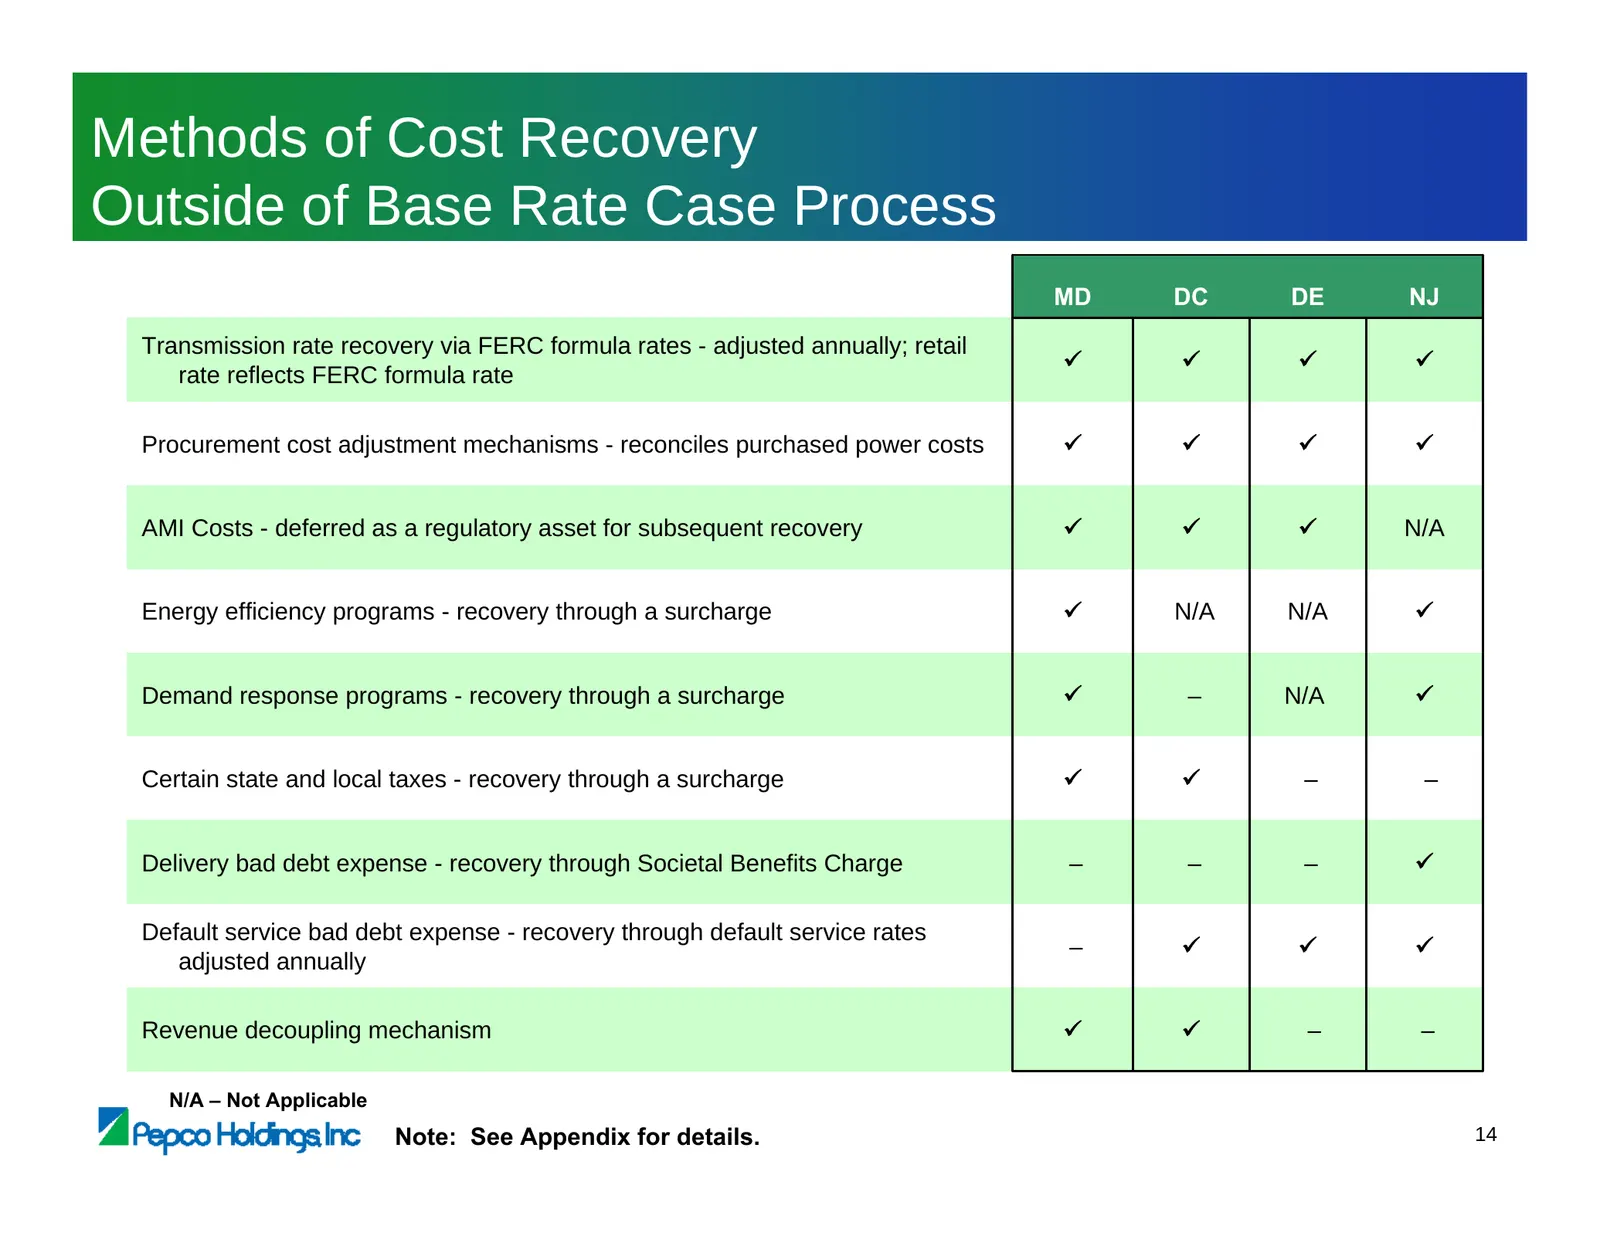
Slide 63: Methods of Cost Recovery Outside of Base Rate Case Process
Methods of Cost Recovery Outside of Base Rate Case Process MD DC DE NJ Transmission rate recovery via FERC formula rates - adjusted annually; retail 9 9 9 9 rate reflects FERC formula rate Procurement cost adjustment mechanisms - reconciles purchased power costs 9 9 9 9 AMI Costs - deferred as a reg
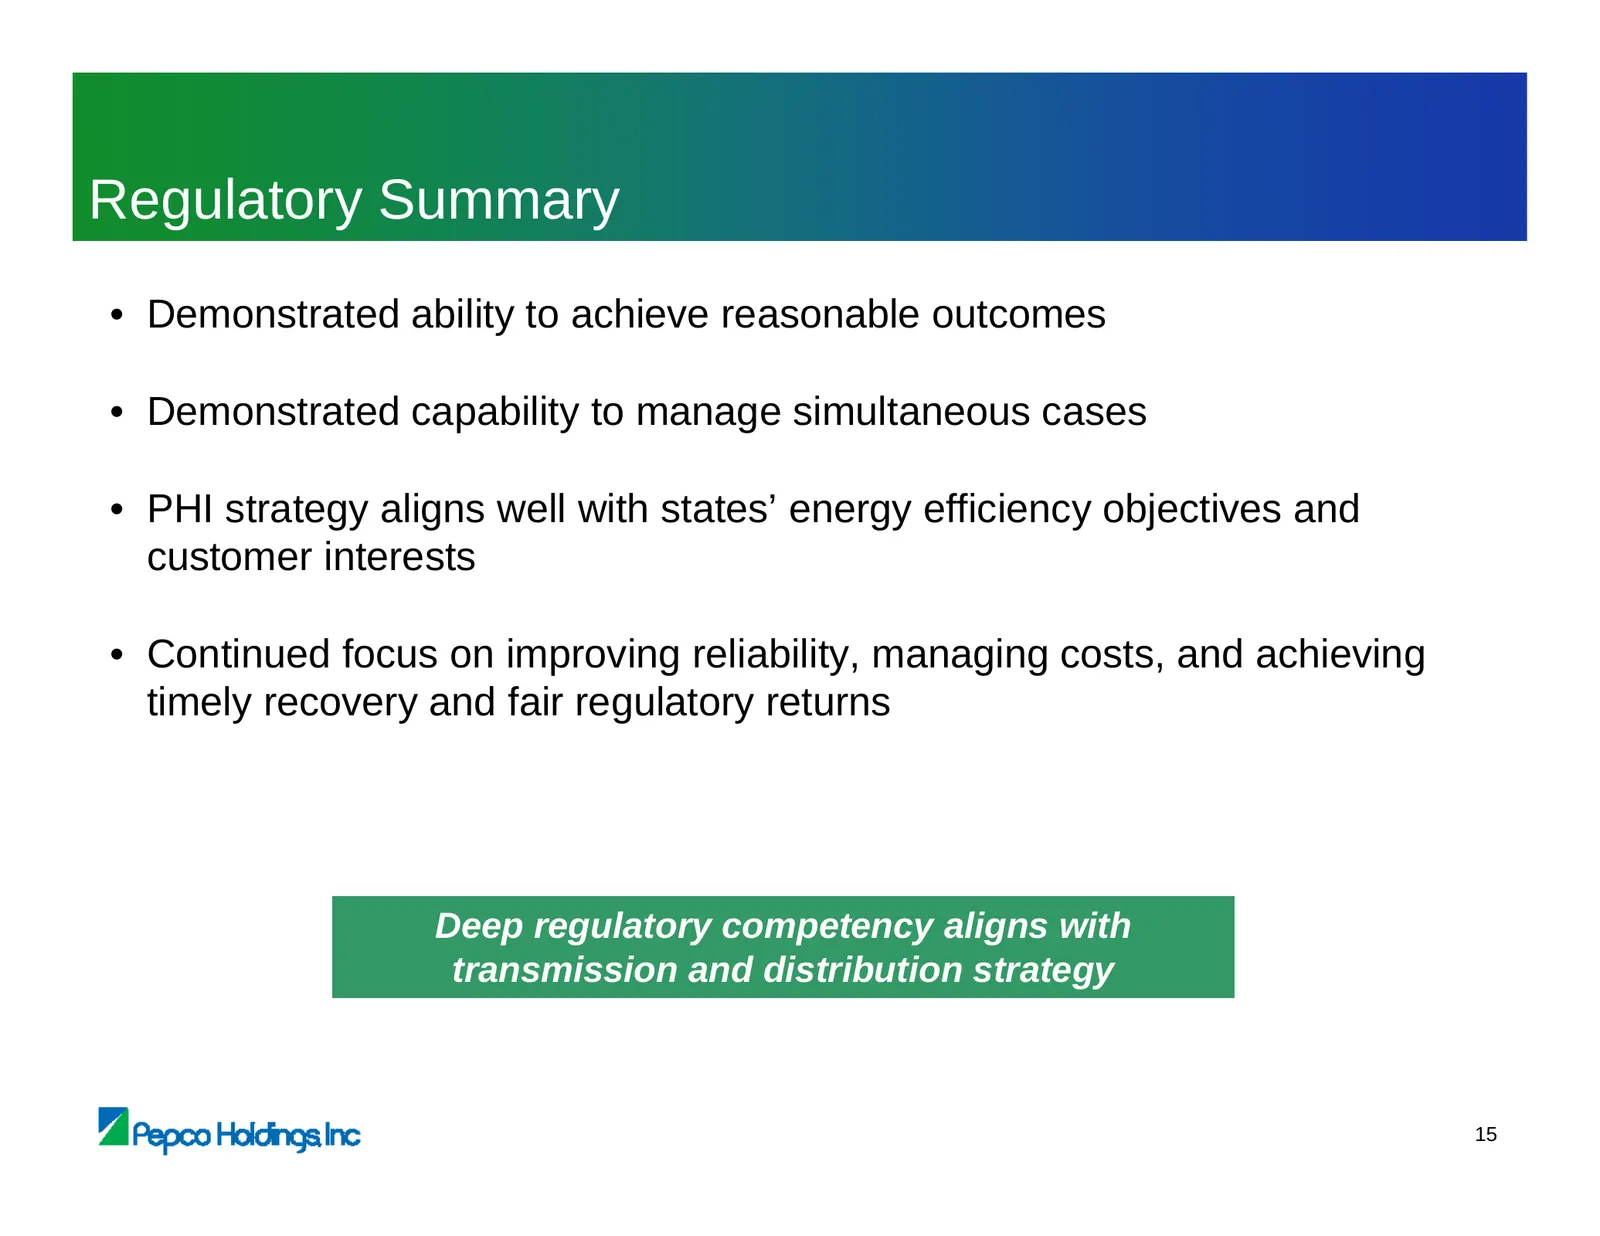
Slide 64: Regulatory Summary
Regulatory Summary • Demonstrated ability to achieve reasonable outcomes • Demonstrated capability to manage simultaneous cases • PHI strategy aligns well with states’ energy efficiency objectives and customer interests • Continued focus on improving reliability, managing costs, and achieving timely
Slide 65: Regulatory Overview
Regulatory Overview Tony Kamerick Senior Vice President & Chief Financial Officer
Slide 66: Appendix
Appendix VA Pepco Holdings inc
Slide 67: Distribution Rate Cases – Most Recent Decisions
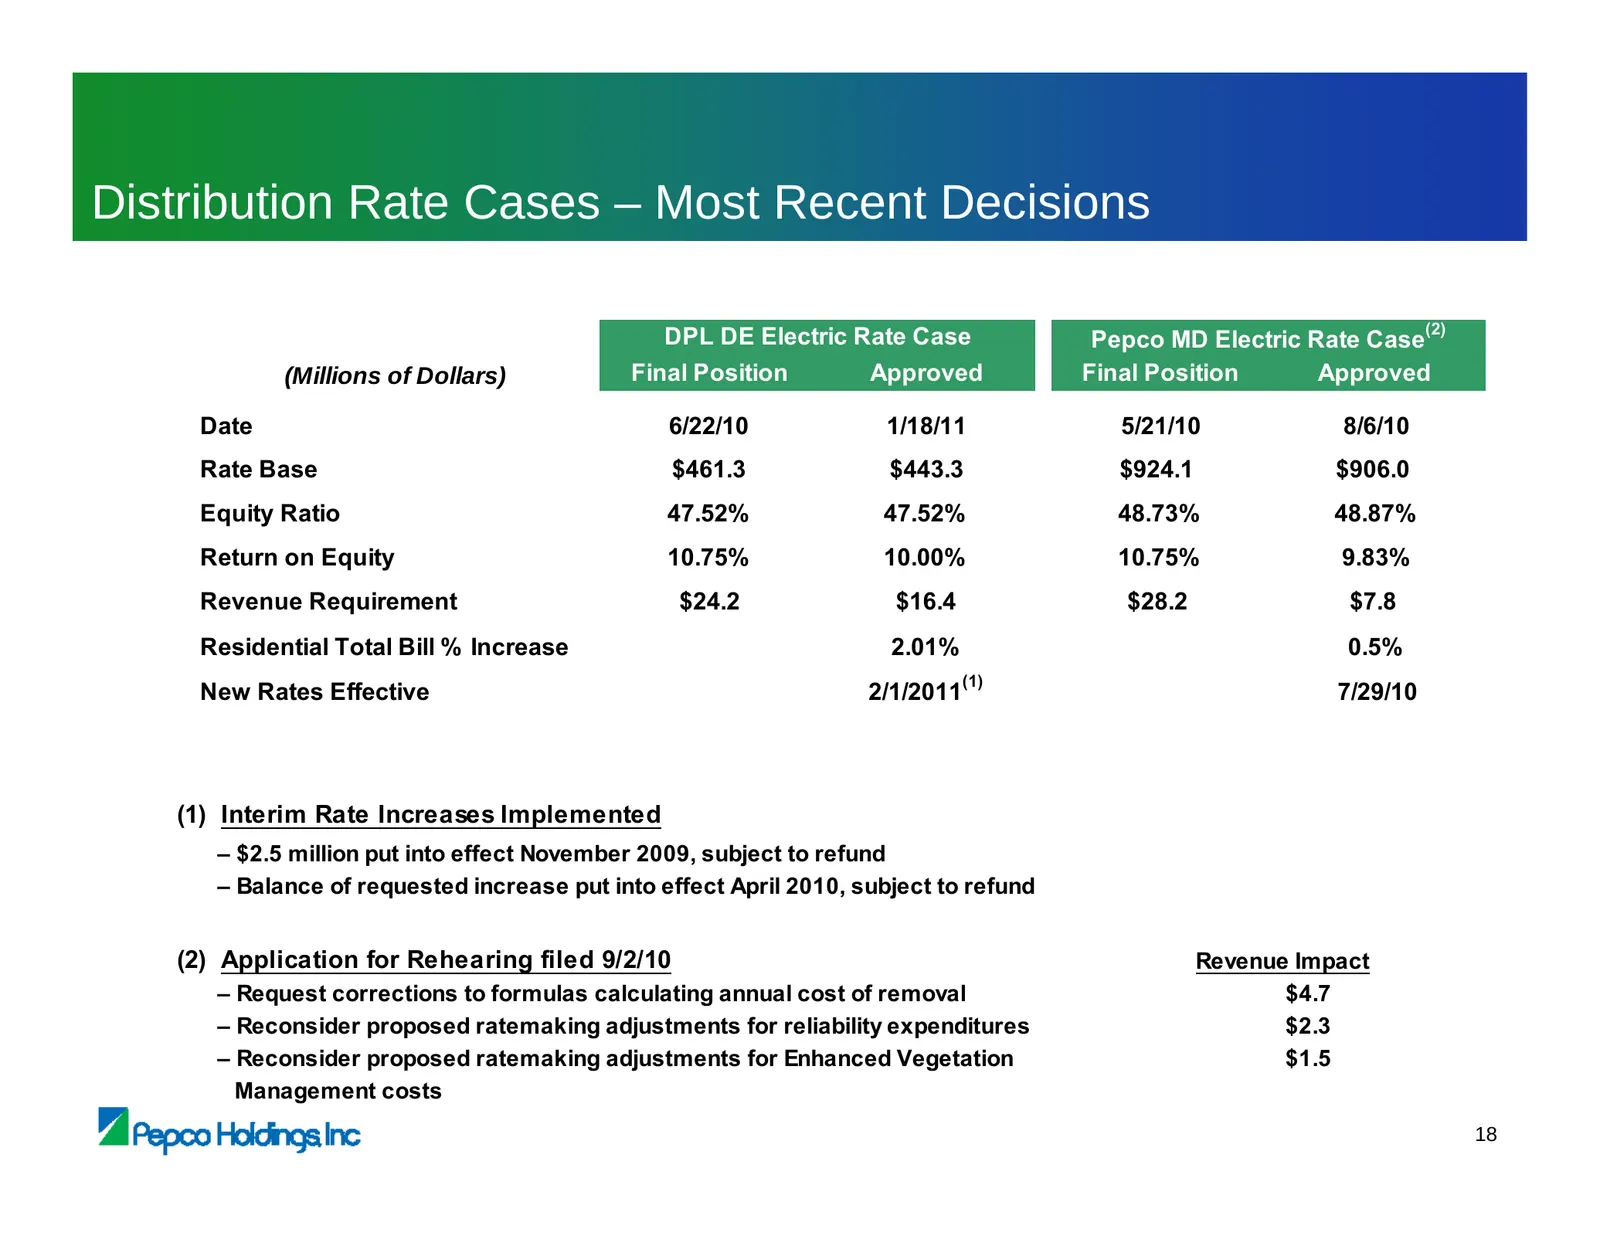
Distribution Rate Cases – Most Recent Decisions (2) DPL DE Electric Rate Case Pepco MD Electric Rate Case (Millions of Dollars) Final Position Approved Final Position Approved Date 6/22/10 1/18/11 5/21/10 8/6/10 Rate Base $461.3 $443.3 $924.1 $906.0 Equity Ratio 47.52% 47.52% 48.73% 48.87% Return on
Slide 68: Distribution Rate Cases – Most Recent Decisions (continued)
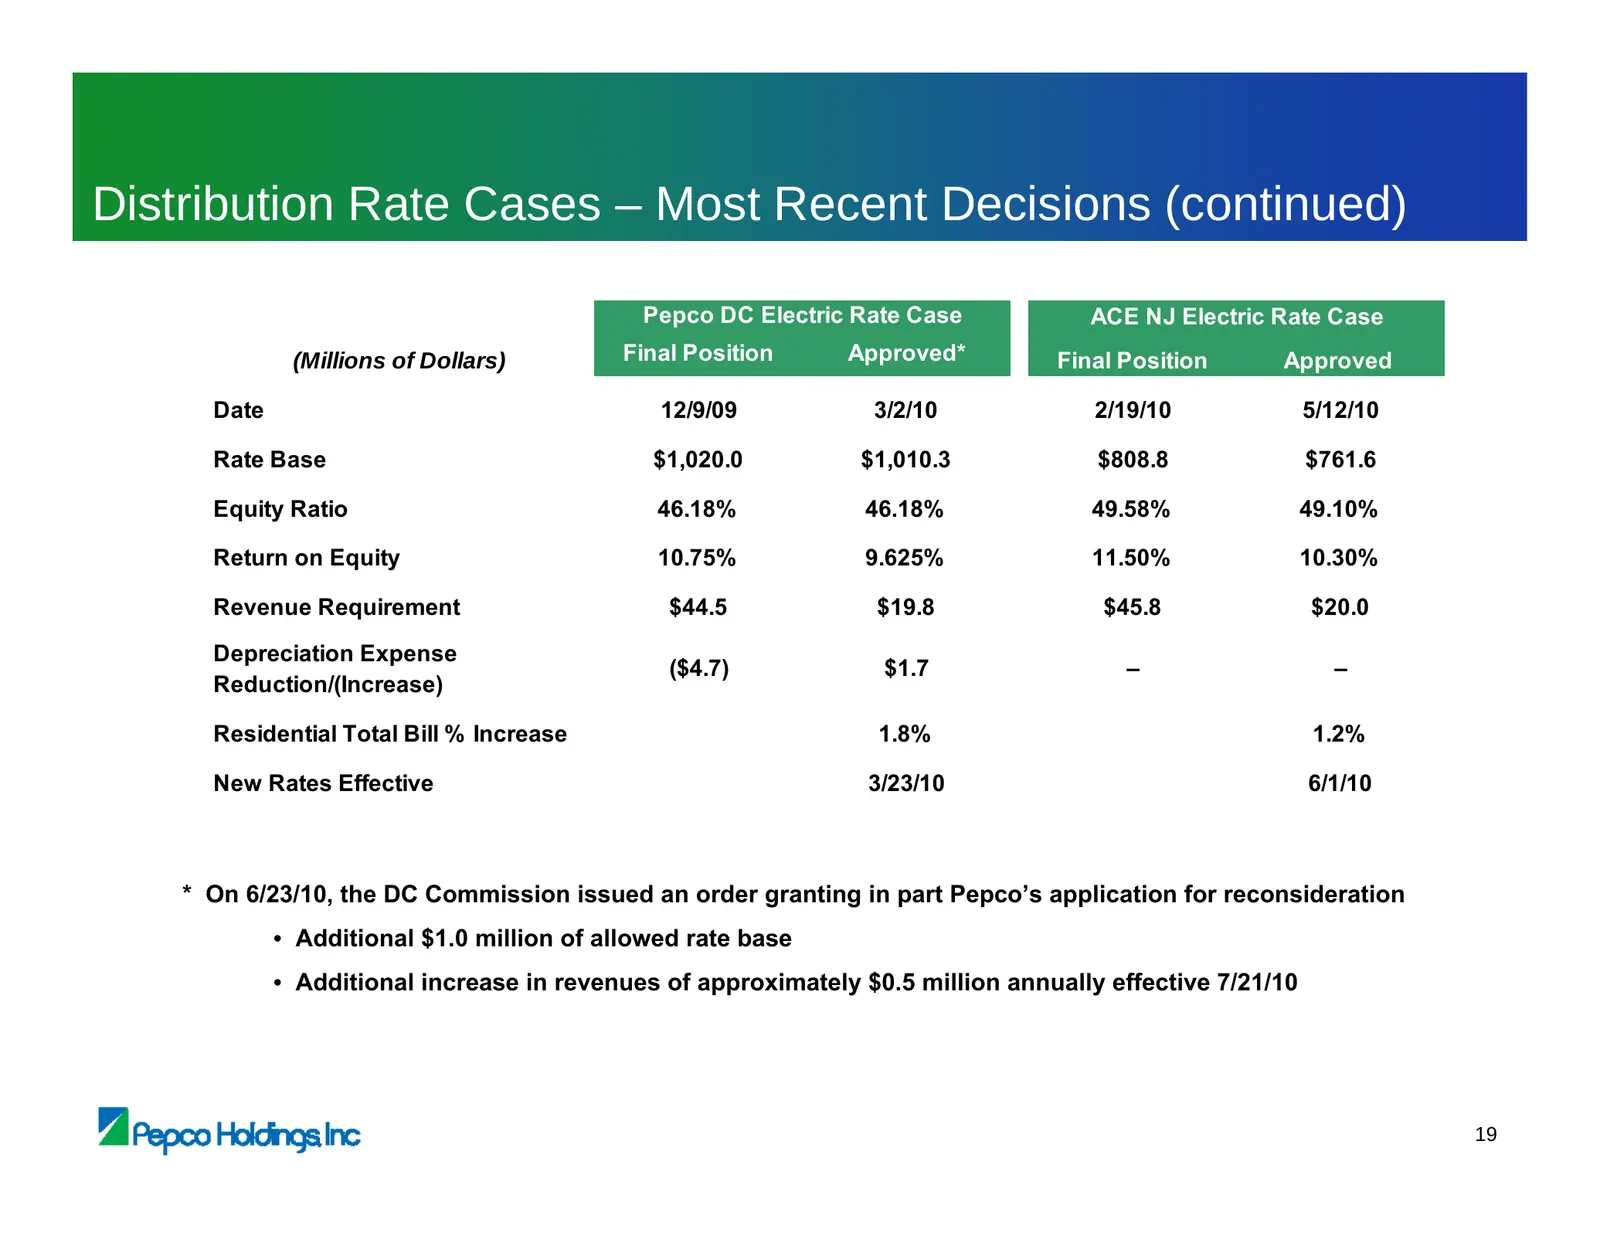
Distribution Rate Cases – Most Recent Decisions (continued) Pepco DC Electric Rate Case ACE NJ Electric Rate Case (Millions of Dollars) Final Position Approved* Final Position Approved Date 12/9/09 3/2/10 2/19/10 5/12/10 Rate Base $1,020.0 $1,010.3 $808.8 $761.6 Equity Ratio 46.18% 46.18% 49.58% 49.
Slide 69: Demonstrated Constructive Regulatory Outcomes
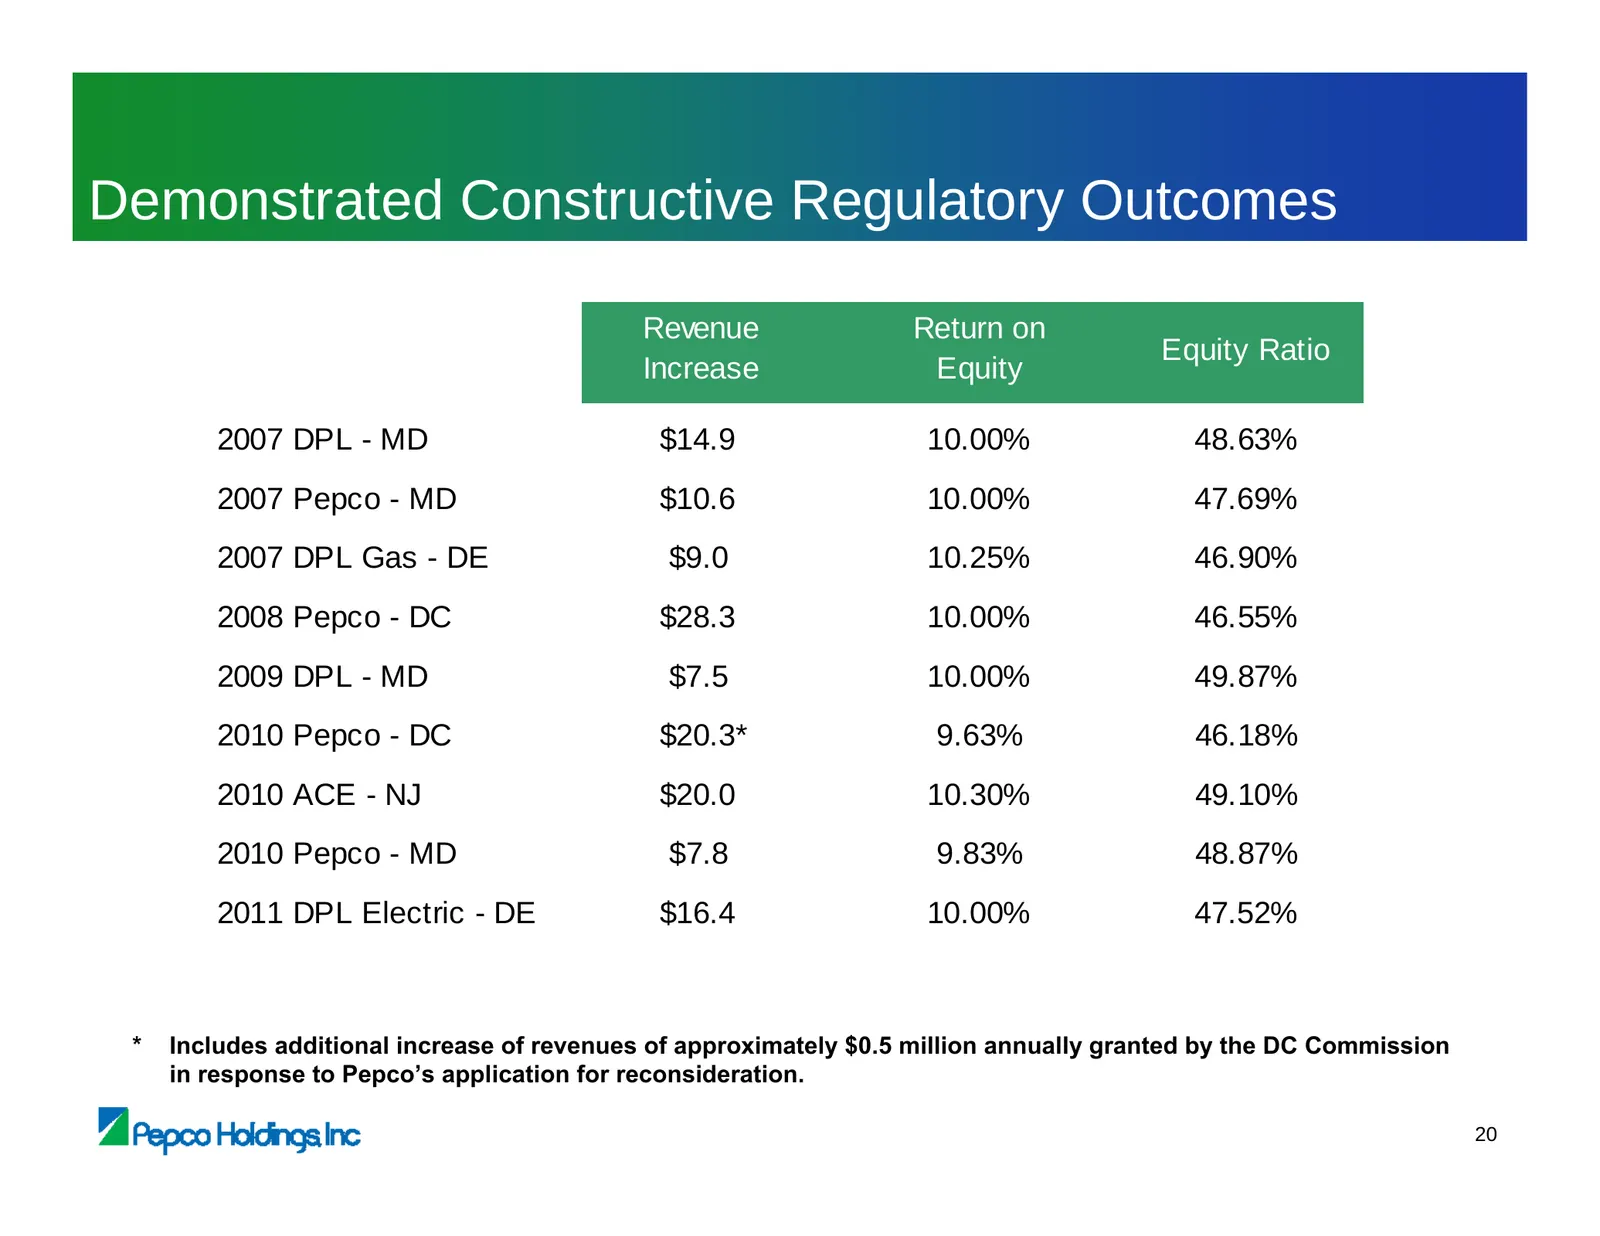
Demonstrated Constructive Regulatory Outcomes Revenue Return on Equity Ratio Increase Equity 2007 DPL - MD $14.9 10.00% 48.63% 2007 Pepco - MD $10.6 10.00% 47.69% 2007 DPL Gas - DE $9.0 10.25% 46.90% 2008 Pepco - DC $28.3 10.00% 46.55% 2009 DPL - MD $7.5 10.00% 49.87% 2010 Pepco - DC $20.3* 9.63% 46
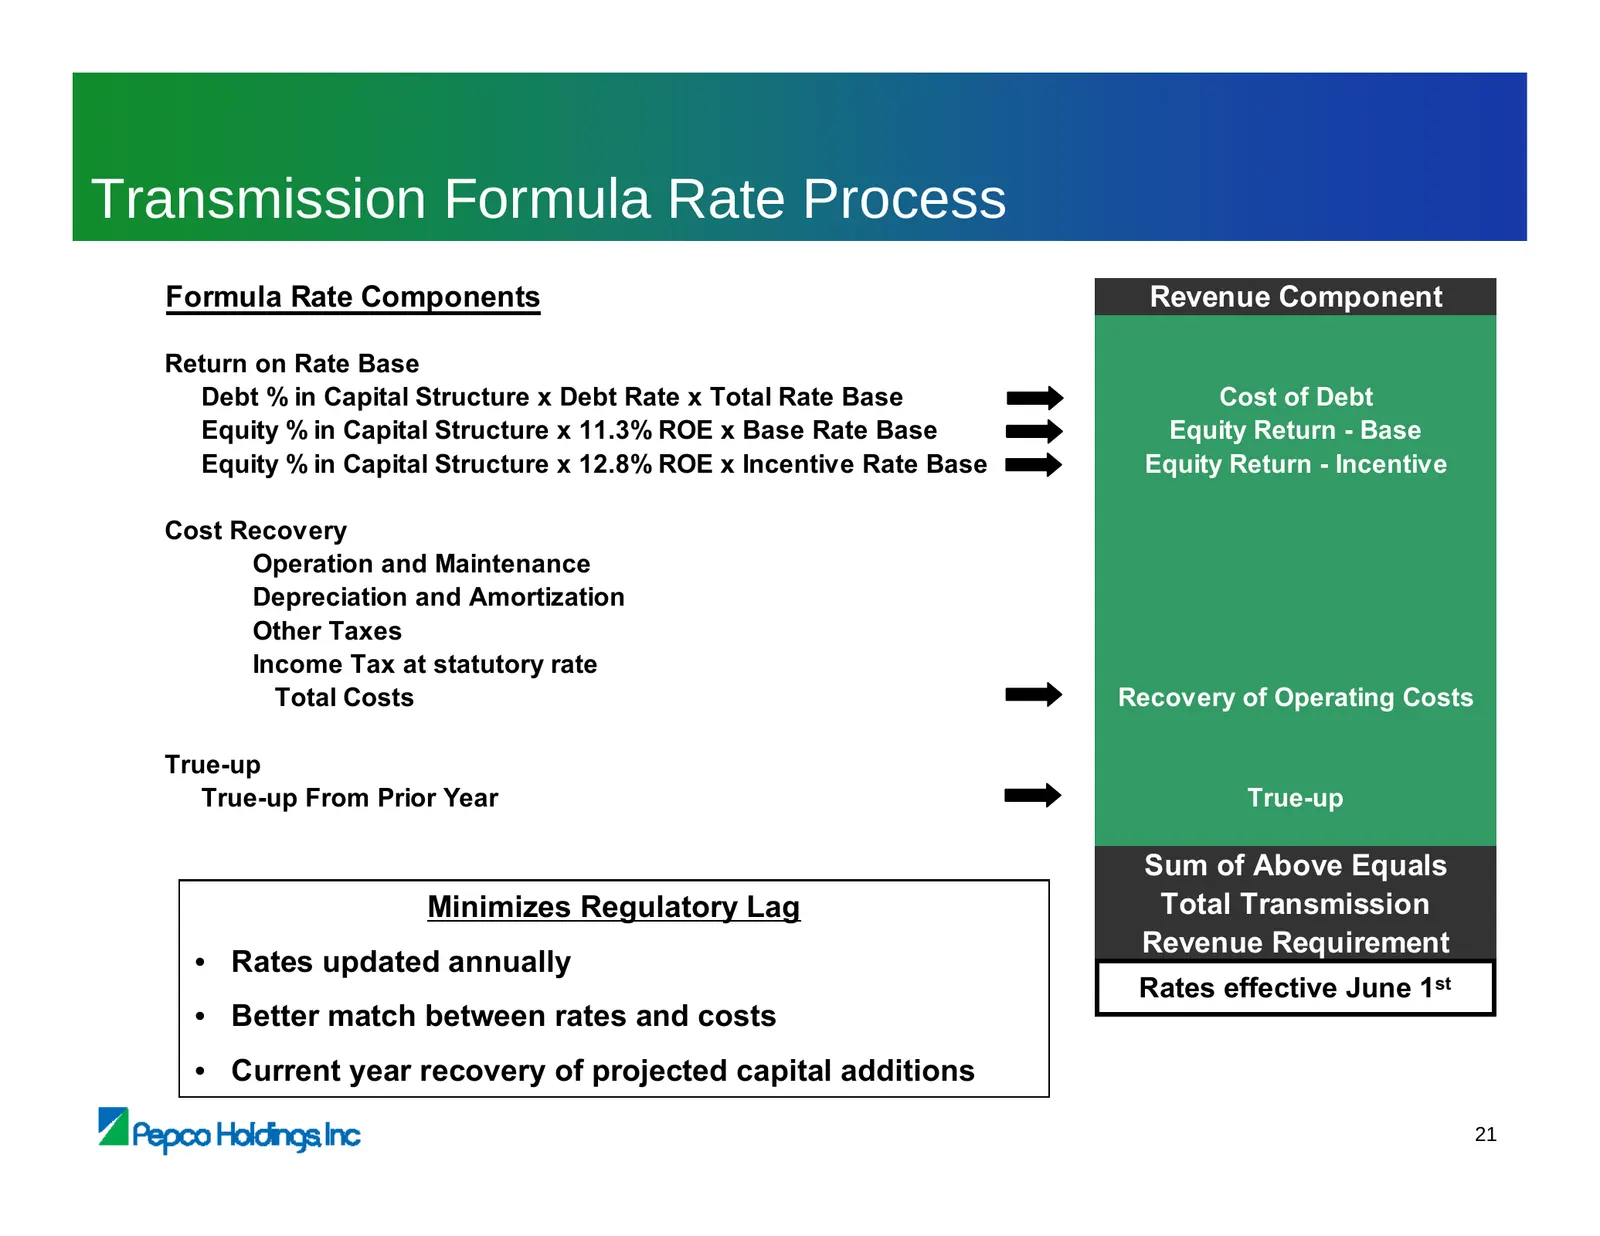
Slide 70: Transmission Formula Rate Process
Transmission Formula Rate Process Formula Rate Components Revenue Component Return on Rate Base Debt % in Capital Structure x Debt Rate x Total Rate Base Cost of Debt Equity % in Capital Structure x 11.3% ROE x Base Rate Base Equity Return - Base Equity % in Capital Structure x 12.8% ROE x Incentive
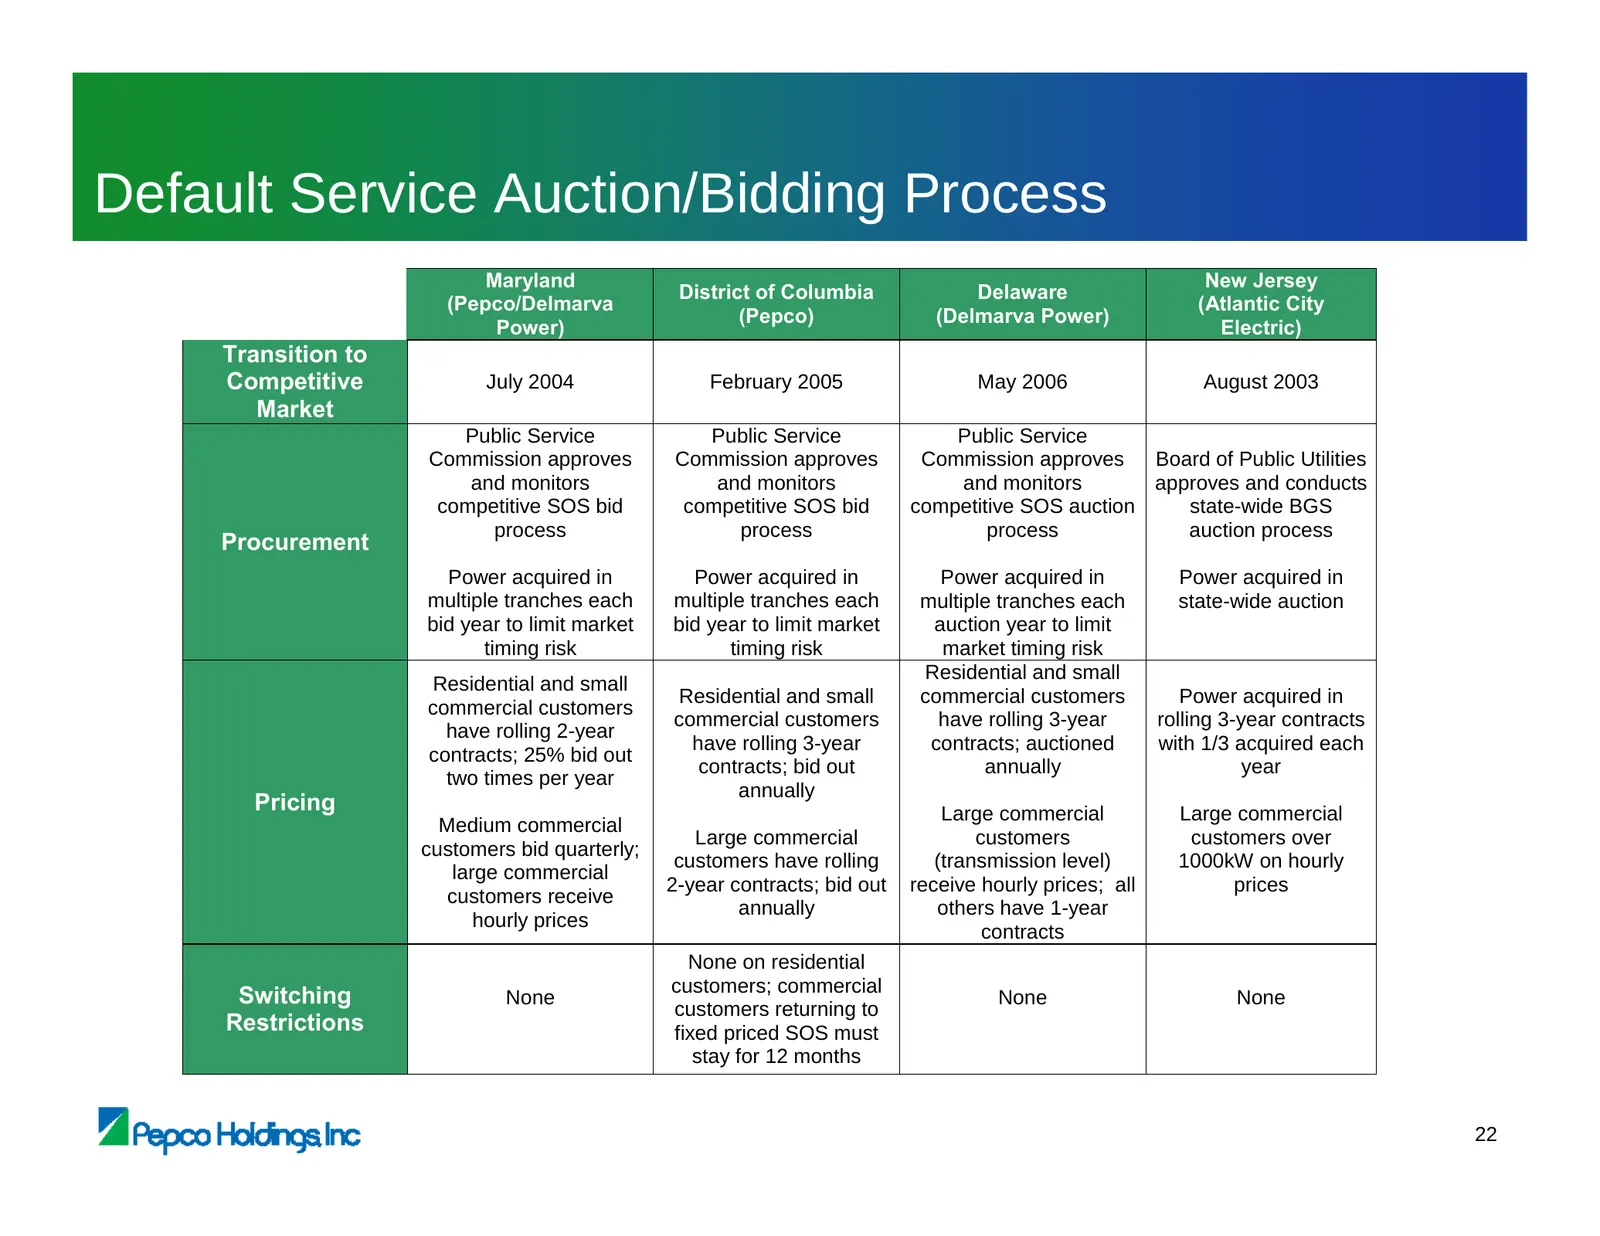
Slide 71: Default Service Auction/Bidding Process
Default Service Auction/Bidding Process Maryland New Jersey District of Columbia Delaware (Pepco/Delmarva (Atlantic City (Pepco) (Delmarva Power) Power) Electric) Transition to Competitive July 2004 February 2005 May 2006 August 2003 Market Public Service Public Service Public Service Commission app
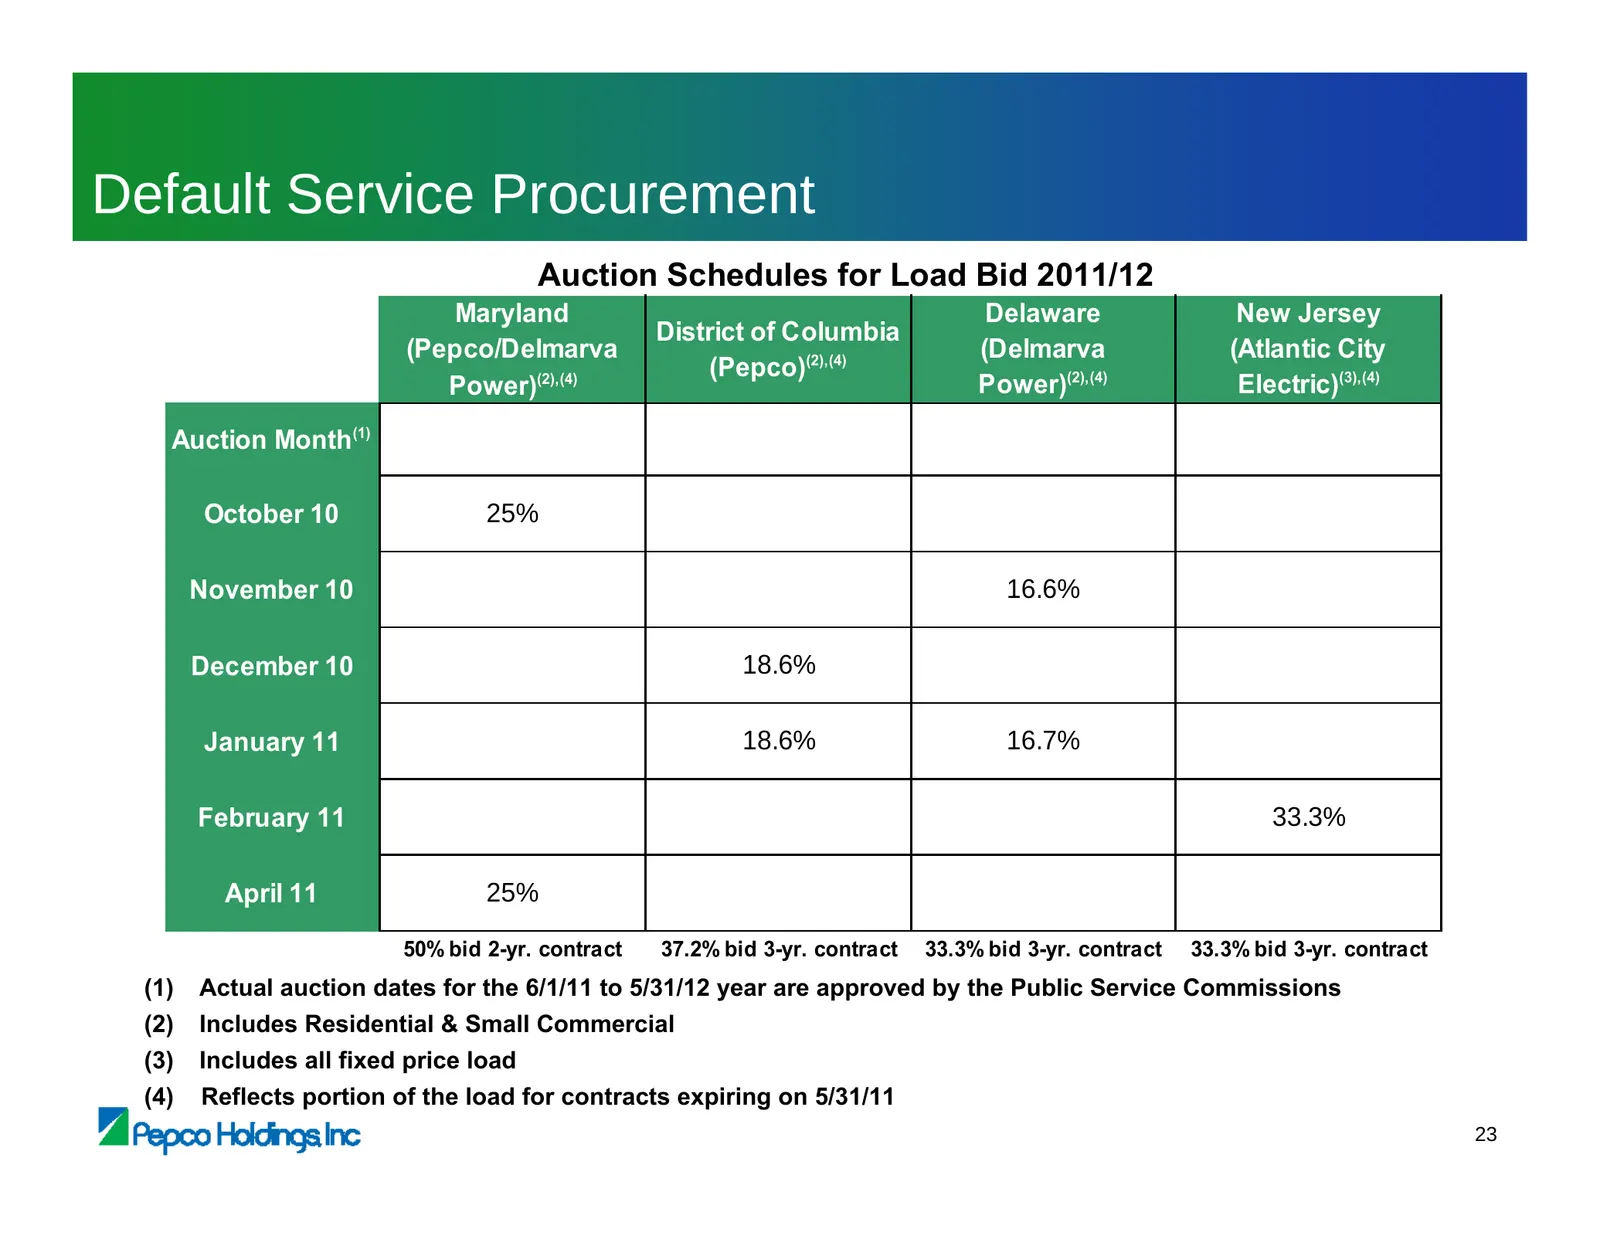
Slide 72: Default Service Procurement
Default Service Procurement Auction Schedules for Load Bid 2011/12 Maryland Delaware New Jersey District of Columbia (Pepco/Delmarva (Delmarva (Atlantic City (Pepco)(2),(4) Power)(2),(4) Power)(2),(4) Electric)(3),(4) Auction Month(1) October 10 25% November 10 16.6% December 10 18.6% January 11 18.
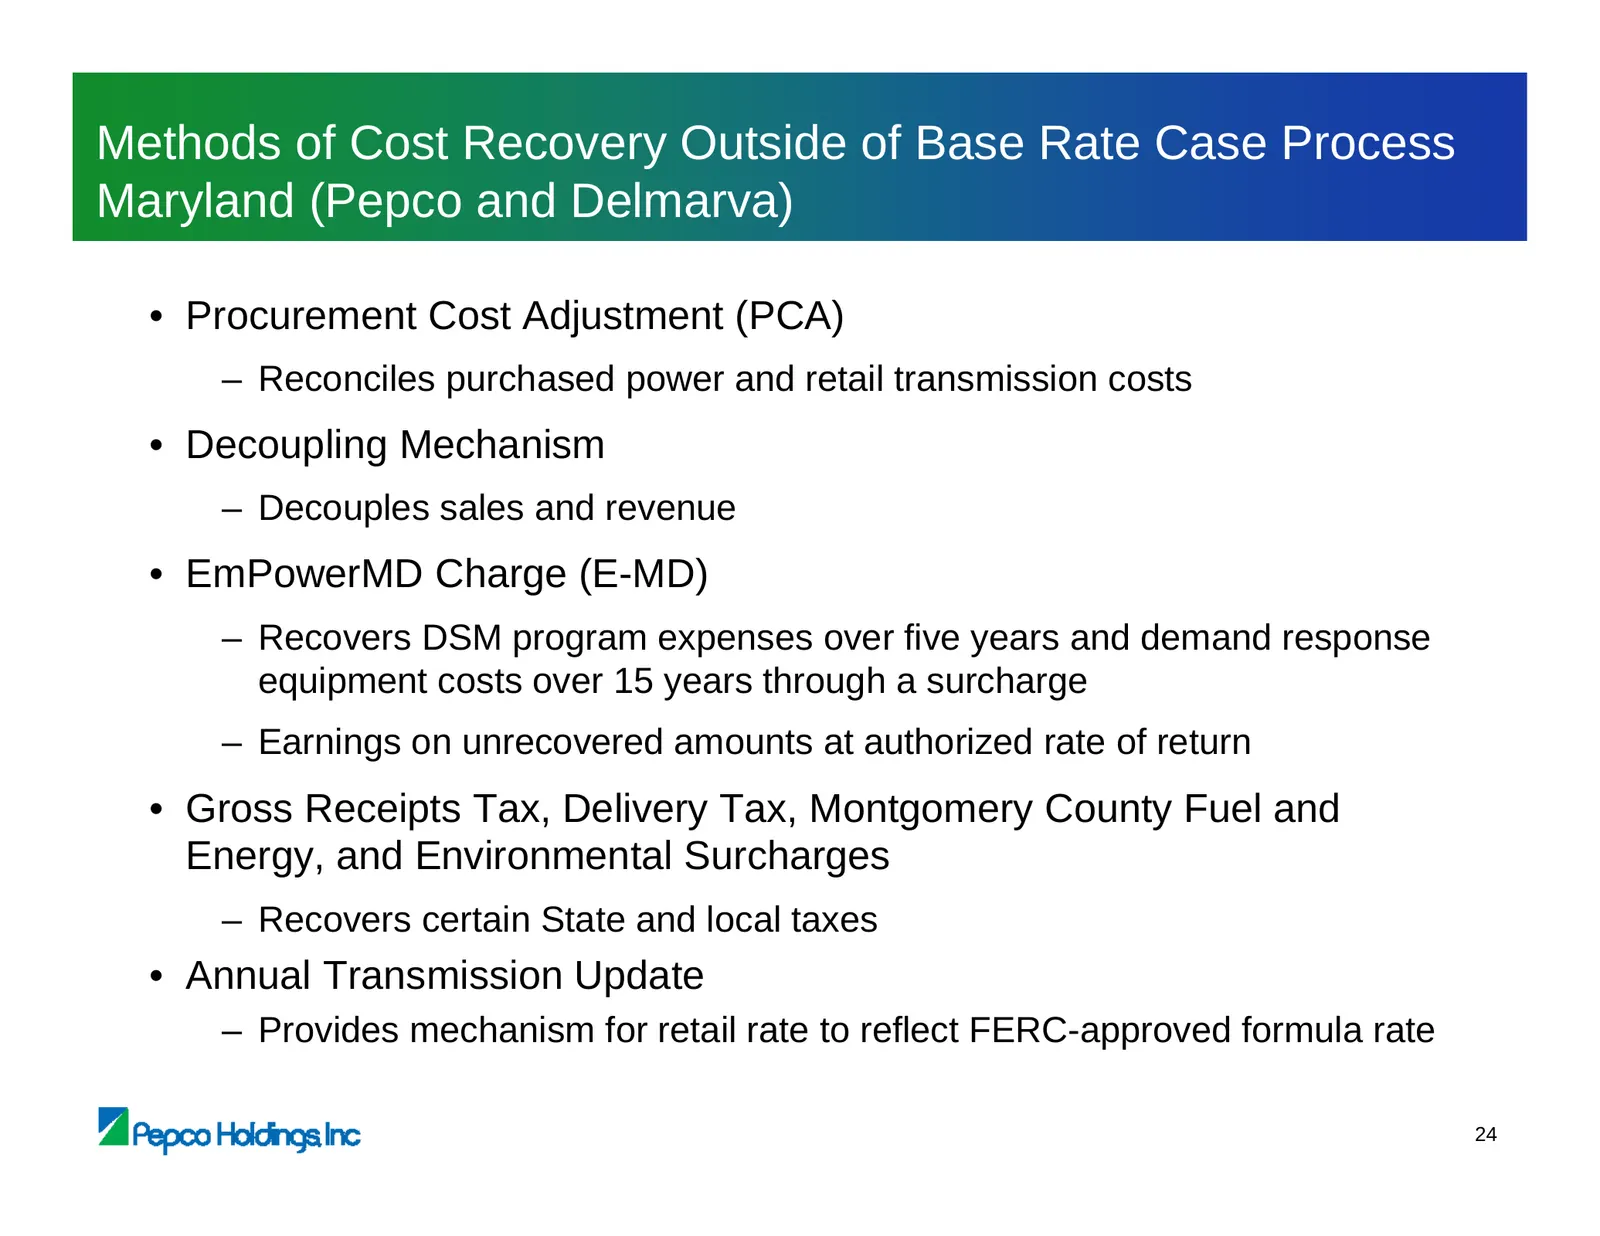
Slide 73: Methods of Cost Recovery Outside of Base Rate Case Process Maryland (Pepco and Delmarva)
Methods of Cost Recovery Outside of Base Rate Case Process Maryland (Pepco and Delmarva) • Procurement Cost Adjustment (PCA) – Reconciles purchased power and retail transmission costs • Decoupling Mechanism – Decouples sales and revenue • EmPowerMD Charge (E-MD) – Recovers DSM program expenses over
Slide 74: Methods of Cost Recovery Outside of Base Rate Case Process District of Columbia
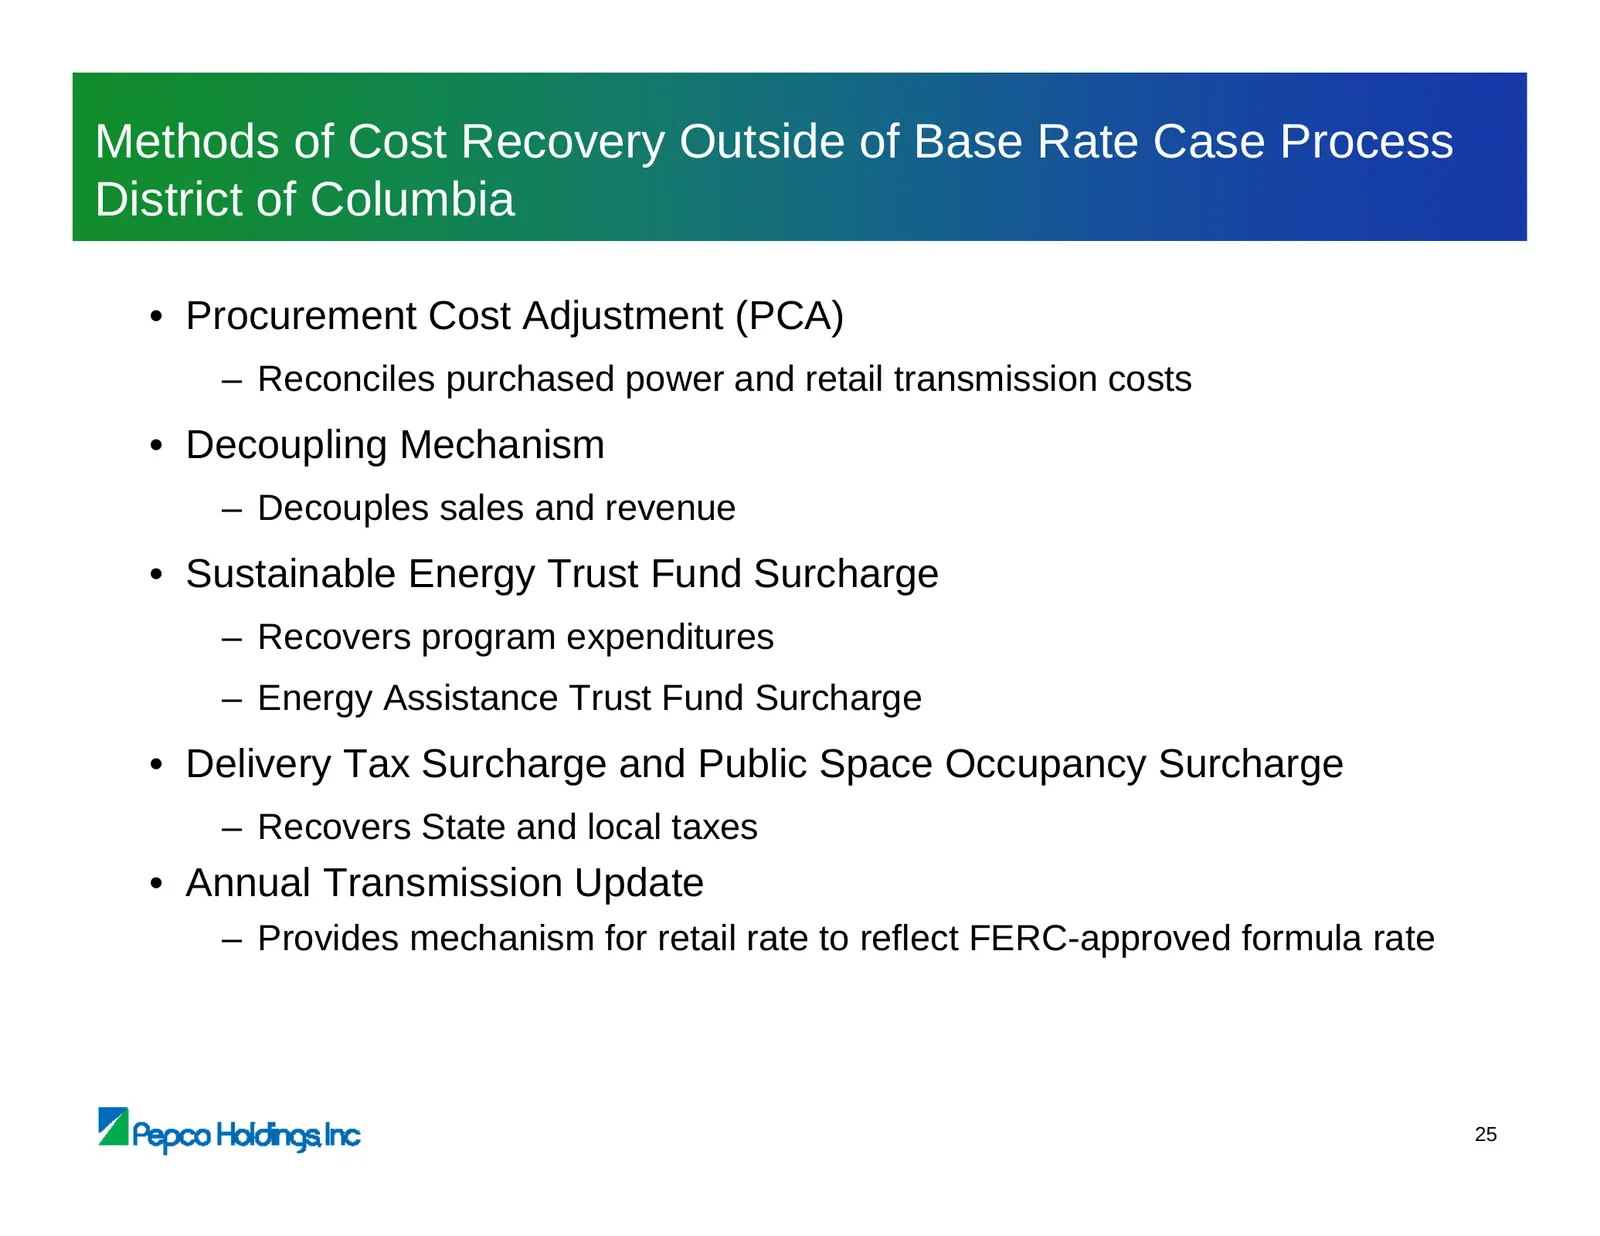
Methods of Cost Recovery Outside of Base Rate Case Process District of Columbia • Procurement Cost Adjustment (PCA) – Reconciles purchased power and retail transmission costs • Decoupling Mechanism – Decouples sales and revenue • Sustainable Energy Trust Fund Surcharge – Recovers program expenditure
Slide 75: Methods of Cost Recovery Outside of Base Rate Case Process Delaware
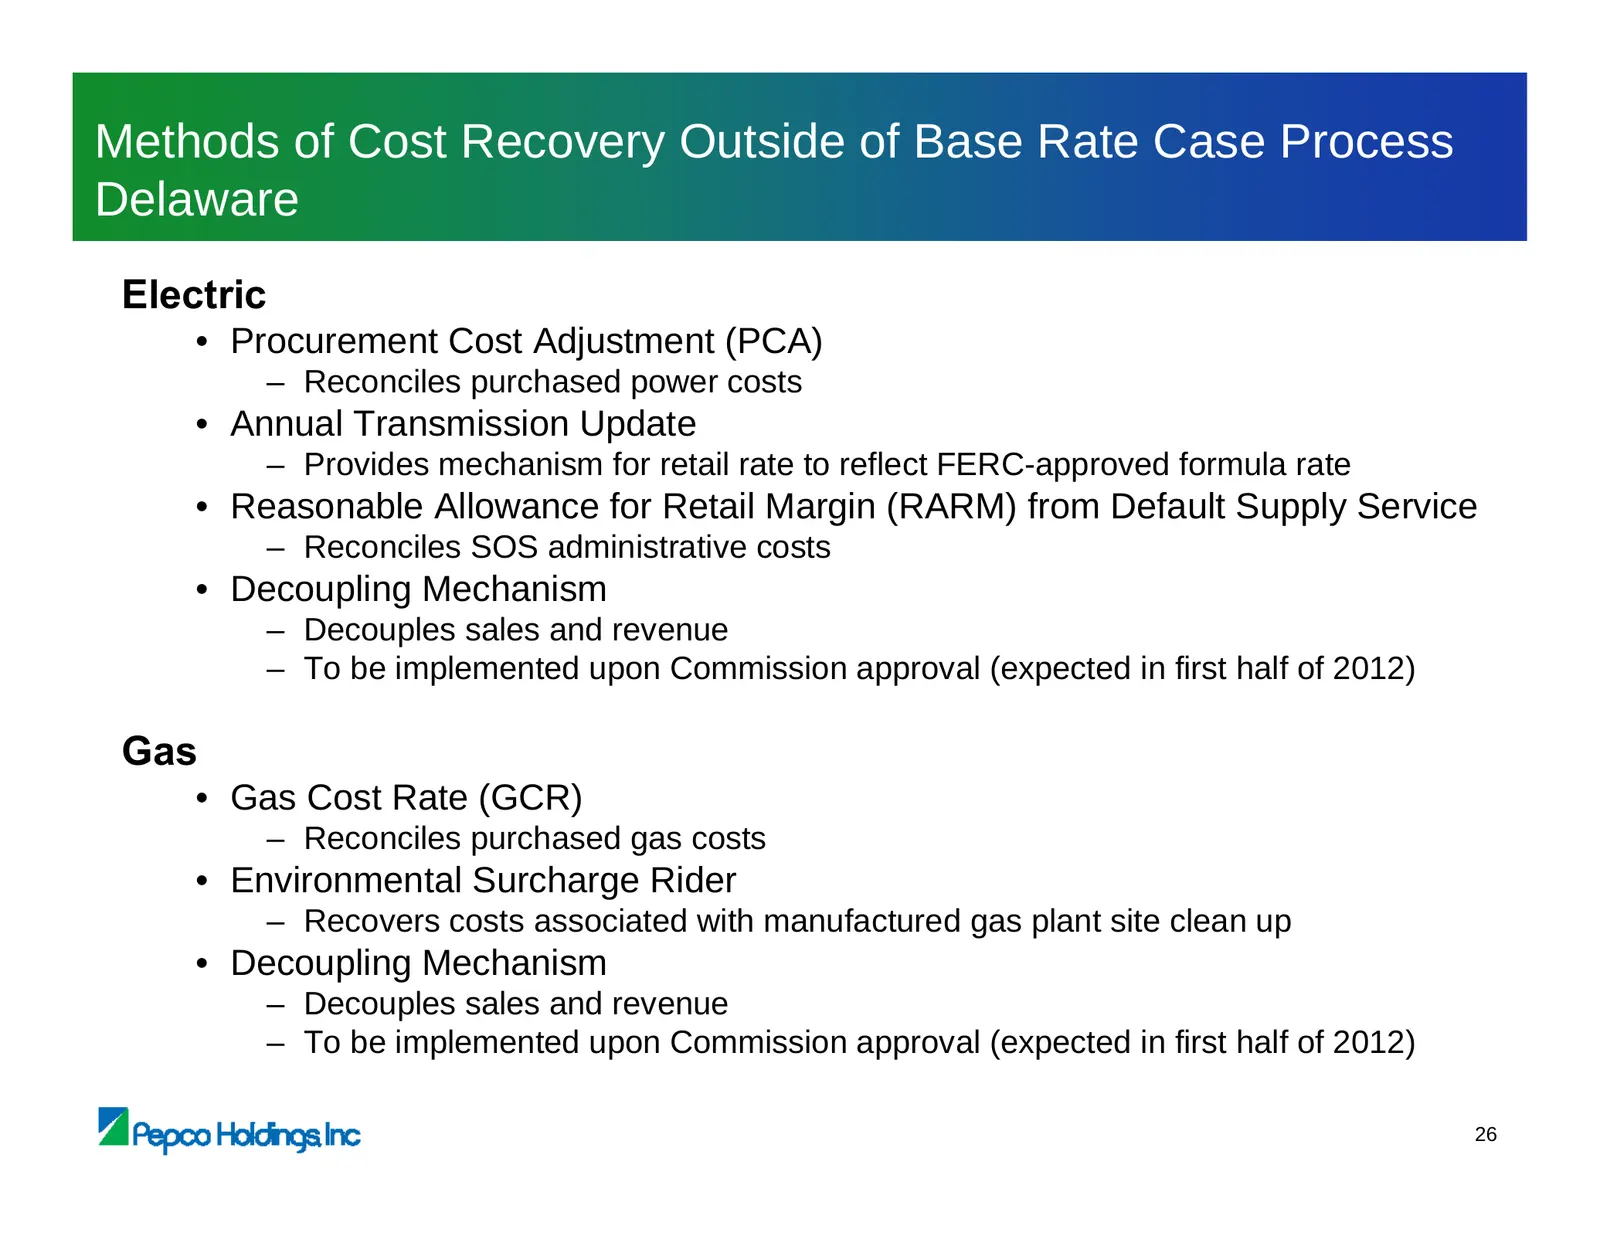
Methods of Cost Recovery Outside of Base Rate Case Process Delaware Electric • Procurement Cost Adjustment (PCA) – Reconciles purchased power costs • Annual Transmission Update – Provides mechanism for retail rate to reflect FERC-approved formula rate • Reasonable Allowance for Retail Margin (RARM)
Slide 76: Methods of Cost Recovery Outside of Base Rate Case Process New Jersey
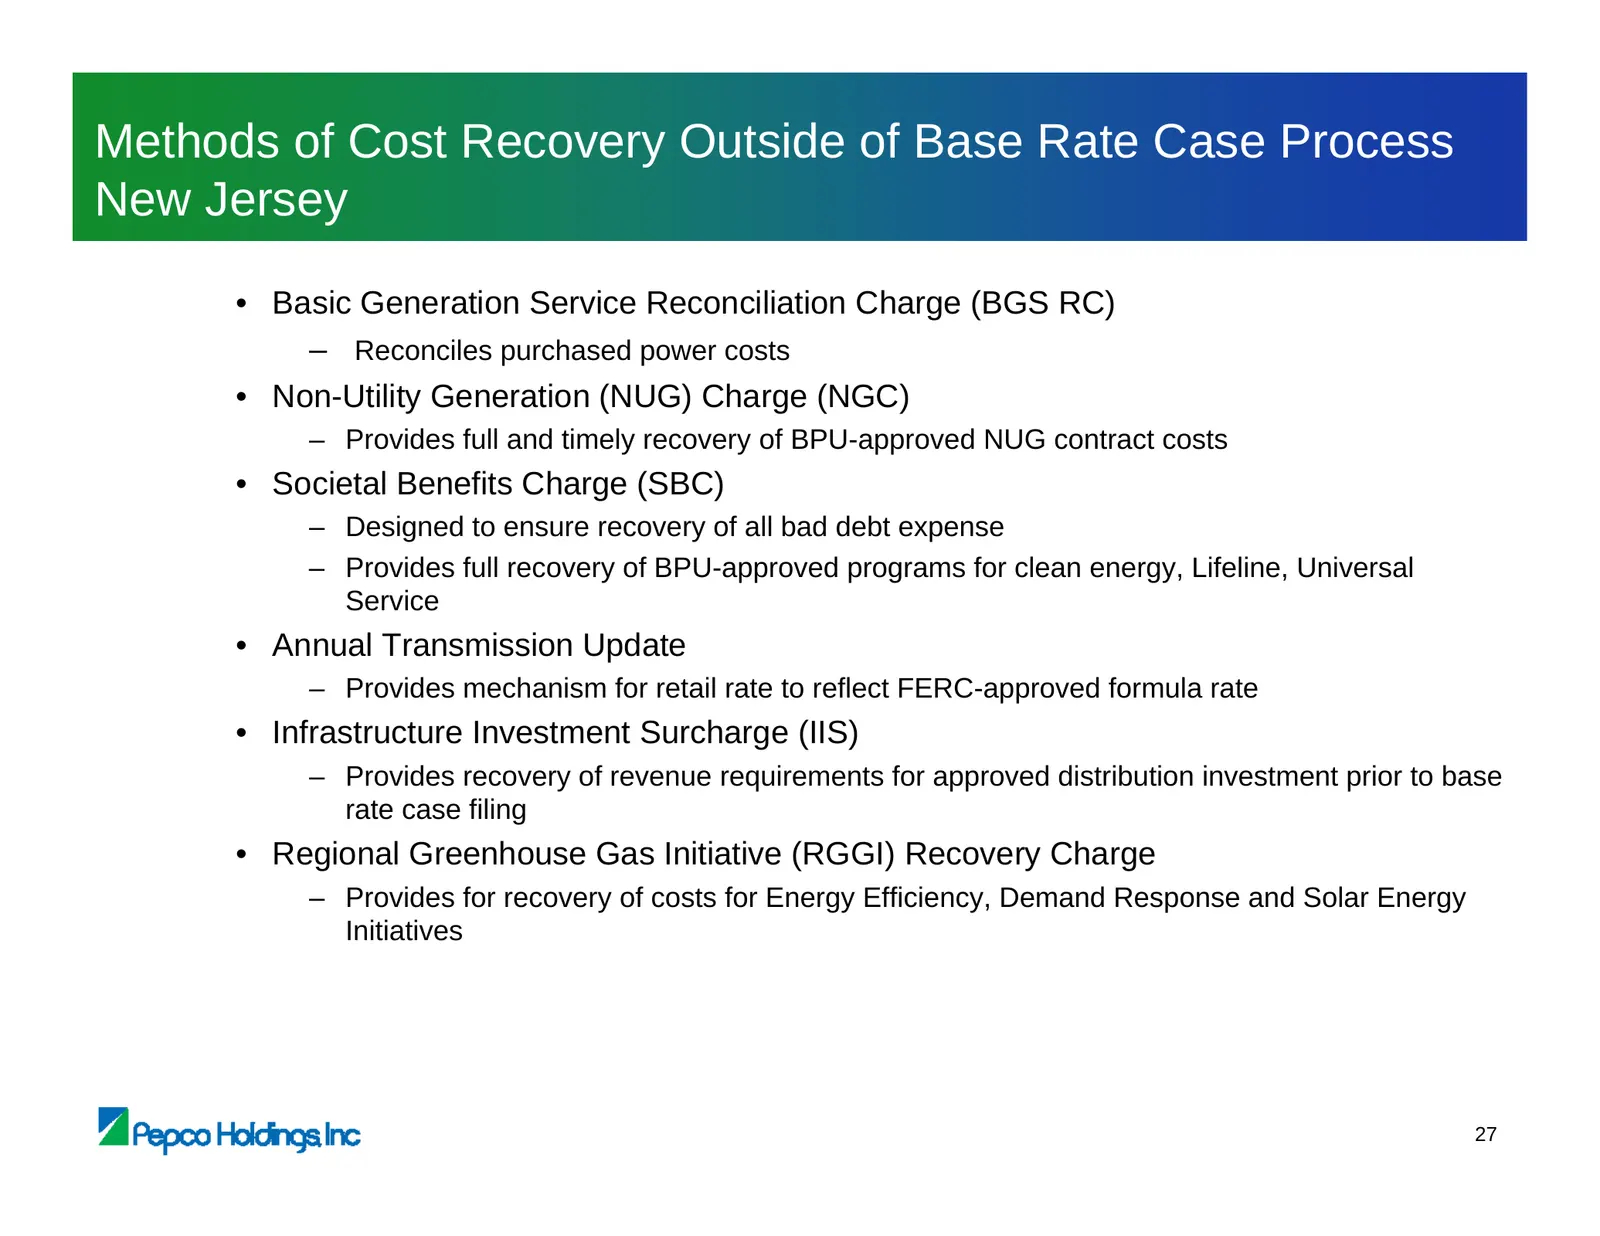
Methods of Cost Recovery Outside of Base Rate Case Process New Jersey • Basic Generation Service Reconciliation Charge (BGS RC) – Reconciles purchased power costs • Non-Utility Generation (NUG) Charge (NGC) – Provides full and timely recovery of BPU-approved NUG contract costs • Societal Benefits Ch
Slide 77: Regulatory Information by Commission
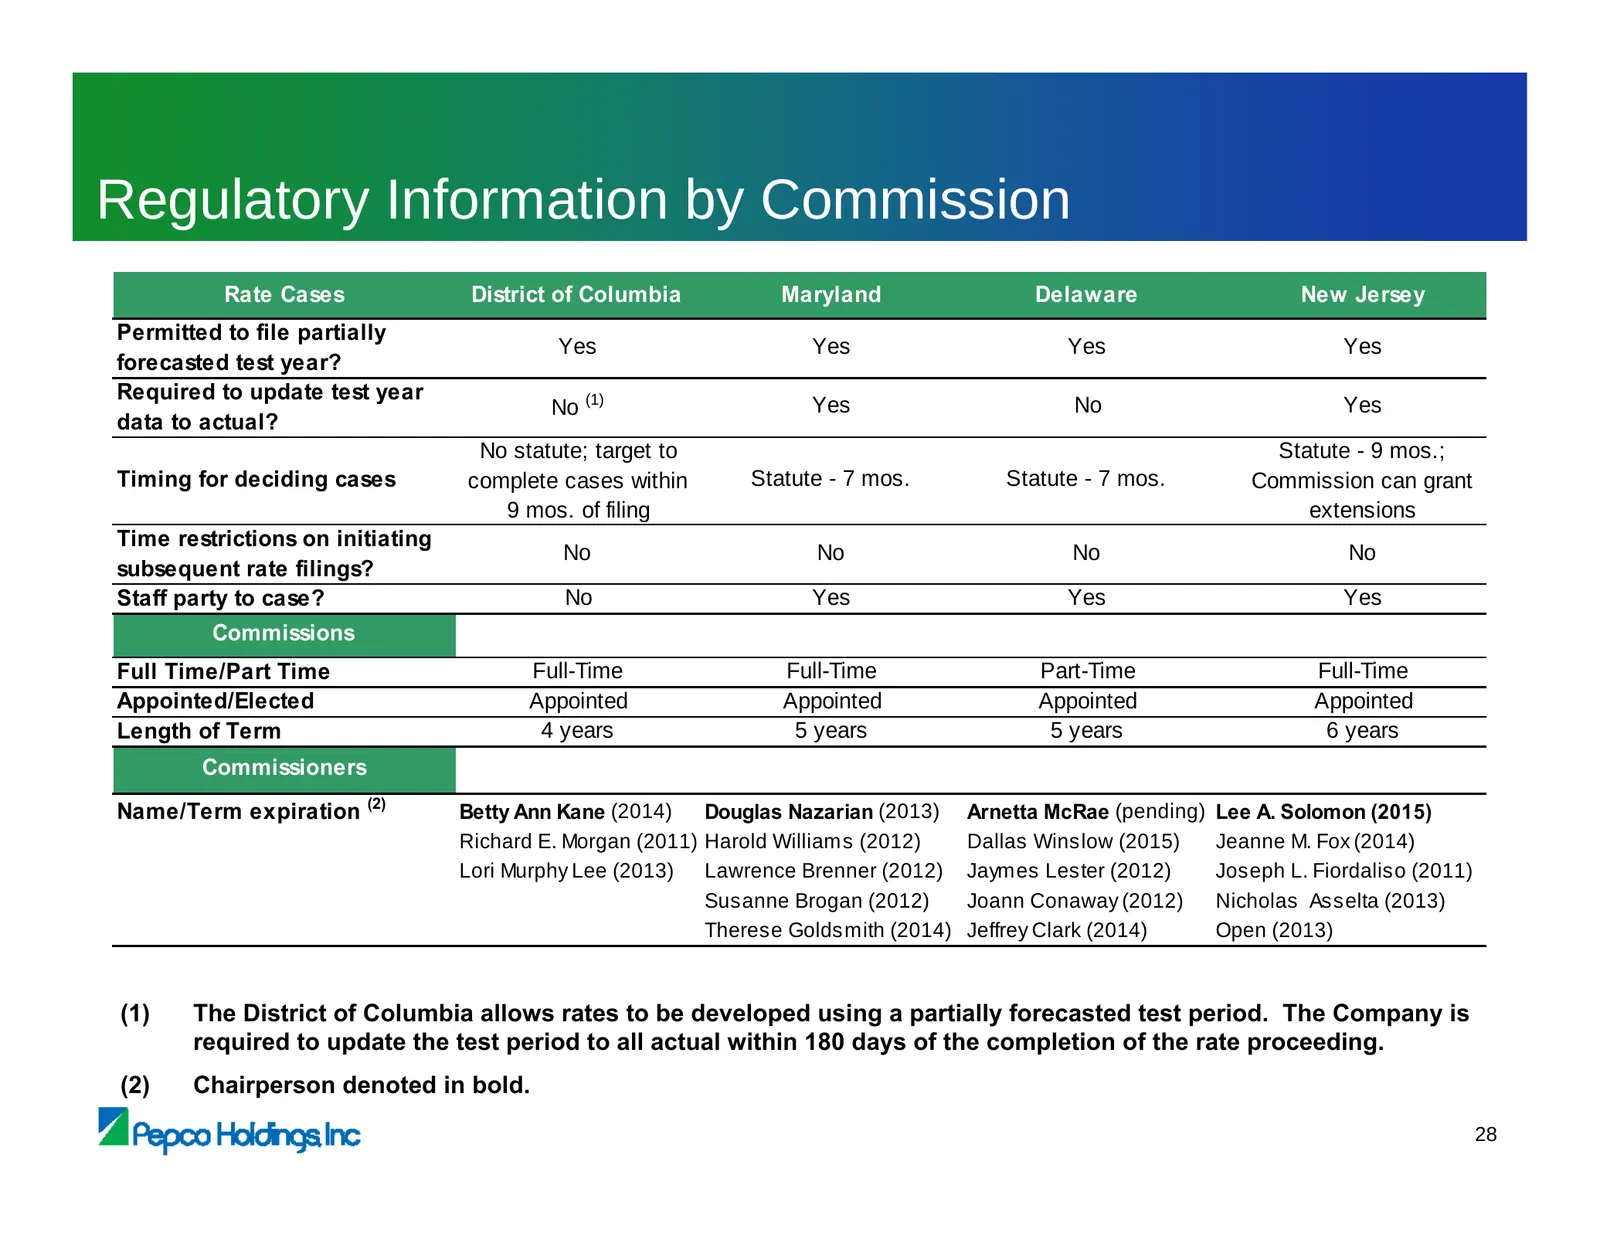
Regulatory Information by Commission Rate Cases District of Columbia Maryland Delaware New Jersey Permitted to file partially Yes Yes Yes Yes forecasted test year? Required to update test year No (1) Yes No Yes data to actual? No statute; target to Statute - 9 mos.; Timing for deciding cases complet
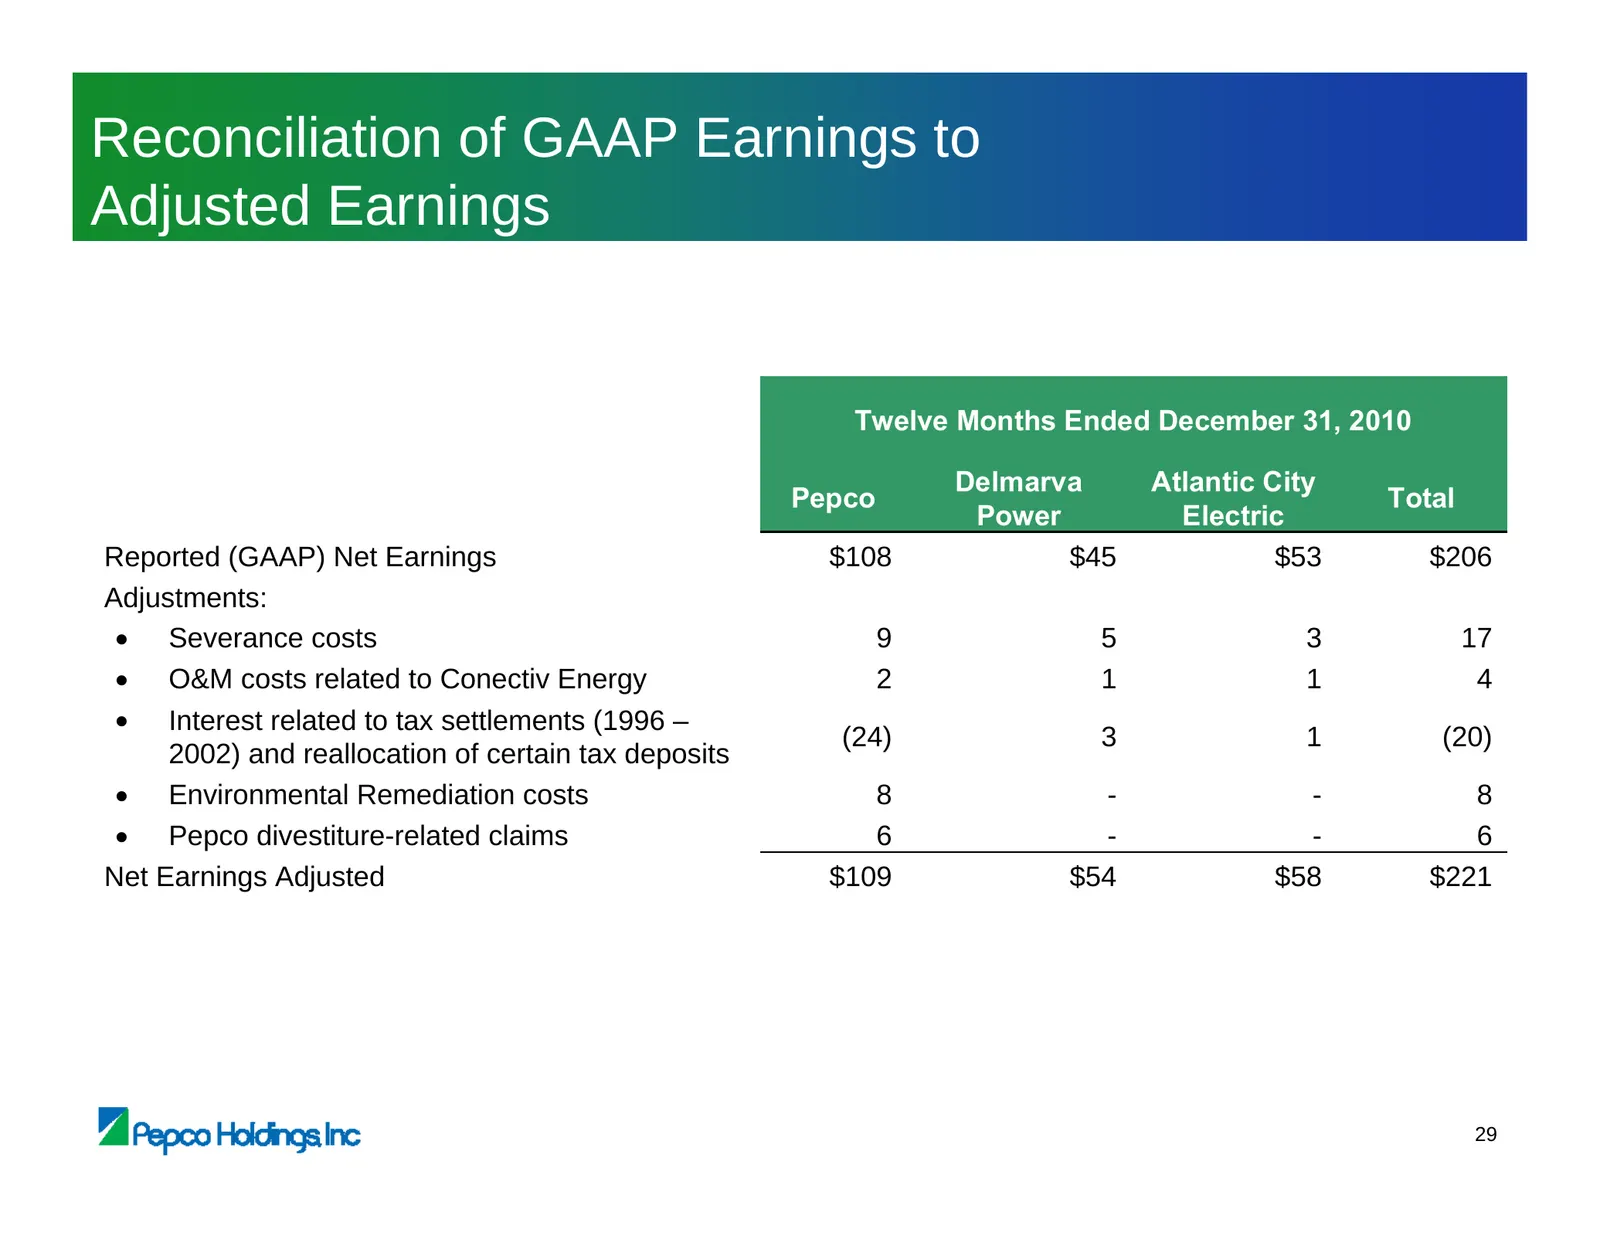
Slide 78: Reconciliation of GAAP Earnings to Adjusted Earnings
Reconciliation of GAAP Earnings to Adjusted Earnings Twelve Months Ended December 31, 2010 Delmarva Atlantic City Pepco Total Power Electric Reported (GAAP) Net Earnings $108 $45 $53 $206 Adjustments: • Severance costs 9 5 3 17 • O&M costs related to Conectiv Energy 2 1 1 4 • Interest related to tax
Slide 79: Pepco Energy Services Overview
Pepco Energy Services Overview John Huffman President & Chief Executive Officer, Pepco Energy Services
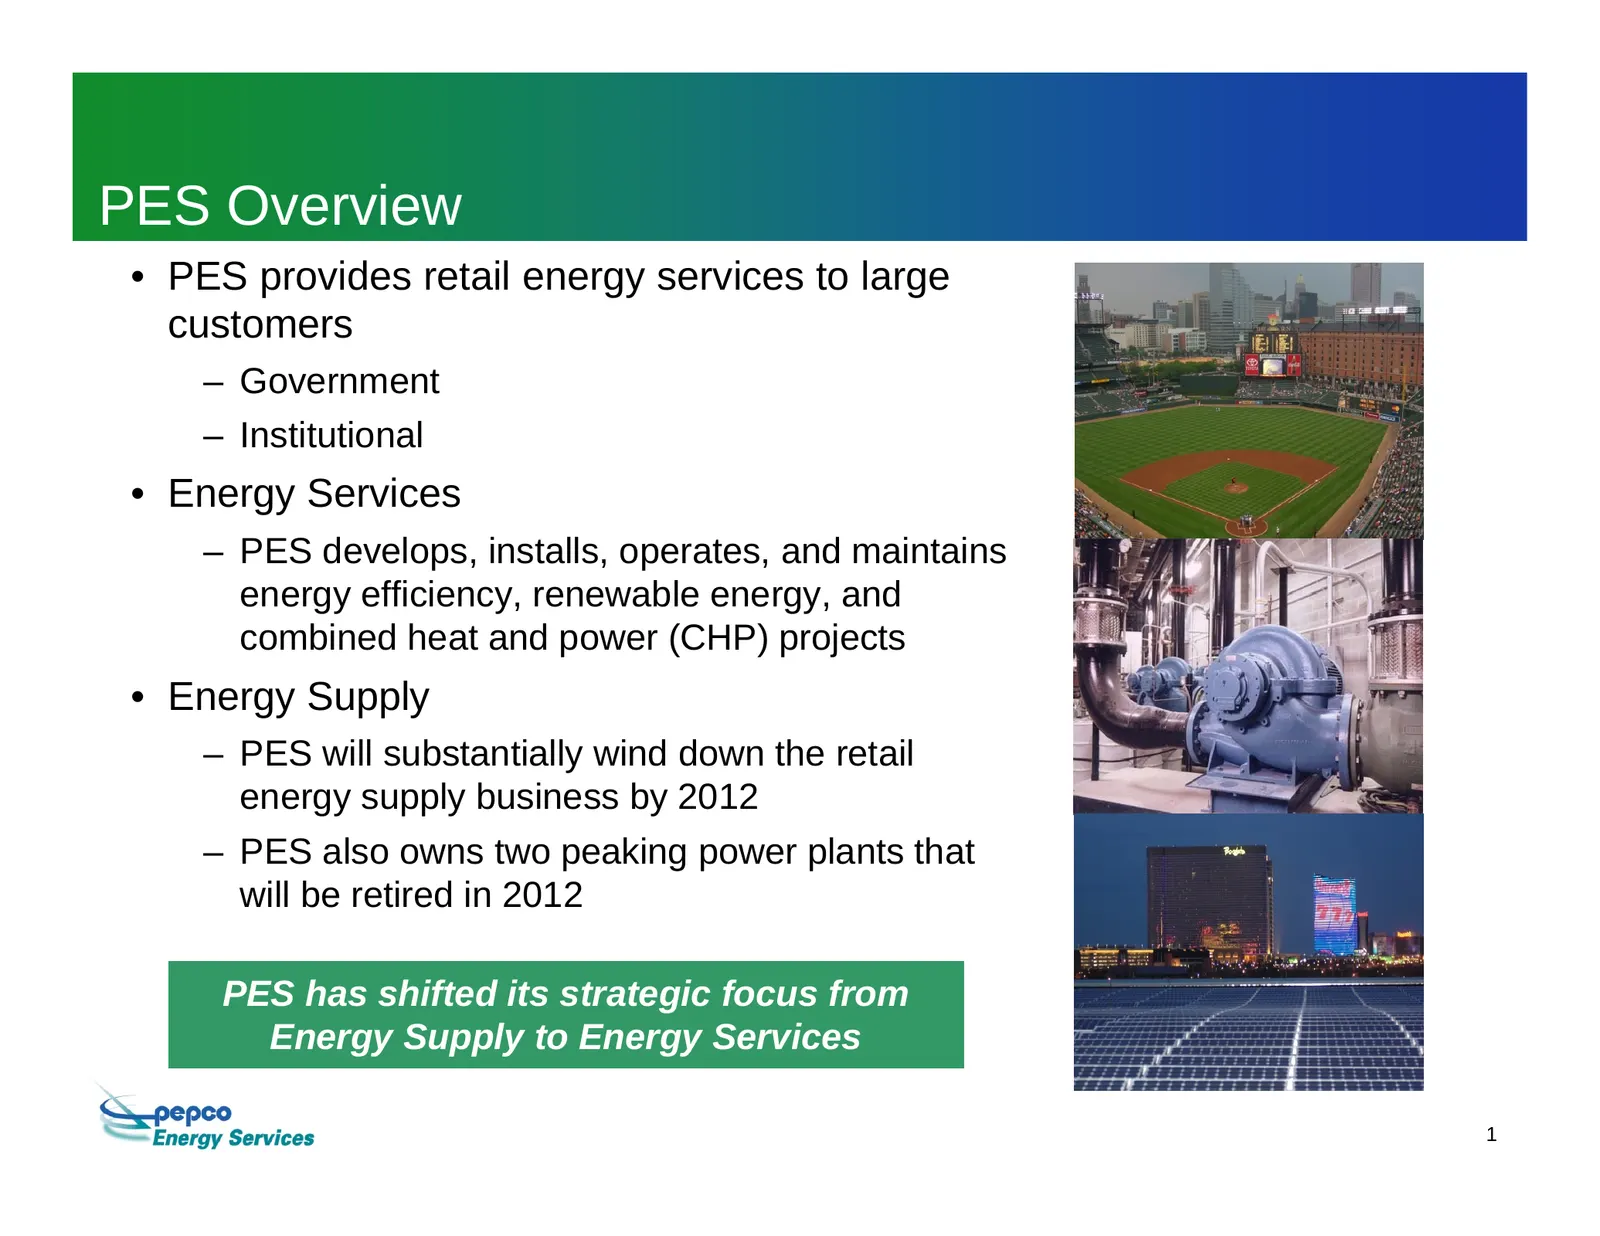
Slide 80: PES Overview
PES Overview • PES provides retail energy services to large customers – Government – Institutional • Energy Services – PES develops, installs, operates, and maintains energy efficiency, renewable energy, and combined heat and power (CHP) projects • Energy Supply – PES will substantially wind down th
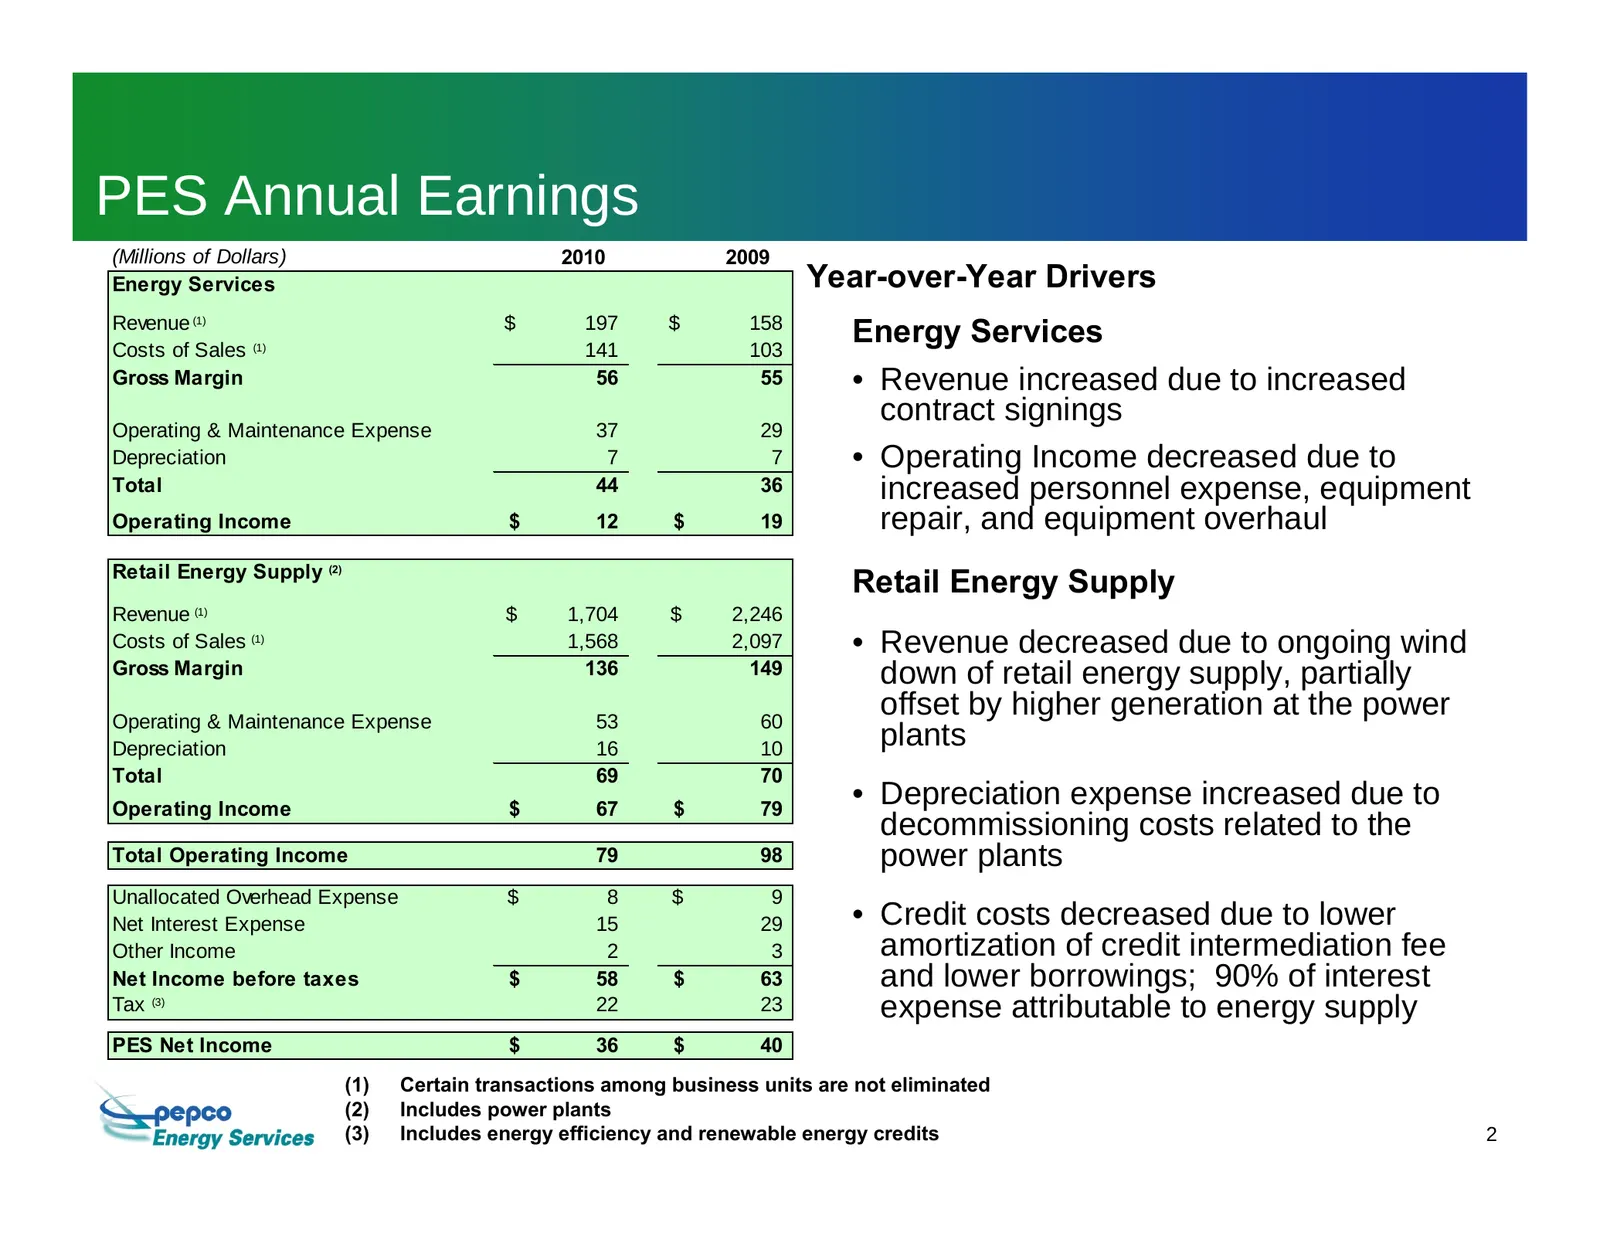
Slide 81: PES Annual Earnings
PES Annual Earnings (Millions of Dollars) 2010 2009 Energy Services Year-over-Year Drivers Revenue (1) Costs of Sales (1) $ 197 141 $ 158 103 Energy Services Gross Margin 56 55 • Revenue increased due to increased contract signings Operating & Maintenance Expense 37 29 Depreciation 7 7 • Operating I
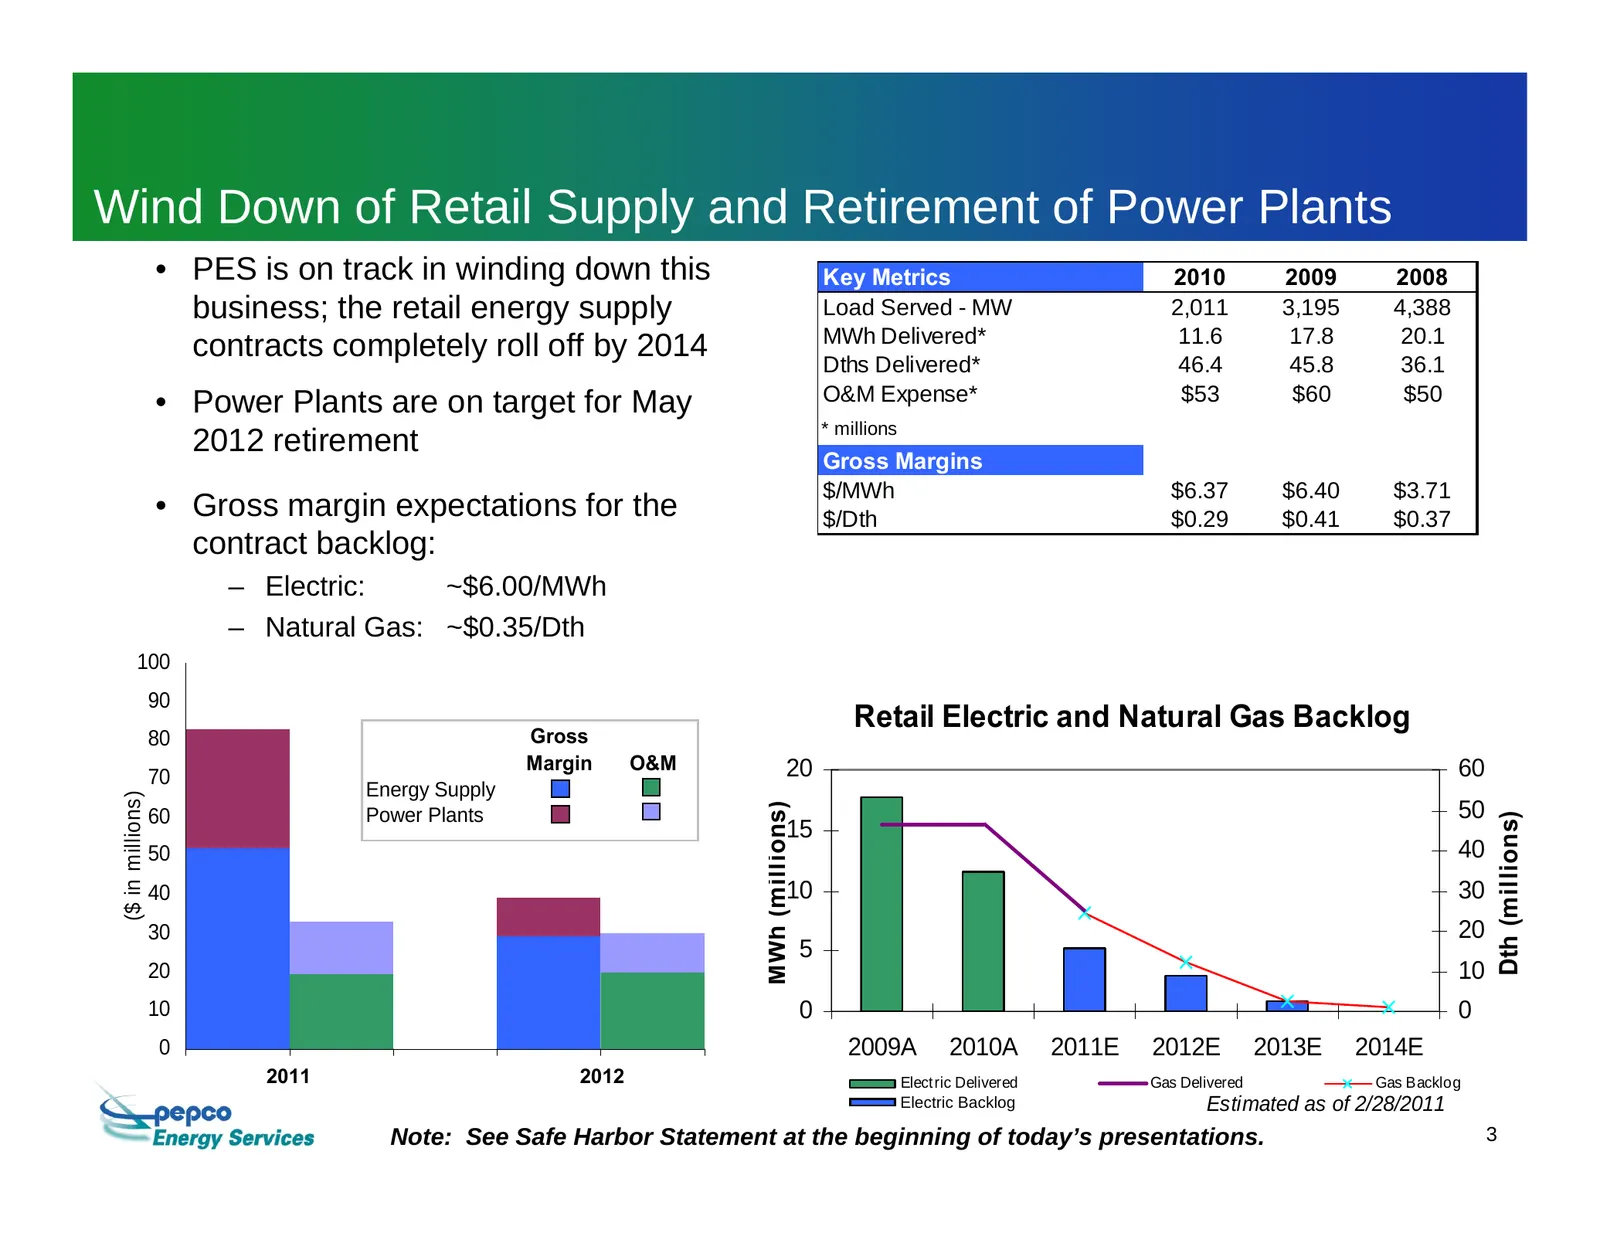
Slide 82: Wind Down of Retail Supply and Retirement of Power Plants
Wind Down of Retail Supply and Retirement of Power Plants • PES is on track in winding down this Key Metrics 2010 2009 2008 business; the retail energy supply Load Served - MW 2,011 3,195 4,388 MWh Delivered* 11.6 17.8 20.1 contracts completely roll off by 2014 Dths Delivered* 46.4 45.8 36.1 • Power
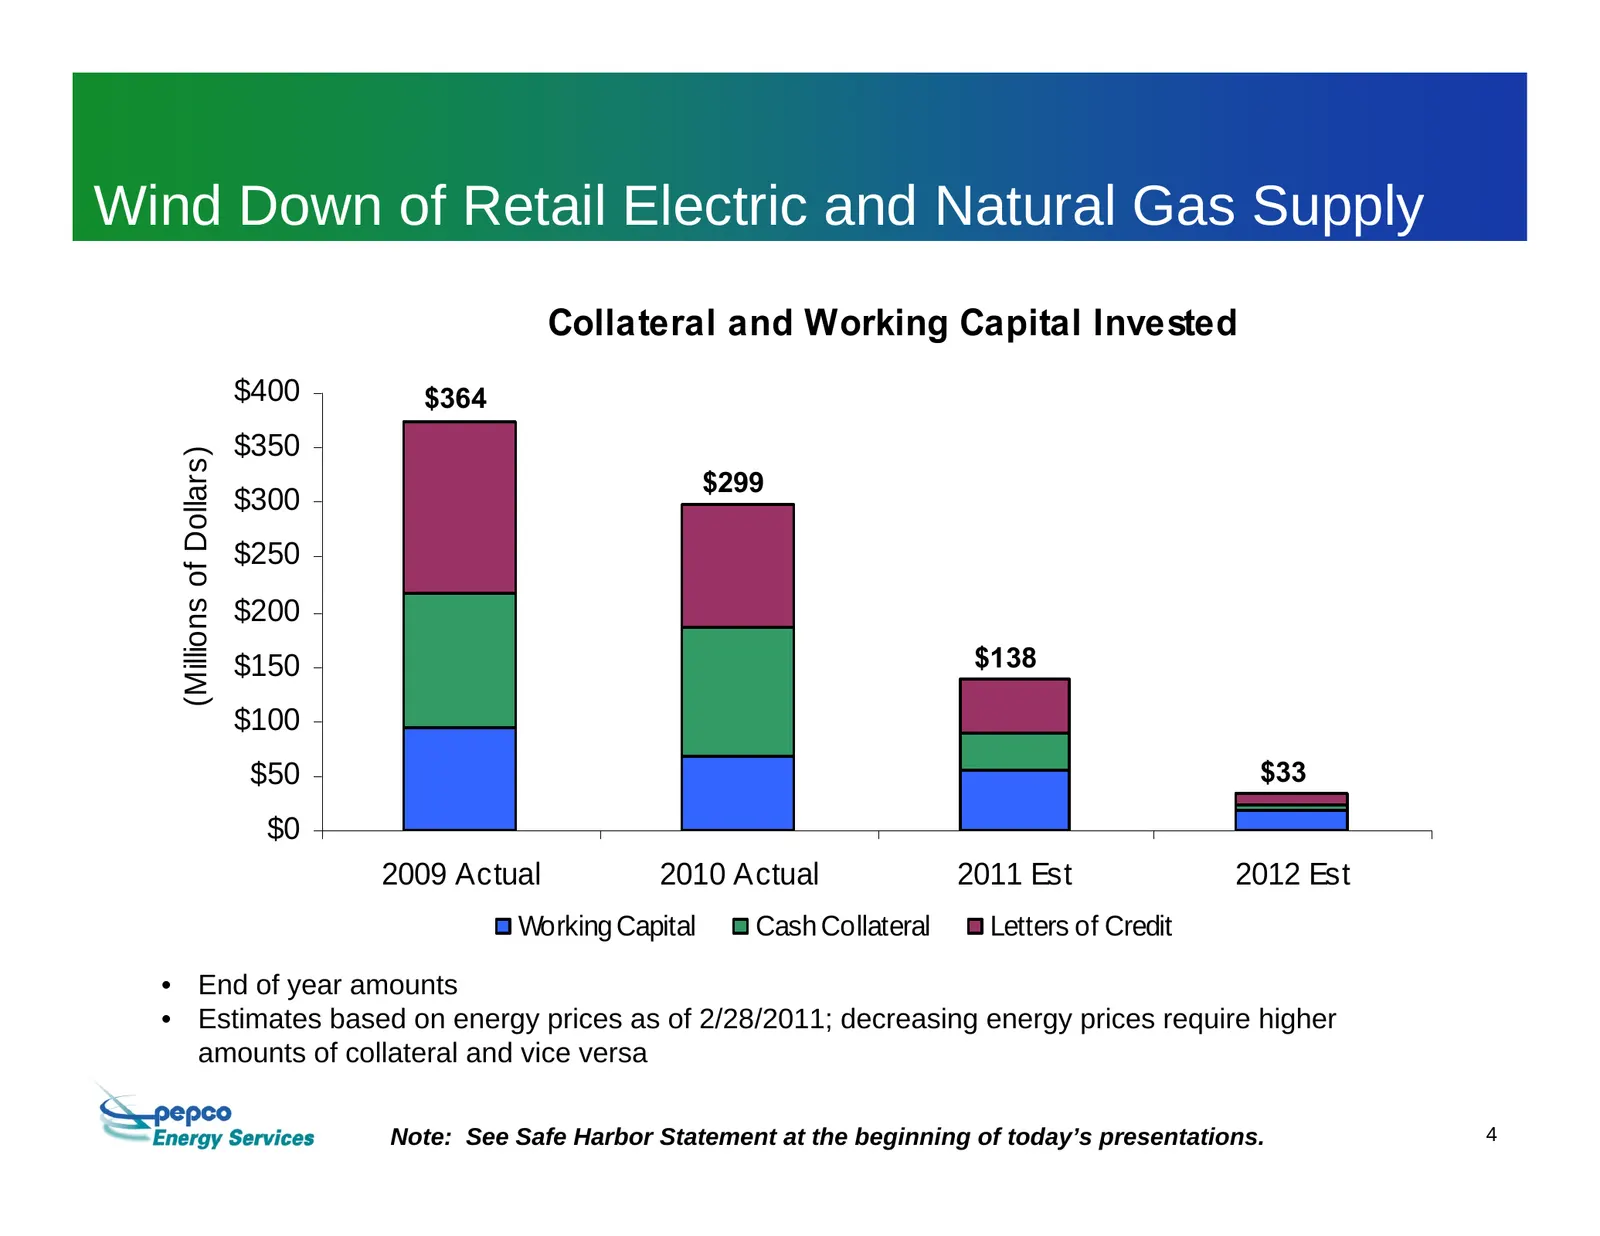
Slide 83: Wind Down of Retail Electric and Natural Gas Supply
Wind Down of Retail Electric and Natural Gas Supply Collateral and Working Capital Invested $400 $364 $350 (Millions of Dollars) $299 $300 $250 $200 $150 $138 $100 $50 $33 $0 2009 Actual 2010 Actual 2011 Est 2012 Est Working Capital Cash Collateral Letters of Credit • End of year amounts • Estimates
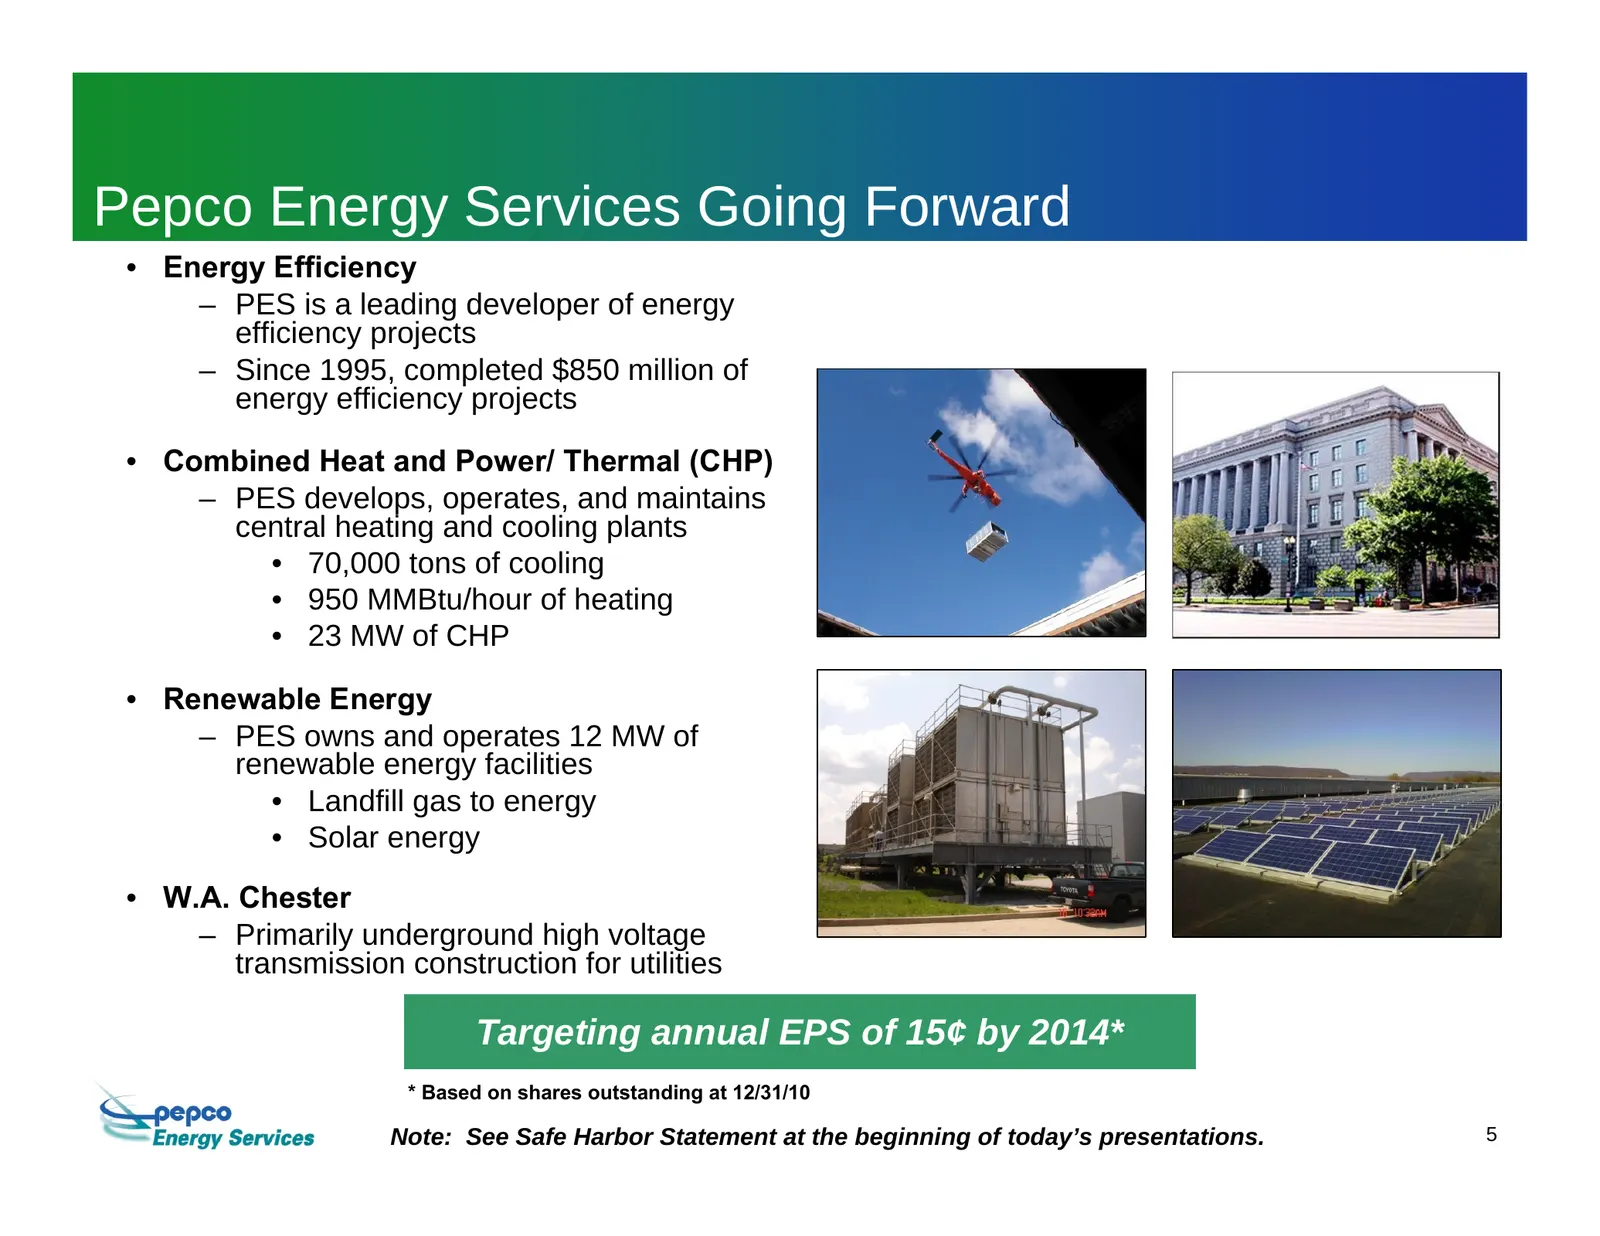
Slide 84: Pepco Energy Services Going Forward
Pepco Energy Services Going Forward • Energy Efficiency – PES is a leading developer of energy efficiency projects – Since 1995, completed $850 million of energy efficiency projects • Combined Heat and Power/ Thermal (CHP) – PES develops, operates, and maintains central heating and cooling plants •
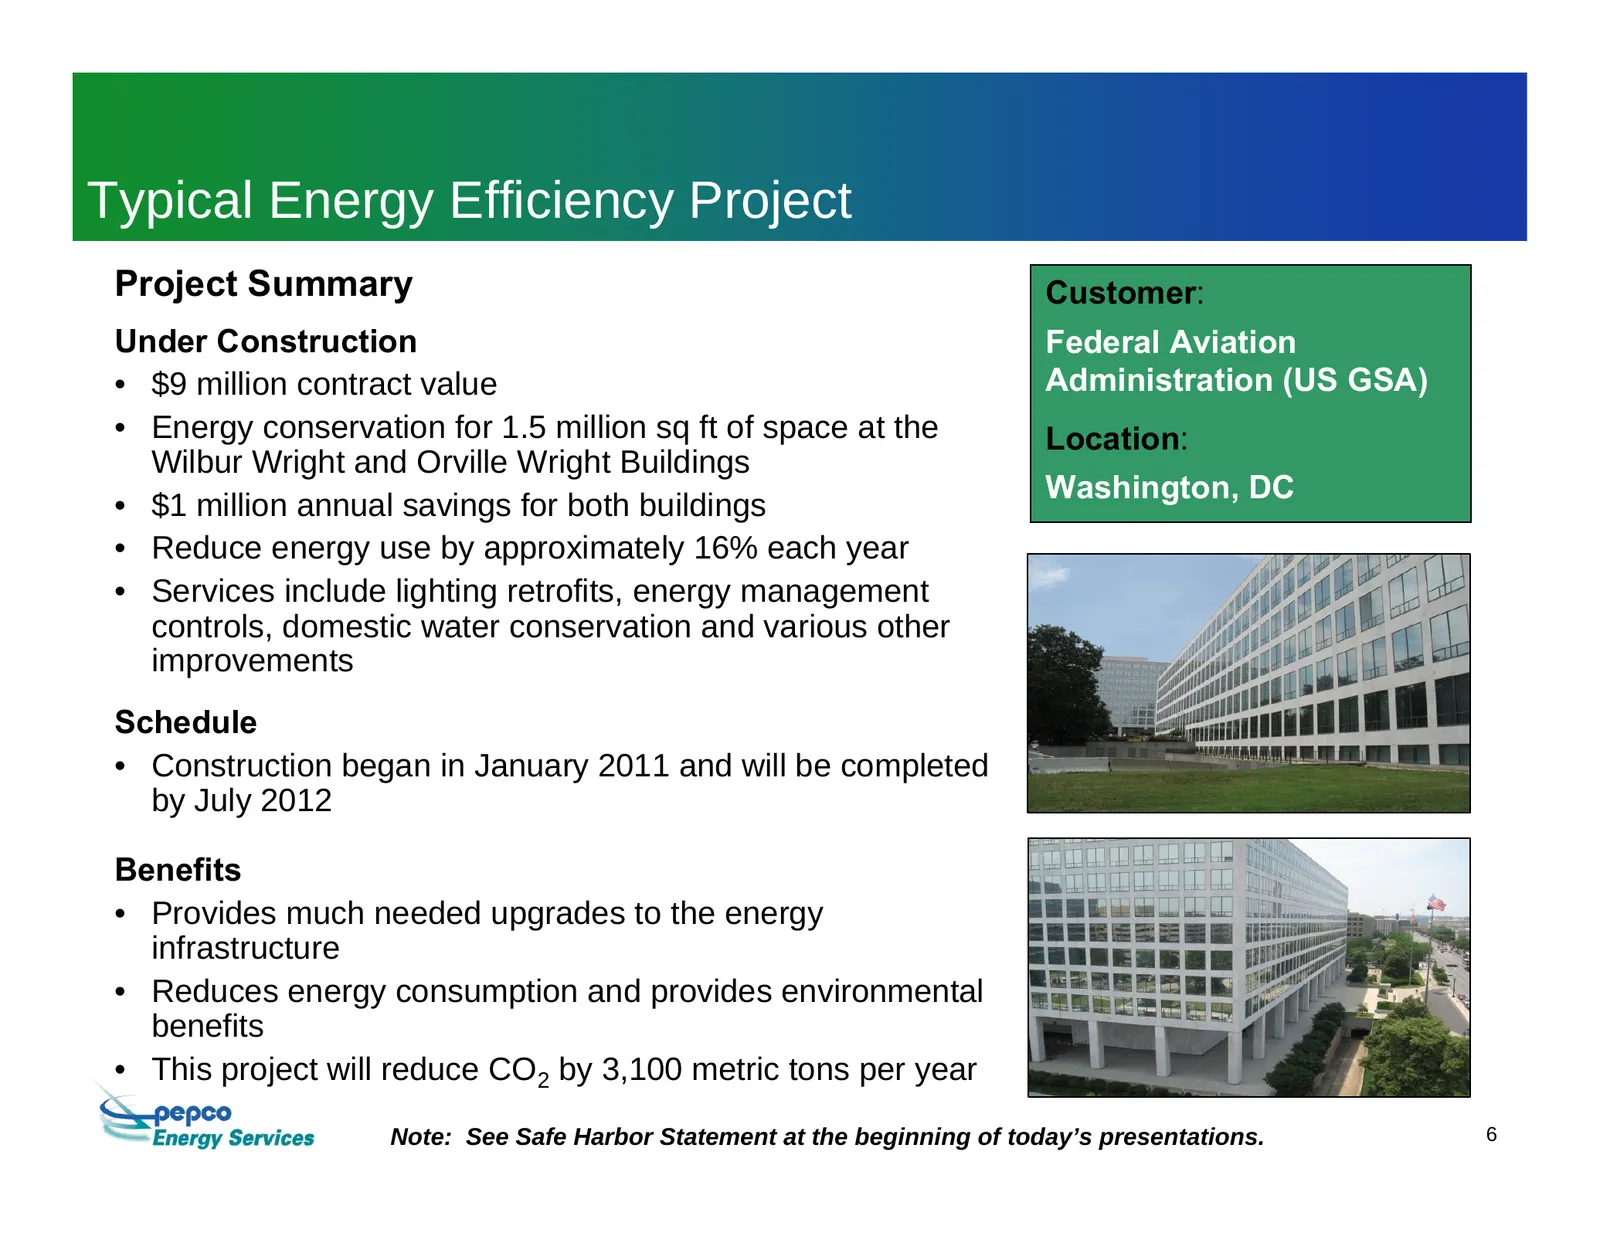
Slide 85: Typical Energy Efficiency Project
Typical Energy Efficiency Project Project Summary Customer: Under Construction Federal Aviation • $9 million contract value Administration (US GSA) • Energy conservation for 1.5 million sq ft of space at the Location: Wilbur Wright and Orville Wright Buildings Washington, DC • $1 million annual savi
Slide 86: Energy Services: Earnings Components – Construction
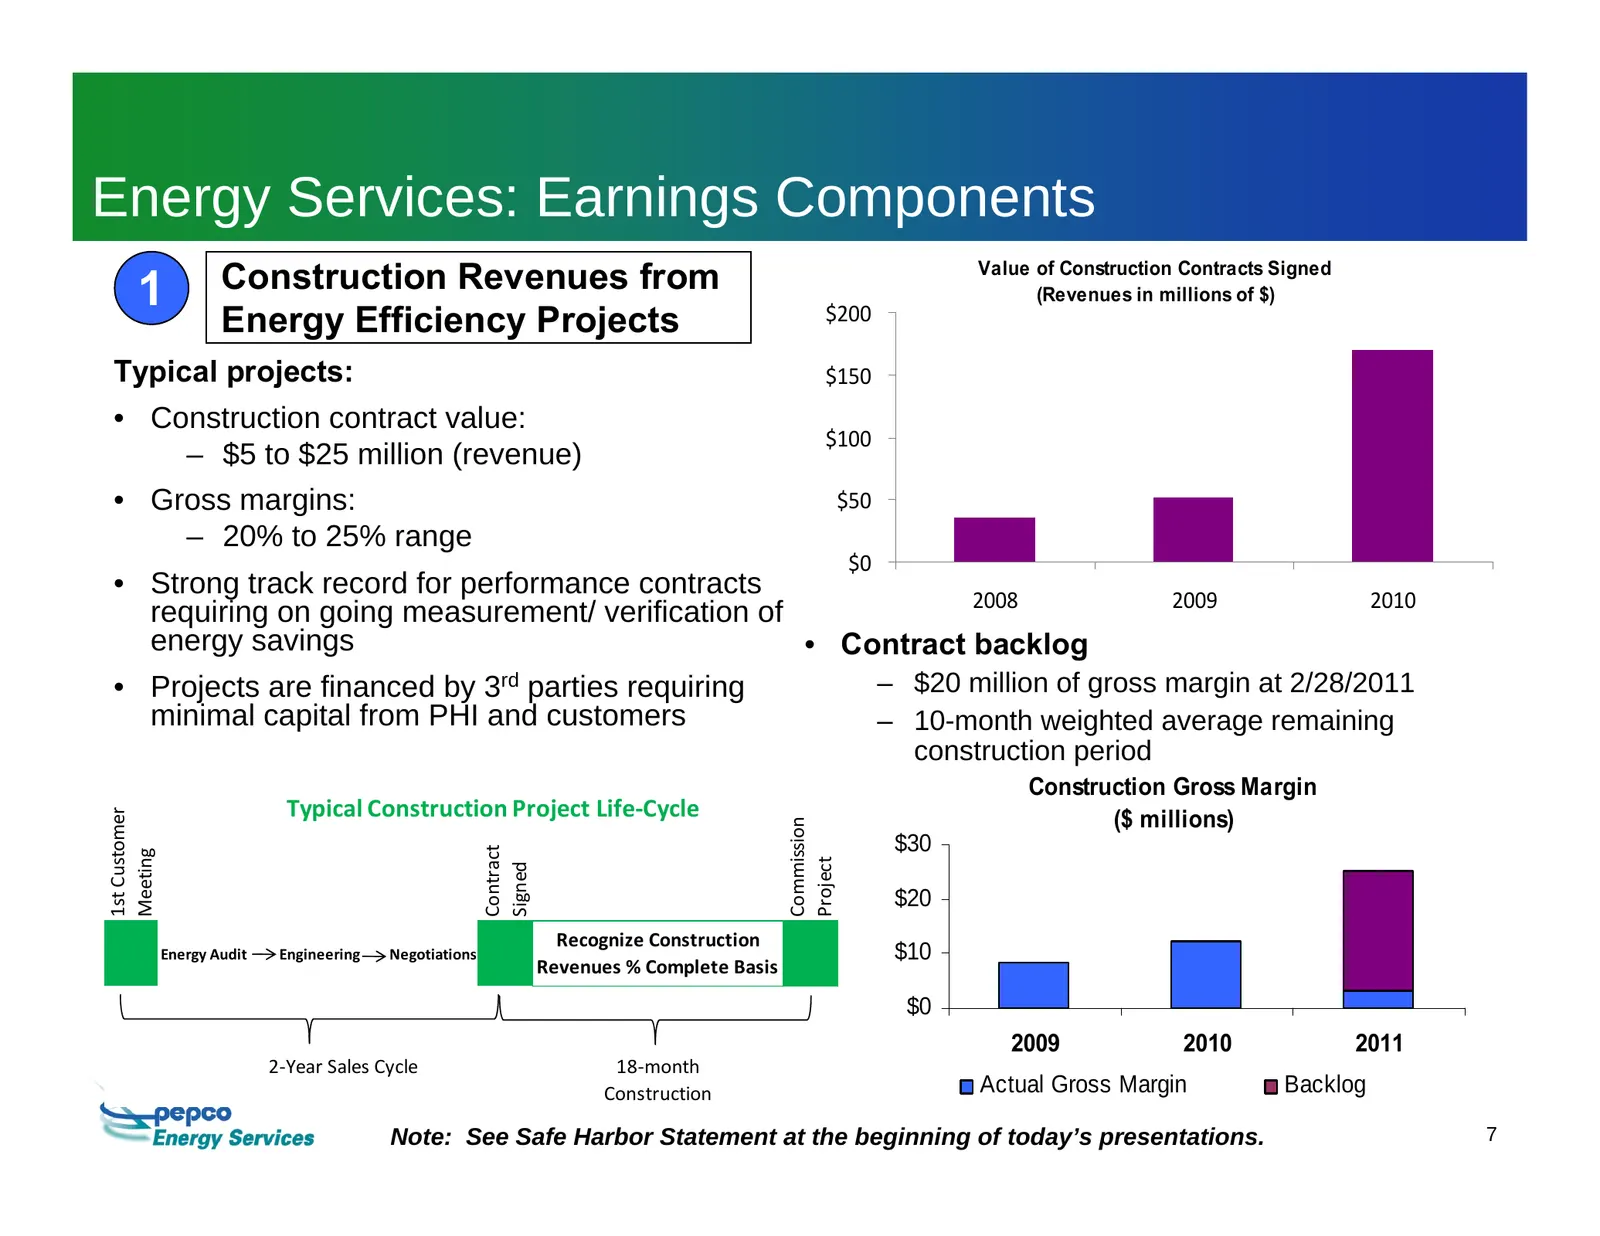
Energy Services: Earnings Components 1 Construction Revenues from Value of Construction Contracts Signed (Revenues in millions of $) Energy Efficiency Projects $200 Typical projects: $150 • Construction contract value: $100 – $5 to $25 million (revenue) • Gross margins: $50 – 20% to 25% range $0 • S
Slide 87: Energy Services: Earnings Components – Recurring
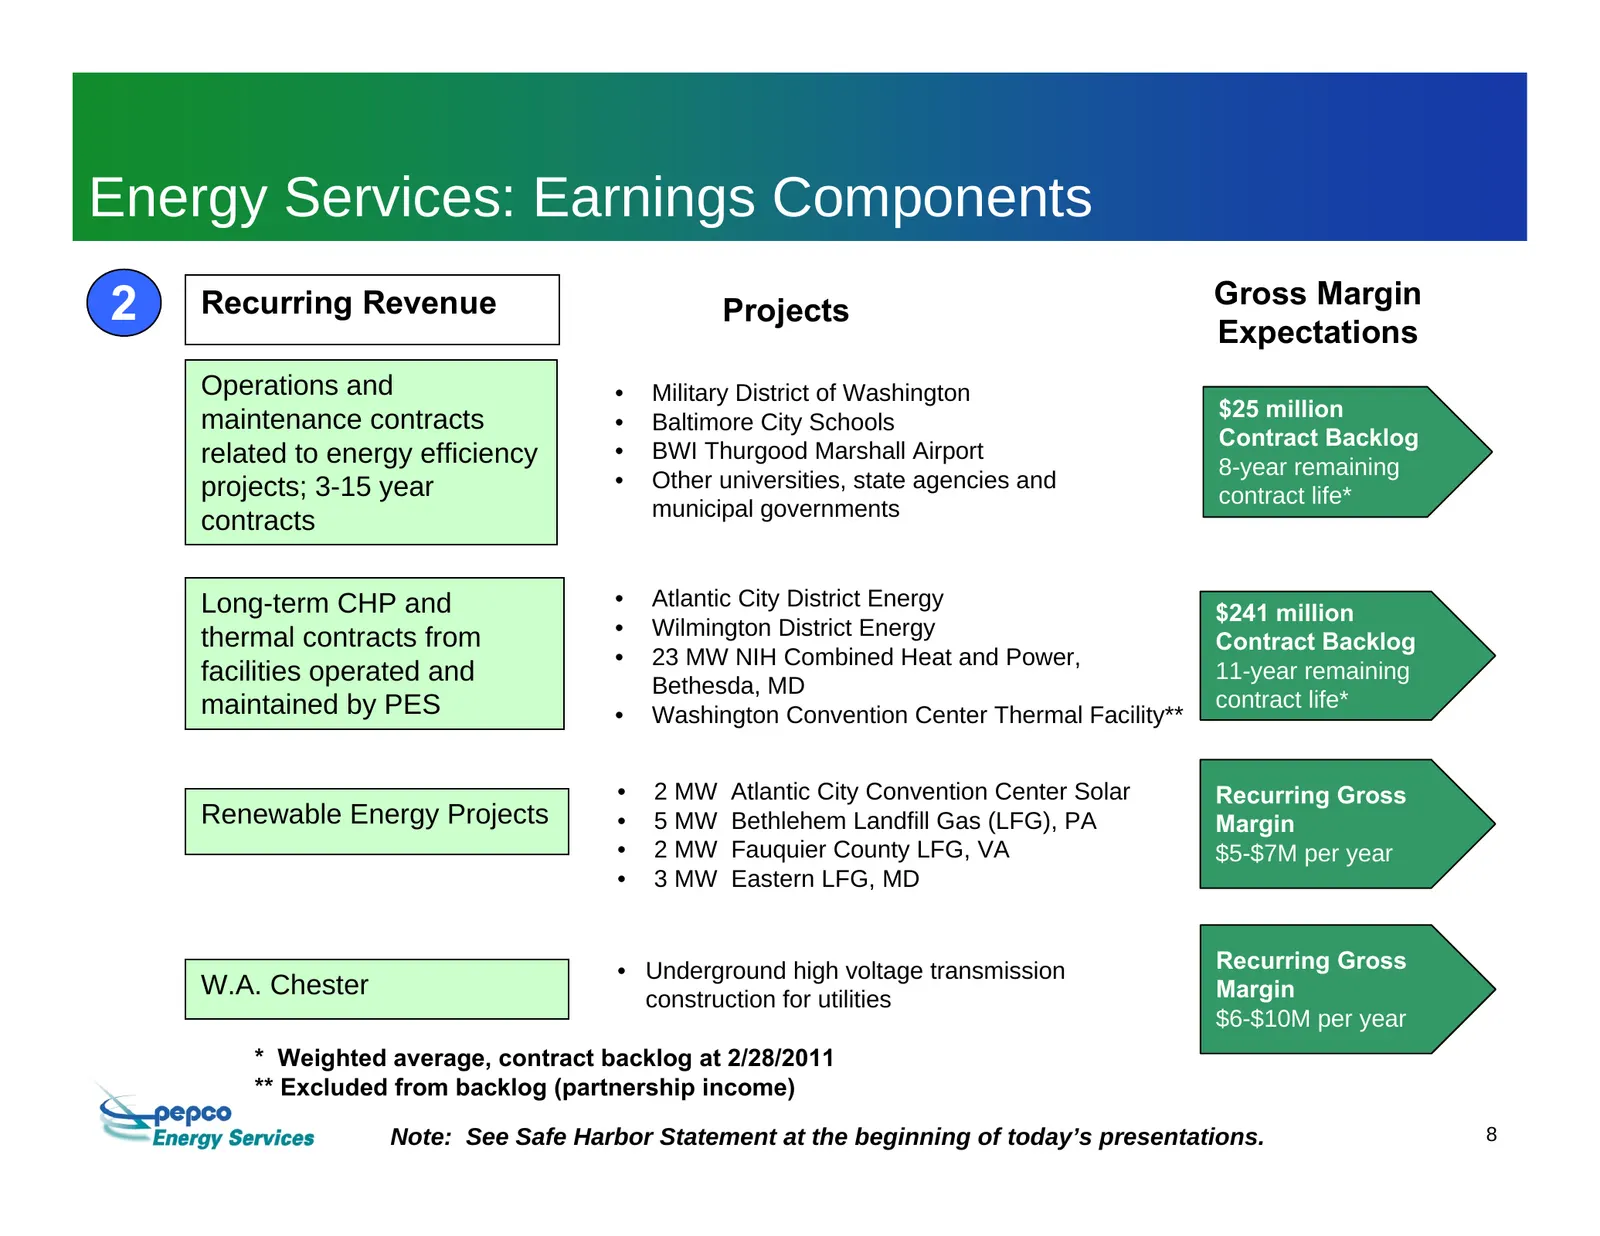
Energy Services: Earnings Components 2 Recurring Revenue Gross Margin Projects Expectations Operations and • Military District of Washington maintenance contracts $25 million • Baltimore City Schools Contract Backlog related to energy efficiency • BWI Thurgood Marshall Airport 8-year remaining proje
Slide 88: Growing the Business
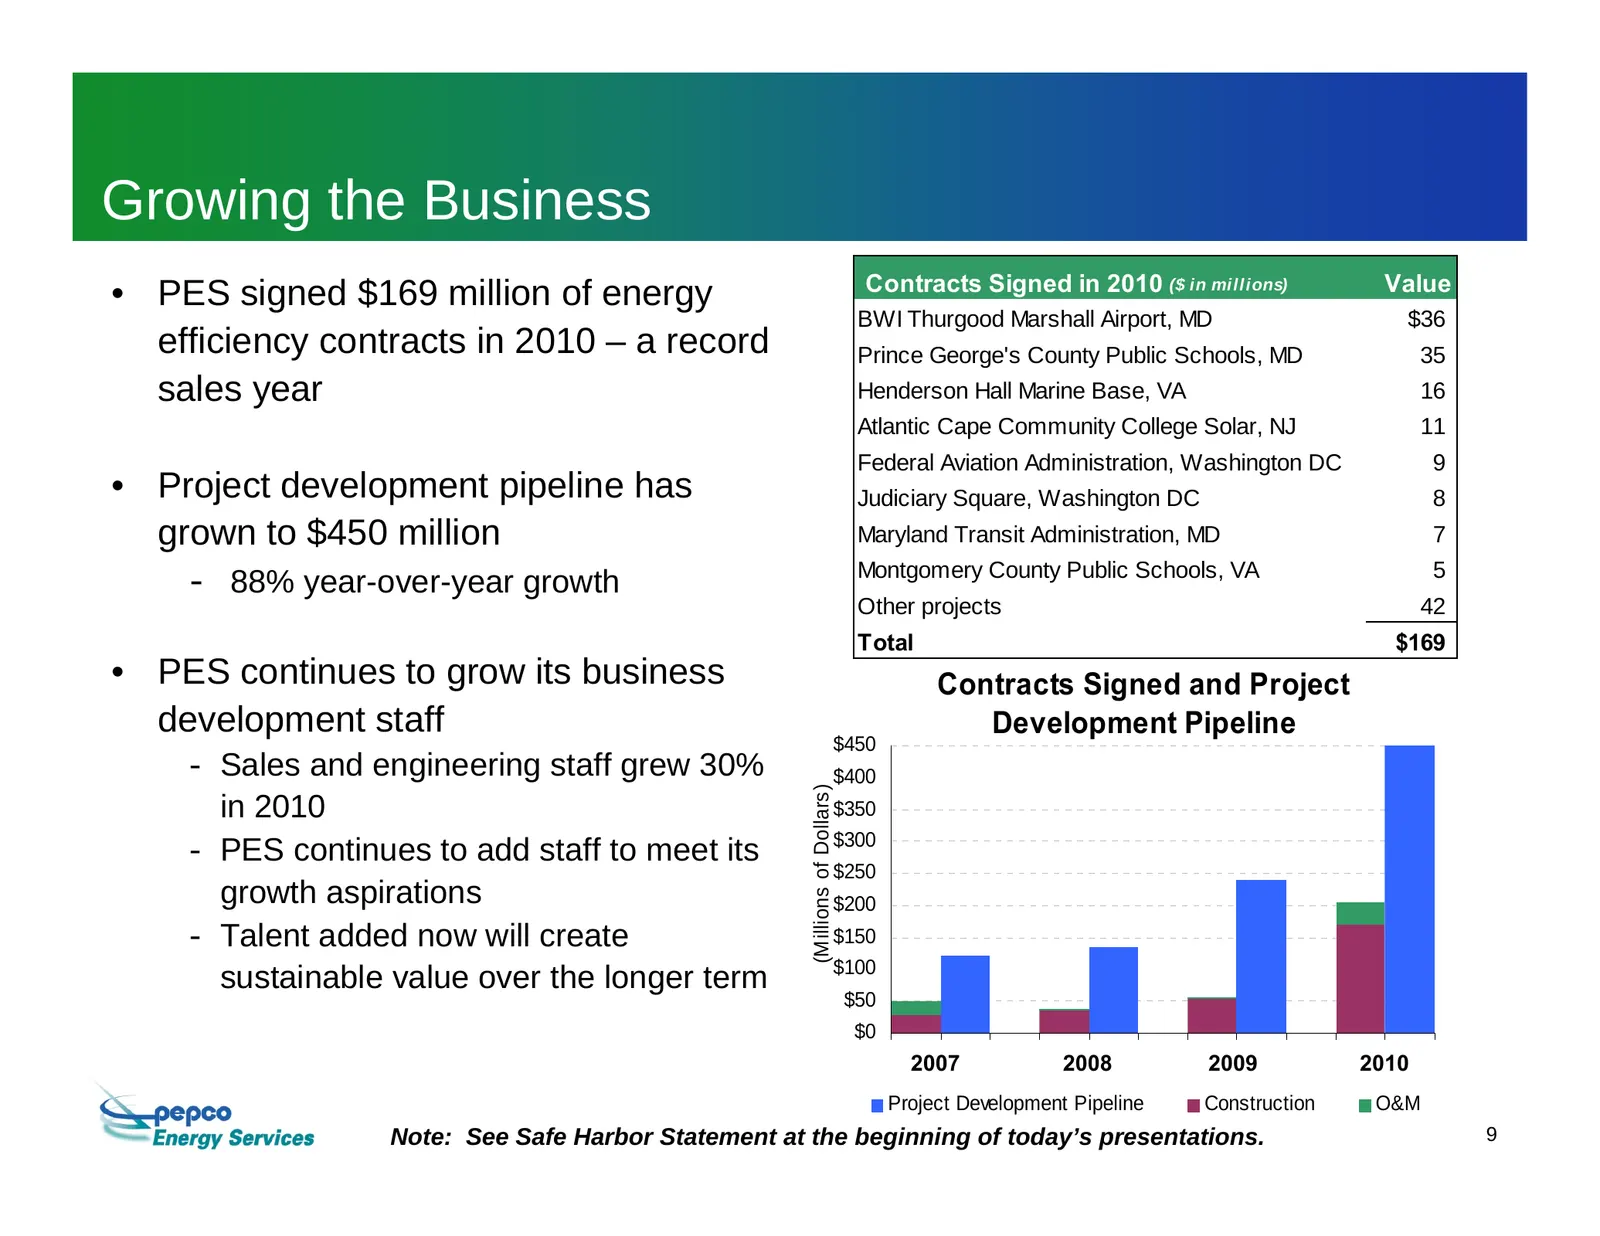
Growing the Business Contracts Signed in 2010 ($ in millions) Value • PES signed $169 million of energy BWI Thurgood Marshall Airport, MD $36 efficiency contracts in 2010 – a record Prince George's County Public Schools, MD 35 sales year Henderson Hall Marine Base, VA 16 Atlantic Cape Community Coll
Slide 89: ESCO Market Update
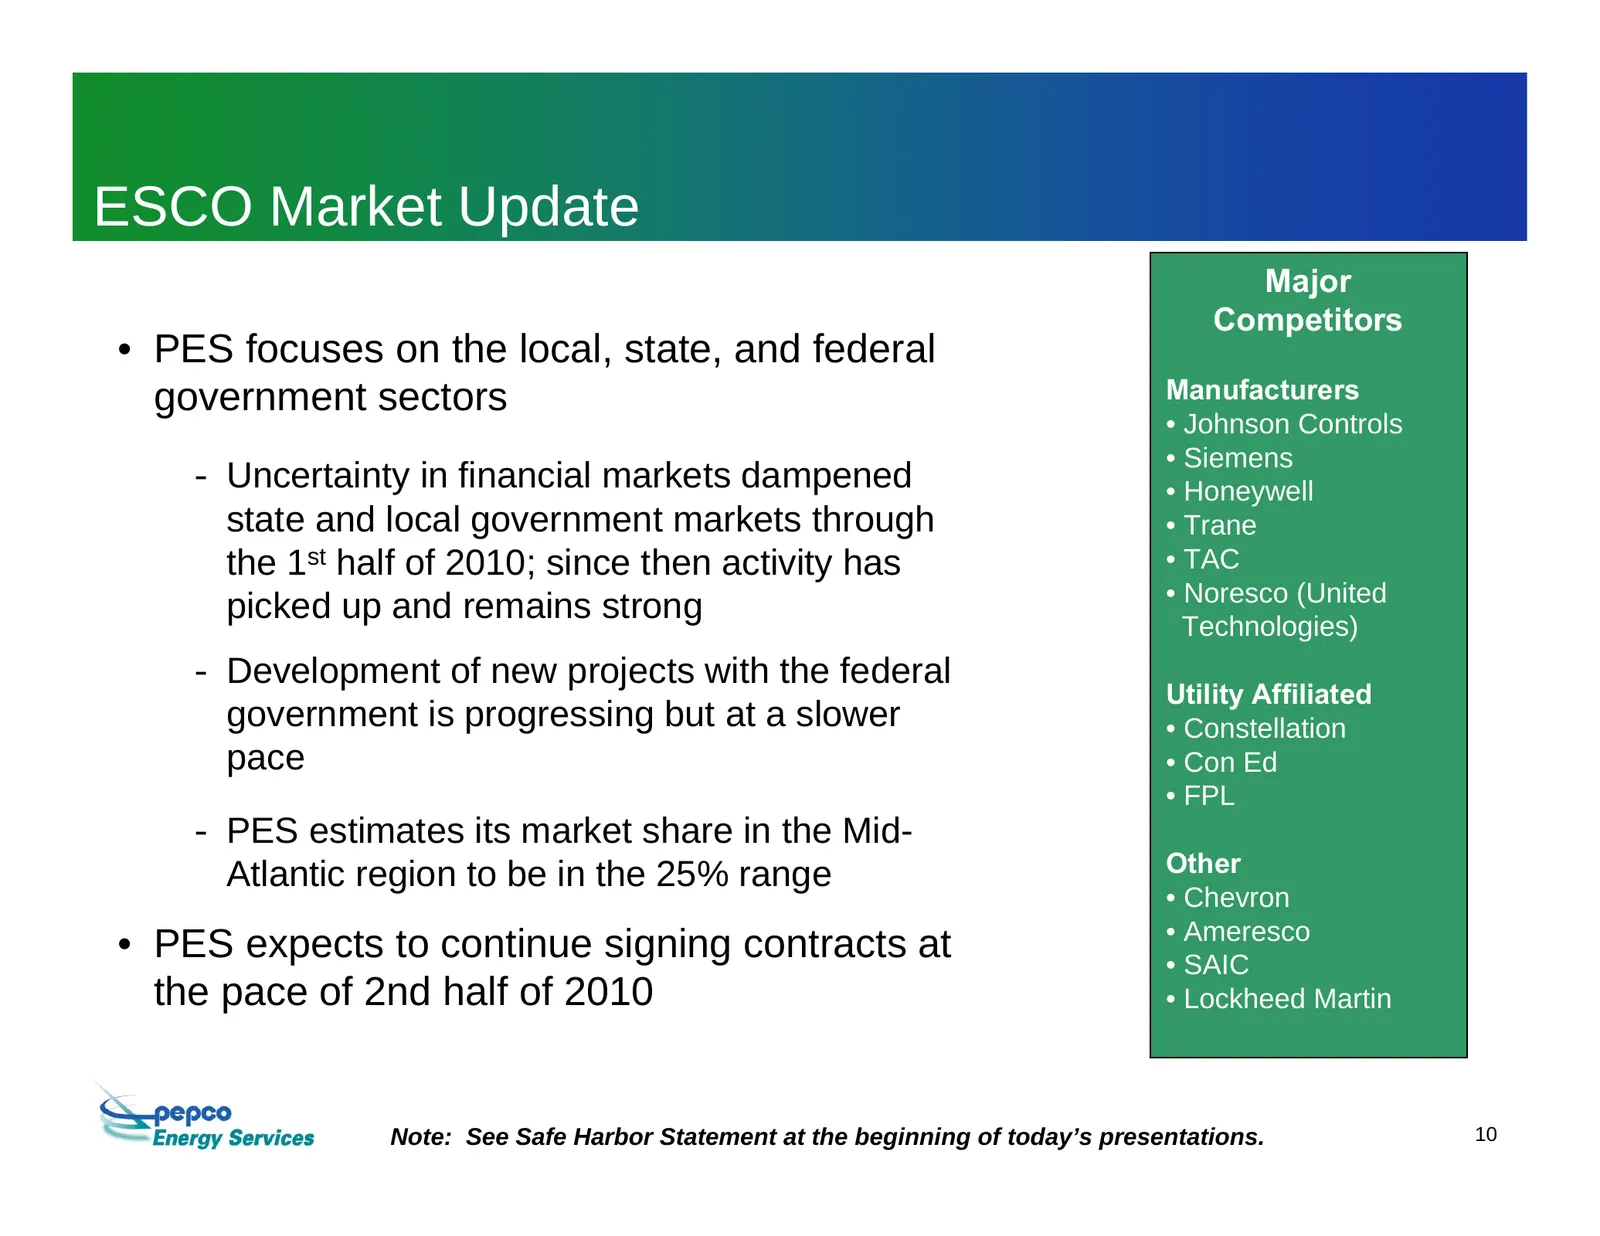
ESCO Market Update Major Competitors • PES focuses on the local, state, and federal government sectors Manufacturers • Johnson Controls • Siemens - Uncertainty in financial markets dampened • Honeywell state and local government markets through • Trane the 1st half of 2010; since then activity has •
Slide 90: Summary
Summary • Pepco Energy Services is well aligned with PHI’s strategic focus – Requires minimal capital – Minimal exposure to commodity risk • PES is transforming into an energy efficiency-focused company – PES is on track to substantially wind down the retail energy supply business and retire the pow
Slide 91: Pepco Energy Services Overview
Pepco Energy Services Overview John Huffman President & Chief Executive Officer, Pepco Energy Services
Slide 92: Financial Overview
Financial Overview Tony Kamerick Senior Vice President & Chief Financial Officer
Slide 93: Financial Objectives
Financial Objectives • Maintain solid investment grade credit ratings • Achieve long-term earnings and dividend growth • Disciplined approach to capital spend • Minimize regulatory lag • Maintain ready access to capital markets at favorable terms Our regulated business model positions us to meet the
Slide 94: Strengthened Credit Profile
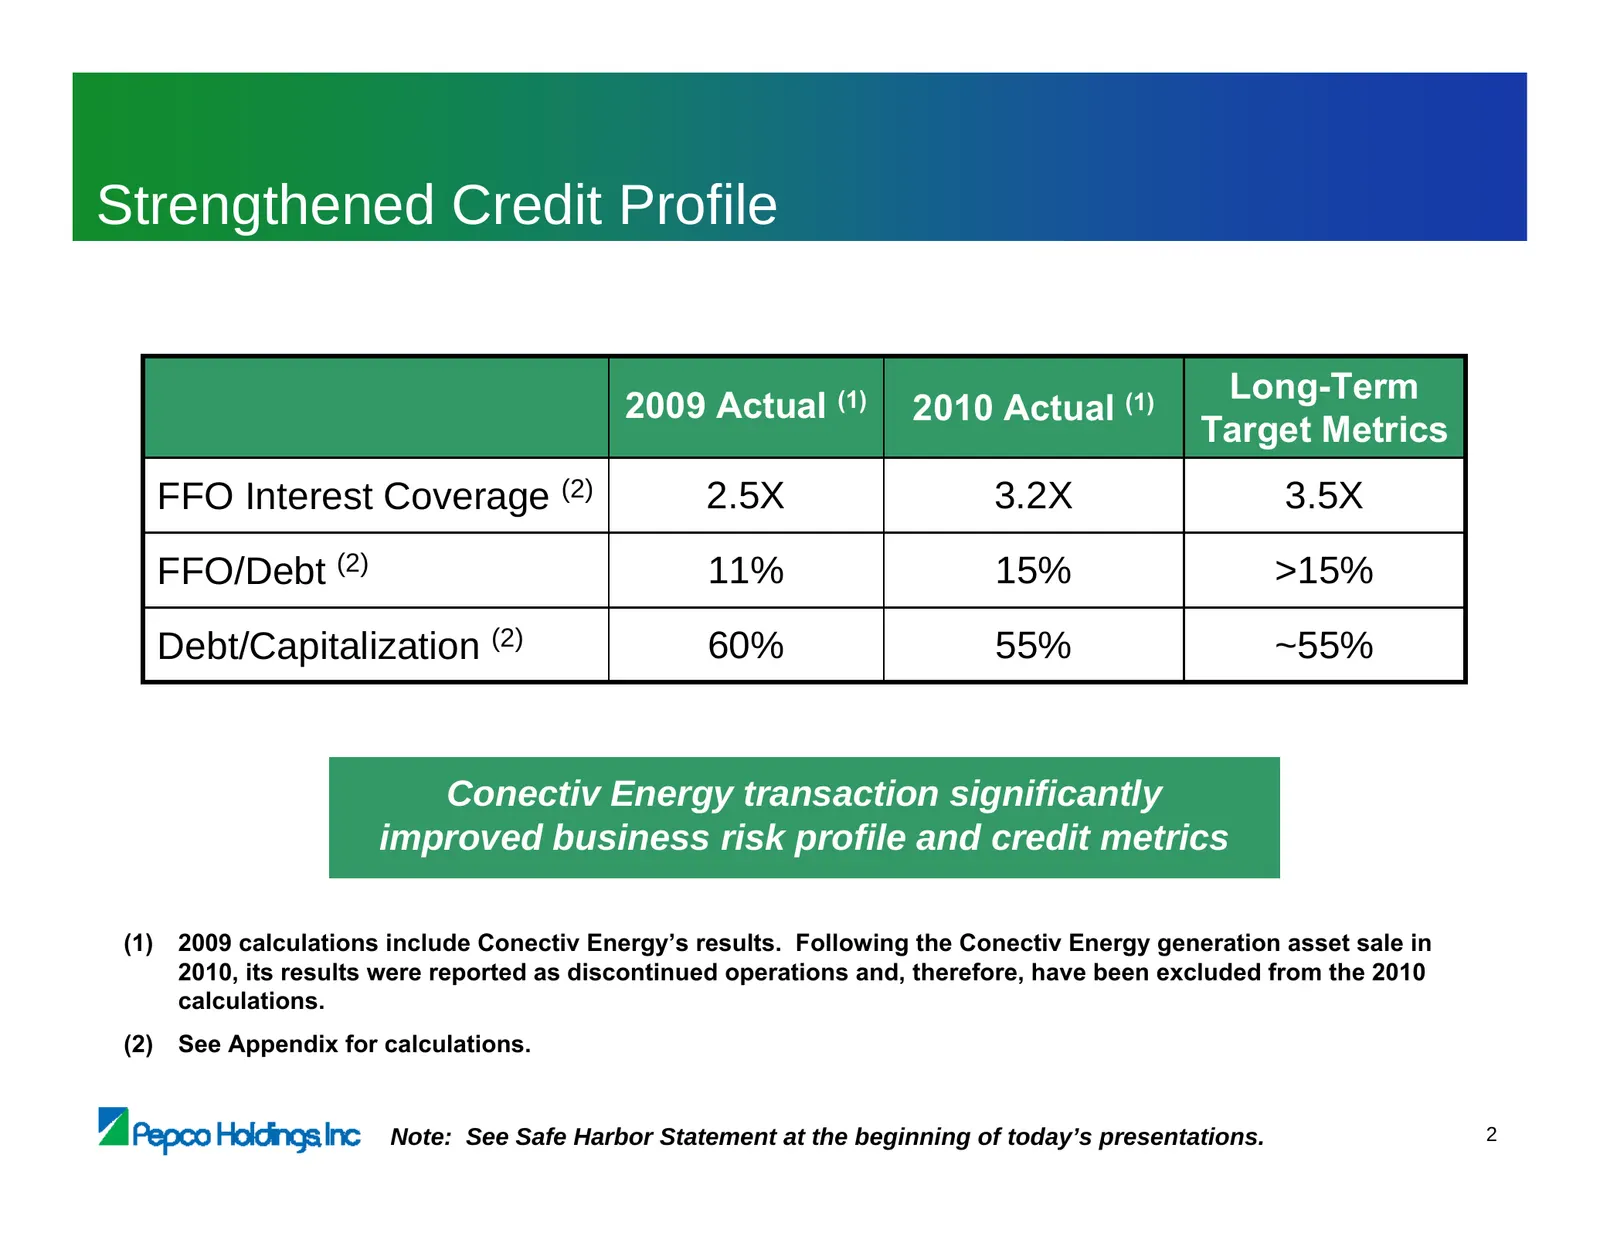
Strengthened Credit Profile Long-Term 2009 Actual (1) 2010 Actual (1) Target Metrics FFO Interest Coverage (2) 2.5X 3.2X 3.5X FFO/Debt (2) 11% 15% >15% Debt/Capitalization (2) 60% 55% ~55% Conectiv Energy transaction significantly improved business risk profile and credit metrics (1) 2009 calculatio
Slide 95: Principal Sources & Uses of Cash
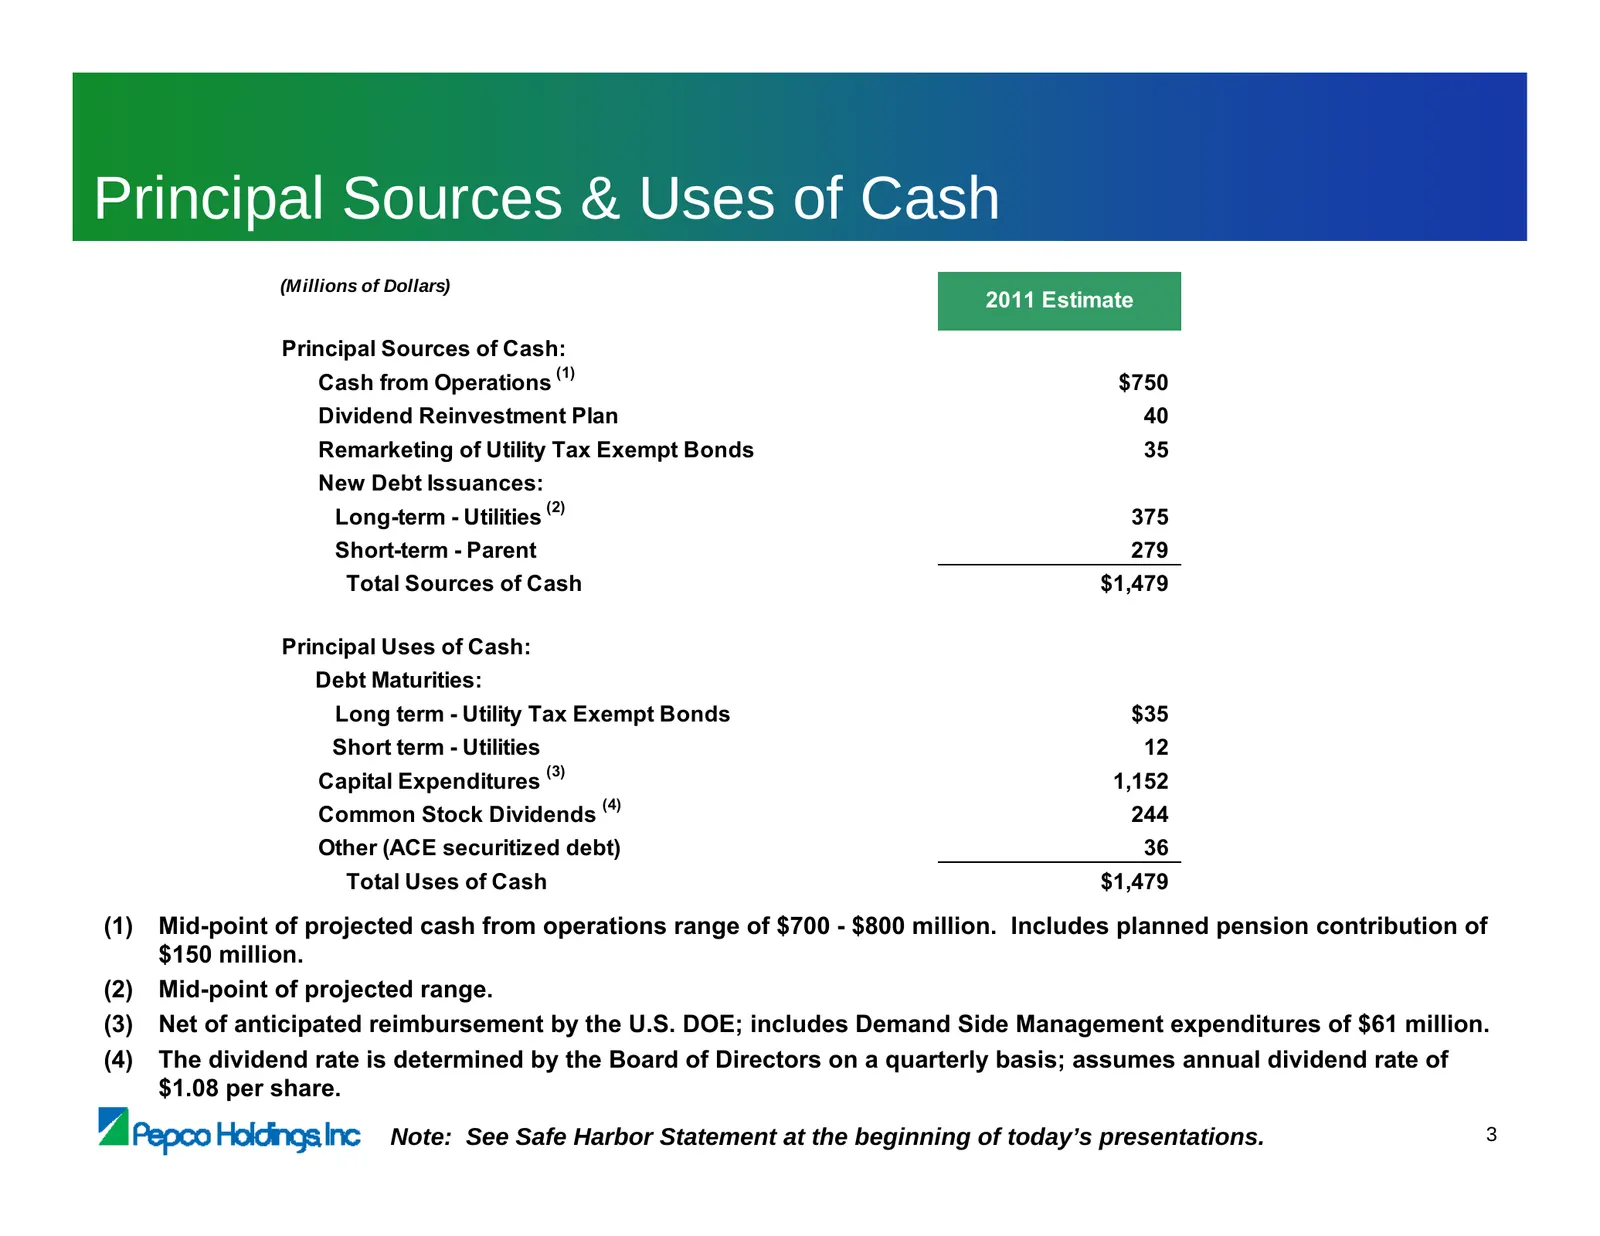
Principal Sources & Uses of Cash (Millions of Dollars) 2011 Estimate Principal Sources of Cash: (1) Cash from Operations $750 Dividend Reinvestment Plan 40 Remarketing of Utility Tax Exempt Bonds 35 New Debt Issuances: (2) Long-term - Utilities 375 Short-term - Parent 279 Total Sources of Cash $1,47
Slide 96: Pension and OPEB Impacts
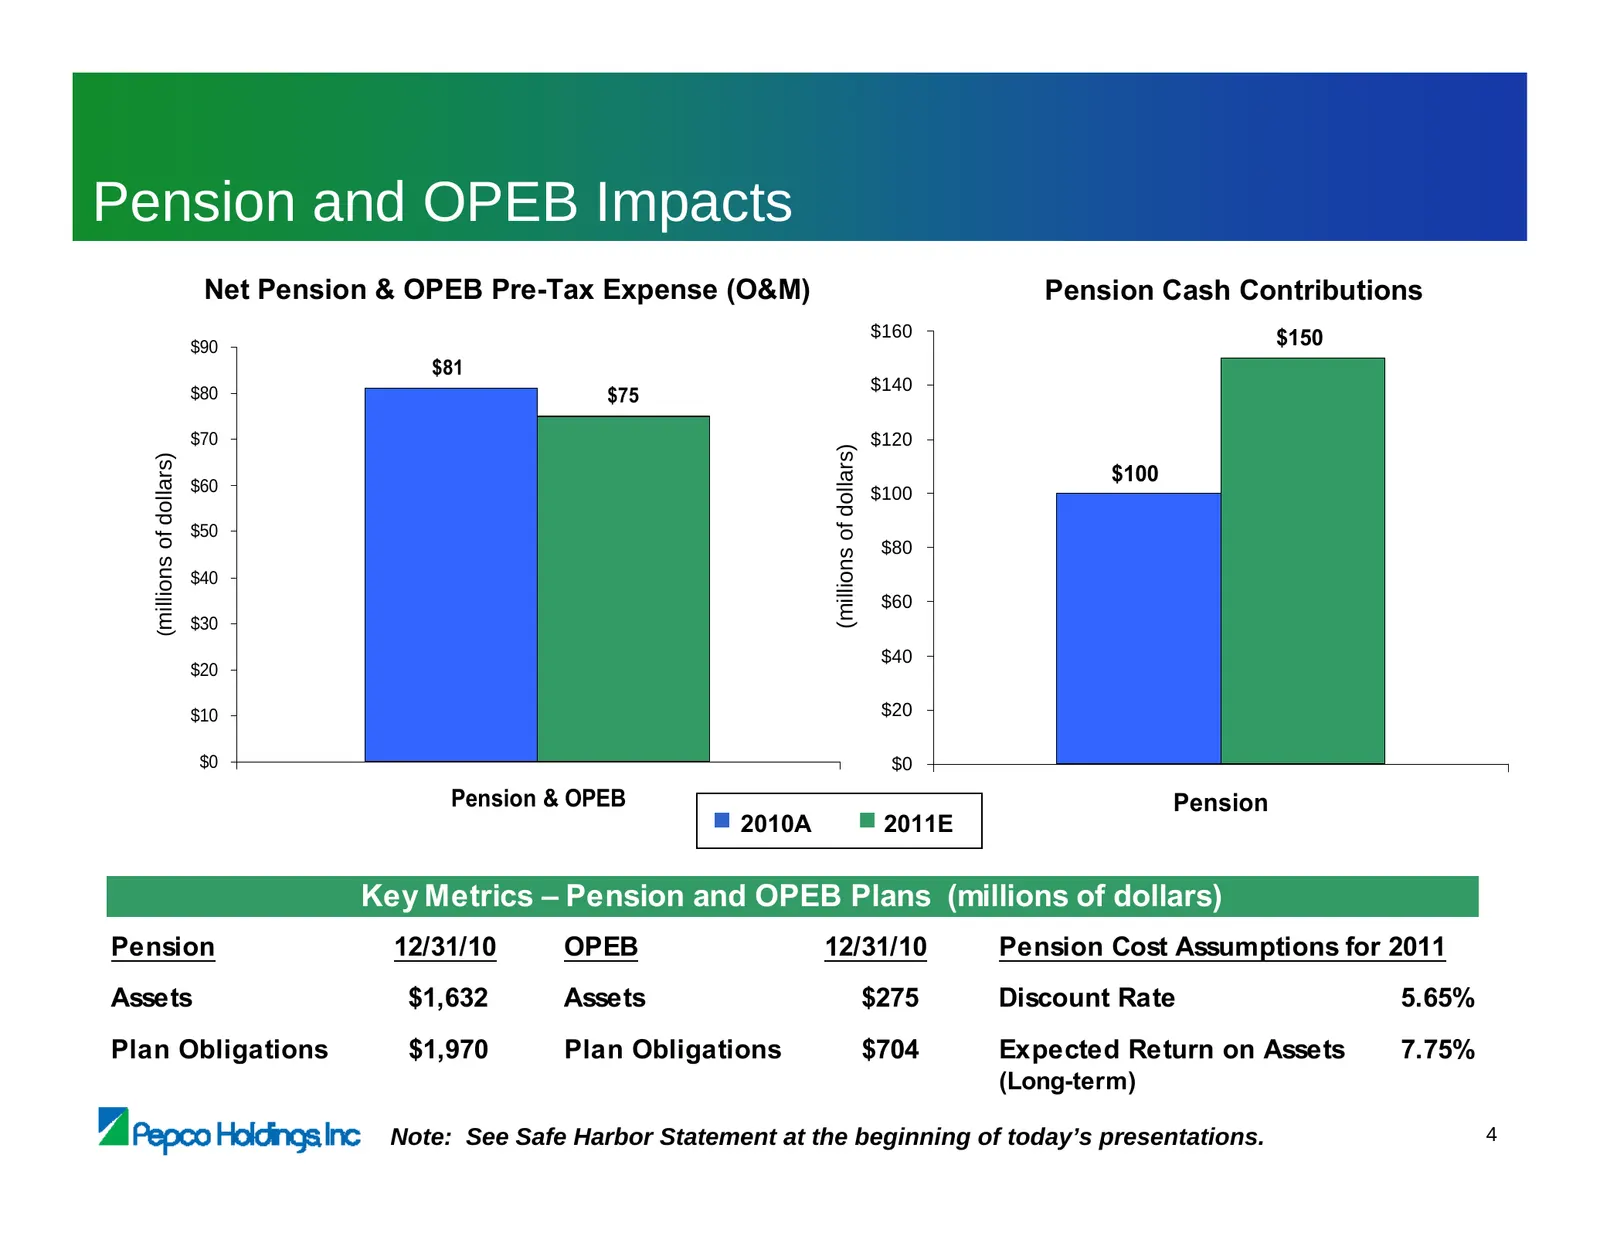
Pension and OPEB Impacts Net Pension & OPEB Pre-Tax Expense (O&M) Pension Cash Contributions $160 $150 $90 $81 $140 $80 $75 $70 $120 (millions of dollars) (millions of dollars) $60 $100 $100 $50 $80 $40 $60 $30 $40 $20 $10 $20 $0 $0 Pension & OPEB Pension ■ 2010A ■ 2011E Key Metrics – Pension and OP
Slide 97: Bonus Depreciation
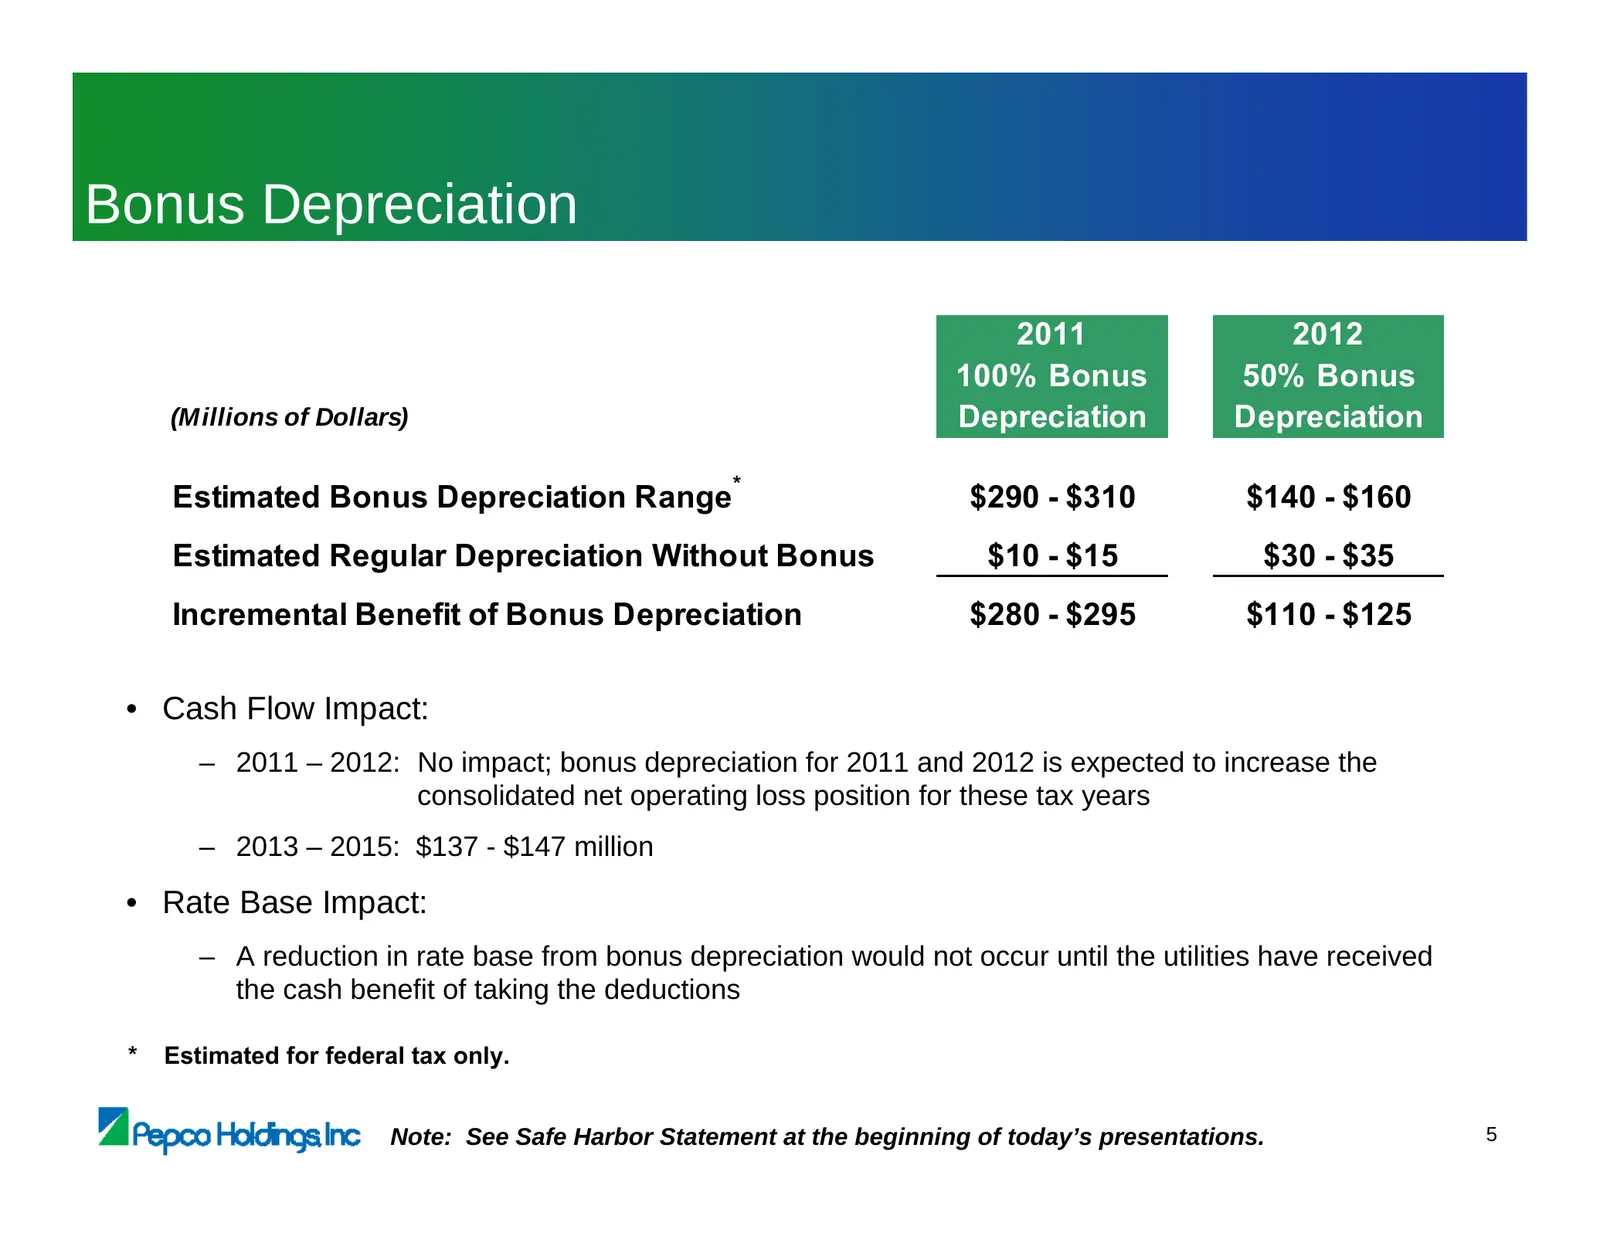
Bonus Depreciation 2011 2012 100% Bonus 50% Bonus (Millions of Dollars) Depreciation Depreciation * Estimated Bonus Depreciation Range $290 - $310 $140 - $160 Estimated Regular Depreciation Without Bonus $10 - $15 $30 - $35 Incremental Benefit of Bonus Depreciation $280 - $295 $110 - $125 • Cash Flo
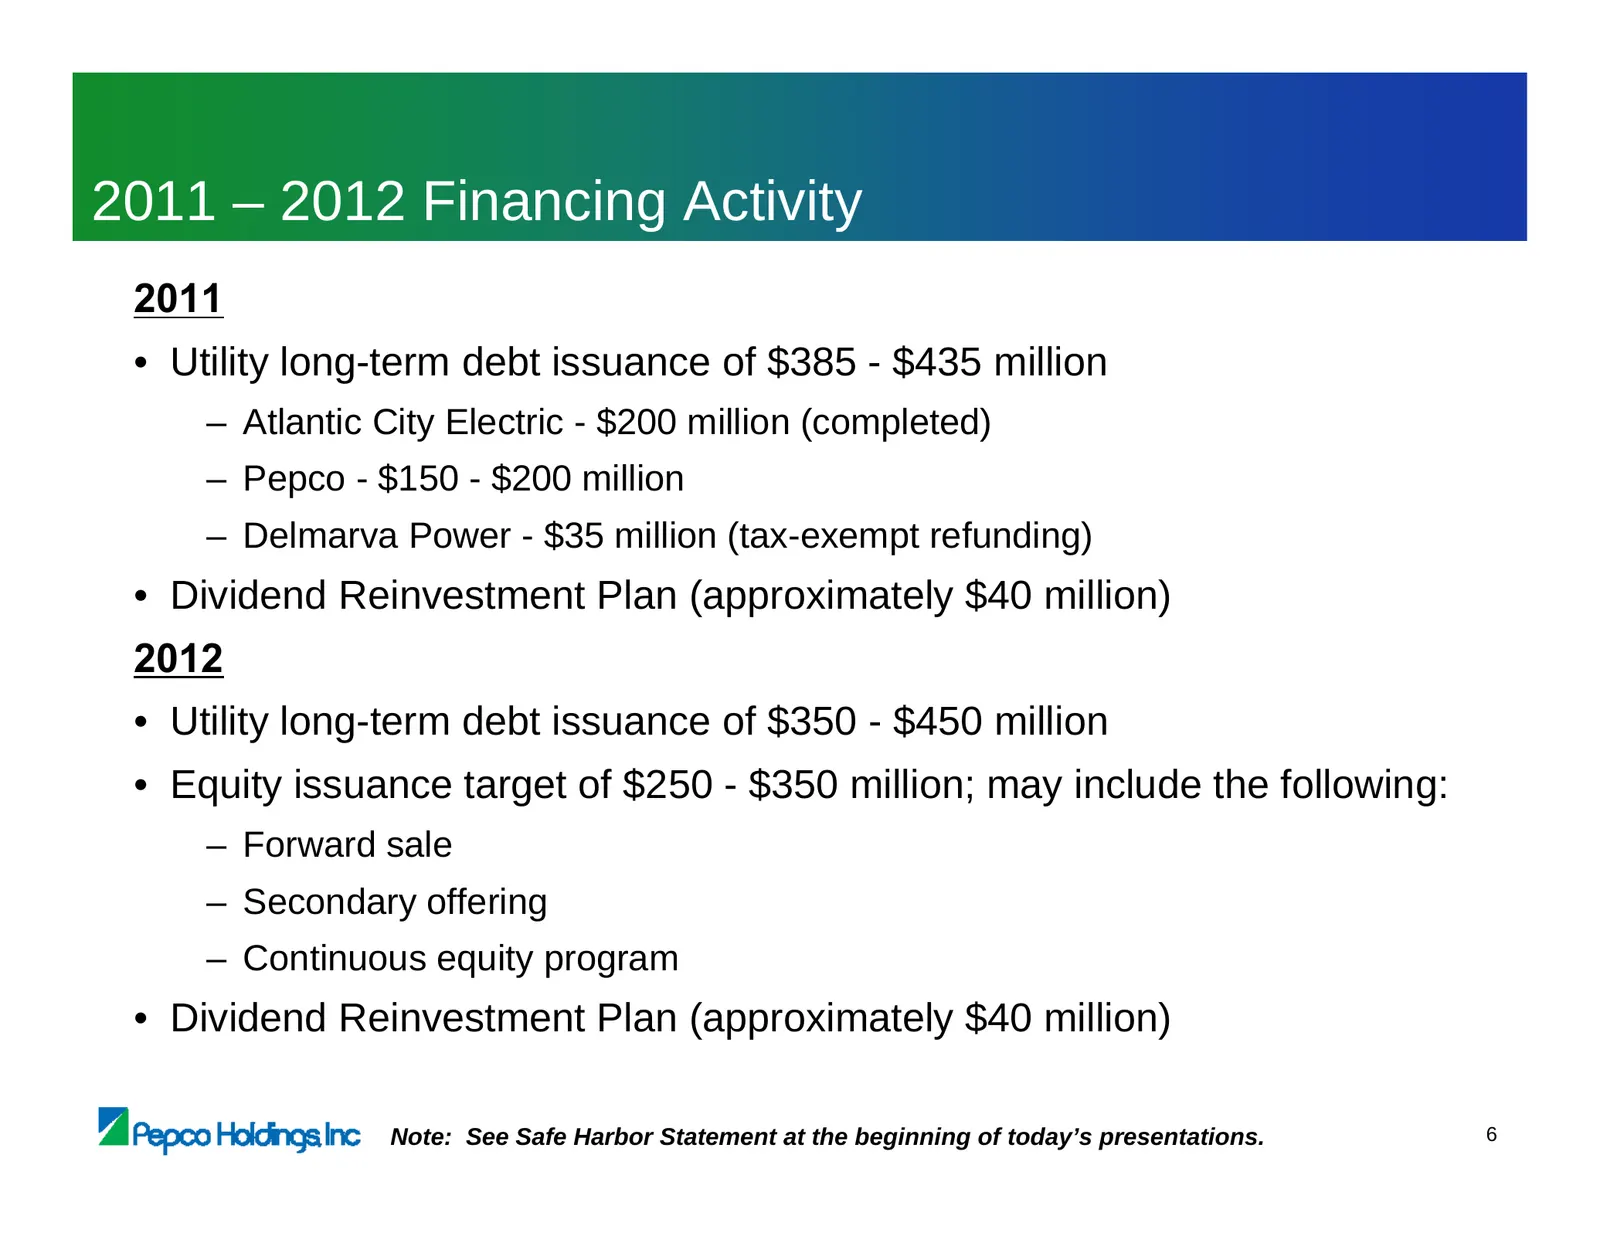
Slide 98: 2011 – 2012 Financing Activity
2011 – 2012 Financing Activity 2011 • Utility long-term debt issuance of $385 - $435 million – Atlantic City Electric - $200 million (completed) – Pepco - $150 - $200 million – Delmarva Power - $35 million (tax-exempt refunding) • Dividend Reinvestment Plan (approximately $40 million) 2012 • Utility
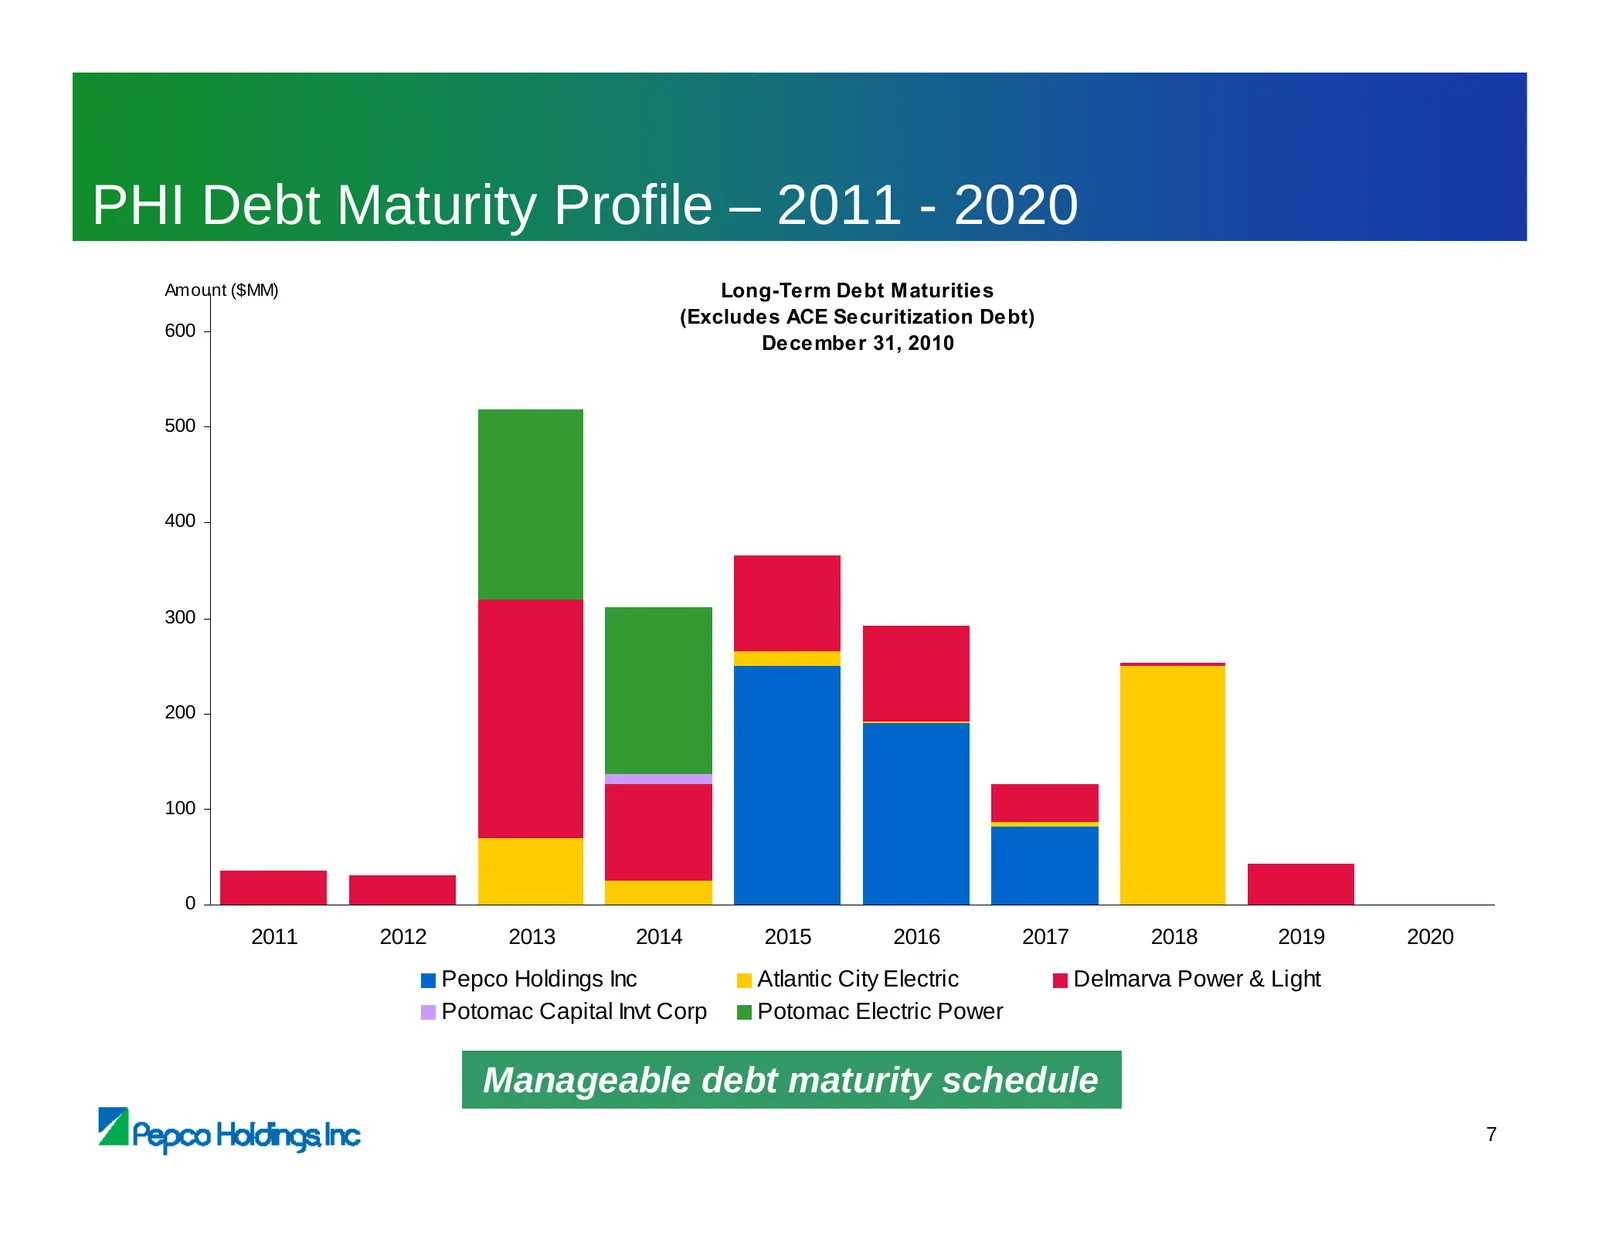
Slide 99: PHI Debt Maturity Profile – 2011 - 2020
PHI Debt Maturity Profile – 2011 - 2020 Amount ($MM) Long-Term Debt Maturities (Excludes ACE Securitization Debt) 600 December 31, 2010 500 400 300 200 100 0 2011 2012 2013 2014 2015 2016 2017 2018 2019 2020 Pepco Holdings Inc Atlantic City Electric Delmarva Power & Light Potomac Capital Invt Corp P
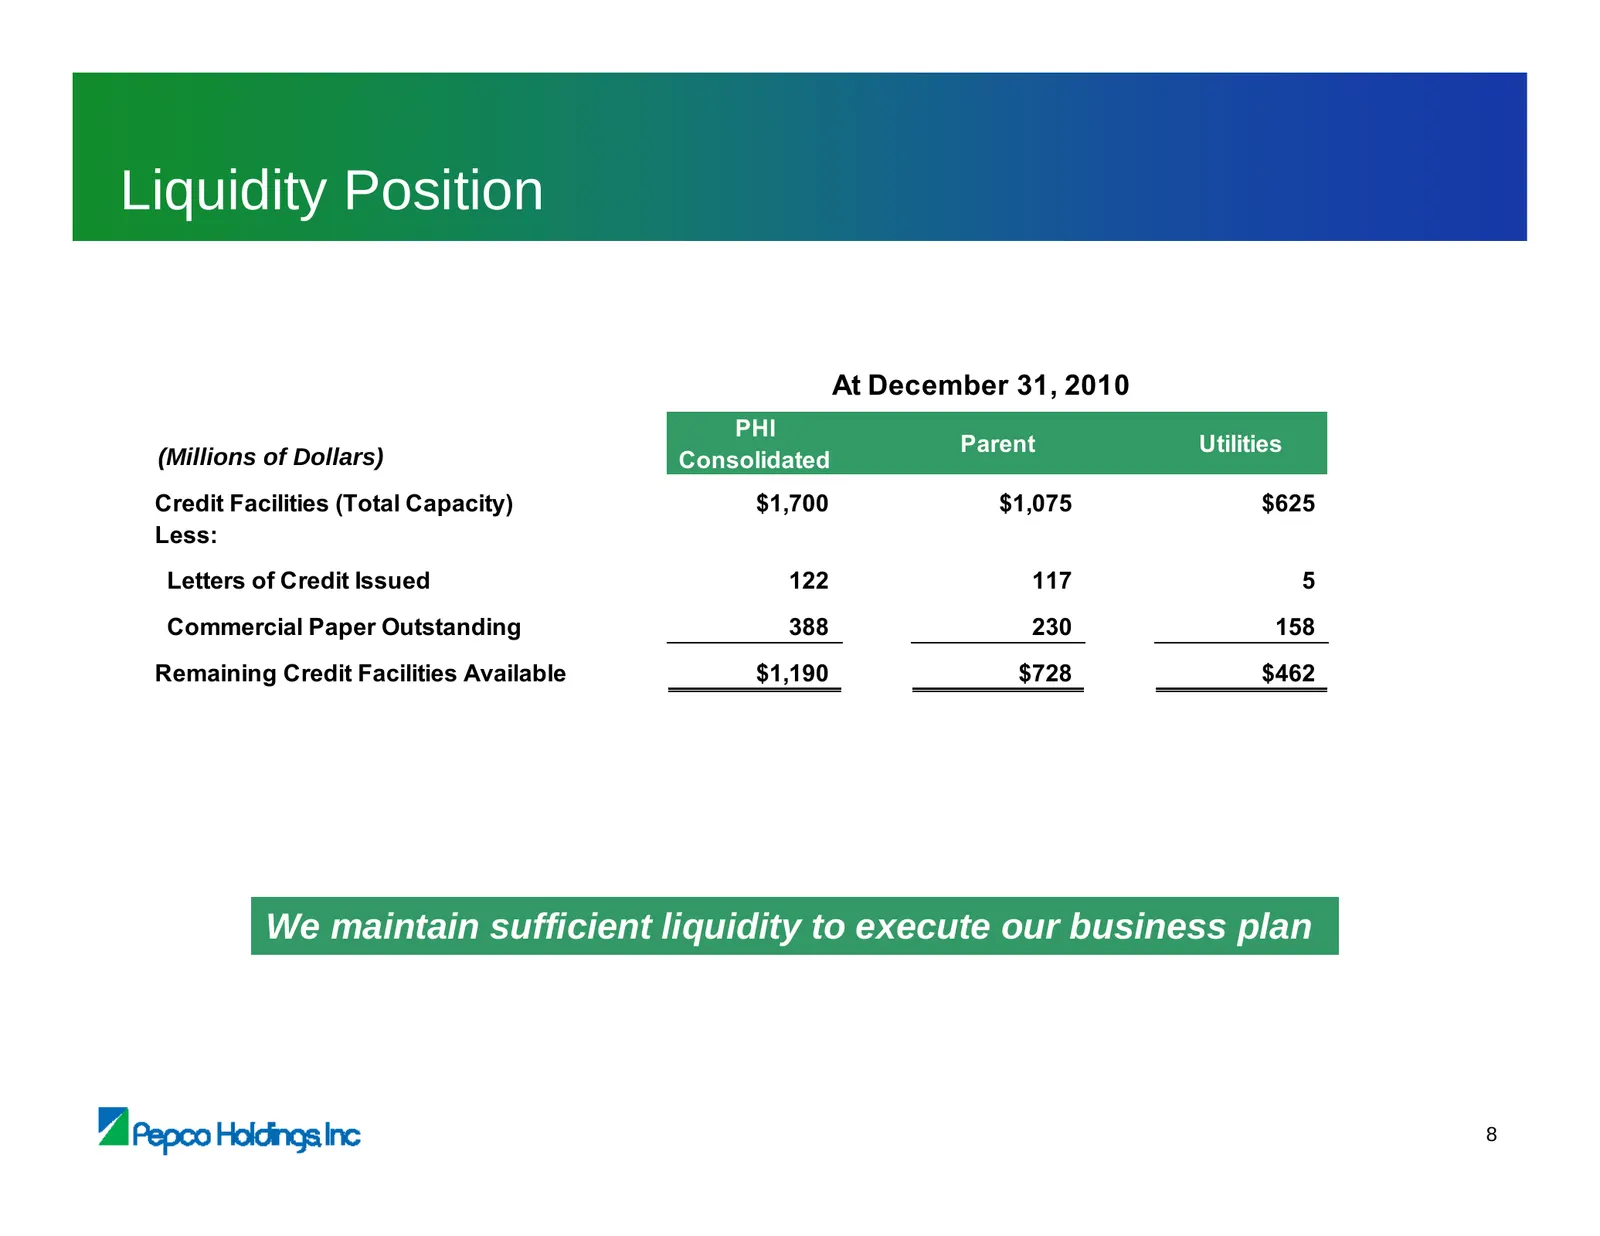
Slide 100: Liquidity Position
Liquidity Position At December 31, 2010 PHI Parent Utilities (Millions of Dollars) Consolidated Credit Facilities (Total Capacity) $1,700 $1,075 $625 Less: Letters of Credit Issued 122 117 5 Commercial Paper Outstanding 388 230 158 Remaining Credit Facilities Available $1,190 $728 $462 We maintain s
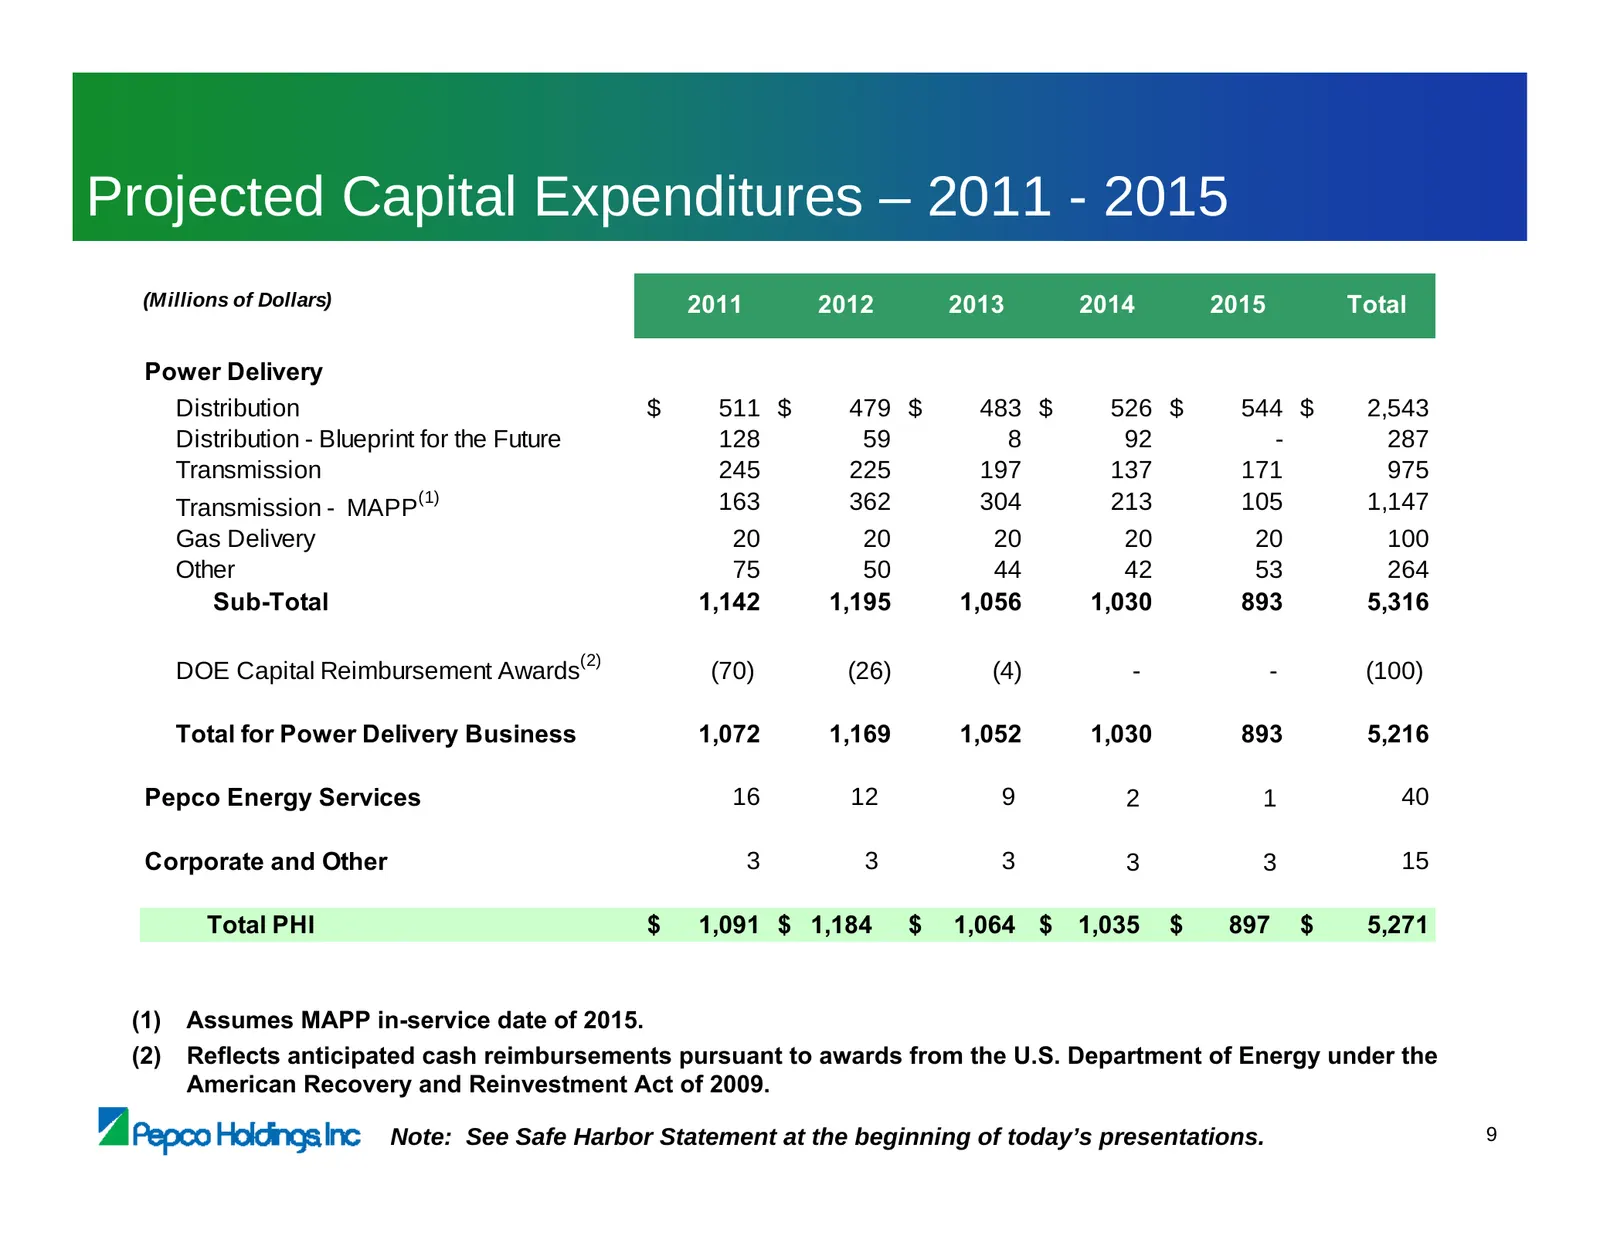
Slide 101: Projected Capital Expenditures – 2011 - 2015
Projected Capital Expenditures – 2011 - 2015 (Millions of Dollars) 2011 2012 2013 2014 2015 Total Power Delivery Distribution $ 511 $ 479 $ 483 $ 526 $ 544 $ 2,543 Distribution - Blueprint for the Future 128 59 8 92 - 287 Transmission 245 225 197 137 171 975 (1) 163 362 304 213 105 1,147 Transmissio
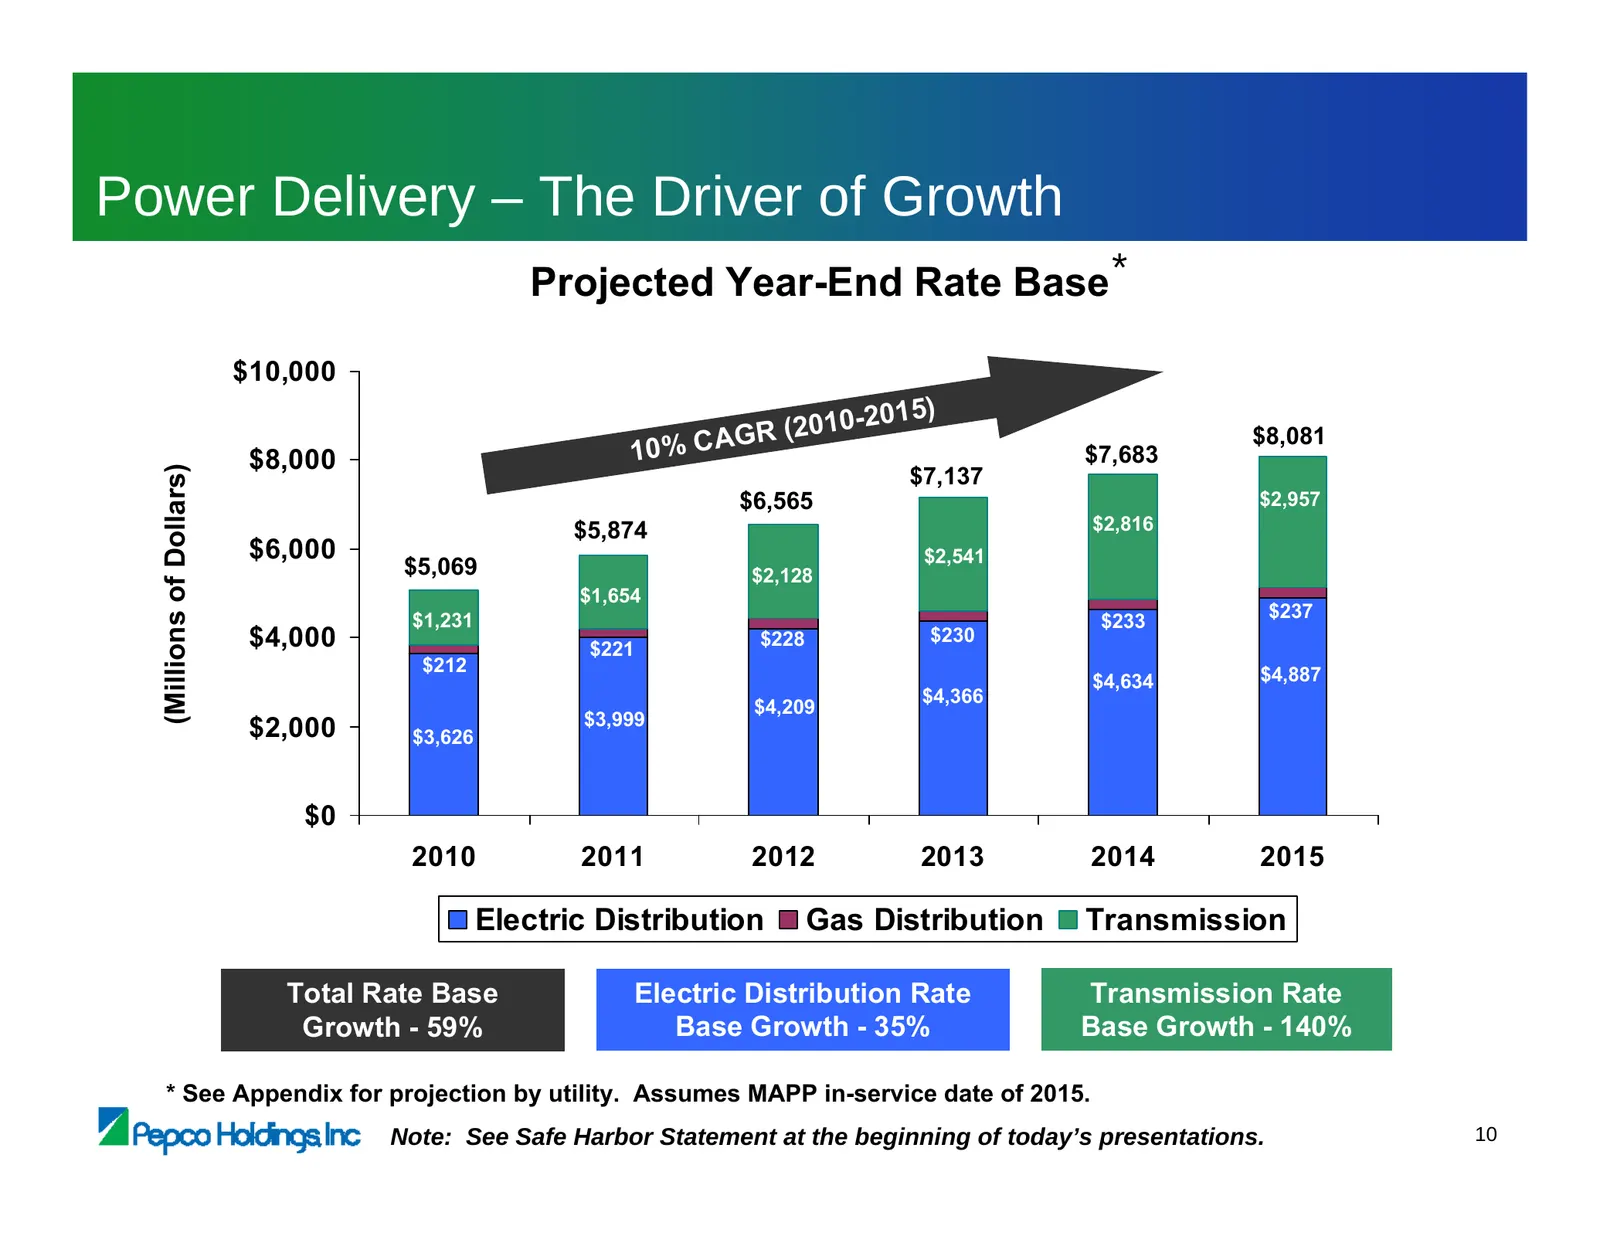
Slide 102: Power Delivery – The Driver of Growth
Power Delivery – The Driver of Growth Projected Year-End Rate Base * $10,000 R ( 2010-2015) G $8,081 $8,000 10% CA $7,683 $7,137 (Millions of Dollars) $6,565 $2,957 $5,874 $2,816 $6,000 $2,541 $5,069 $2,128 $1,654 $1,231 $233 $237 $4,000 $221 $228 $230 $212 $4,887 $4,634 $4,366 $4,209 $3,999 $2,000
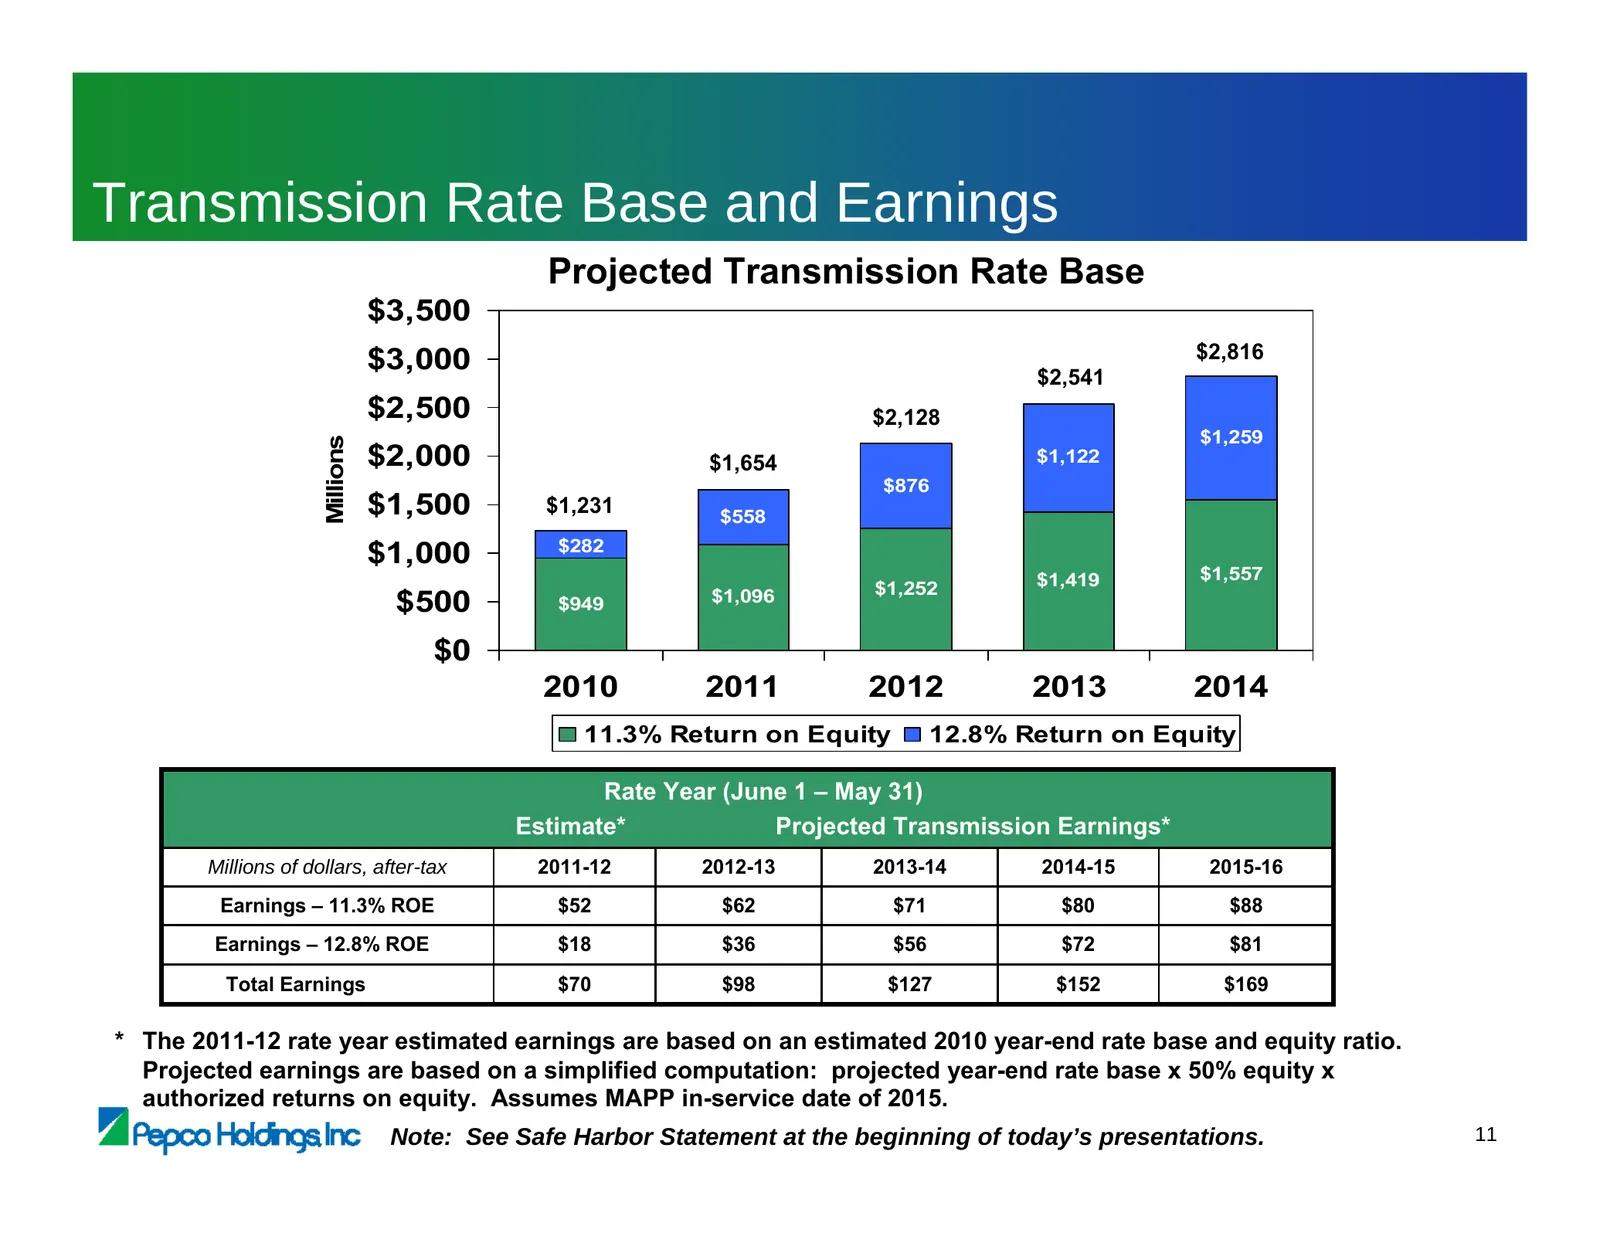
Slide 103: Transmission Rate Base and Earnings
Transmission Rate Base and Earnings Projected Transmission Rate Base $3,500 $3,000 $2,816 $2,541 $2,500 $2,128 $1,259 Millions $2,000 $1,654 $1,122 $876 $1,500 $1,231 $558 $282 $1,000 $1,419 $1,557 $1,252 $500 $949 $1,096 $0 2010 2011 2012 2013 2014 11.3% Return on Equity 12.8% Return on Equity Rate
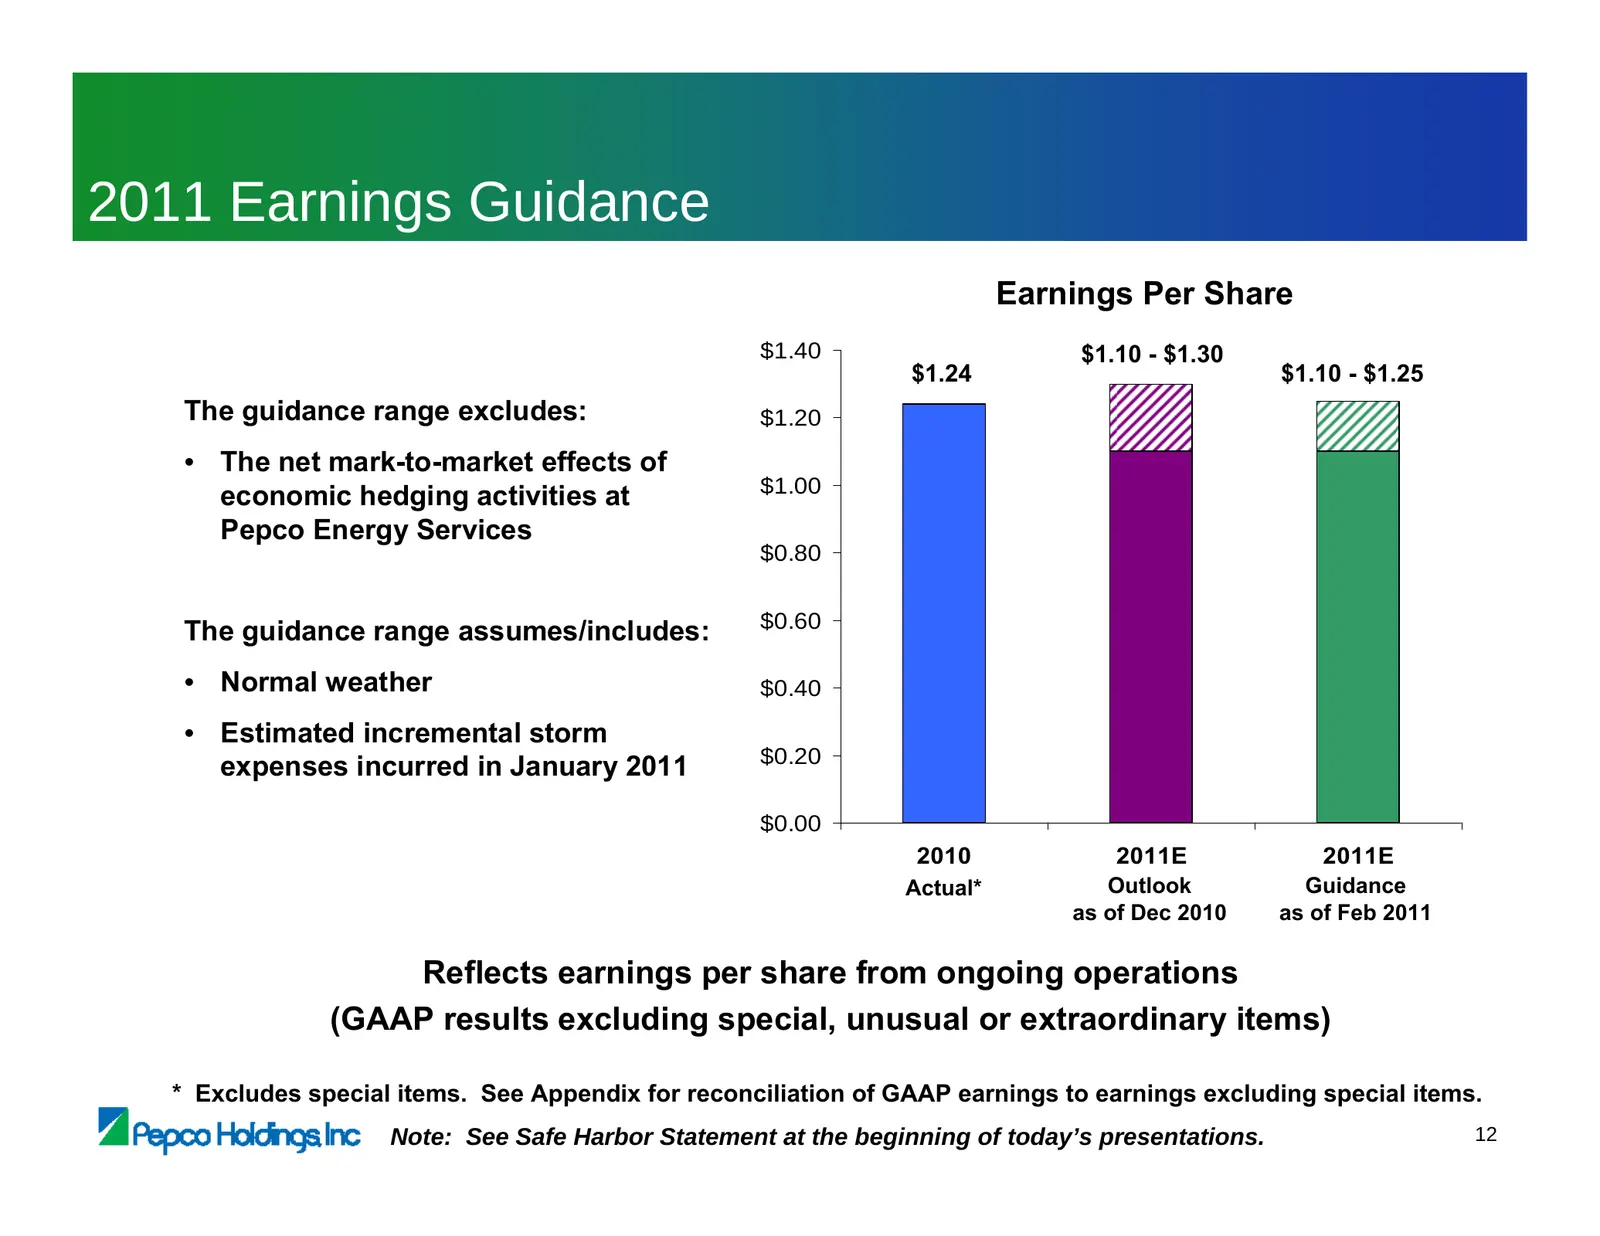
Slide 104: 2011 Earnings Guidance
2011 Earnings Guidance Earnings Per Share $1.40 $1.10 - $1.30 $1.24 $1.10 - $1.25 The guidance range excludes: $1.20 • The net mark-to-market effects of $1.00 economic hedging activities at Pepco Energy Services $0.80 $0.60 The guidance range assumes/includes: • Normal weather $0.40 • Estimated incr
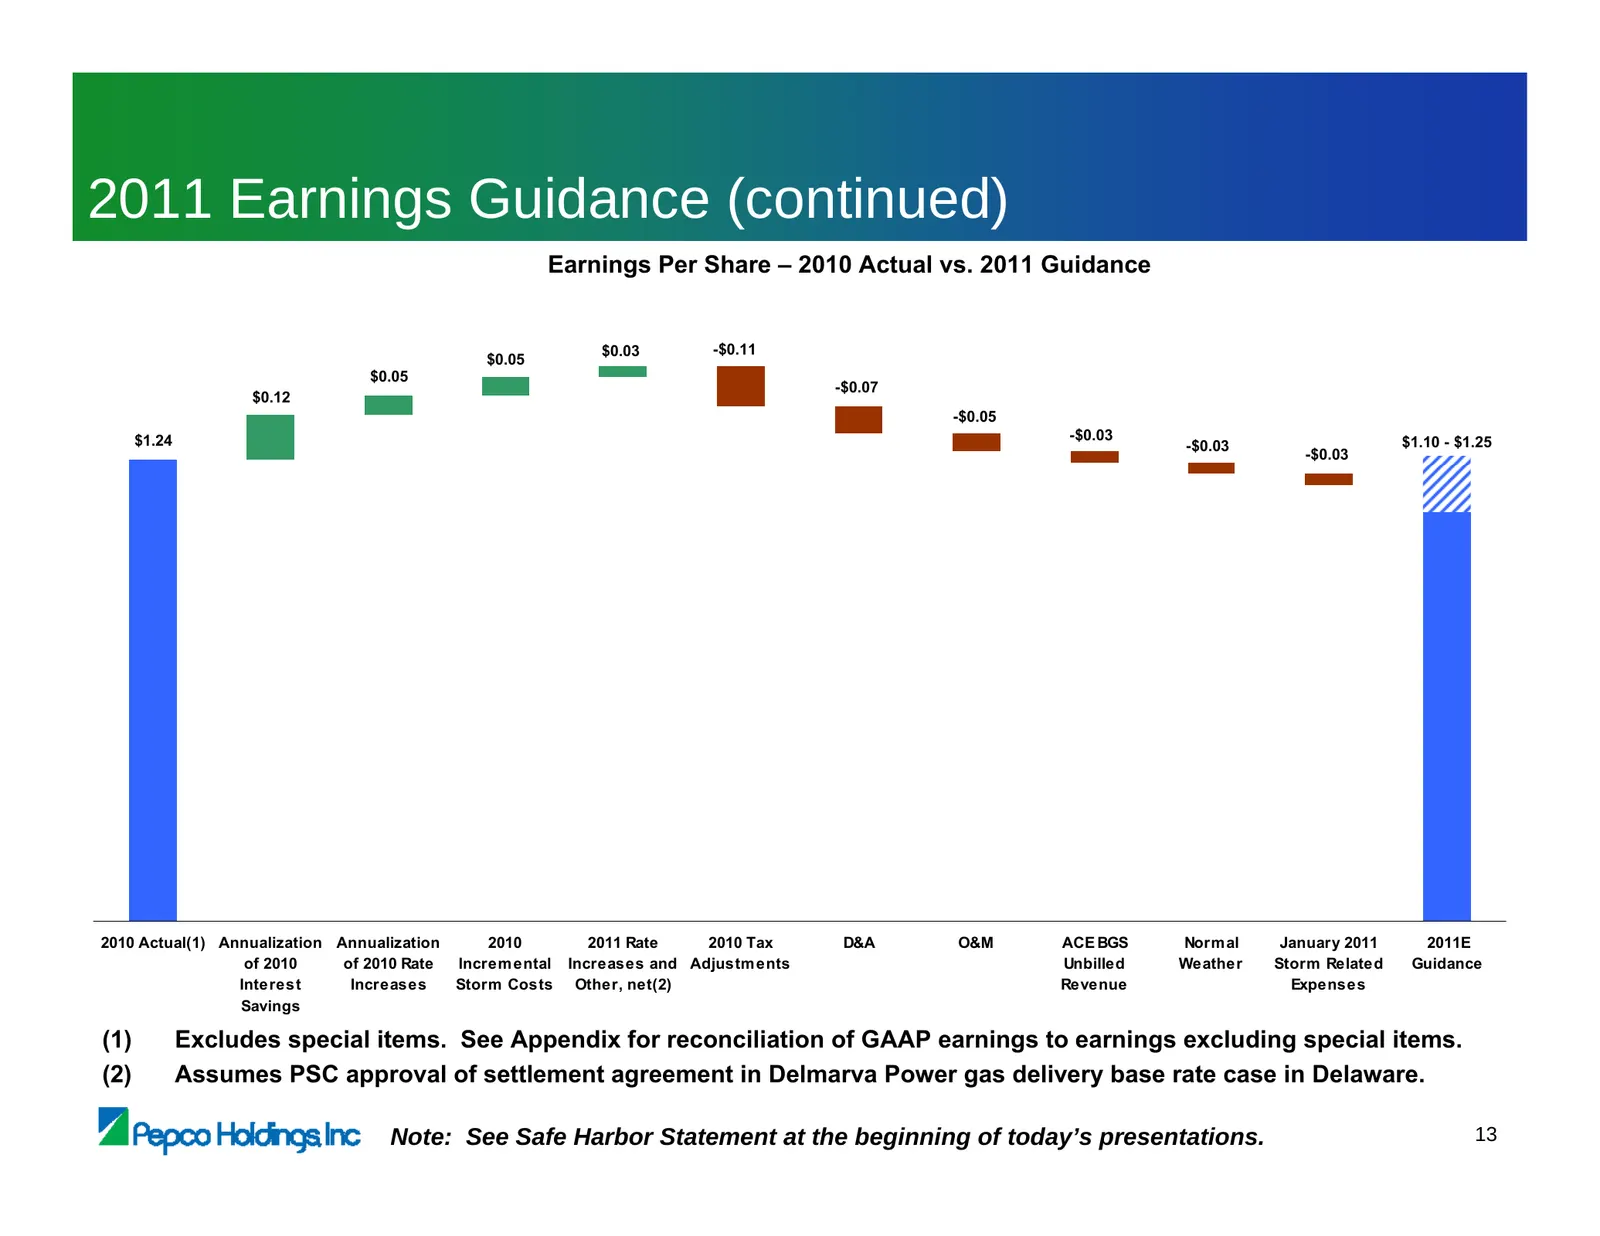
Slide 105: 2011 Earnings Guidance (continued)
2011 Earnings Guidance (continued) Earnings Per Share – 2010 Actual vs. 2011 Guidance $0.03 -$0.11 $0.05 $0.05 -$0.07 $0.12 -$0.05 $1.24 -$0.03 $1.10 - $1.25 -$0.03 -$0.03 2010 Actual(1) Annualization Annualization 2010 2011 Rate 2010 Tax D&A O&M ACE BGS Norm al January 2011 2011E of 2010 of 2010 Ra
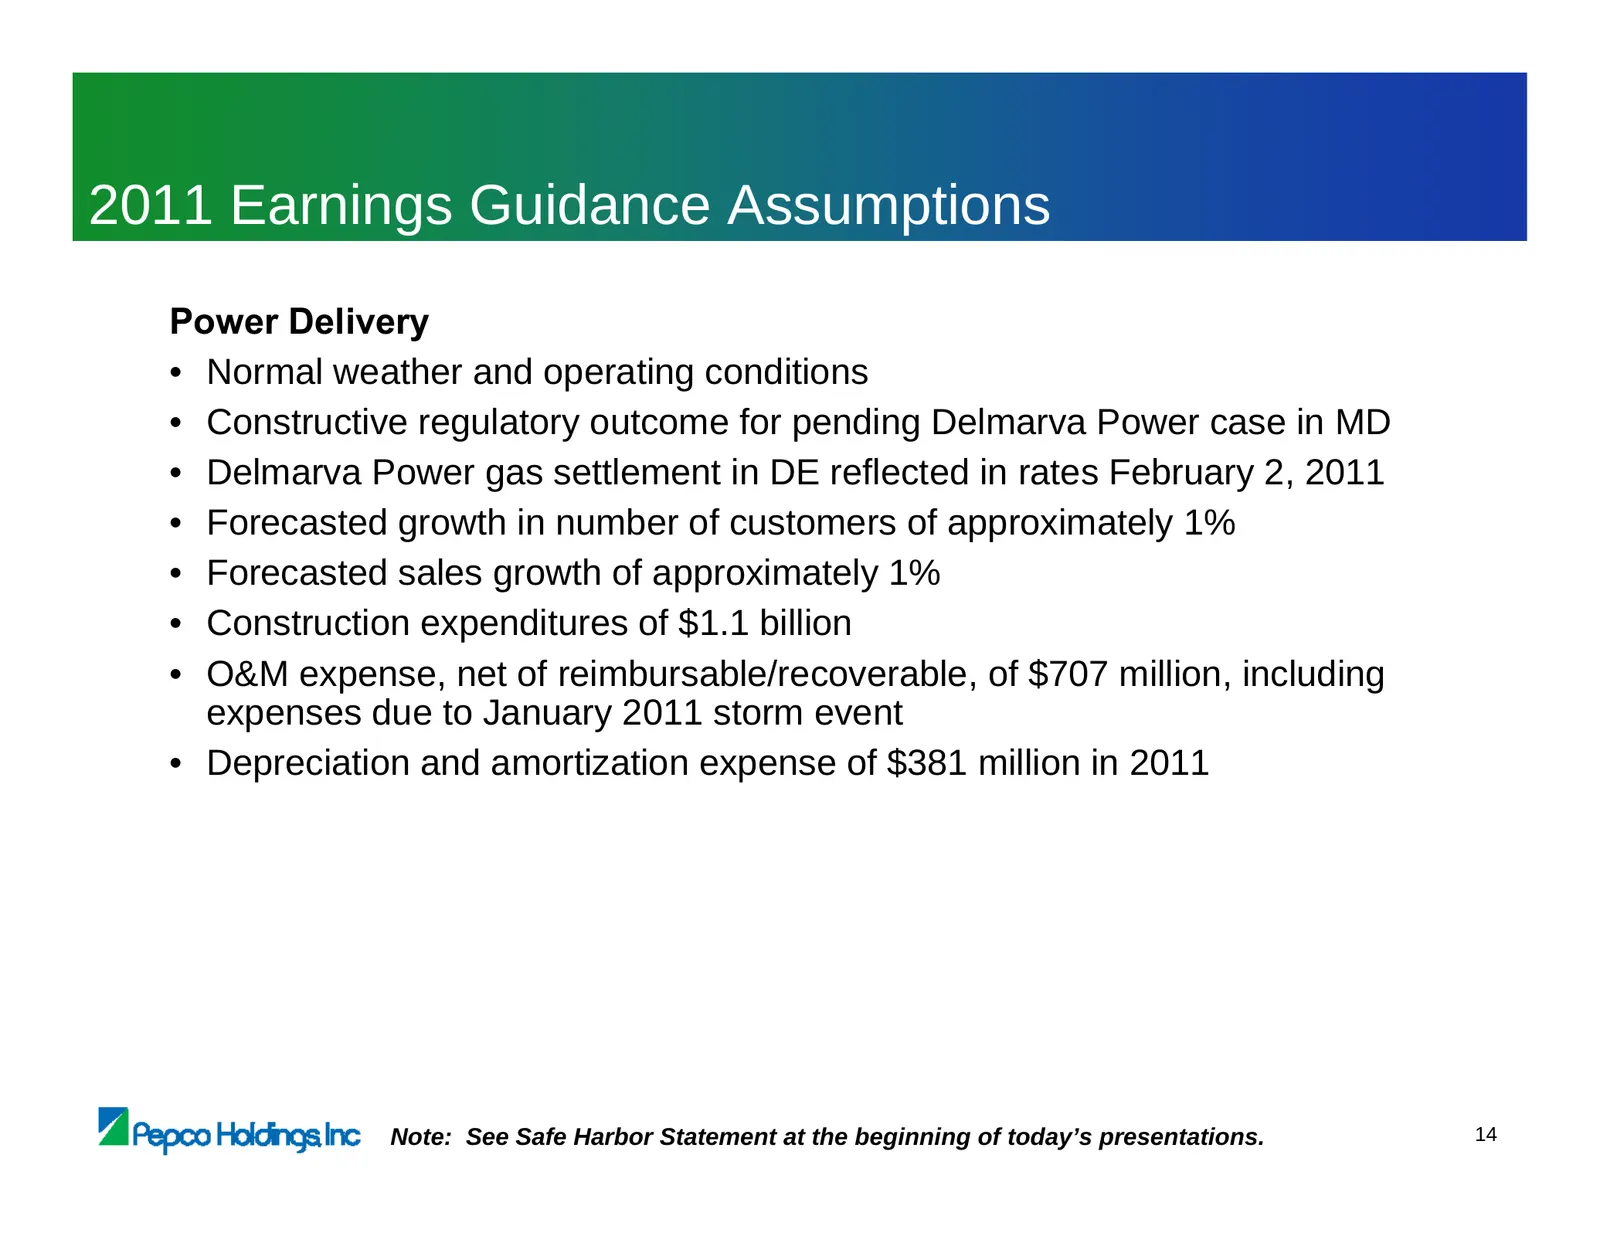
Slide 106: 2011 Earnings Guidance Assumptions
2011 Earnings Guidance Assumptions Power Delivery • Normal weather and operating conditions • Constructive regulatory outcome for pending Delmarva Power case in MD • Delmarva Power gas settlement in DE reflected in rates February 2, 2011 • Forecasted growth in number of customers of approximately 1%
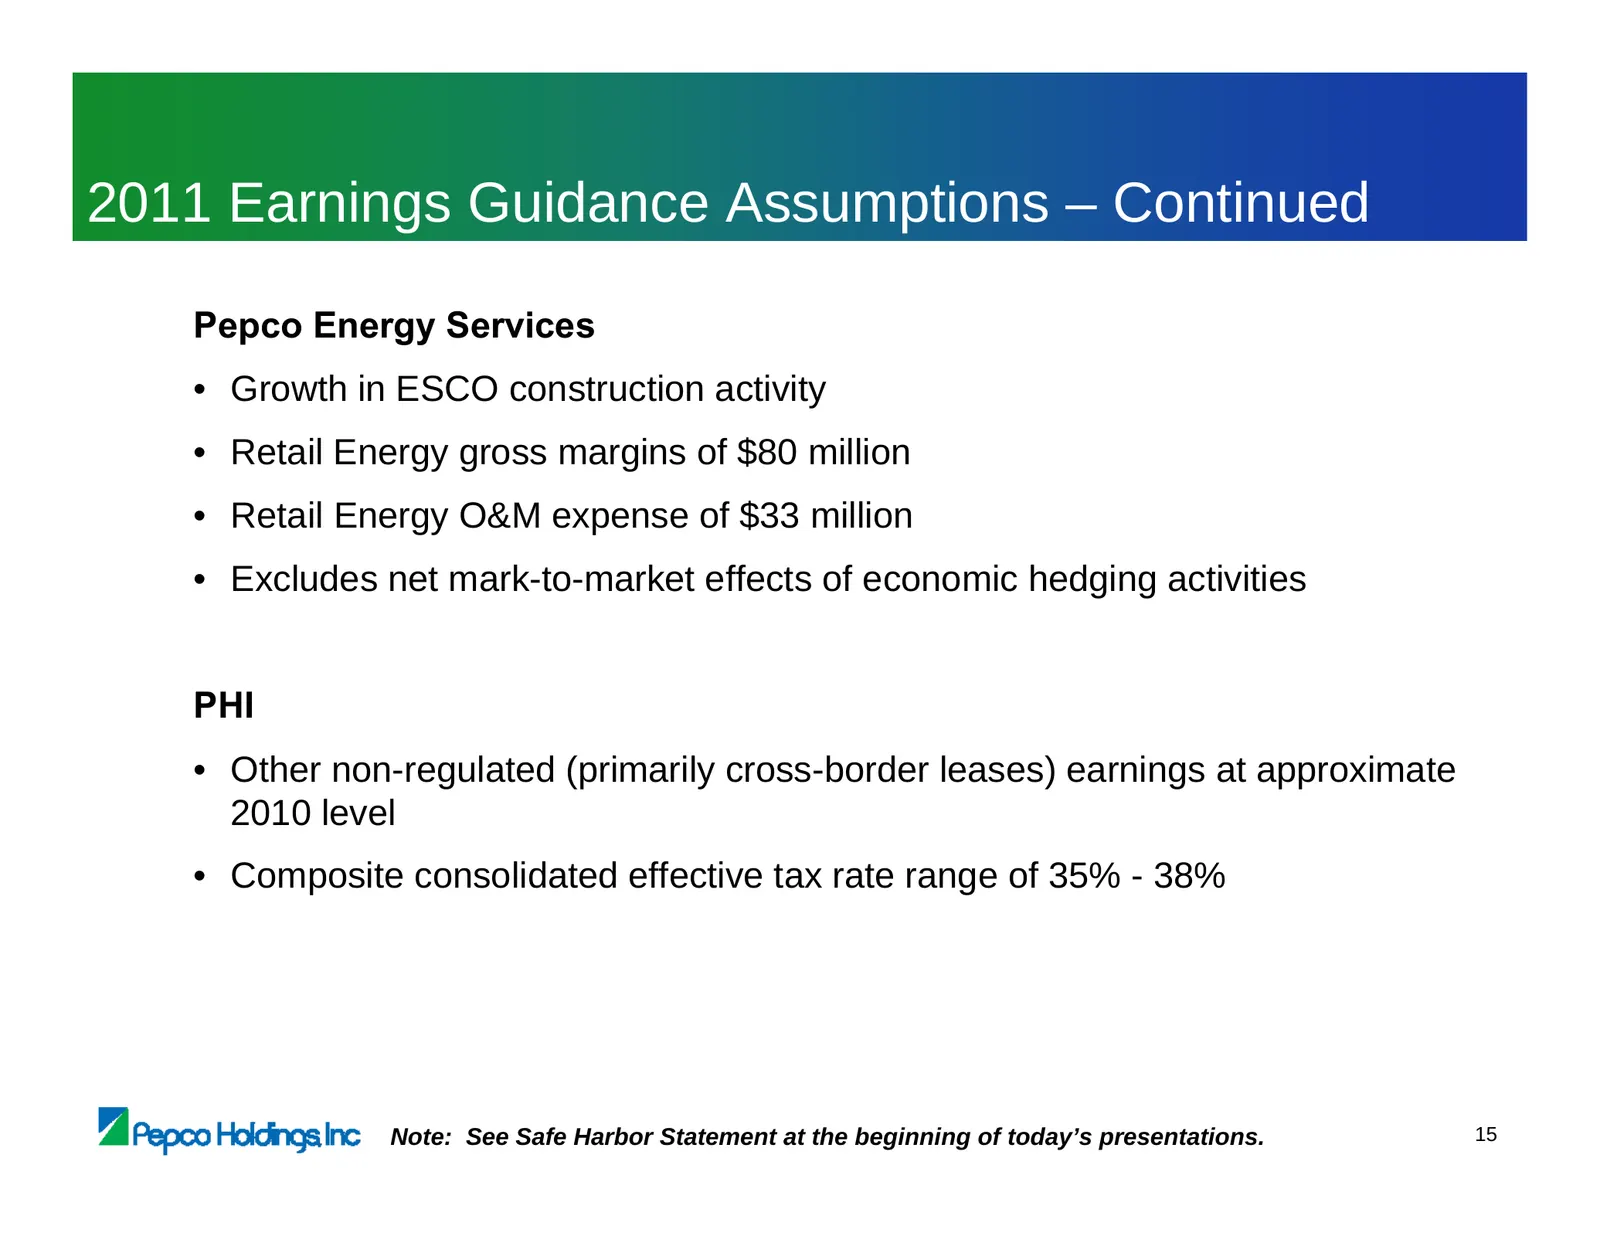
Slide 107: 2011 Earnings Guidance Assumptions – Continued
2011 Earnings Guidance Assumptions – Continued Pepco Energy Services • Growth in ESCO construction activity • Retail Energy gross margins of $80 million • Retail Energy O&M expense of $33 million • Excludes net mark-to-market effects of economic hedging activities PHI • Other non-regulated (primaril
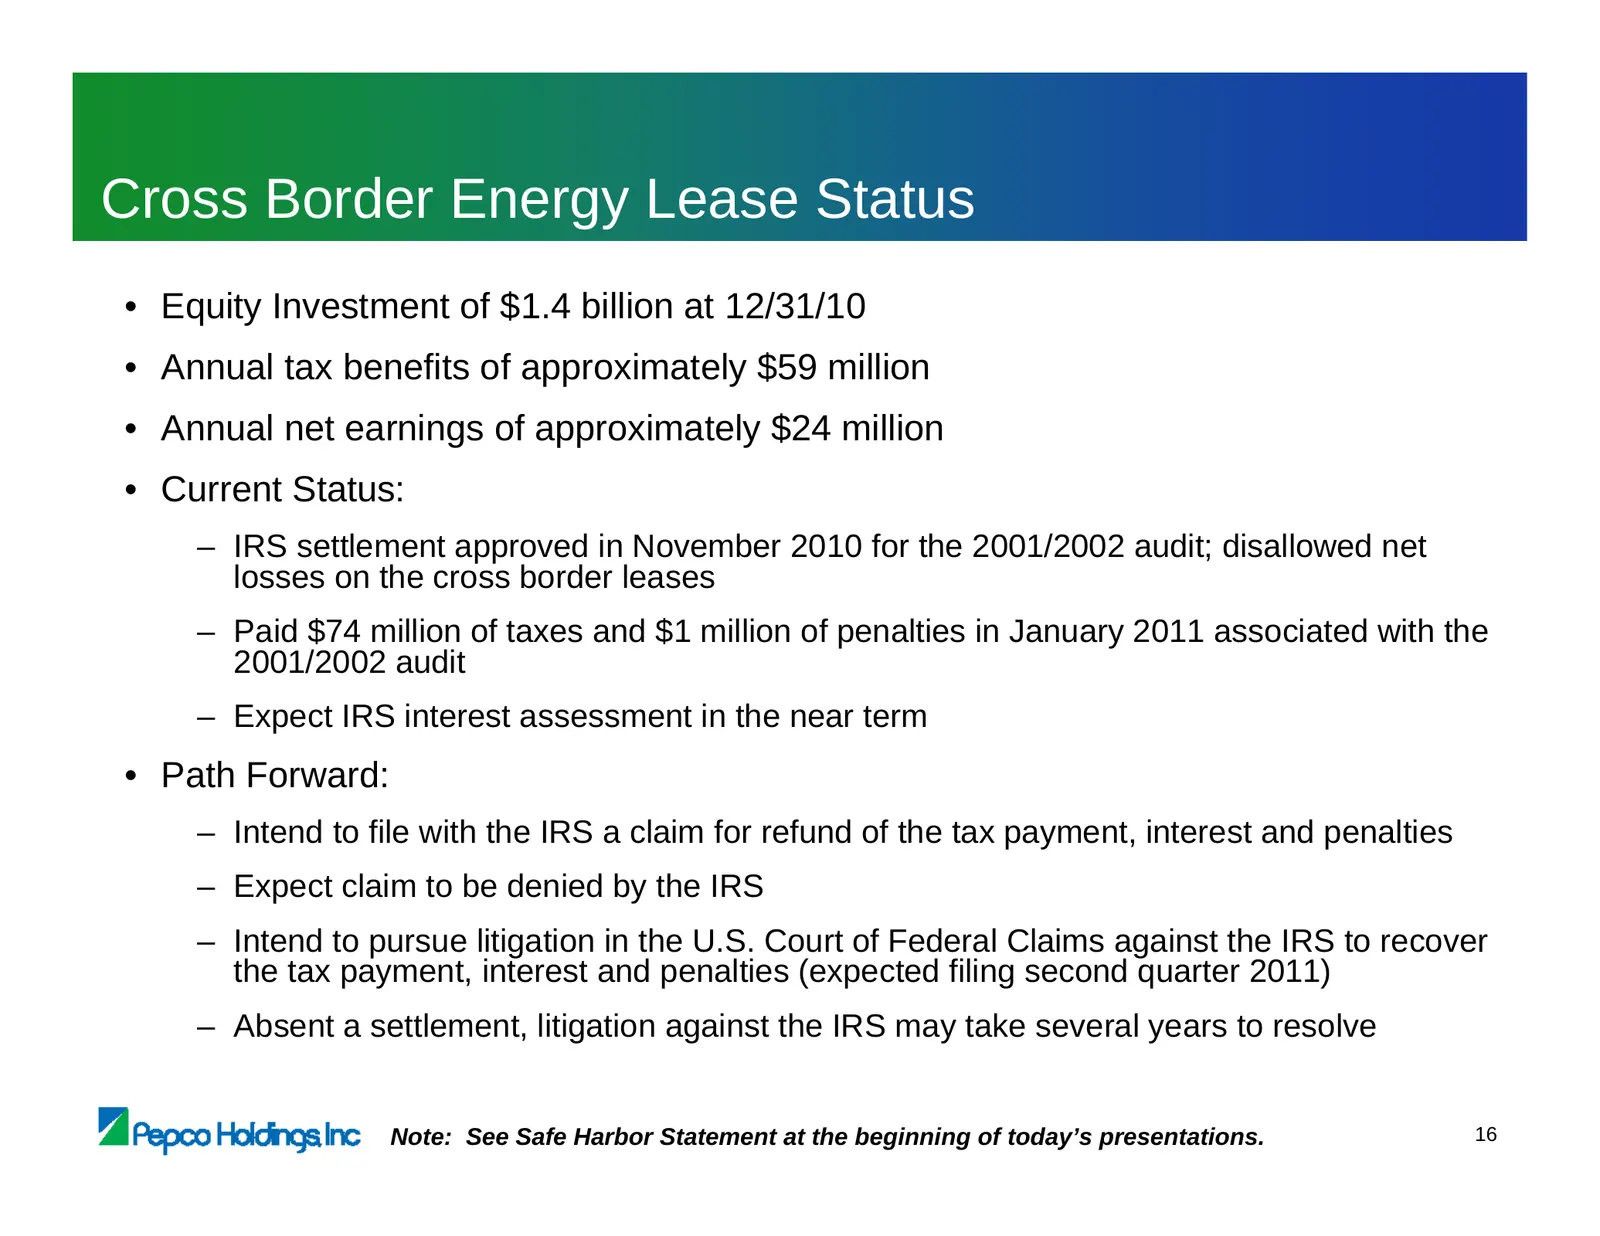
Slide 108: Cross Border Energy Lease Status
Cross Border Energy Lease Status • Equity Investment of $1.4 billion at 12/31/10 • Annual tax benefits of approximately $59 million • Annual net earnings of approximately $24 million • Current Status: – IRS settlement approved in November 2010 for the 2001/2002 audit; disallowed net losses on the cr
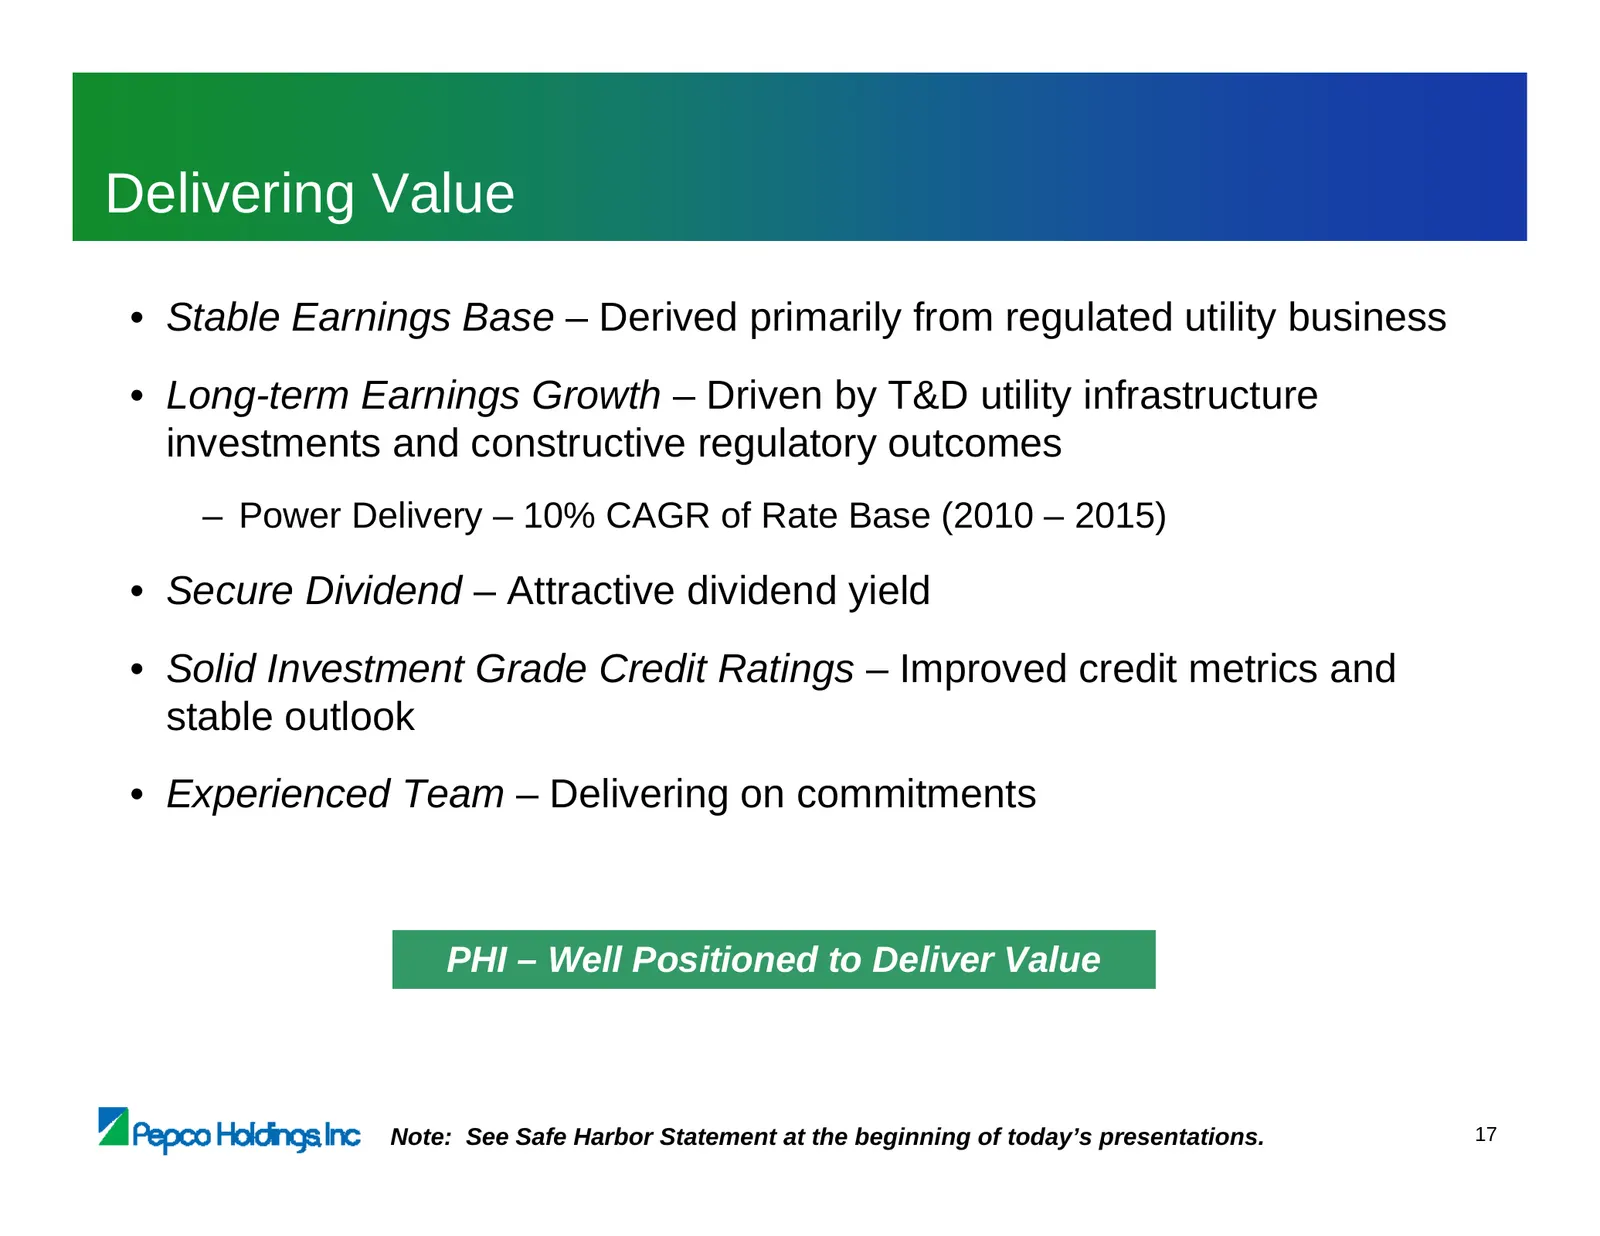
Slide 109: Delivering Value
Delivering Value • Stable Earnings Base – Derived primarily from regulated utility business • Long-term Earnings Growth – Driven by T&D utility infrastructure investments and constructive regulatory outcomes – Power Delivery – 10% CAGR of Rate Base (2010 – 2015) • Secure Dividend – Attractive divide
Slide 110: Financial Overview
Financial Overview Tony Kamerick Senior Vice President & Chief Financial Officer
Slide 111: Appendix
Appendix VA Pepco Holdings inc
Slide 112: Sales and Financial Information – Potomac Electric Power
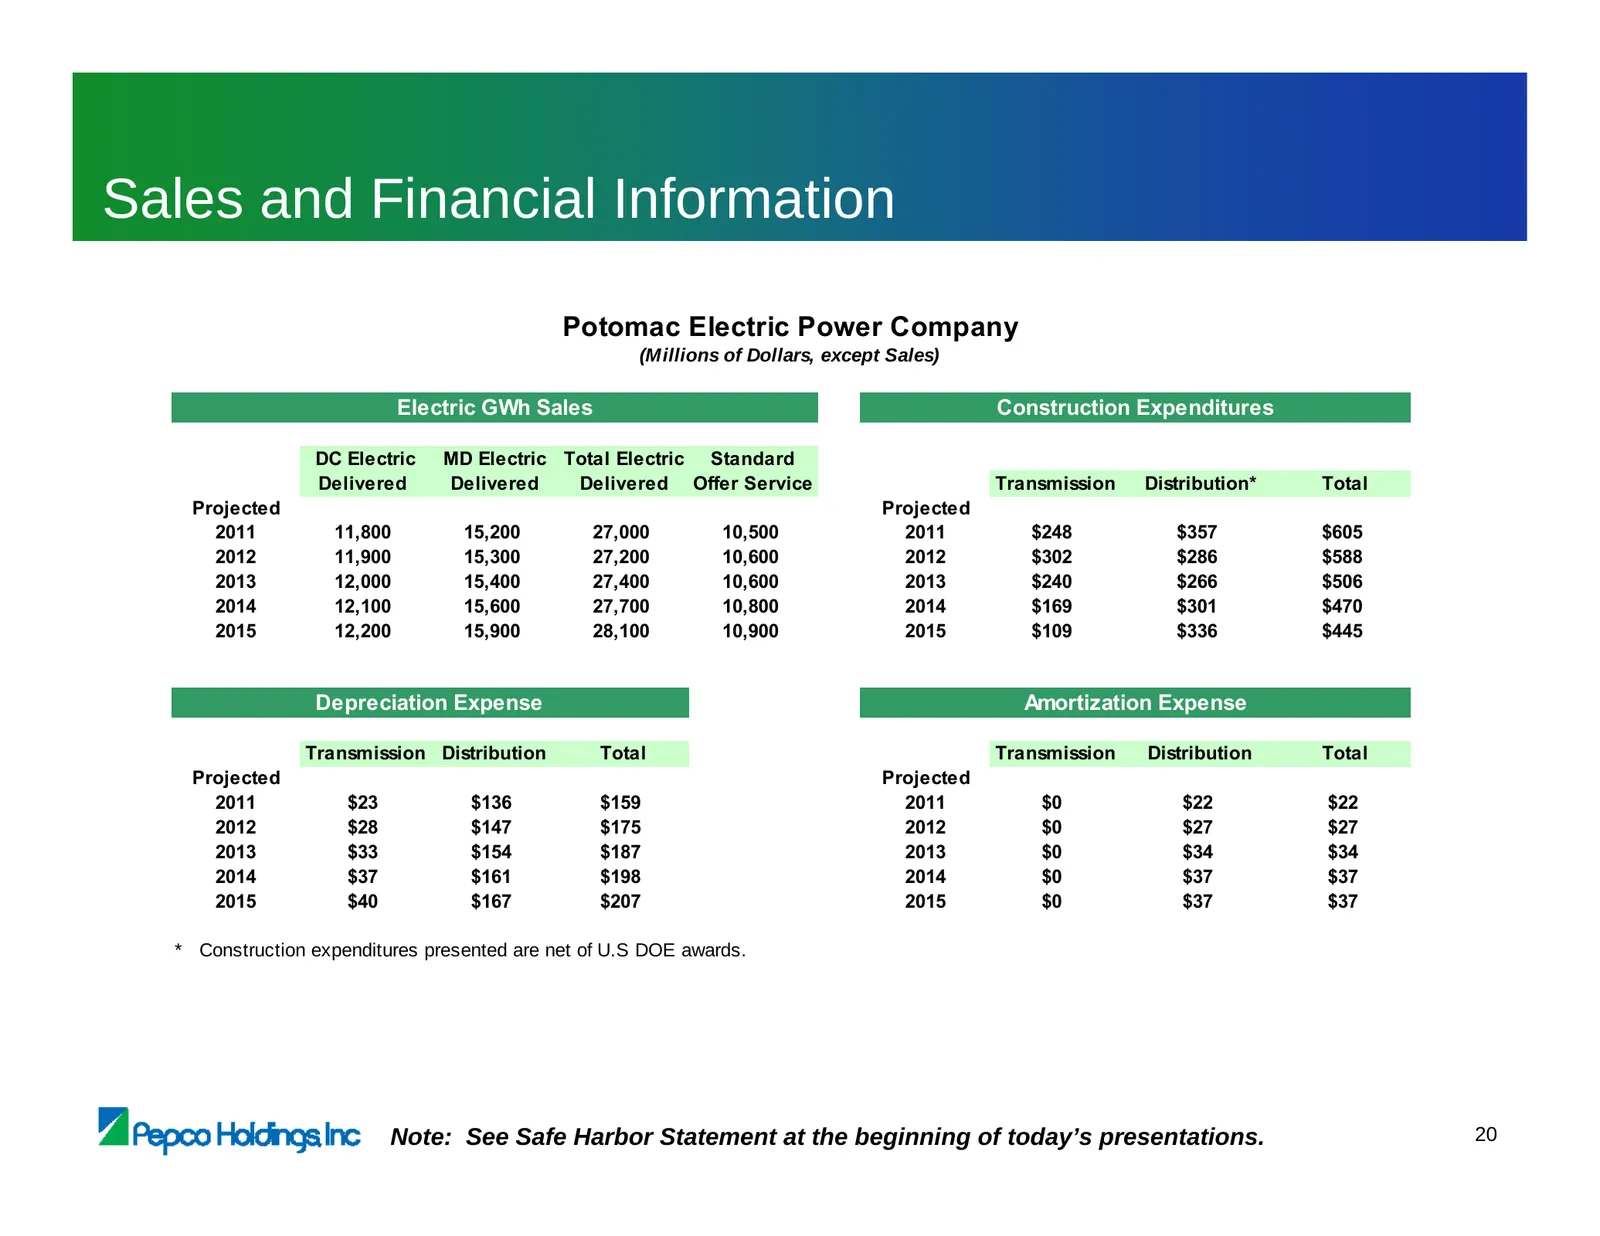
Sales and Financial Information Potomac Electric Power Company (Millions of Dollars, except Sales) Electric GWh Sales Construction Expenditures DC Electric MD Electric Total Electric Standard Delivered Delivered Delivered Offer Service Transmission Distribution* Total Projected Projected 2011 11,800
Slide 113: Sales and Financial Information – Delmarva Power & Light
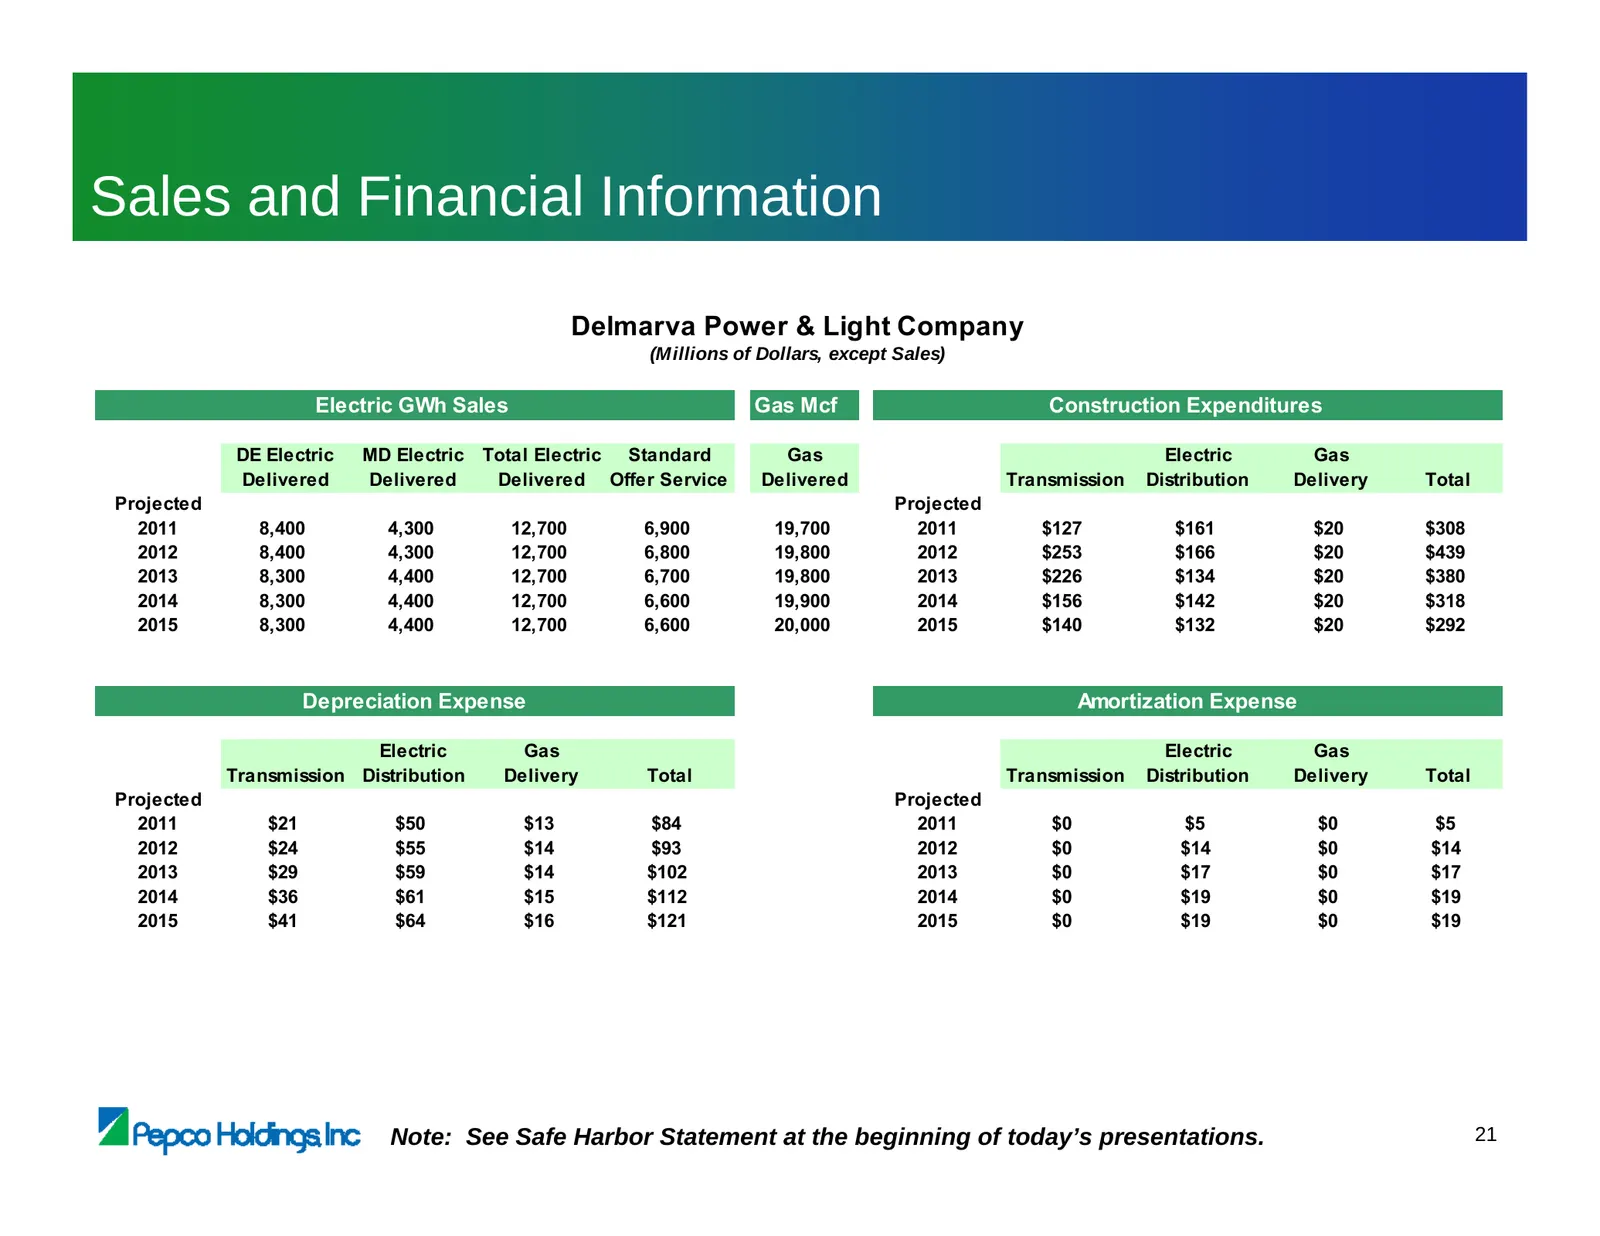
Sales and Financial Information Delmarva Power & Light Company (Millions of Dollars, except Sales) Electric GWh Sales Gas Mcf Construction Expenditures DE Electric MD Electric Total Electric Standard Gas Electric Gas Delivered Delivered Delivered Offer Service Delivered Transmission Distribution Del
Slide 114: Sales and Financial Information – Atlantic City Electric
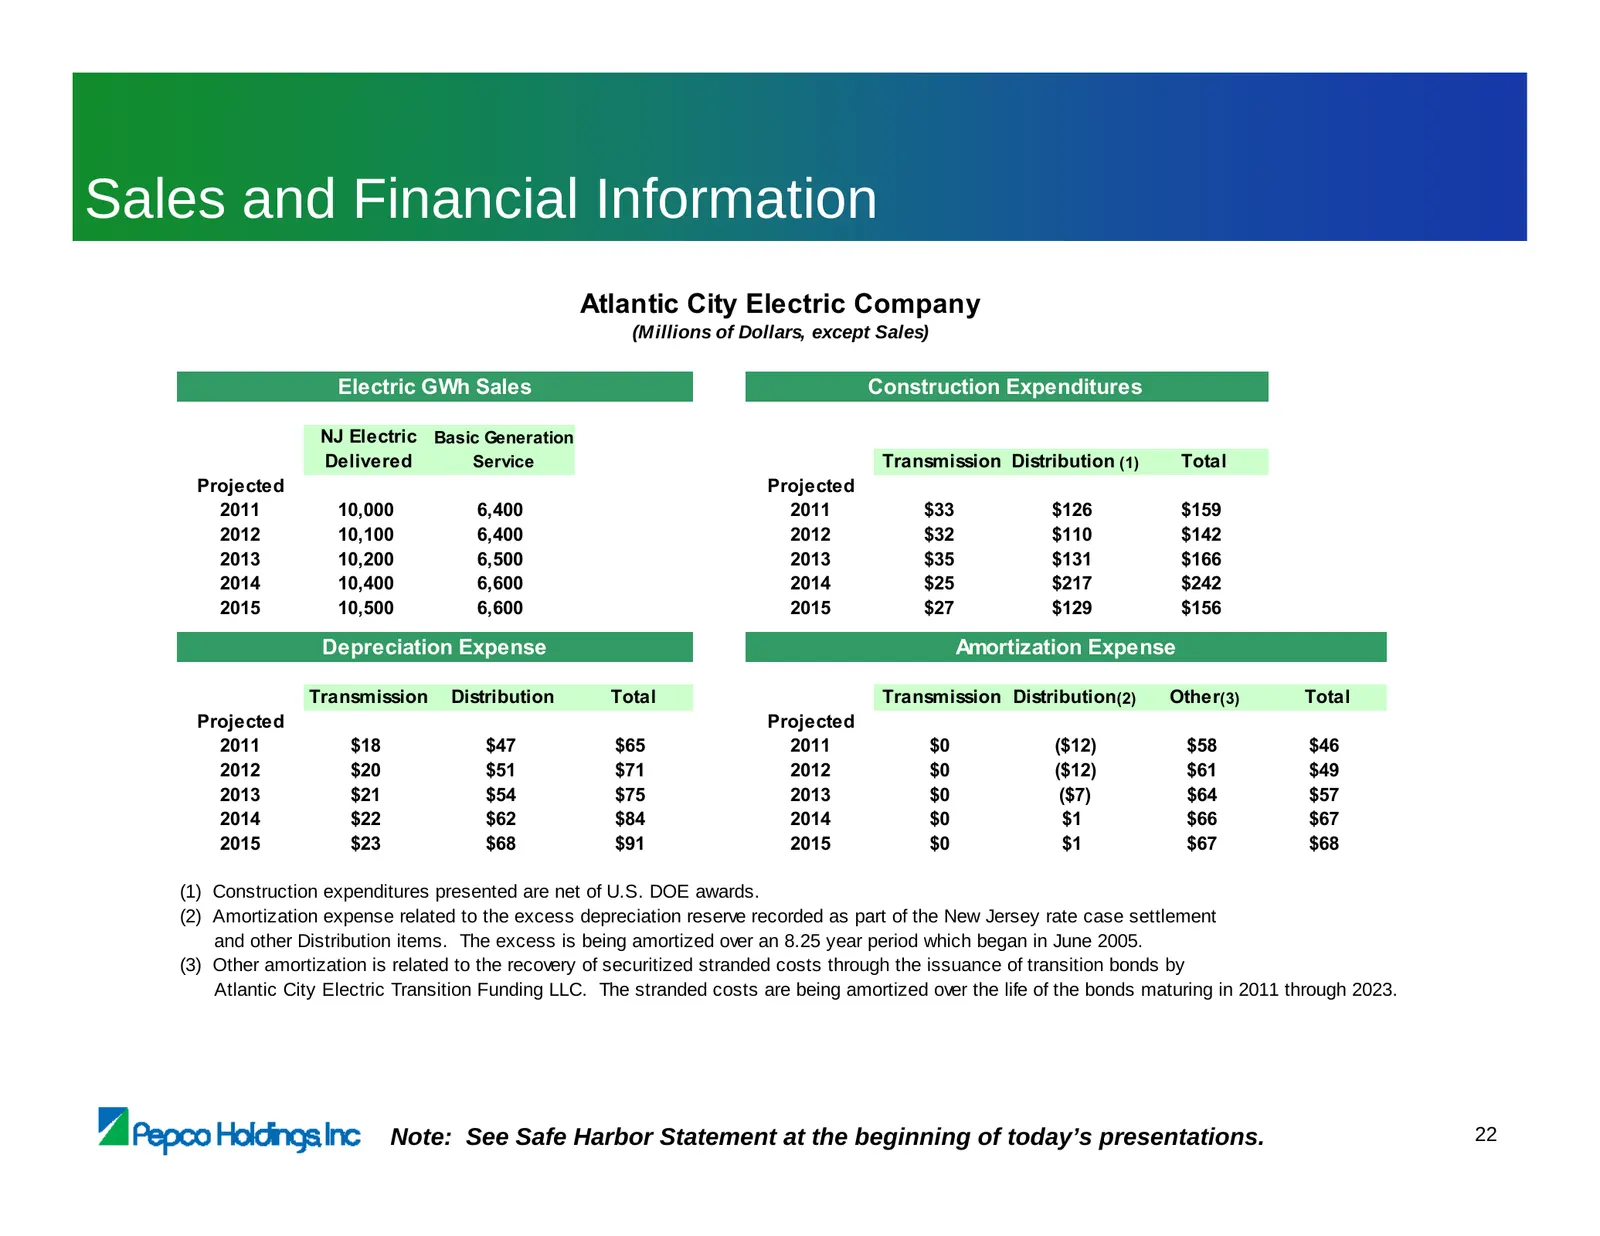
Sales and Financial Information Atlantic City Electric Company (Millions of Dollars, except Sales) Electric GWh Sales Construction Expenditures NJ Electric Basic Generation Delivered Service Transmission Distribution (1) Total Projected Projected 2011 10,000 6,400 2011 $33 $126 $159 2012 10,100 6,40
Slide 115: Projected Rate Base by Utility
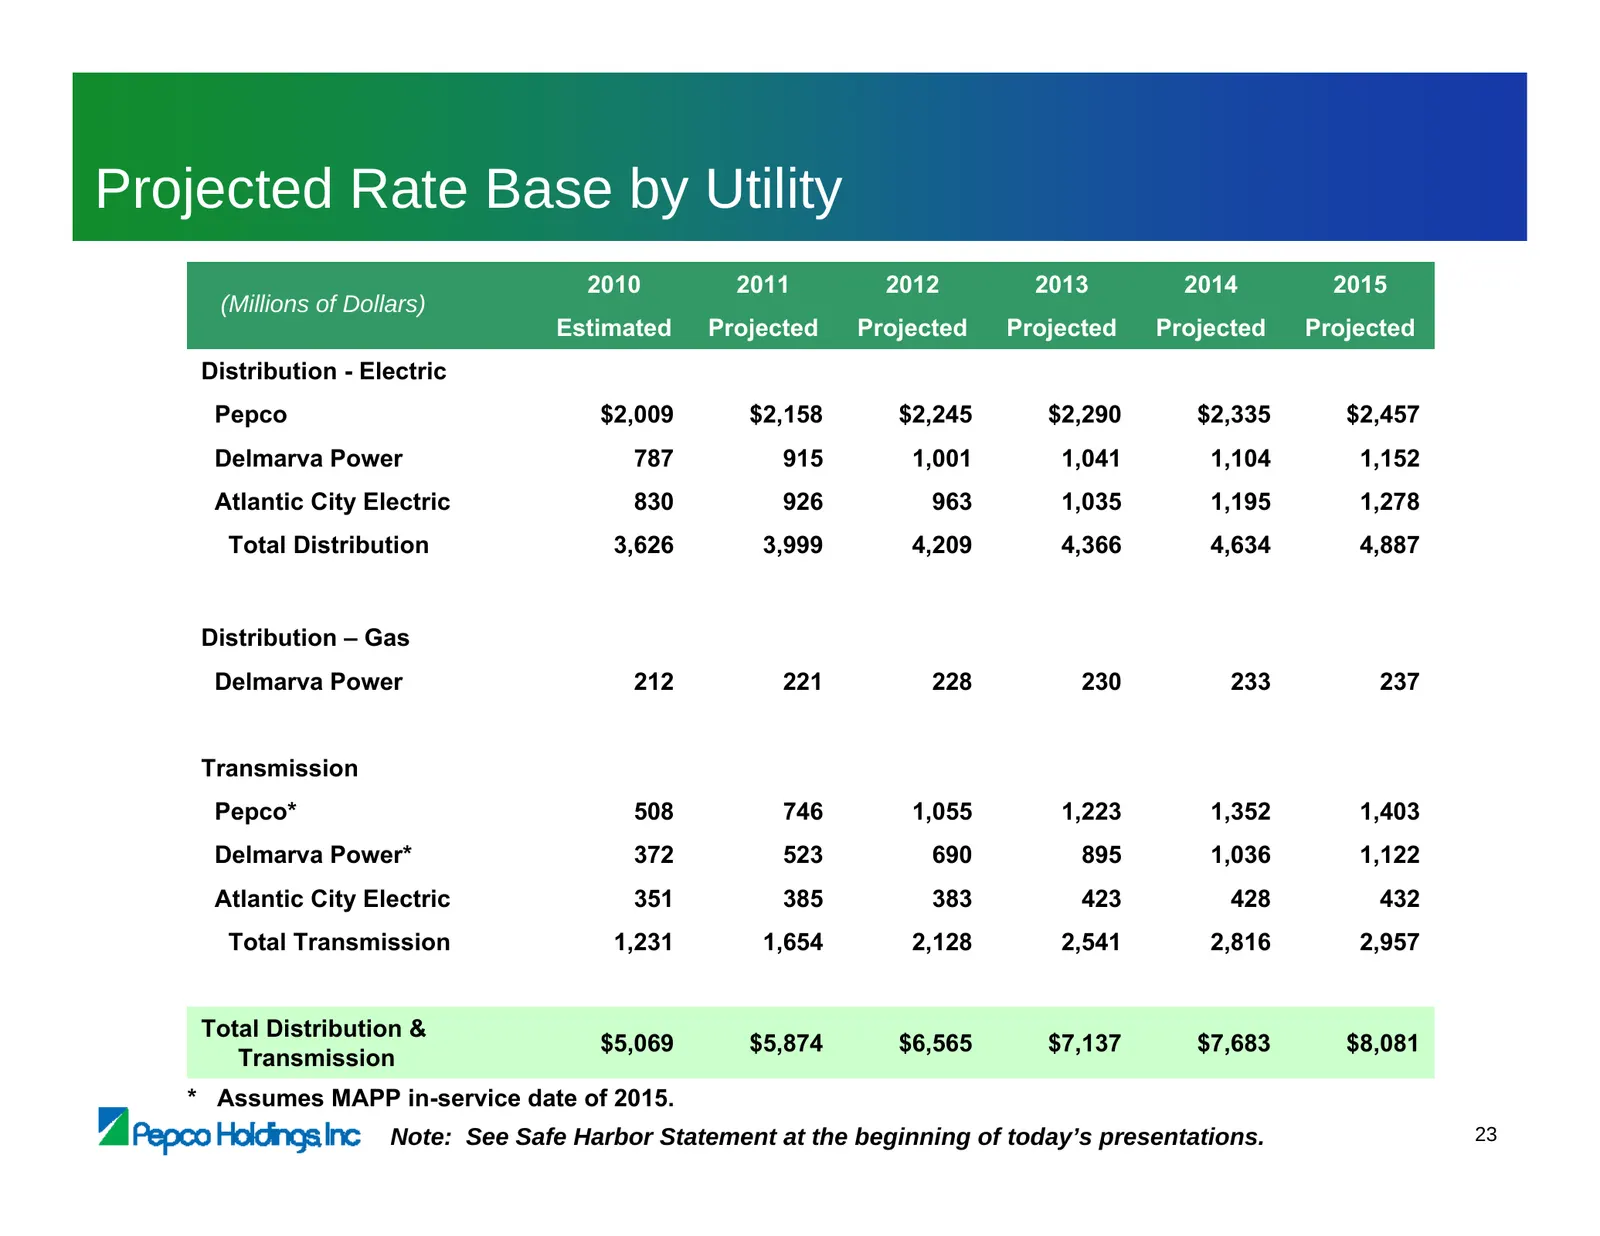
Projected Rate Base by Utility 2010 2011 2012 2013 2014 2015 (Millions of Dollars) Estimated Projected Projected Projected Projected Projected Distribution - Electric Pepco $2,009 $2,158 $2,245 $2,290 $2,335 $2,457 Delmarva Power 787 915 1,001 1,041 1,104 1,152 Atlantic City Electric 830 926 963 1,0
Slide 116: Long-term Debt Maturities
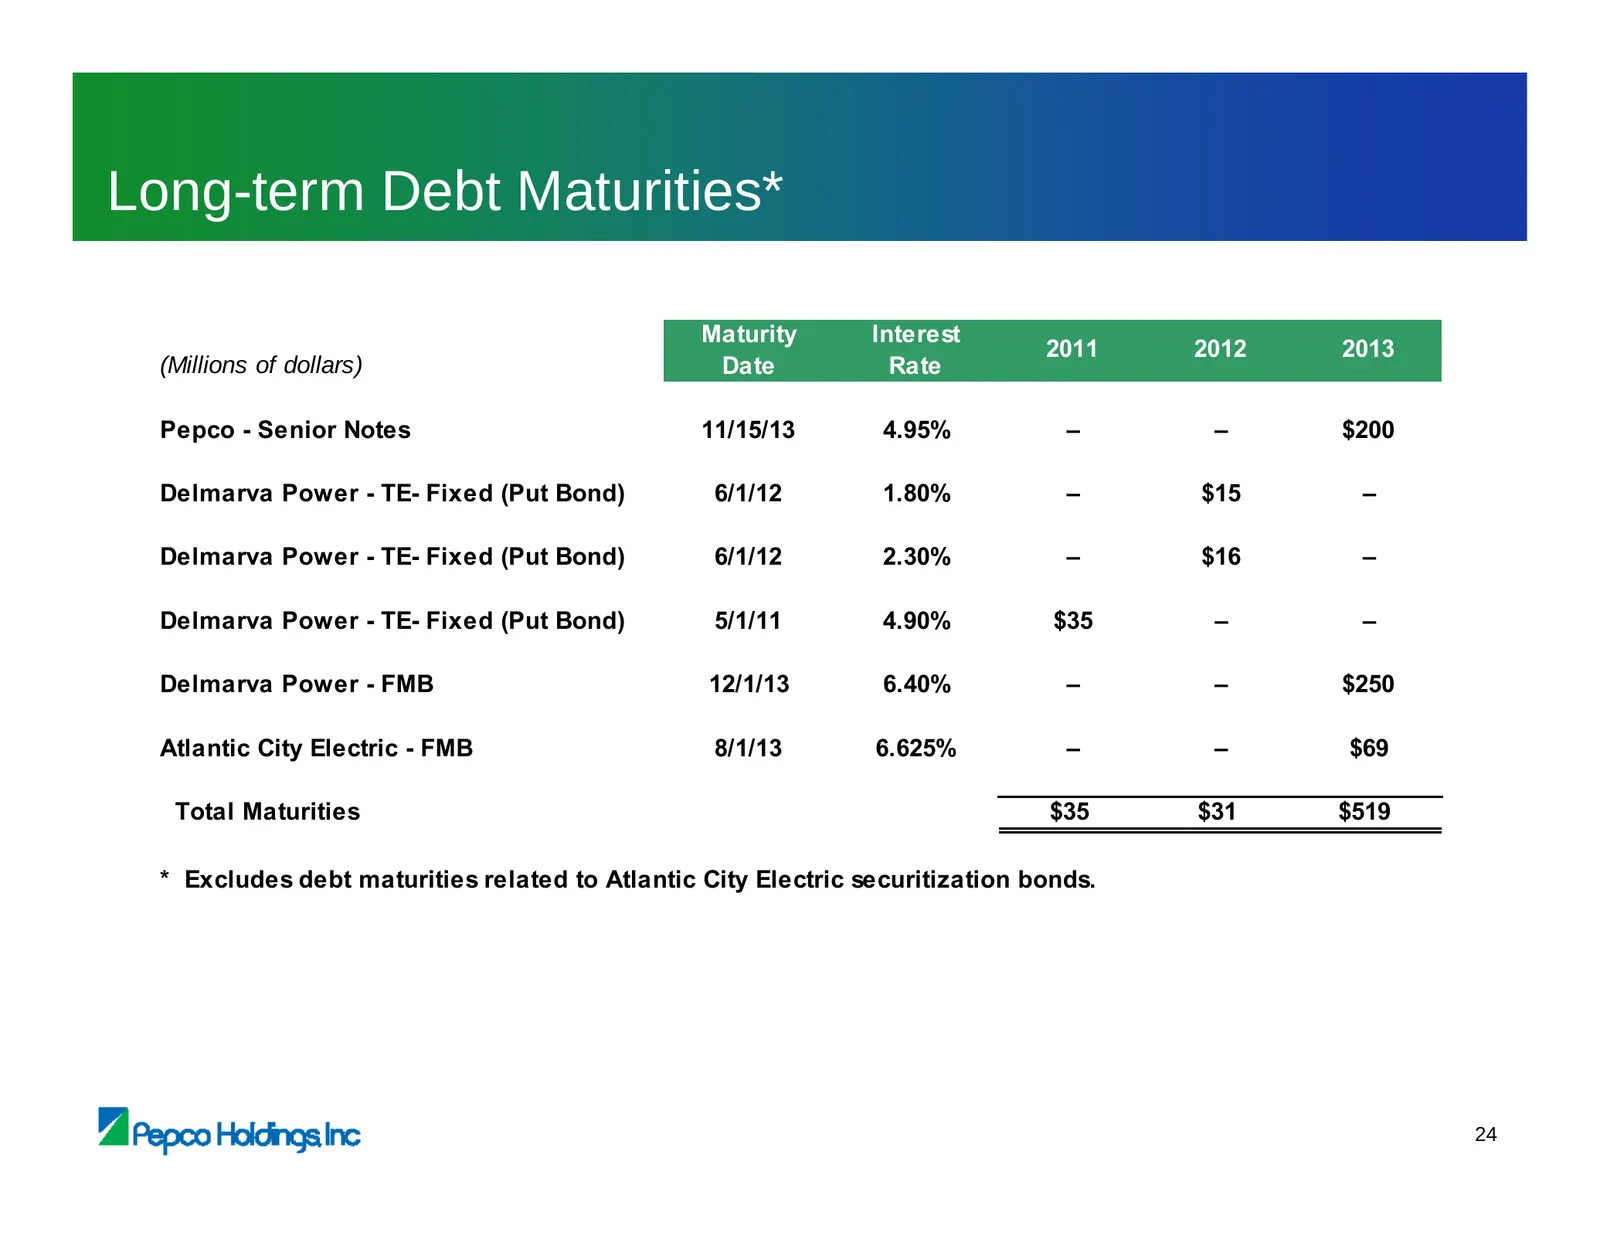
Long-term Debt Maturities* Maturity Interest 2011 2012 2013 (Millions of dollars) Date Rate Pepco - Senior Notes 11/15/13 4.95% – – $200 Delmarva Power - TE- Fixed (Put Bond) 6/1/12 1.80% – $15 – Delmarva Power - TE- Fixed (Put Bond) 6/1/12 2.30% – $16 – Delmarva Power - TE- Fixed (Put Bond) 5/1/11
Slide 117: Credit Ratings
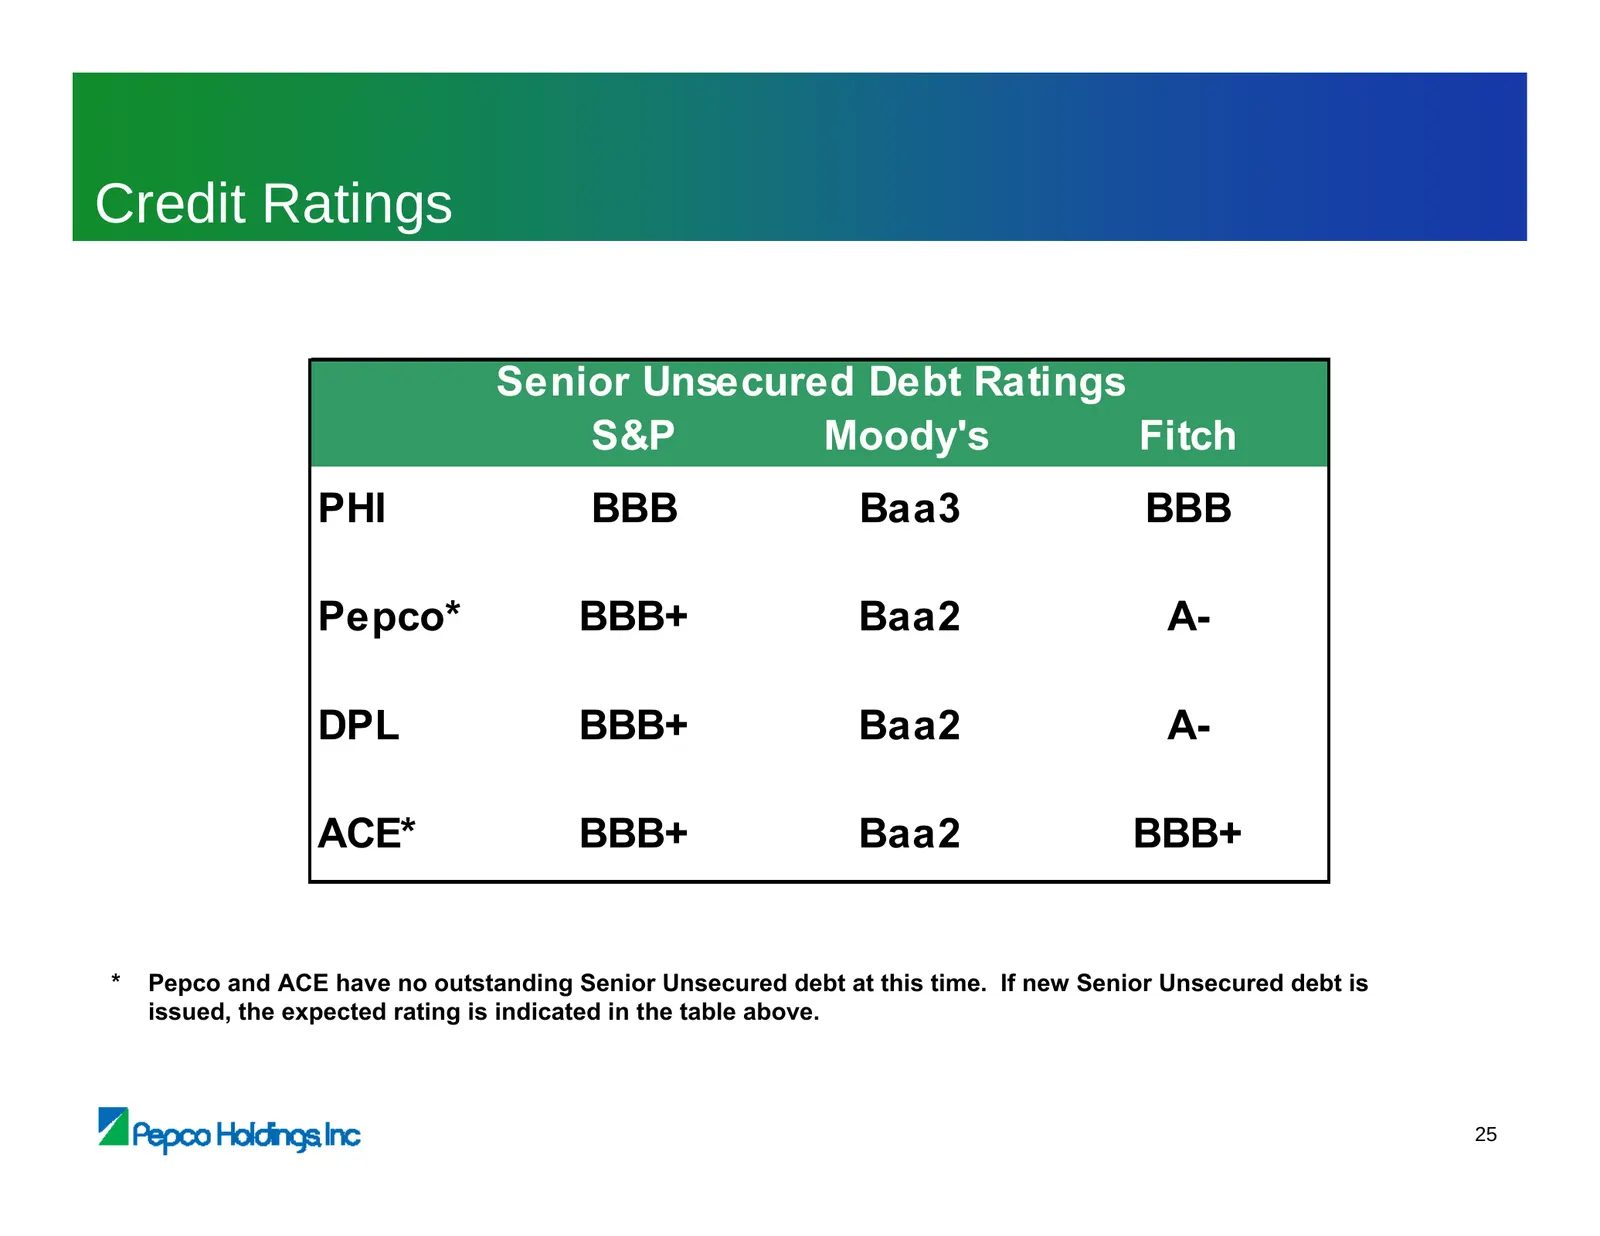
Credit Ratings Senior Unsecured Debt Ratings S&P Moody's Fitch PHI BBB Baa3 BBB Pepco* BBB+ Baa2 A- DPL BBB+ Baa2 A- ACE* BBB+ Baa2 BBB+ * Pepco and ACE have no outstanding Senior Unsecured debt at this time. If new Senior Unsecured debt is issued, the expected rating is indicated in the table above
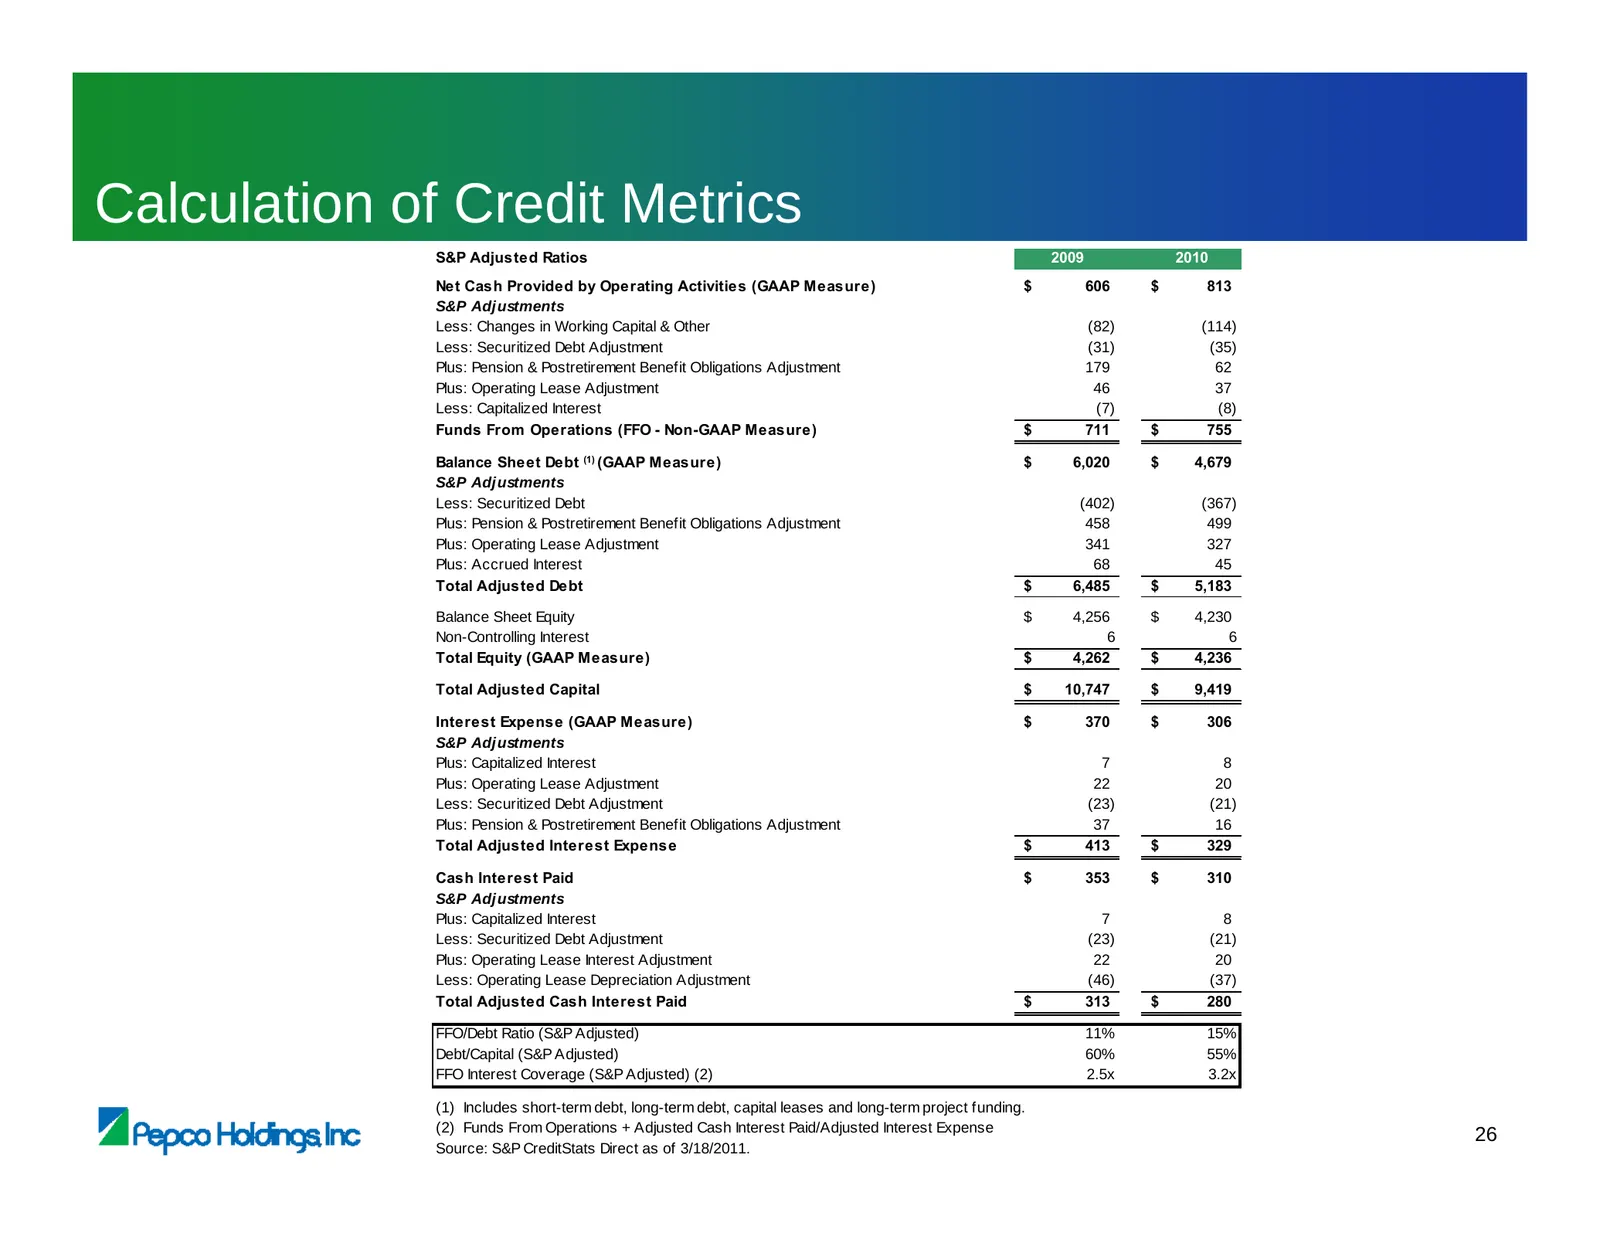
Slide 118: Calculation of Credit Metrics
Calculation of Credit Metrics S&P Adjusted Ratios 2009 2010 Net Cash Provided by Operating Activities (GAAP Measure) $ 606 $ 813 S&P Adjustments Less: Changes in Working Capital & Other (82) (114) Less: Securitized Debt Adjustment (31) (35) Plus: Pension & Postretirement Benefit Obligations Adjustme
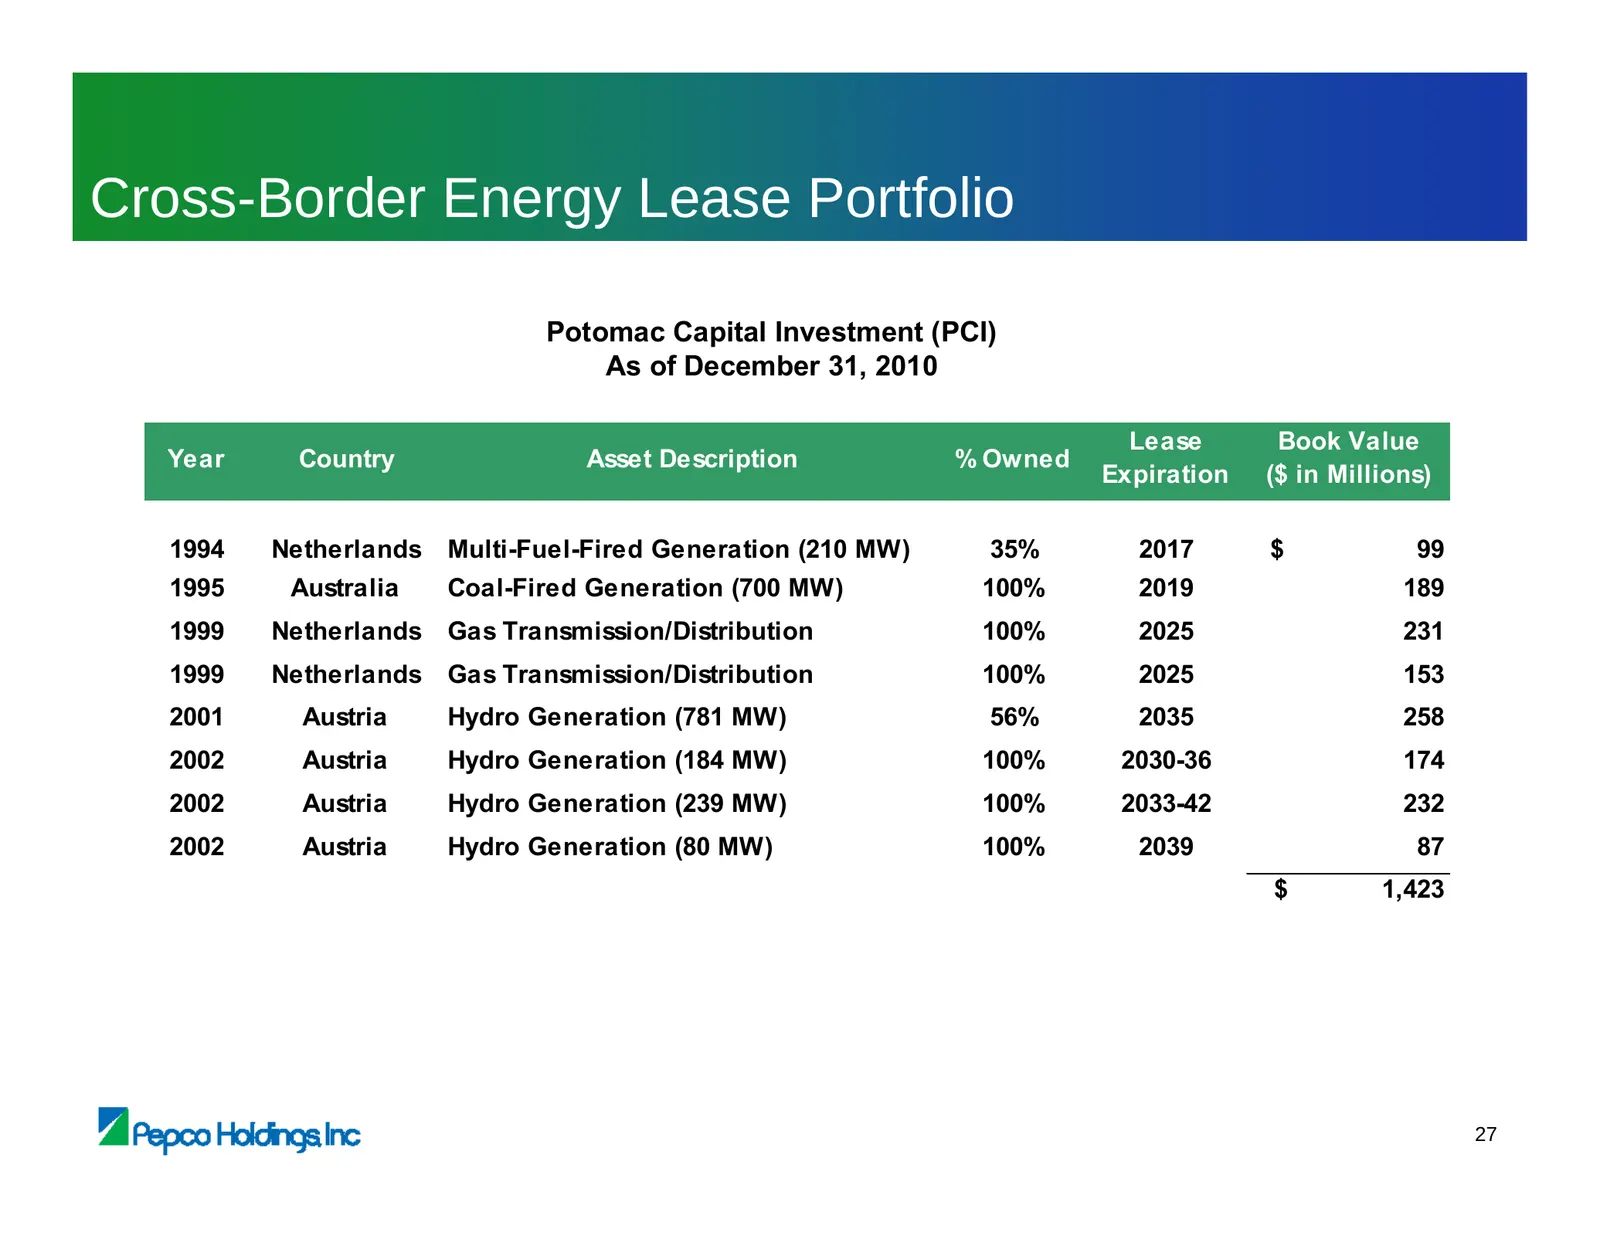
Slide 119: Cross-Border Energy Lease Portfolio
Cross-Border Energy Lease Portfolio Potomac Capital Investment (PCI) As of December 31, 2010 Lease Book Value Year Country Asset Description % Owned Expiration ($ in Millions) 1994 Netherlands Multi-Fuel-Fired Generation (210 MW) 35% 2017 $ 99 1995 Australia Coal-Fired Generation (700 MW) 100% 2019
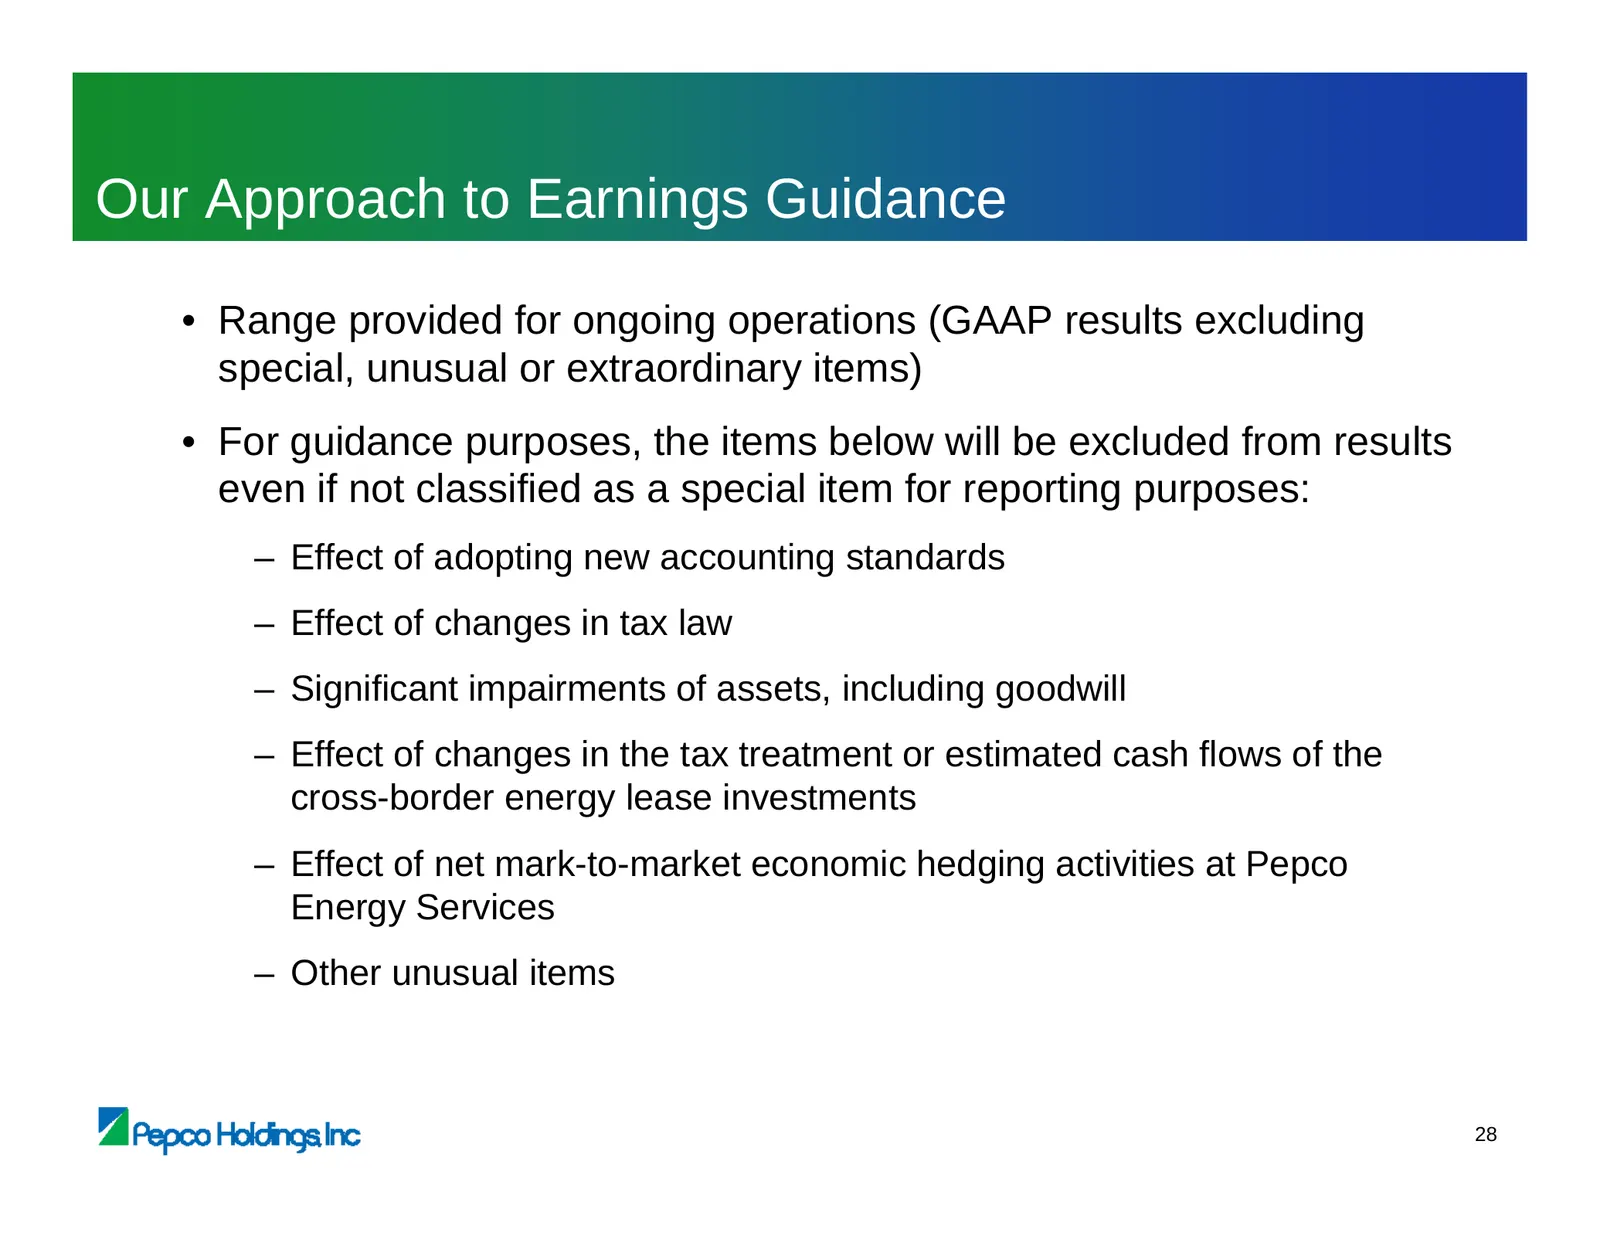
Slide 120: Our Approach to Earnings Guidance
Our Approach to Earnings Guidance • Range provided for ongoing operations (GAAP results excluding special, unusual or extraordinary items) • For guidance purposes, the items below will be excluded from results even if not classified as a special item for reporting purposes: – Effect of adopting new
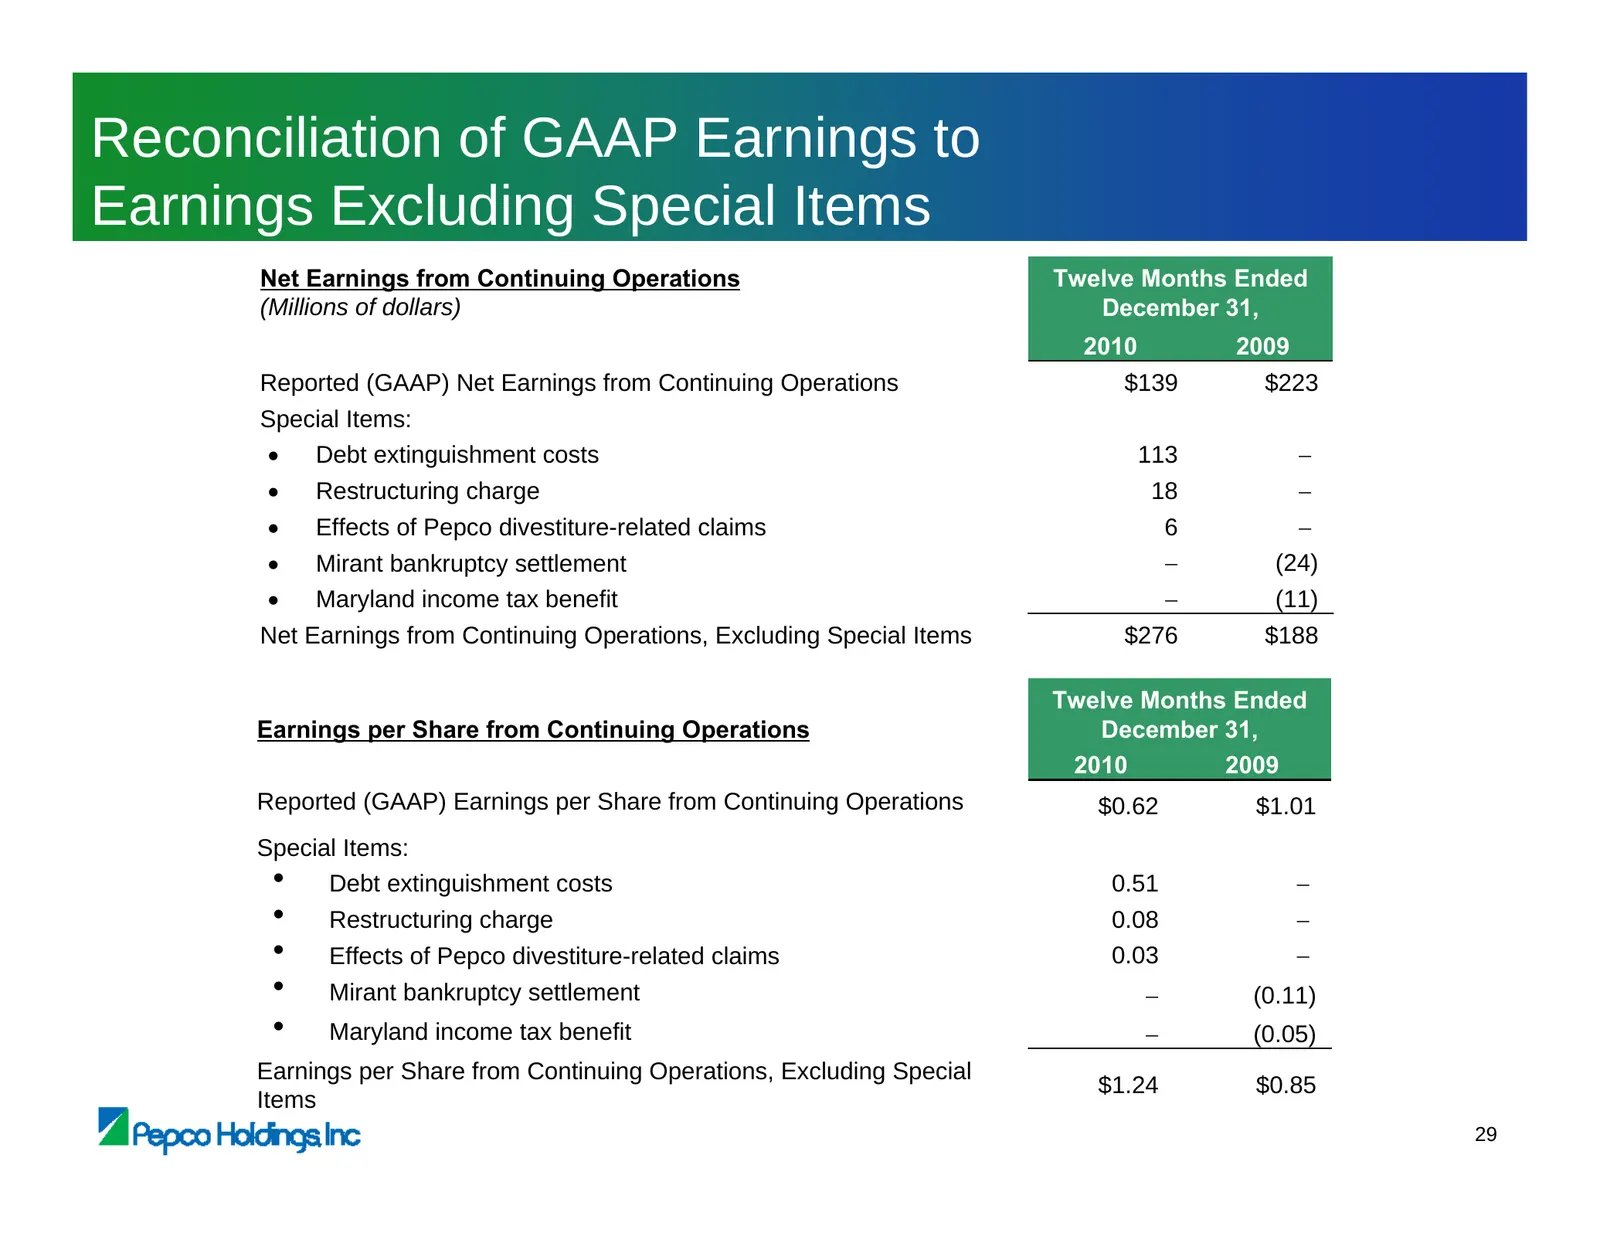
Slide 121: Reconciliation of GAAP Earnings to Earnings Excluding Special Items
Reconciliation of GAAP Earnings to Earnings Excluding Special Items Net Earnings from Continuing Operations Twelve Months Ended (Millions of dollars) December 31, 2010 2009 Reported (GAAP) Net Earnings from Continuing Operations $139 $223 Special Items: • Debt extinguishment costs 113 − • Restructur
Source: SEC EDGAR · 8-K filed Apr 8, 2011
More decks from Pepco Holdings Inc
 Merger or Acquisition (August 2014)15 slides · Aug 19, 2014
 Merger or Acquisition (May 2014)44 slides · May 23, 2014
 Q1 2014 Earnings Presentation14 slides · May 7, 2014
 Williams Capital Group Midwest Utilities Seminar (April 2014)35 slides · Apr 9, 2014
 Investor Day (March 2014)109 slides · Mar 21, 2014
 Morgan Stanley Utilities Conference 201439 slides · Feb 28, 2014