Dynegy — 2012 Citi High Yield and Leveraged Finance Conference
15 slides from Dynegy's conference presentation, Nov 14, 2012
Slide 1: Dynegy Inc. at 2012 Citi High Yield and Leveraged Finance Conference
Dynegy Inc. Clint Freeland, Chief Financial Officer 2012 Citi High Yield and Leveraged Finance Conference November 14, 2012
Slide 2: Forward-Looking Statements
Forward-Looking Statements 2 Cautionary Statement Regarding Forward-Looking Statements This presentation contains statements reflecting assumptions, expectations, projections, intentions or beliefs about future events that are intended as “forward looking statements.” You can identify these statemen
Slide 3: Dynegy's Diversified Asset Portfolio
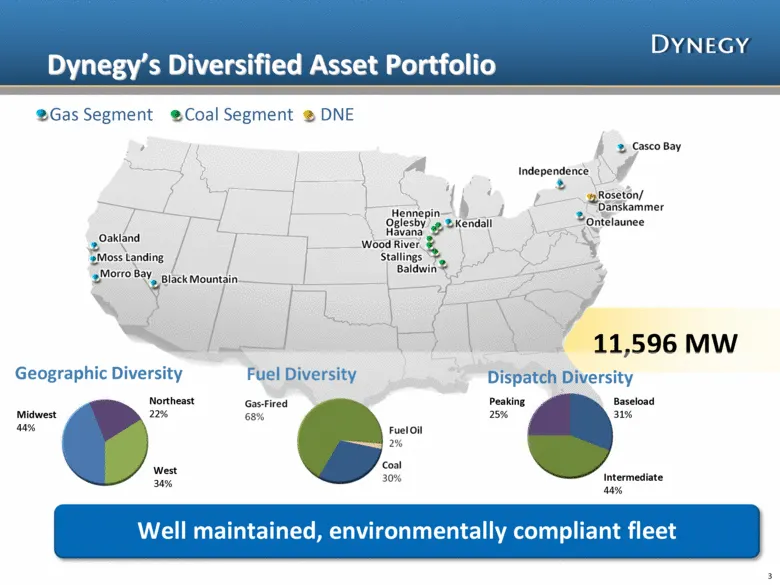
Dynegy’s Diversified Asset Portfolio 3 11,596 MW Dispatch Diversity Peaking 25% Intermediate 44% Baseload 31% Geographic Diversity Midwest 44% Northeast 22% West 34% Gas Segment Coal Segment DNE Well maintained, environmentally compliant fleet
Slide 4: Dynegy Post-Emergence
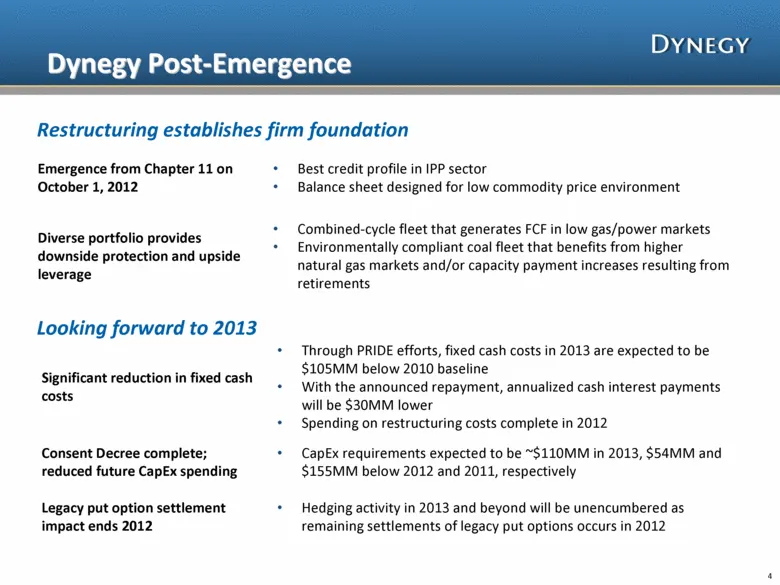
Dynegy Post-Emergence 4 Emergence from Chapter 11 on October 1, 2012 Best credit profile in IPP sector Balance sheet designed for low commodity price environment Diverse portfolio provides downside protection and upside leverage Combined-cycle fleet that generates FCF in low gas/power markets Enviro
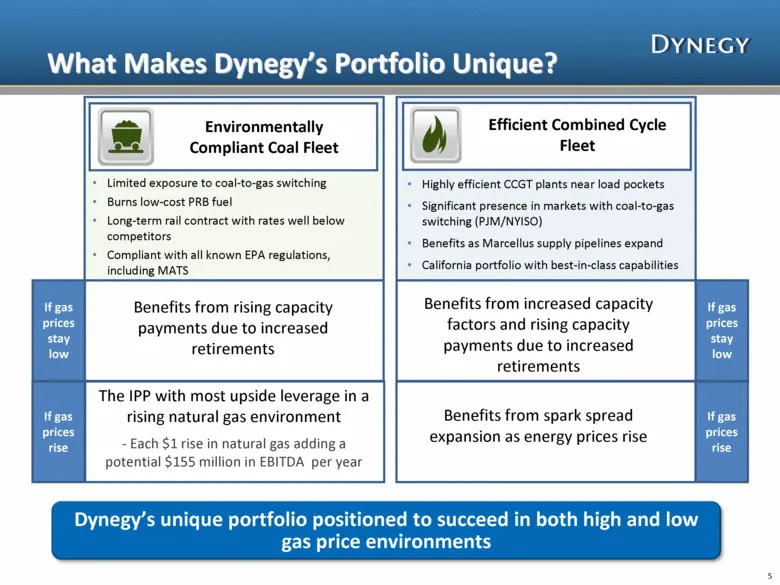
Slide 5: What Makes Dynegy's Portfolio Unique?
What Makes Dynegy’s Portfolio Unique? 5 Limited exposure to coal-to-gas switching Burns low-cost PRB fuel Long-term rail contract with rates well below competitors Compliant with all known EPA regulations, including MATS Highly efficient CCGT plants near load pockets Significant presence in markets
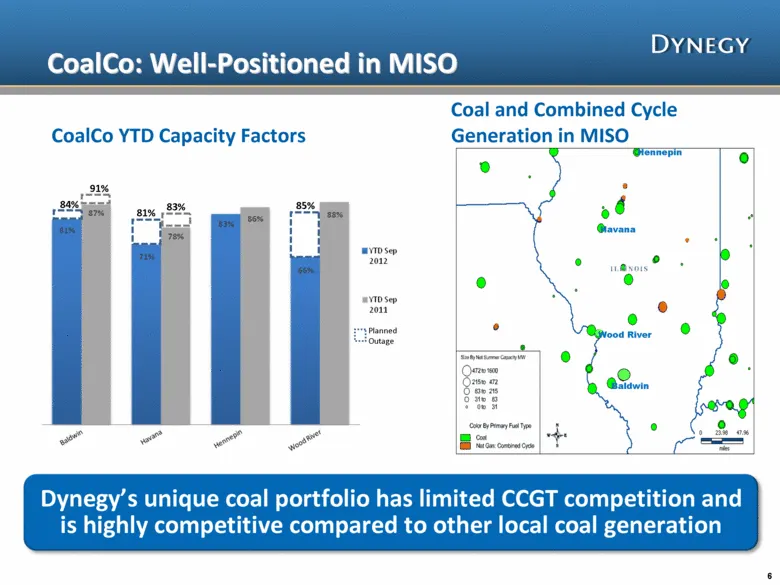
Slide 6: CoalCo: Well-Positioned in MISO
6 CoalCo: Well-Positioned in MISO Hennepin Havana Wood River Baldwin CoalCo YTD Capacity Factors Coal and Combined Cycle Generation in MISO Dynegy’s unique coal portfolio has limited CCGT competition and is highly competitive compared to other local coal generation 84% 91% 81% 83% 85% Planned Outage
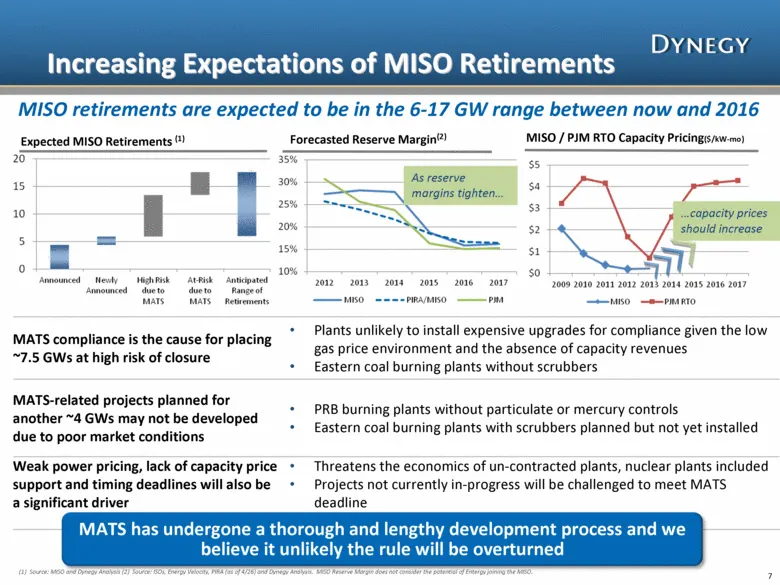
Slide 7: Increasing Expectations of MISO Retirements
Increasing Expectations of MISO Retirements MISO retirements are expected to be in the 6-17 GW range between now and 2016 MATS compliance is the cause for placing ~7.5 GWs at high risk of closure Plants unlikely to install expensive upgrades for compliance given the low gas price environment and the
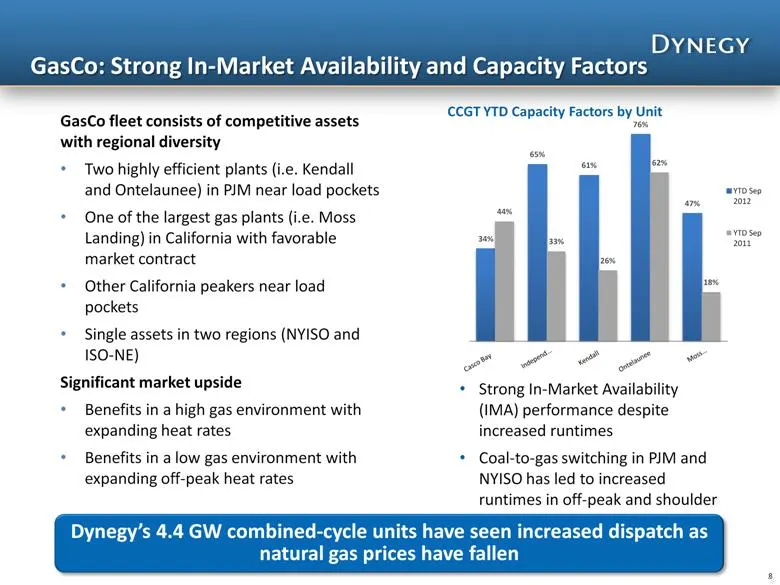
Slide 8: GasCo: Strong In-Market Availability and Capacity Factors
GasCo: Strong In-Market Availability and Capacity Factors 8 CCGT YTD Capacity Factors by Unit GasCo fleet consists of competitive assets with regional diversity Two highly efficient plants (i.e. Kendall and Ontelaunee) in PJM near load pockets One of the largest gas plants (i.e. Moss Landing) in Cal
Slide 9: Hedging Strategy
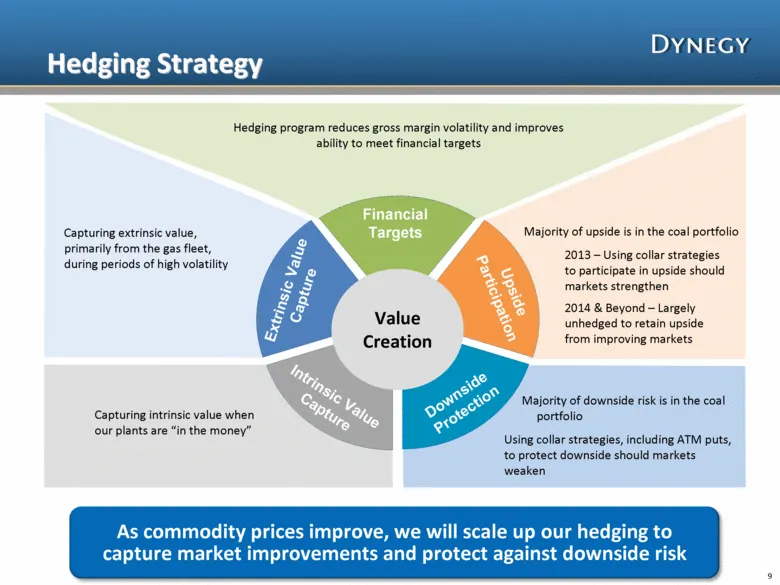
9 Hedging Strategy Value Creation Hedging program reduces gross margin volatility and improves ability to meet financial targets Majority of upside is in the coal portfolio Upside Participation Downside Protection Extrinsic Value Capture Financial Targets Intrinsic Value Capture 2013 – Using collar
Slide 10: Commercial Activity
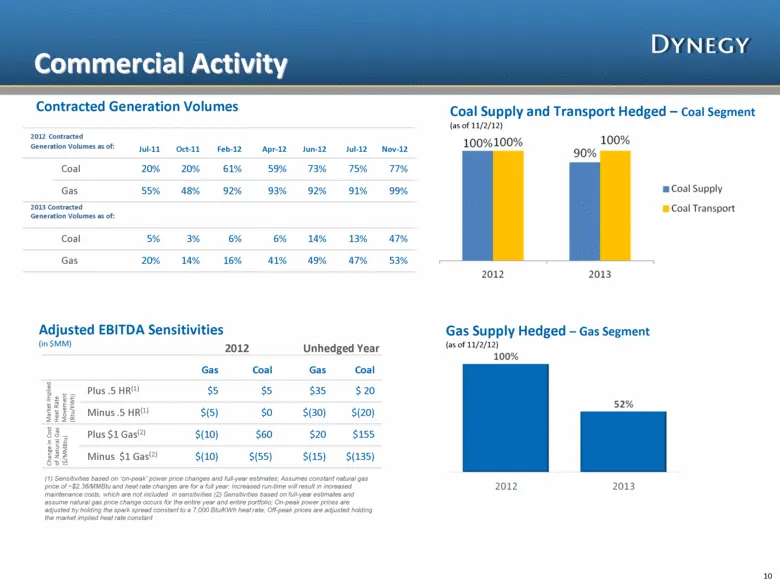
Commercial Activity 10 Contracted Generation Volumes Coal Supply and Transport Hedged – Coal Segment (as of 11/2/12) Gas Coal Gas Coal Plus .5 HR(1) $5 $5 $35 $ 20 Minus .5 HR(1) $(5) $0 $(30) $(20) Plus $1 Gas(2) $(10) $60 $20 $155 Minus $1 Gas(2) $(10) $(55) $(15) $(135) Adjusted EBITDA Sensitivit
Slide 11: Fixed Cash Cost, Gross Margin and PRIDE Results
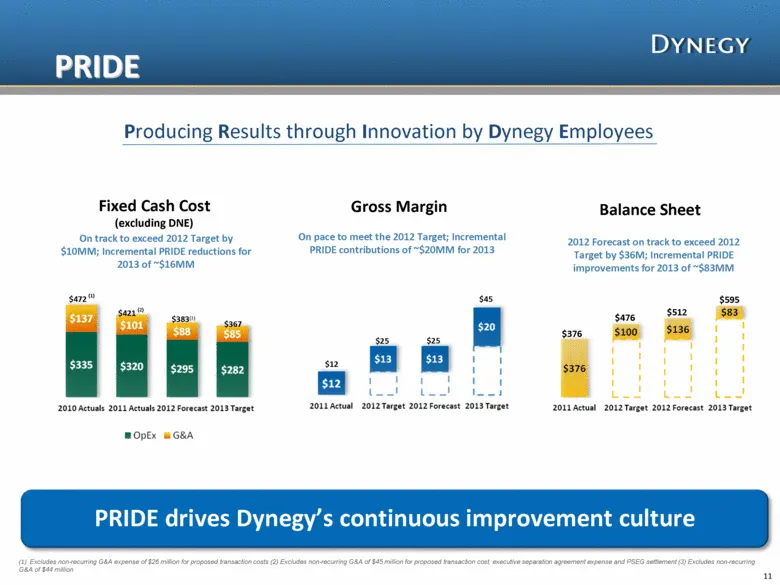
11 Fixed Cash Cost (excluding DNE) Gross Margin Balance Sheet On track to exceed 2012 Target by $10MM; Incremental PRIDE reductions for 2013 of ~$16MM PRIDE drives Dynegy’s continuous improvement culture On pace to meet the 2012 Target; Incremental PRIDE contributions of ~$20MM for 2013 $25 $25 $12
Slide 12: Capital Structure Optimization
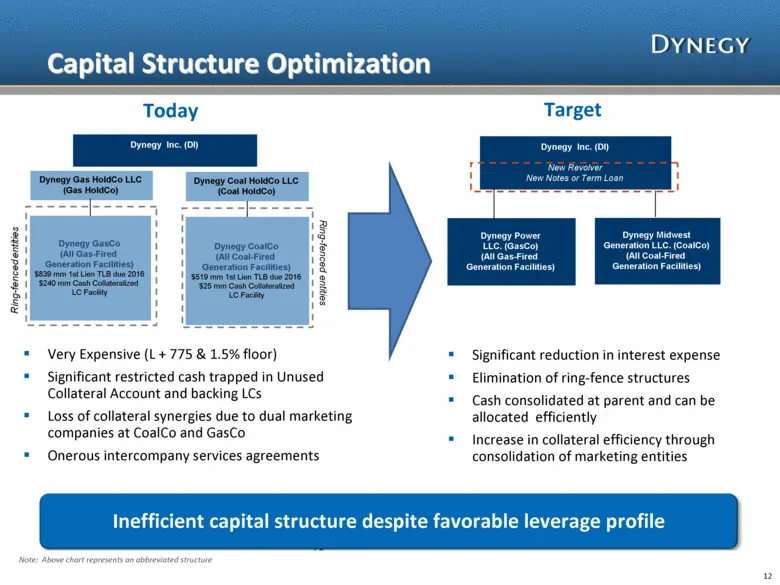
Dynegy Inc. (DI) Dynegy Coal HoldCo LLC (Coal HoldCo) Ring-fenced entities Dynegy Gas HoldCo LLC (Gas HoldCo) Dynegy CoalCo (All Coal-Fired Generation Facilities) $519 mm 1st Lien TLB due 2016 $25 mm Cash Collateralized LC Facility Dynegy GasCo (All Gas-Fired Generation Facilities) $839 mm 1st Lien
Slide 13: Returning Excess Liquidity to Lenders
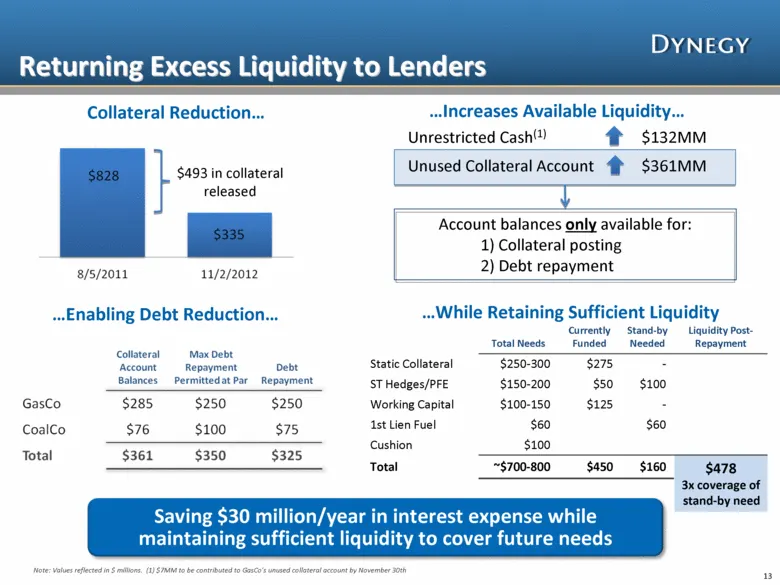
13 Returning Excess Liquidity to Lenders Note: Values reflected in $ millions. (1) $7MM to be contributed to GasCo’s unused collateral account by November 30th Total Needs Currently Funded Stand-by Needed Liquidity Post- Repayment Static Collateral $250-300 $275 - ST Hedges/PFE $150-200 $50 $100 Wor
Slide 14: Strong Balance Sheet
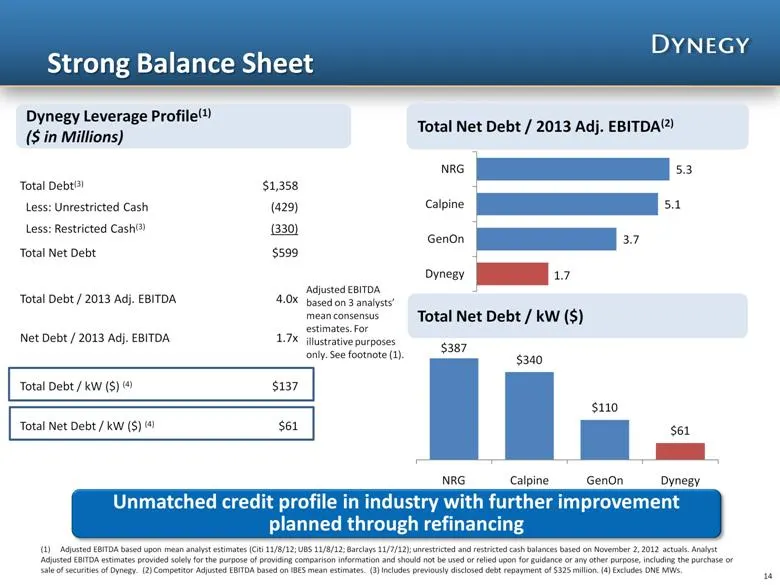
Strong Balance Sheet Unmatched credit profile in industry with further improvement planned through refinancing Total Debt(3) $1,358 Less: Unrestricted Cash (429) Less: Restricted Cash(3) (330) Total Net Debt $599 Total Debt / 2013 Adj. EBITDA 4.0x Net Debt / 2013 Adj. EBITDA 1.7x Total Debt / kW ($)
Slide 15: Dynegy Value Proposition
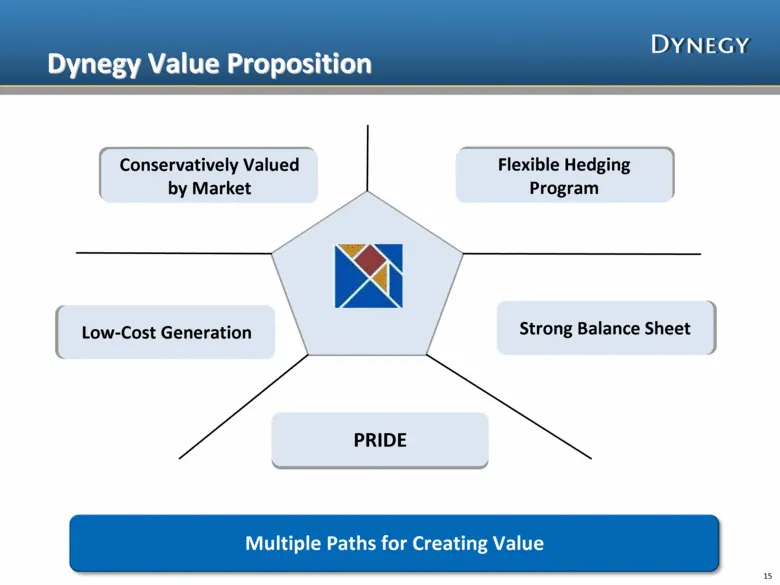
Dynegy Value Proposition Multiple Paths for Creating Value 15 Conservatively Valued by Market Flexible Hedging Program Low-Cost Generation Strong Balance Sheet PRIDE
Source: SEC EDGAR · 8-K filed Nov 14, 2012
More decks from Dynegy Inc
 FY2017 Earnings Presentation30 slides · Feb 26, 2018
 Debt Investor Presentation (December 2017)10 slides · Dec 11, 2017
 Merger or Acquisition (October 2017)28 slides · Oct 31, 2017
 Debt Investor Presentation (October 2016)44 slides · Oct 3, 2016
 IPO Roadshow (June 2016)17 slides · Jun 15, 2016
 Investor Day (April 2014)94 slides · Apr 11, 2014