Pepco — 48th EEI Financial Conference 2013
37 slides from Pepco's conference presentation, Nov 8, 2013

Slide 1: 48th EEI Financial Conference: Investing Today for a Brighter Tomorrow
48 th EEI Financial Conference Investing Today for a Brighter Tomorrow November 10 – 12, 2013 Orlando, FL
Slide 2: Safe Harbor Statement/Regulation G Information
Safe Harbor Statement/Regulation G Information Some of the statements contained in today’s presentation with respect to Pepco Holdings, Pepco, Delmarva Power and Atlantic City Electric, including each of their respective subsidiaries, are forward-looking statements within the meaning of the U.S. fed
Slide 3: Strategic Focus
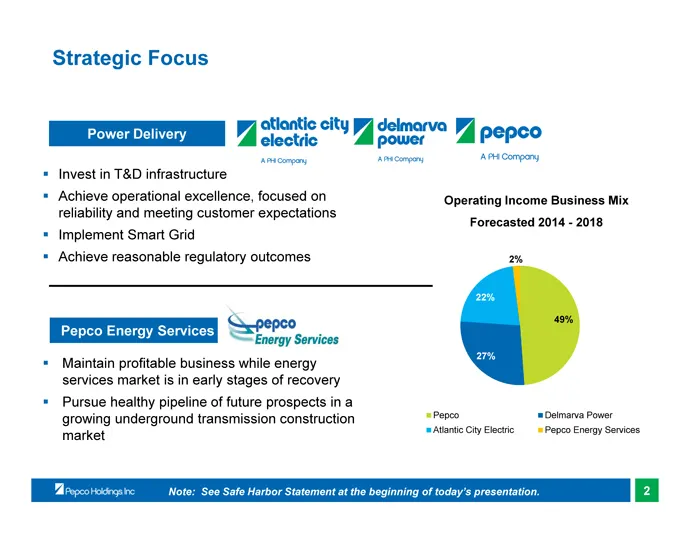
Strategic Focus Power Delivery · Invest in T&D infrastructure • Achieve operational excellence, focused on reliability and meeting customer expectations • Implement Smart Grid • Achieve reasonable regulatory outcomes Pepco Energy Services • Maintain profitable business while energy services market i
Slide 4: Business Overview – Power Delivery
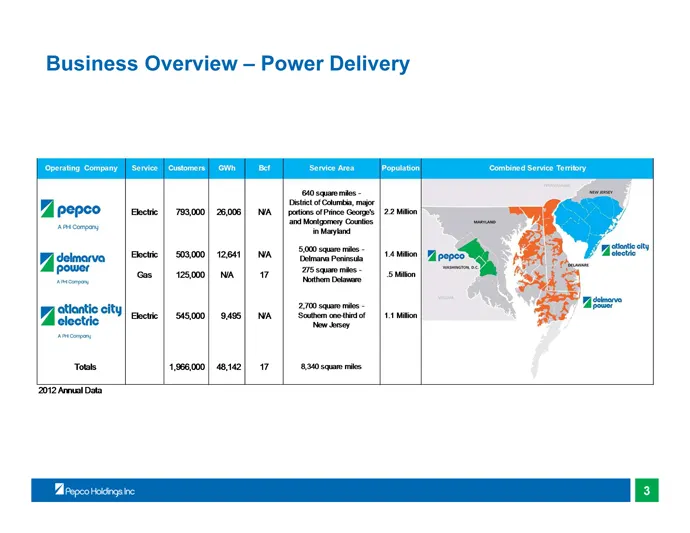
Business Overview – Power Delivery 3
Slide 5: PHI Service Territory
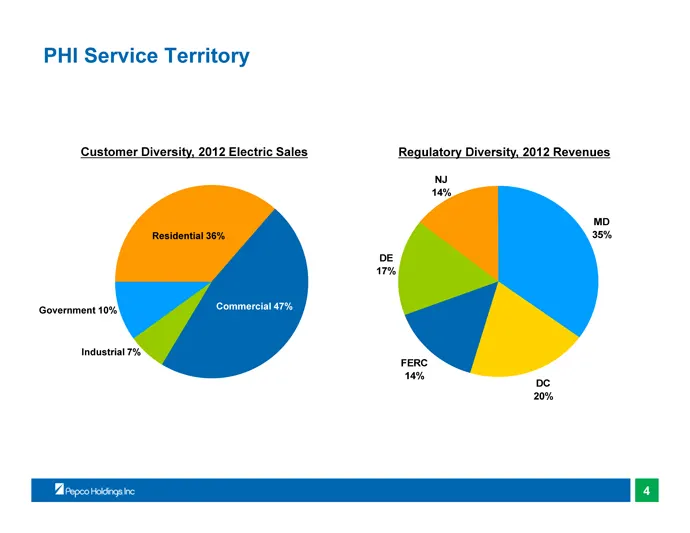
PHI Service Territory Customer Diversity, 2012 Electric Sales Regulatory Diversity, 2012 Revenues 4
Slide 6: Power Delivery – Growth Opportunity
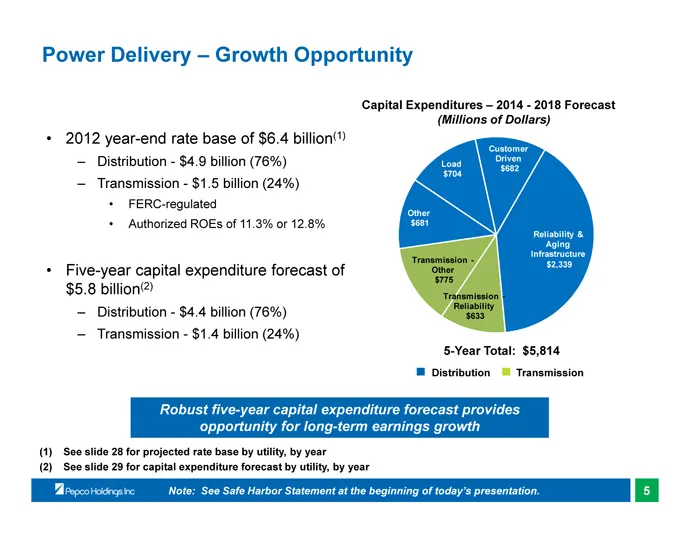
Power Delivery – Growth Opportunity • 2012 year-end rate base of $6.4 billion (1) – Distribution - $4.9 billion (76%) – Transmission - $1.5 billion (24%) • FERC-regulated • Authorized ROEs of 11.3% or 12.8% • Five-year capital expenditure forecast of $5.8 billion (2) – Distribution - $4.4 billion (7
Slide 7: Power Delivery Construction Expenditure Forecast
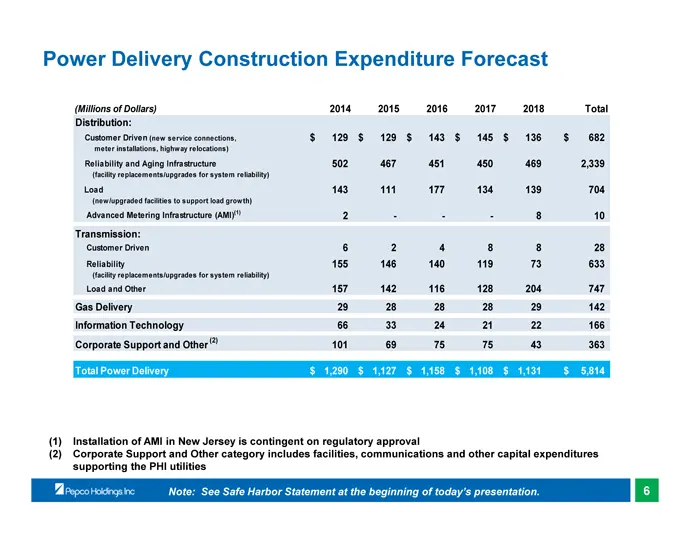
Power Delivery Construction Expenditure Forecast (Millions of Dollars) 2014 2015 2016 2017 2018 Total Distribution: Customer Driven (new service connections, $ 129 $ 129 $ 143 $ 145 $ 136 $ 682 meter installations, highw ay relocations) Reliability and Aging Infrastructure 502 467 451 450 469 2,339
Slide 8: Forecast Capital Expenditures Comparison
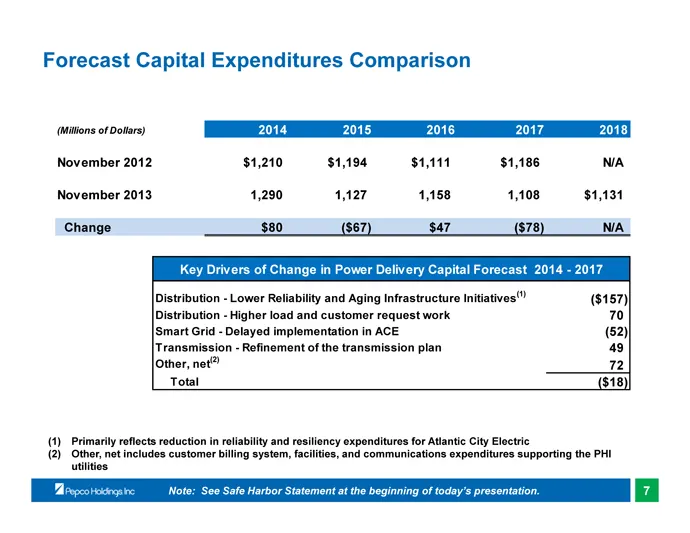
Forecast Capital Expenditures Comparison (Millions of Dollars) 2014 2015 2016 2017 2018 November 2012 $1,210 $1,194 $1,111 $1,186 N/A November 2013 1,290 1,127 1,158 1,108 $1,131 Change $80 ($67) $47 ($78) N/A Key Drivers of Change in Power Delivery Capital Forecast 2014 - 2017 Distribution - Lower
Slide 9: Infrastructure Investment – The Driver of Growth
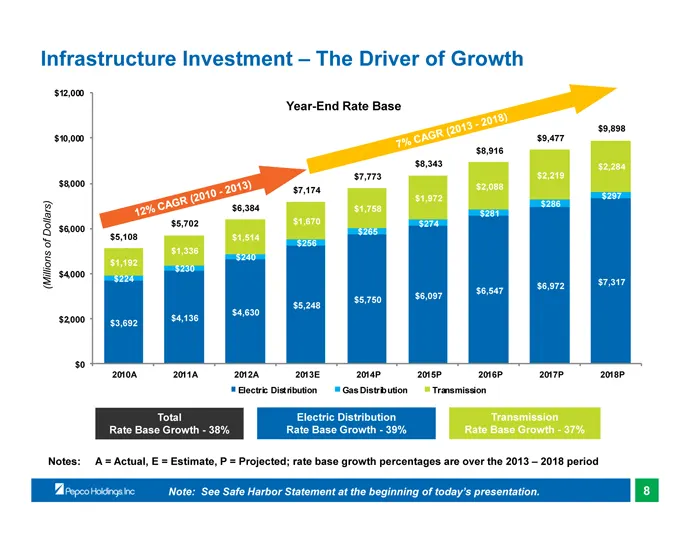
Infrastructure Investment – The Driver of Growth Note: See Safe Harbor Statement at the beginning of today’s presentation. 8
Slide 10: Smart Grid Implementation
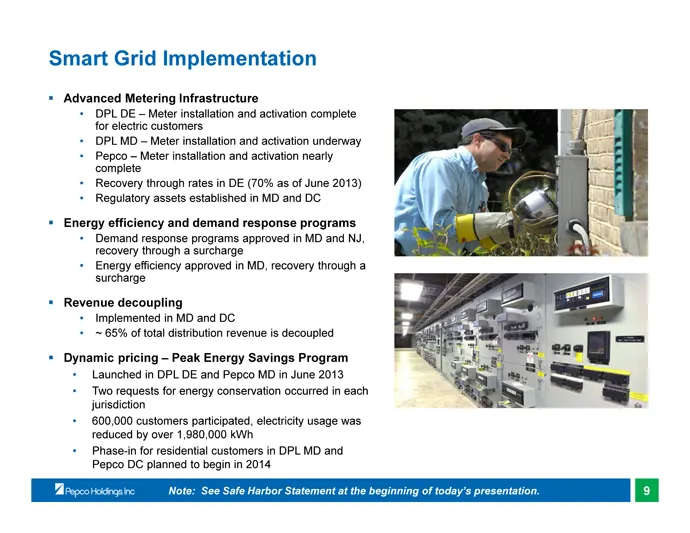
Smart Grid Implementation Advanced Metering Infrastructure • DPL DE – Meter installation and activation complete for electric customers • DPL MD – Meter installation and activation underway • Pepco – Meter installation and activation nearly complete • Recovery through rates in DE (70% as of June 201
Slide 11: Sales and Decoupling
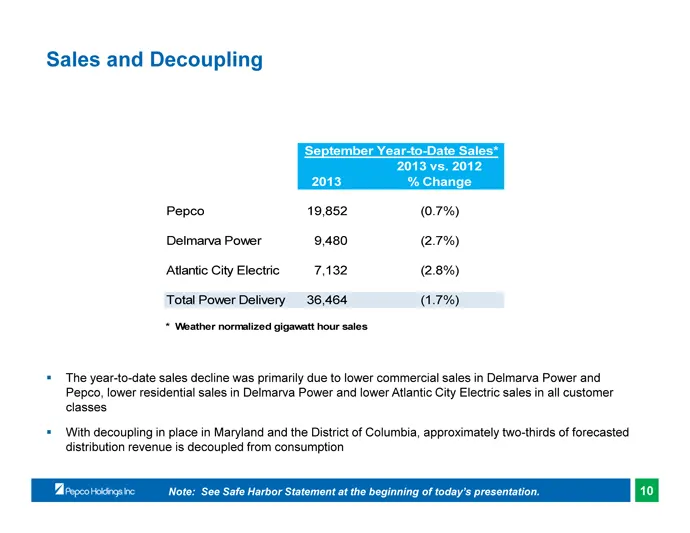
Sales and Decoupling September Year-to-Date Sales* 2013 vs. 2012 2013 % Change Pepco 19,852 (0.7%) Delmarva Power 9,480 (2.7%) Atlantic City Electric 7,132 (2.8%) Total Power Delivery 36,464 (1.7%) * Weather normalized gigawatt hour sales • The year-to-date sales decline was primarily due to lower c
Slide 12: Regulatory Distribution Returns on Equity
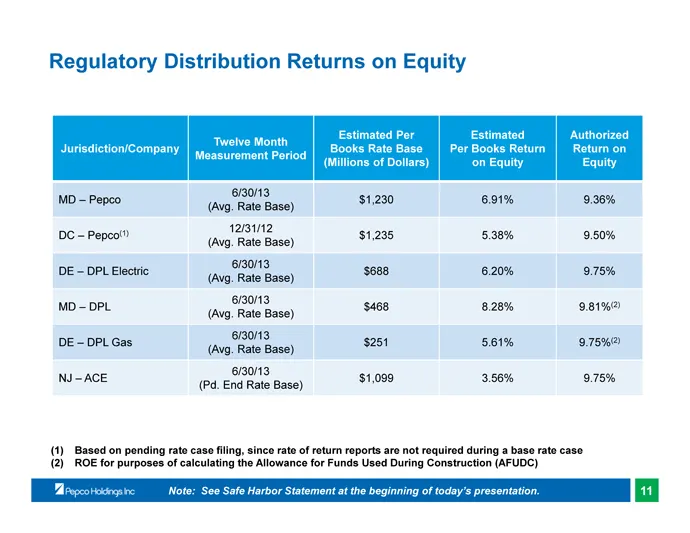
Regulatory Distribution Returns on Equity Twelve Month Estimated Per Estimated Authorized Jurisdiction/Company Books Rate Base Per Books Return Return on Measurement Period (Millions of Dollars) on Equity Equity MD – Pepco 6/30/13 $1,230 6.91% 9.36% (Avg. Rate Base) DC – Pepco (1) 12/31/12 $1,235 5.
Slide 13: Our Strategy for Reducing Regulatory Lag
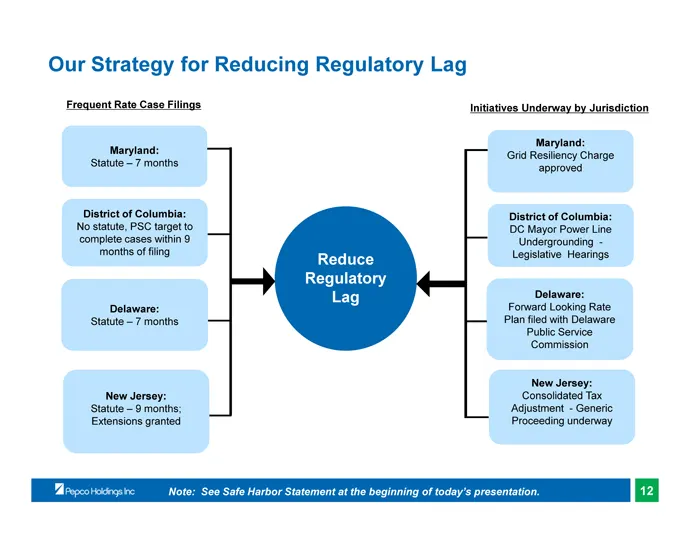
Our Strategy for Reducing Regulatory Lag Frequent Rate Case Filings Maryland: Statute – 7 months District of Columbia: No statute, PSC target to complete cases within 9 months of filing Delaware: Statute – 7 months New Jersey: Statute – 9 months; Extensions granted Reduce Regulatory Lag Initiatives
Slide 14: Distribution Rate Cases – Summary
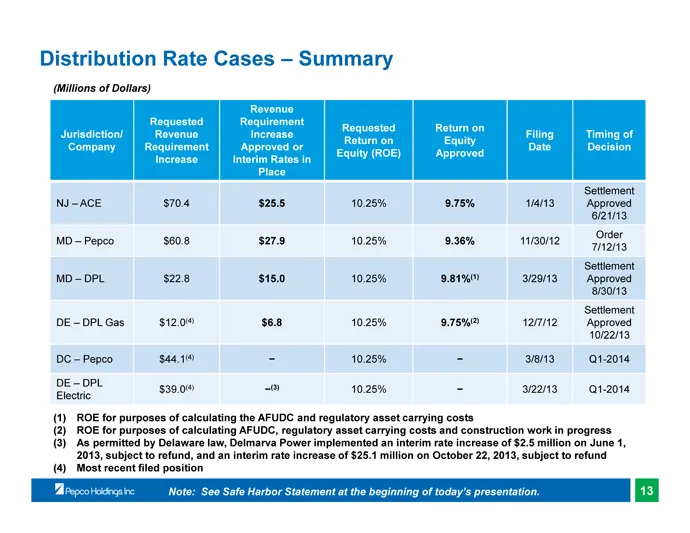
Distribution Rate Cases – Summary (Millions of Dollars) Jurisdiction/ Company Requested Revenue Requirement Increase Revenue Requirement Increase Approved or Interim Rates in Place Requested Return on Equity (ROE) Return on Equity Approved Filing Date Timing of Decision Settlement NJ – ACE $70.4 2.
Slide 15: Distribution Rate Cases – Recent Decision Atlantic City Electric
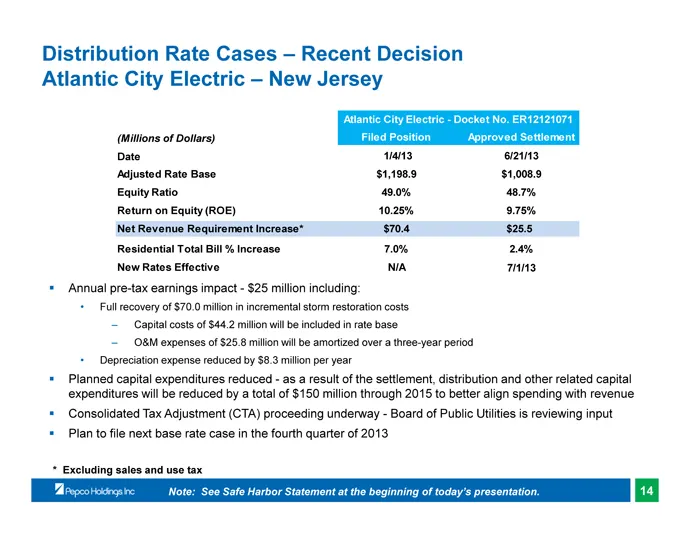
Distribution Rate Cases – Recent Decision Atlantic City Electric – New Jersey Atlantic City Electric - Docket No. ER12121071 (Millions of Dollars) Filed Position Approved Settlement Date 1/4/13 6/21/13 Adjusted Rate Base $1,198.9 $1,008.9 Equity Ratio 49.0% 48.7% Return on Equity (ROE) 10.25% 9.75%
Slide 16: Distribution Rate Cases – Recent Decision Pepco Maryland
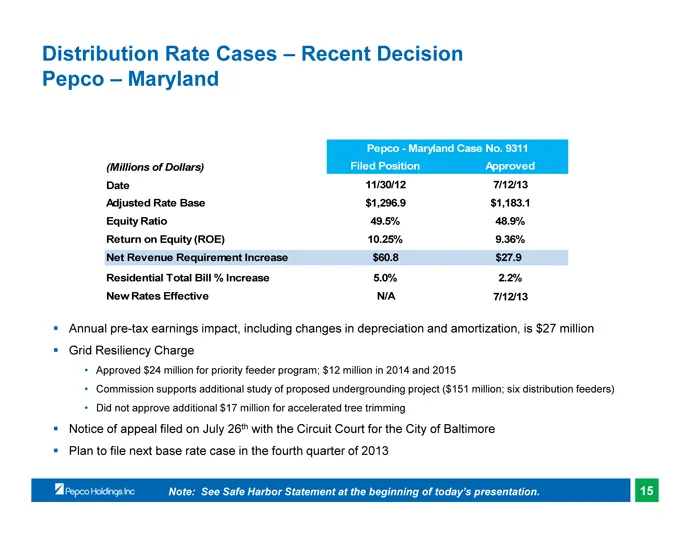
Distribution Rate Cases – Recent Decision Pepco – Maryland Pepco - Maryland Case No. 9311 (Millions of Dollars) Filed Position Approved Date 11/30/12 7/12/13 Adjusted Rate Base $1,296.9 $1,183.1 Equity Ratio 49.5% 48.9% Return on Equity (ROE) 10.25% 9.36% Net Revenue Requirement Increase $60.8 $27.9
Slide 17: Distribution Rate Cases – Recent Decision Delmarva Power Maryland
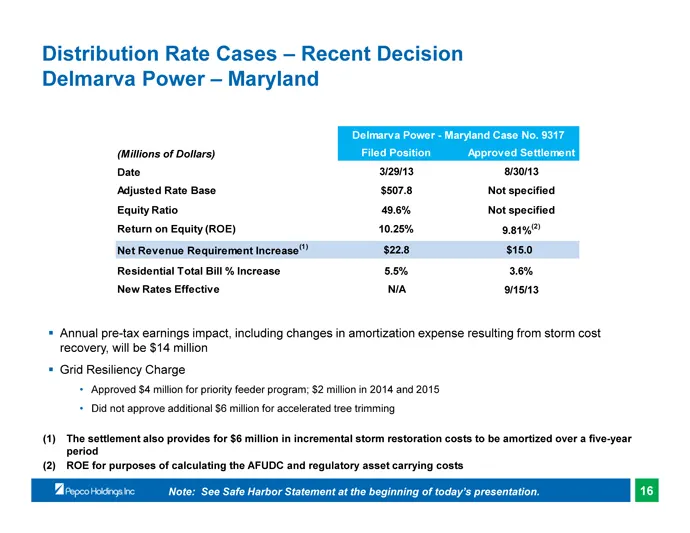
Distribution Rate Cases – Recent Decision Delmarva Power – Maryland Delmarva Power - Maryland Case No. 9317 (Millions of Dollars) Filed Position Approved Settlement Date 3/29/13 8/30/13 Adjusted Rate Base $507.8 Not specified Equity Ratio 49.6% Not specified Return on Equity (ROE) 10.25% (2) 9.81% N
Slide 18: Distribution Rate Cases – Recent Decision Delmarva Power Delaware Gas
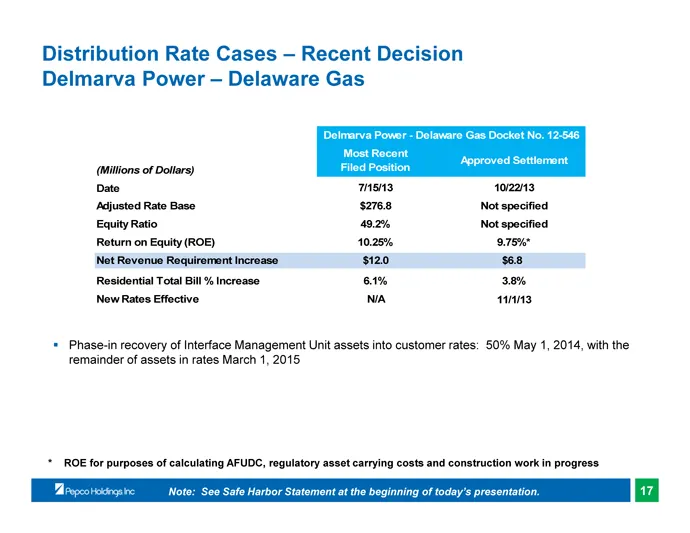
Distribution Rate Cases – Recent Decision Delmarva Power – Delaware Gas Delmarva Power - Delaware Gas Docket No. 12-546 Most Recent Approved Settlement (Millions of Dollars) Filed Position Date 7/15/13 10/22/13 Adjusted Rate Base $276.8 Not specified Equity Ratio 49.2% Not specified Return on Equity
Slide 19: Distribution Rate Cases – Pending Pepco District of Columbia
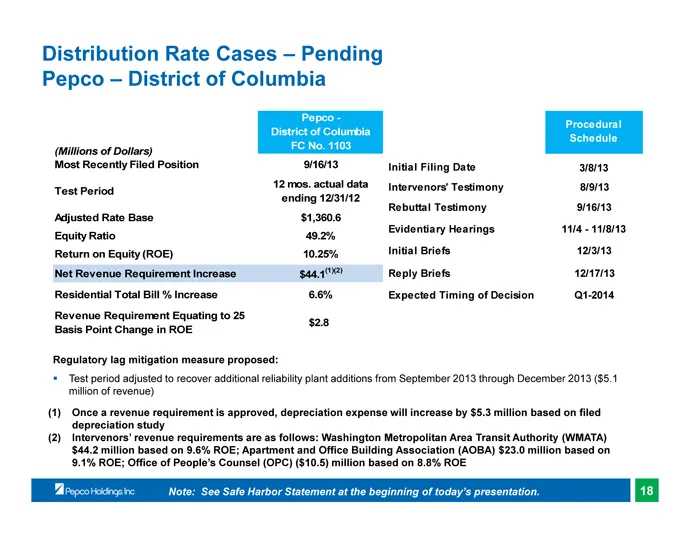
Distribution Rate Cases – Pending Pepco – District of Columbia Pepco - Procedural District of Columbia Schedule FC No. 1103 (Millions of Dollars) Most Recently Filed Position 9/16/13 Initial Filing Date 3/8/13 Test Period 12 mos. actual data Intervenors' Testimony 8/9/13 ending 12/31/12 Rebuttal Tes
Slide 20: Distribution Rate Cases – Pending Delmarva Power Delaware Electric
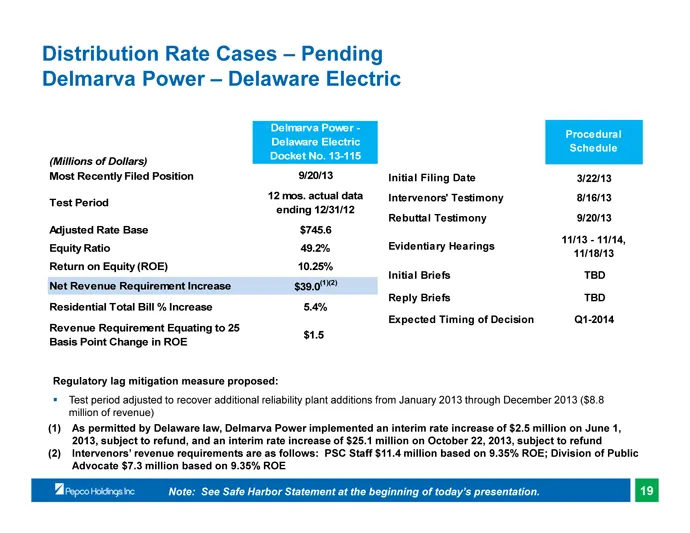
Distribution Rate Cases – Pending Delmarva Power – Delaware Electric Delmarva Power - Delaware Electric (Millions of Dollars) Docket No. 13-115 Most Recently Filed Position 9/20/13 Test Period 12 mos. actual data ending 12/31/12 Adjusted Rate Base $745.6 Equity Ratio 49.2% Return on Equity (ROE) 10.
Slide 21: Proposed Forward Looking Rate Plan Filing – Delmarva Power Delaware
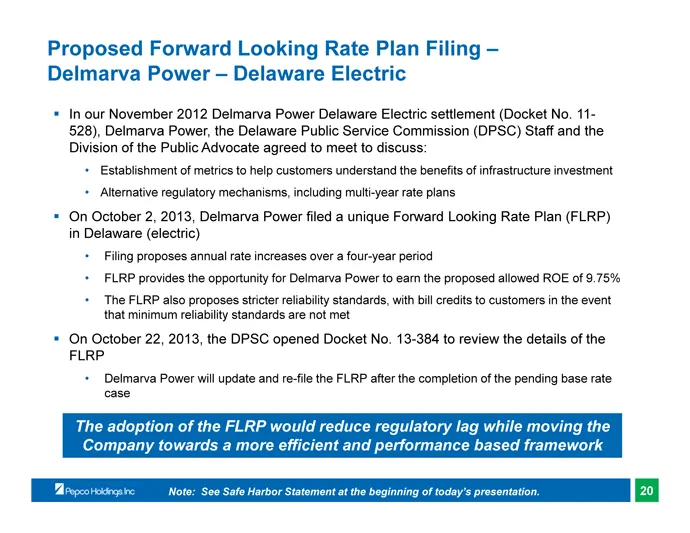
Proposed Forward Looking Rate Plan Filing – Delmarva Power – Delaware Electric • In our November 2012 Delmarva Power Delaware Electric settlement (Docket No. 11-528), Delmarva Power, the Delaware Public Service Commission (DPSC) Staff and the Division of the Public Advocate agreed to meet to discuss
Slide 22: Pepco Undergrounding Status – District of Columbia
Pepco Undergrounding Status – District of Columbia • In May 2013, the Mayor of the District of Columbia (District) accepted the recommendations presented by the Power Line Undergrounding Task Force: • A seven to ten year, $1 billion program to underground up to 60 high voltage distribution feeder li
Slide 23: Pepco Energy Services – Overview
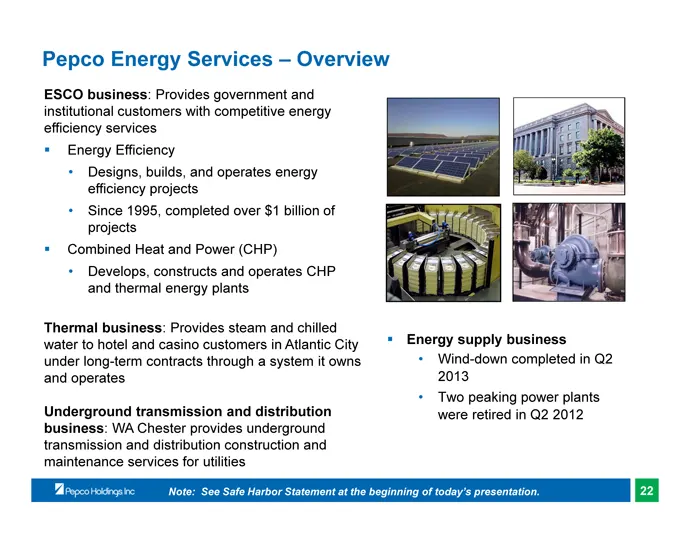
Pepco Energy Services – Overview ESCO business : Provides government and institutional customers with competitive energy efficiency services • Energy Efficiency • Designs, builds, and operates energy efficiency projects • Since 1995, completed over $1 billion of projects • Combined Heat and Power (C
Slide 24: Pepco Energy Services
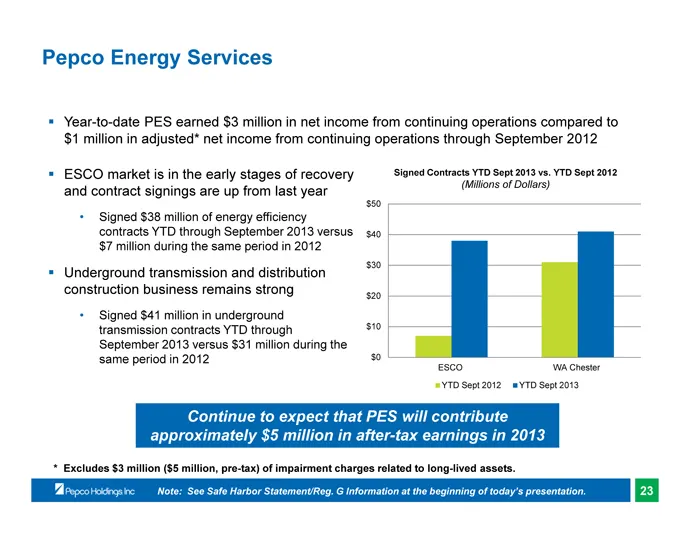
Pepco Energy Services • Year-to-date PES earned $3 million in net income from continuing operations compared to $1 million in adjusted* net income from continuing operations through September 2012 • ESCO market is in the early stages of recovery and contract signings are up from last year • Signed $
Slide 25: Recent Financings
Recent Financings Credit Facility · On August 1, 2013, PHI and its utility subsidiaries extended the expiration date of the $1.5 billion credit facility by one year to August 1, 2018; the terms and conditions of the credit facility otherwise remained unchanged Delmarva Power Bond Issuance • Delmarva
Slide 26: 2013 Earnings Guidance
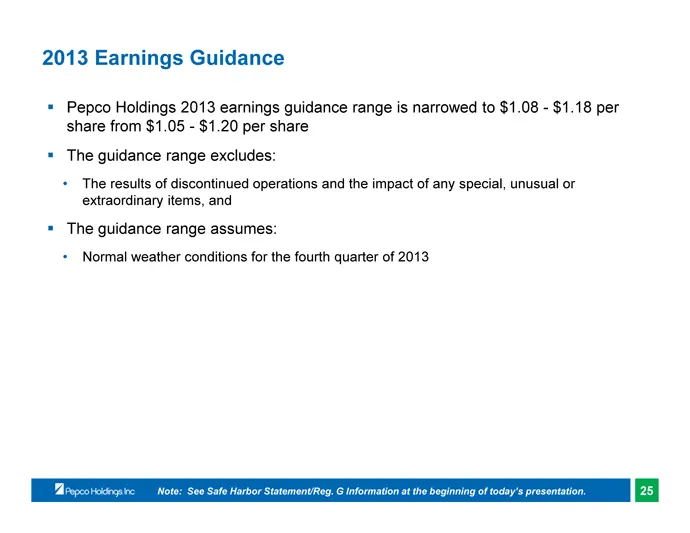
2013 Earnings Guidance • Pepco Holdings 2013 earnings guidance range is narrowed to $1.08 - $1.18 per share from $1.05 - $1.20 per share • The guidance range excludes: • The results of discontinued operations and the impact of any special, unusual or extraordinary items, and • The guidance range ass
Slide 27: PHI Value Proposition – Poised for Above Average Total Return
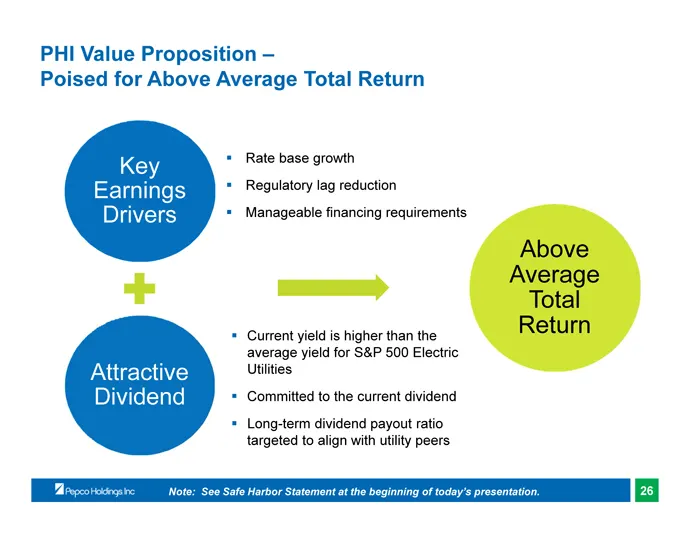
PHI Value Proposition – Poised for Above Average Total Return Key Rate base growth Earnings Regulatory lag reduction Drivers Manageable financing requirements • Current yield is higher than the average yield for S&P 500 Electric Attractive Utilities Dividend Committed to the current dividend • Long-
Slide 28: Appendix
Appendix
Slide 29: Projected Rate Base by Utility
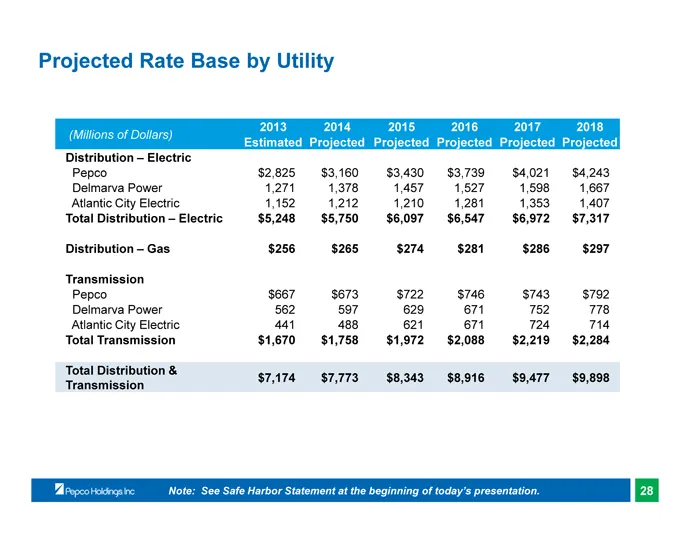
Projected Rate Base by Utility (Millions of Dollars) 2013 2014 2015 2016 2017 2018 Estimated Projected Projected Projected Projected Projected Distribution – Electric Pepco $2,825 $3,160 $3,430 $3,739 $4,021 $4,243 Delmarva Power 1,271 1,378 1,457 1,527 1,598 1,667 Atlantic City Electric 1,152 1,212
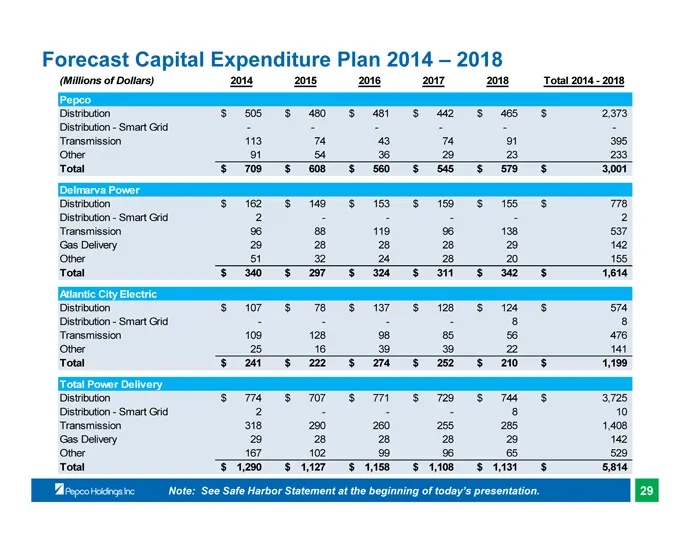
Slide 30: Forecast Capital Expenditure Plan 2014 – 2018
Forecast Capital Expenditure Plan 2014 – 2018 (Millions of Dollars) 2014 2015 2016 2017 2018 Total 2014 - 2018 Pepco Distribution $ 505 $ 480 $ 481 $ 442 $ 465 $ 2,373 Distribution - Smart Grid - - - - - - Transmission 113 74 43 74 91 395 Other 91 54 36 29 23 233 Total $ 709 $ 608 $ 560 $ 545 $ 579
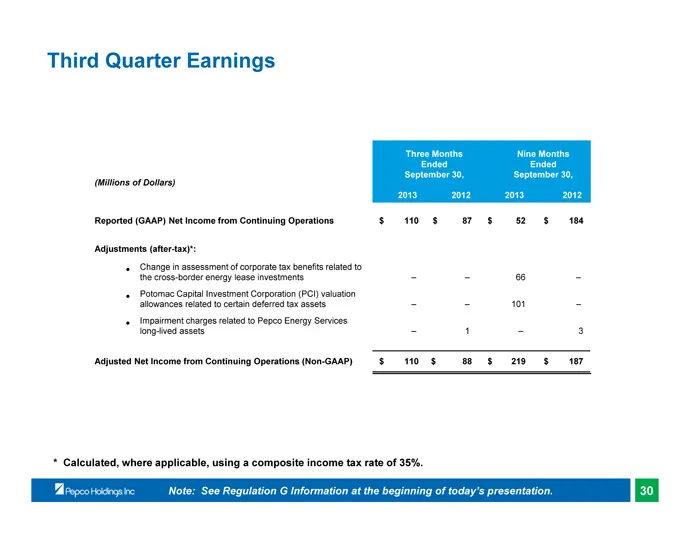
Slide 31: Third Quarter Earnings
Third Quarter Earnings Three Months Nine Months Ended Ended (Millions of Dollars) September 30, September 30, 2013 2012 2013 2012 Reported (GAAP) Net Income from Continuing Operations $ 110 $ 87 $ 52 $ 184 Adjustments (after-tax)*: · Change in assessment of corporate tax benefits related to the cros
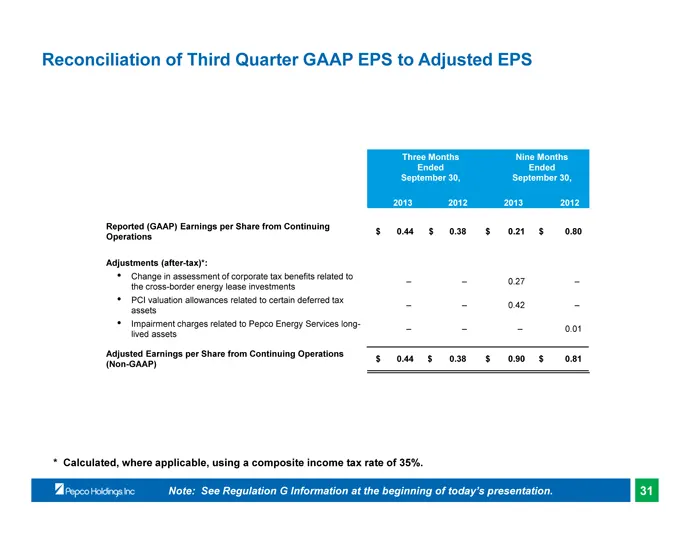
Slide 32: Reconciliation of Third Quarter GAAP EPS to Adjusted EPS
Reconciliation of Third Quarter GAAP EPS to Adjusted EPS Three Months Nine Months Earnings per Share from Continuing Operations Ended Ended September 30, September 30, 2013 2012 2013 2012 Reported (GAAP) Earnings per Share from Continuing $ 0.44 $ 0.38 $ 0.21 $ 0.80 Operations Adjustments (after-tax
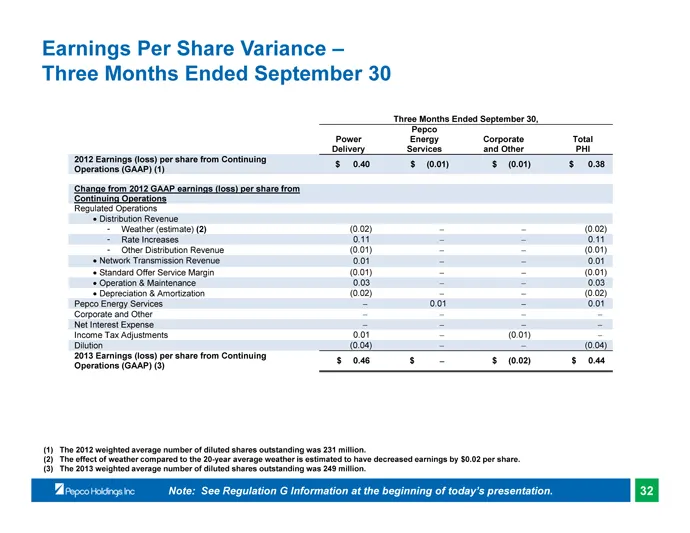
Slide 33: Earnings Per Share Variance – Three Months Ended September 30
Earnings Per Share Variance – Three Months Ended September 30 Three Months Ended September 30, Pepco 2012 Earnings (loss) per share from Continuing Operations (GAAP) (1) Power Energy Corporate Total Delivery Services and Other PHI $ 0.40 $ (0.01) $ (0.01) $ 0.38 Change from 2012 GAAP earnings (loss)
Slide 34: Earnings Per Share Variance – Nine Months Ended September 30
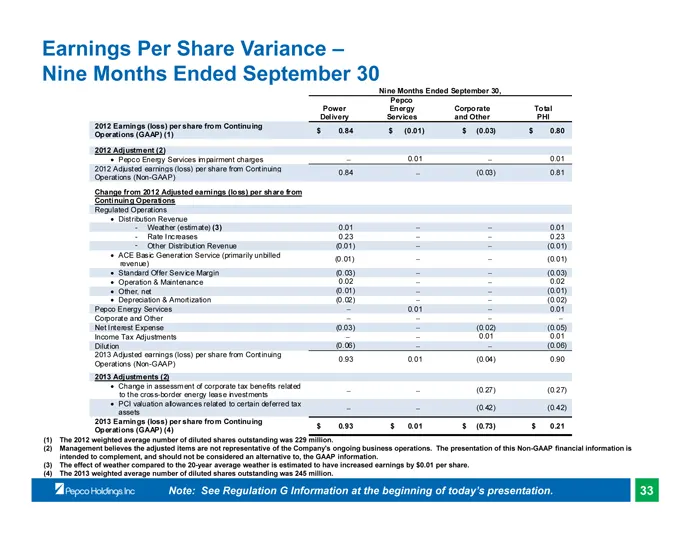
Earnings Per Share Variance – Nine Months Ended September 30 Nine Months Ended September 30, Pepco Power Energy Corporate Total Delivery Services and Other PHI 2012 Earnings (loss) per share from Continuing $ 0.84 $ (0.01) $ (0.03) $ 0.80 Operations (GAAP) (1) 2012 Adjustment (2) 0.01 0.01 · Pepco E
Slide 35: Cross-Border Energy Leases
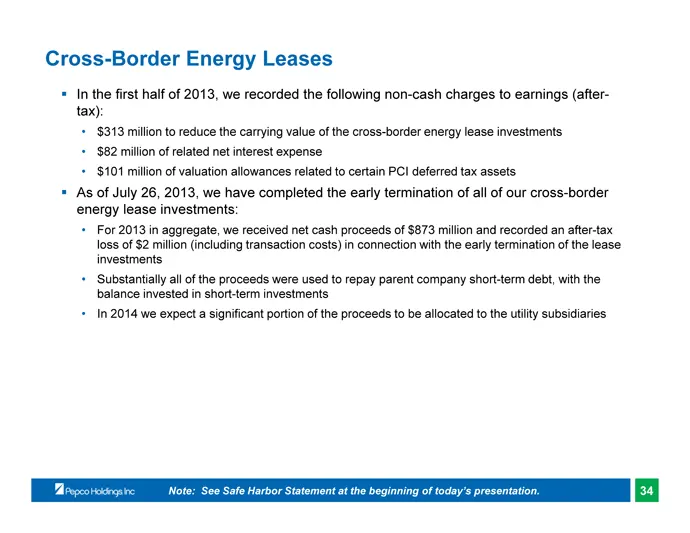
Cross-Border Energy Leases • In the first half of 2013, we recorded the following non-cash charges to earnings (after-tax): • $313 million to reduce the carrying value of the cross-border energy lease investments • $82 million of related net interest expense • $101 million of valuation allowances re
Slide 36: FERC Filing Challenging Our Transmission Rates
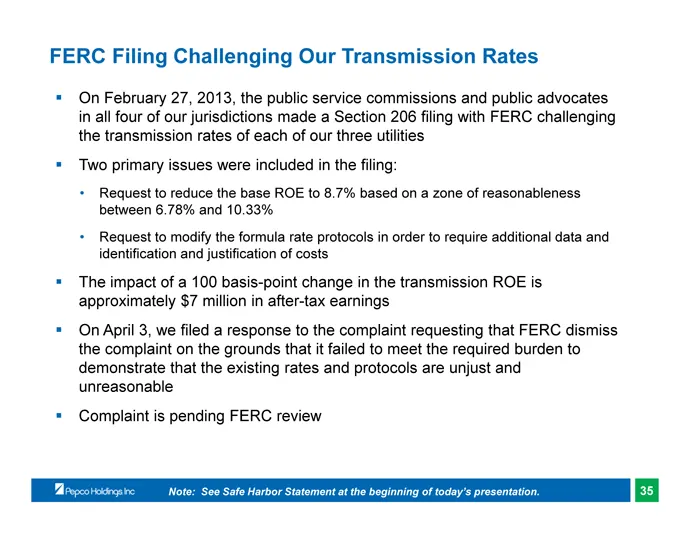
FERC Filing Challenging Our Transmission Rates • On February 27, 2013, the public service commissions and public advocates in all four of our jurisdictions made a Section 206 filing with FERC challenging the transmission rates of each of our three utilities • Two primary issues were included in the
Slide 37: MAPP Abandoned Cost Recovery
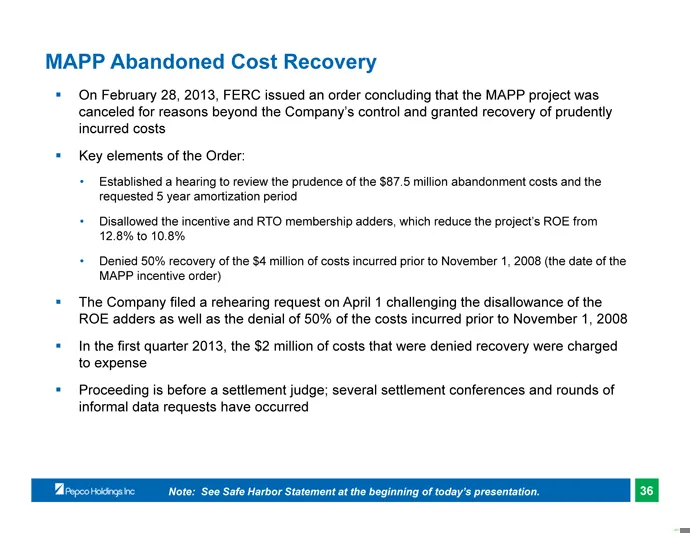
MAPP Abandoned Cost Recovery • On February 28, 2013, FERC issued an order concluding that the MAPP project was canceled for reasons beyond the Company’s control and granted recovery of prudently incurred costs • Key elements of the Order: • Established a hearing to review the prudence of the $87.5 m
Source: SEC EDGAR · 8-K filed Nov 8, 2013
More decks from Pepco Holdings Inc
 Merger or Acquisition (August 2014)15 slides · Aug 19, 2014
 Merger or Acquisition (May 2014)44 slides · May 23, 2014
 Q1 2014 Earnings Presentation14 slides · May 7, 2014
 Williams Capital Group Midwest Utilities Seminar (April 2014)35 slides · Apr 9, 2014
 Investor Day (March 2014)109 slides · Mar 21, 2014
 Morgan Stanley Utilities Conference 201439 slides · Feb 28, 2014