Fairmount Santrol Holdings Inc
Fairmount Santrol — Merger or Acquisition (January 2018)
42 slides from Fairmount Santrol's merger presentation, Jan 3, 2018
Slide 1: Creating a Leader in Proppant and Industrial Materials Solutions
January 2018 Creating a Leader in Proppant and Industrial Materials Solutions Exhibit 99.1
Slide 2: Cautionary Statement Regarding Forward-Looking Information
CAUTIONARY STATEMENT REGARDING FORWARD-LOOKING INFORMATION This communication contains statements which, to the extent they are not statements of historical or present fact, constitute “forward-looking” statements within the meaning of Section 21E of the Securities Exchange Act of 1934, as amended,
Slide 3: Note on GAAP and IFRS Reporting Standards
Note on GAAP and IFRS Reporting Standards Fairmount Santrol prepares its financial statements in accordance with U.S. generally accepted accounting principles, or GAAP, while Unimin currently prepares its financial statements in accordance with International Financial Reporting Standards, or IFRS, a
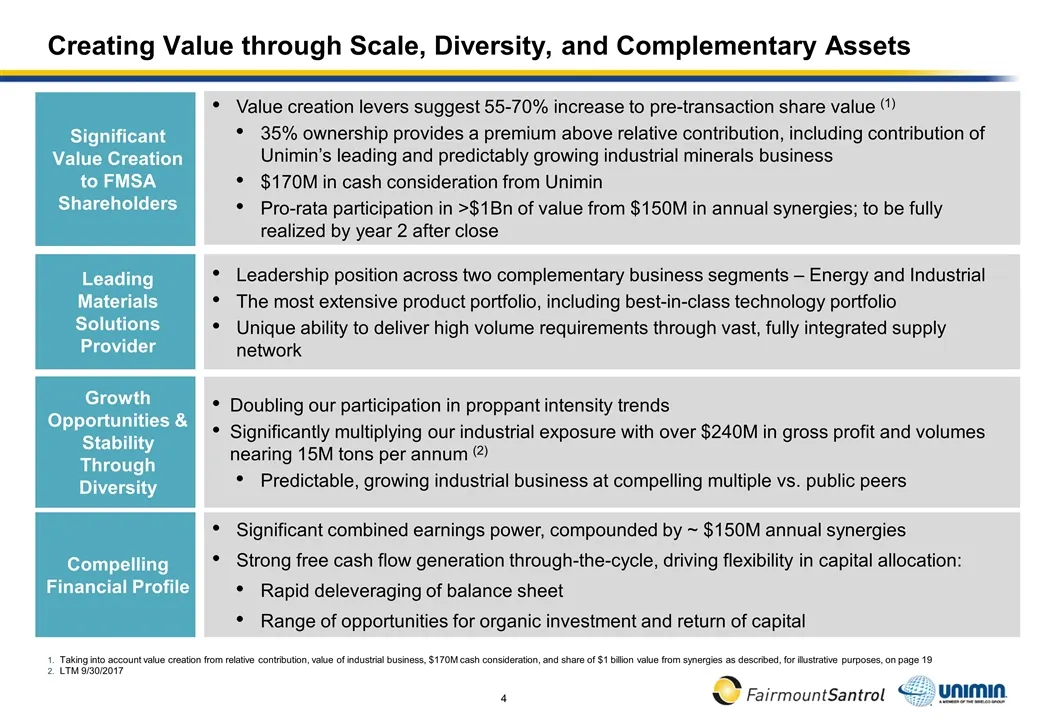
Slide 4: Creating Value through Scale, Diversity, and Complementary Assets
Creating Value through Scale, Diversity, and Complementary Assets Taking into account value creation from relative contribution, value of industrial business, $170M cash consideration, and share of $1 billion value from synergies as described, for illustrative purposes, on page 19 LTM 9/30/2017 Sign
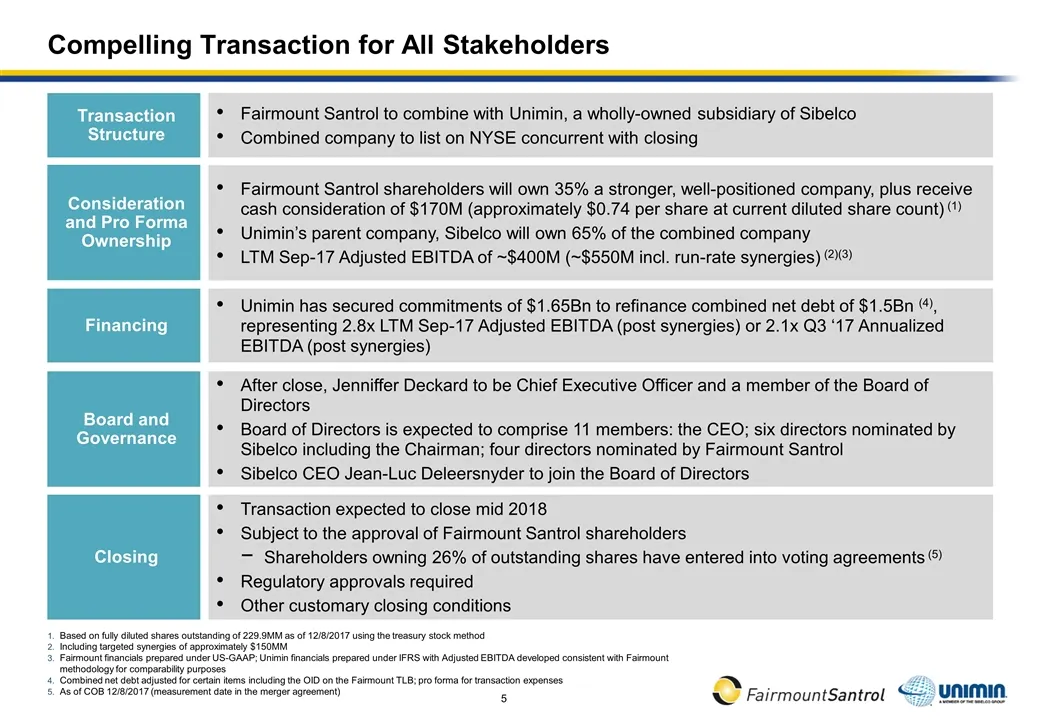
Slide 5: Compelling Transaction for All Stakeholders
Compelling Transaction for All Stakeholders Based on fully diluted shares outstanding of 229.9MM as of 12/8/2017 using the treasury stock method Including targeted synergies of approximately $150MM Fairmount financials prepared under US-GAAP; Unimin financials prepared under IFRS with Adjusted EBITD
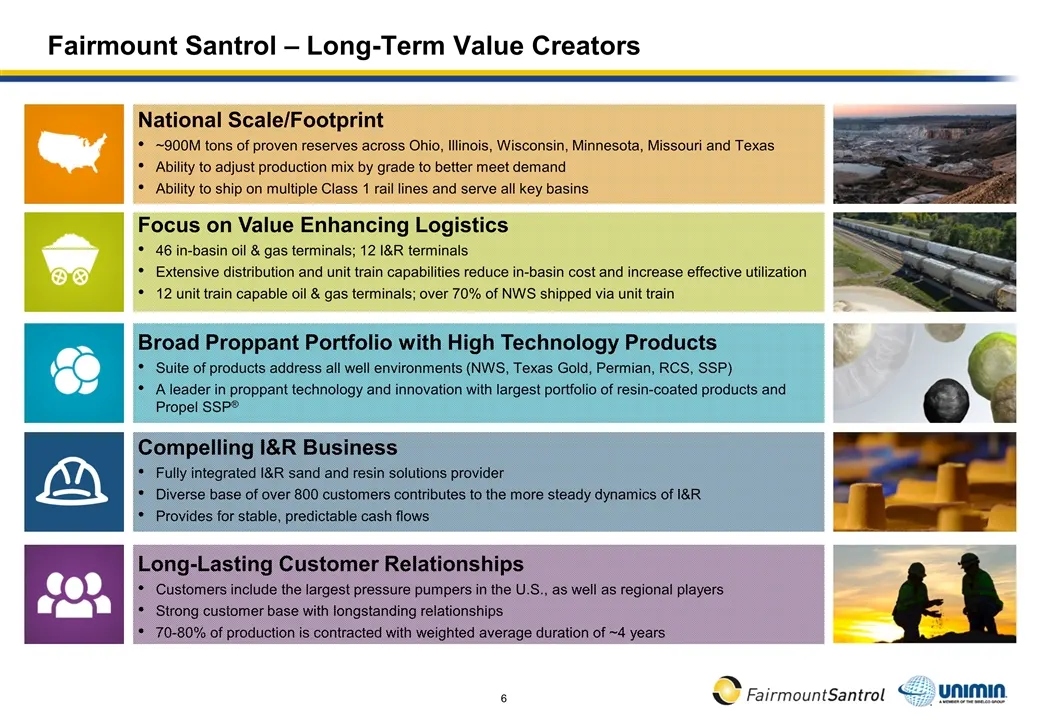
Slide 6: Fairmount Santrol – Long-Term Value Creators
Fairmount Santrol – Long-Term Value Creators Broad Proppant Portfolio with High Technology Products Suite of products address all well environments (NWS, Texas Gold, Permian, RCS, SSP) A leader in proppant technology and innovation with largest portfolio of resin-coated products and Propel SSP® Nati
Slide 7: Overview of Unimin
Section 1 Overview of Unimin
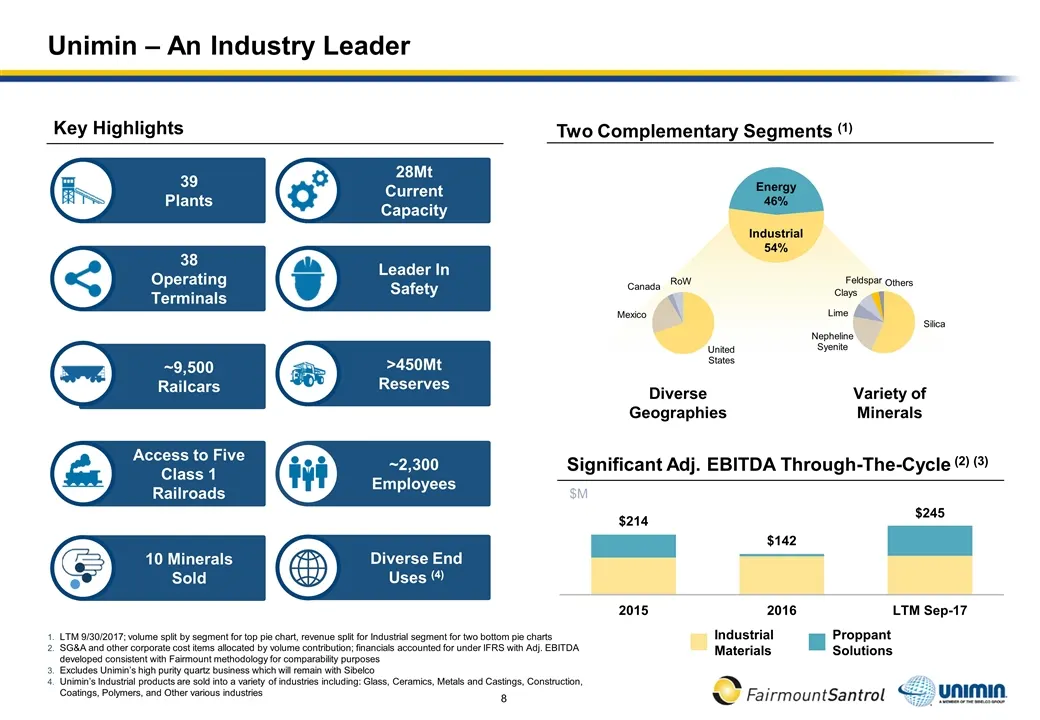
Slide 8: Unimin – An Industry Leader
Significant Adj. EBITDA Through-The-Cycle (2) (3) $M Industrial 54% Diverse Geographies Variety of Minerals Unimin – An Industry Leader Key Highlights Two Complementary Segments (1) Energy 46% 28Mt Current Capacity 39 Plants Leader In Safety 38 Operating Terminals >450Mt Reserves ~9,500 Railcars ~2,
Slide 9: Unimin's Optimized Plant & Logistics Network
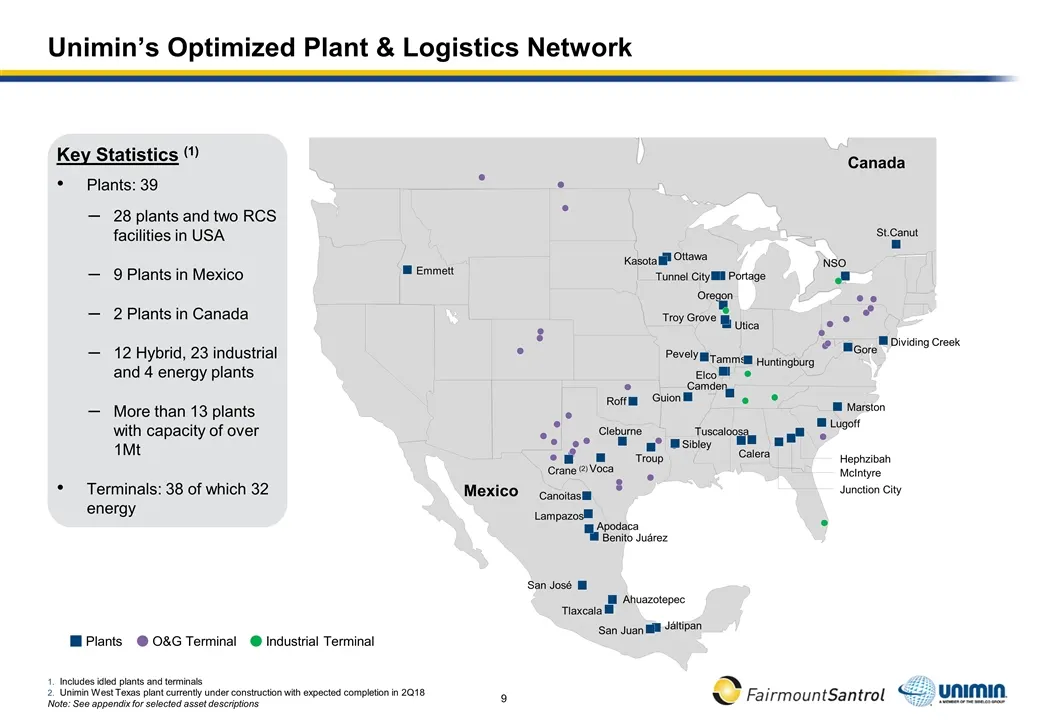
Unimin’s Optimized Plant & Logistics Network Plants O&G Terminal Industrial Terminal NSO Canada Mexico Key Statistics (1) Plants: 39 28 plants and two RCS facilities in USA 9 Plants in Mexico 2 Plants in Canada 12 Hybrid, 23 industrial and 4 energy plants More than 13 plants with capacity of over 1M
Slide 10: Unimin's Minerals Serve a Wide Variety of Industries
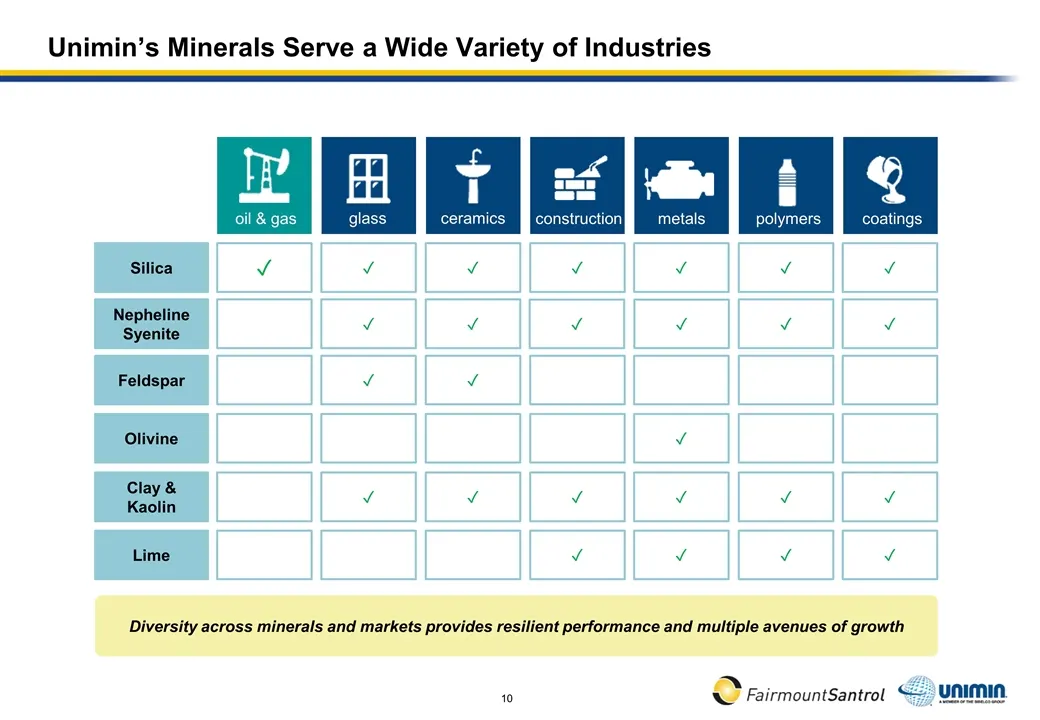
Unimin’s Minerals Serve a Wide Variety of Industries ceramics polymers glass coatings oil & gas metals construction Silica ✓ ✓ ✓ ✓ ✓ ✓ ✓ Feldspar Olivine Clay & Kaolin Lime Nepheline Syenite ✓ ✓ ✓ ✓ ✓ ✓ ✓ ✓ ✓ ✓ ✓ ✓ ✓ ✓ ✓ ✓ ✓ Diversity across minerals and markets provides resilient performance and mu
Slide 11: Unimin's Energy Business
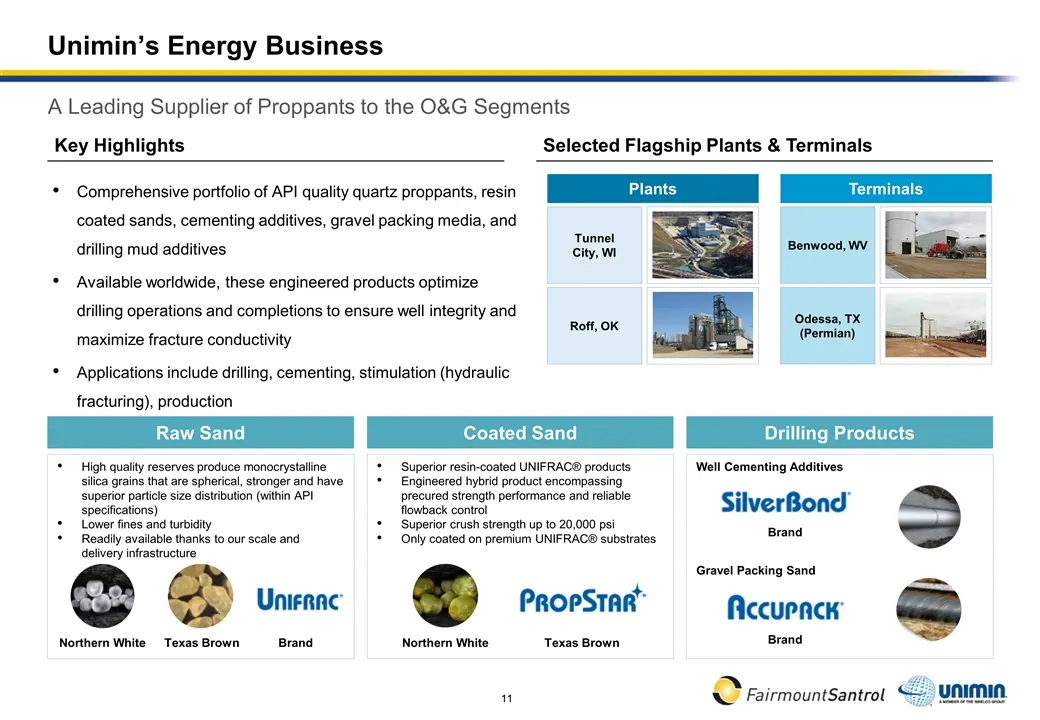
Unimin’s Energy Business A Leading Supplier of Proppants to the O&G Segments Well Cementing Additives Gravel Packing Sand Raw Sand Coated Sand High quality reserves produce monocrystalline silica grains that are spherical, stronger and have superior particle size distribution (within API specificati
Slide 12: Unimin's Industrial Business
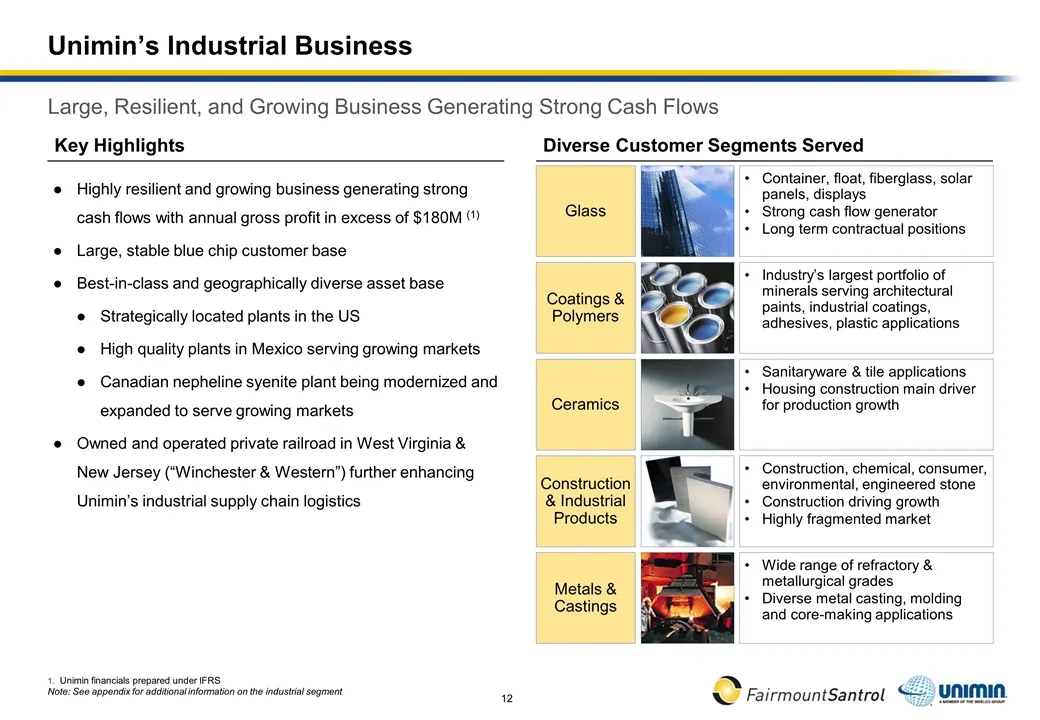
Unimin’s Industrial Business Key Highlights Diverse Customer Segments Served Large, Resilient, and Growing Business Generating Strong Cash Flows Highly resilient and growing business generating strong cash flows with annual gross profit in excess of $180M (1) Large, stable blue chip customer base Be
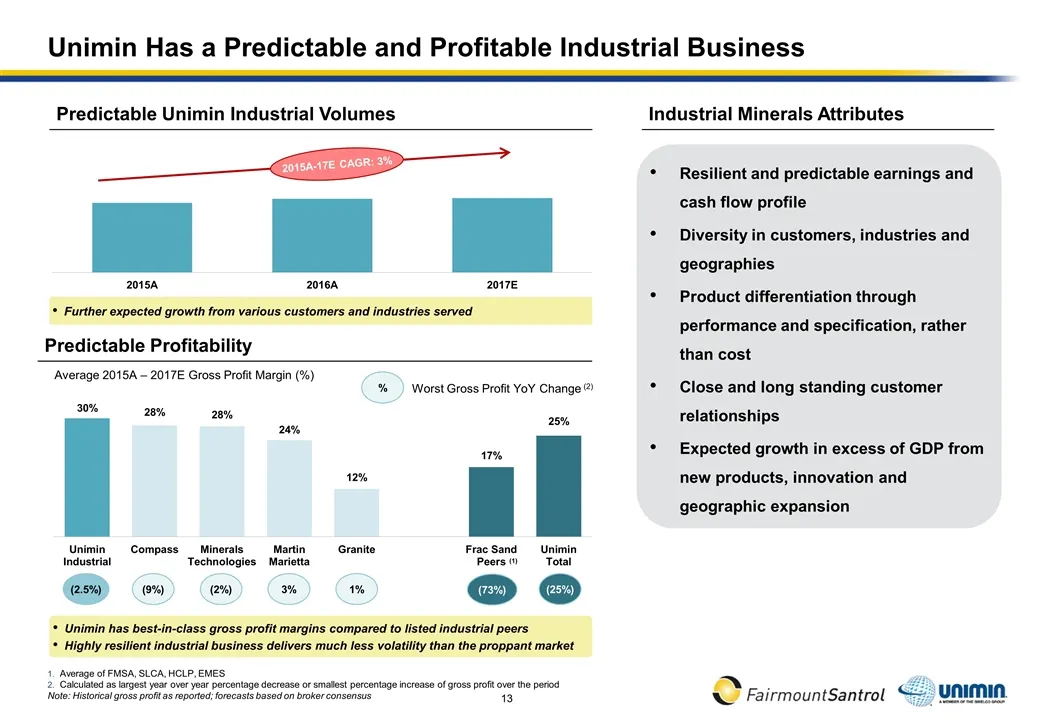
Slide 13: Unimin Has a Predictable and Profitable Industrial Business
Unimin Has a Predictable and Profitable Industrial Business Further expected growth from various customers and industries served Predictable Unimin Industrial Volumes 2015A-17E CAGR: 3% Average 2015A – 2017E Gross Profit Margin (%) (2.5%) (9%) (2%) 3% 1% % Worst Gross Profit YoY Change (2) (1) (25%)
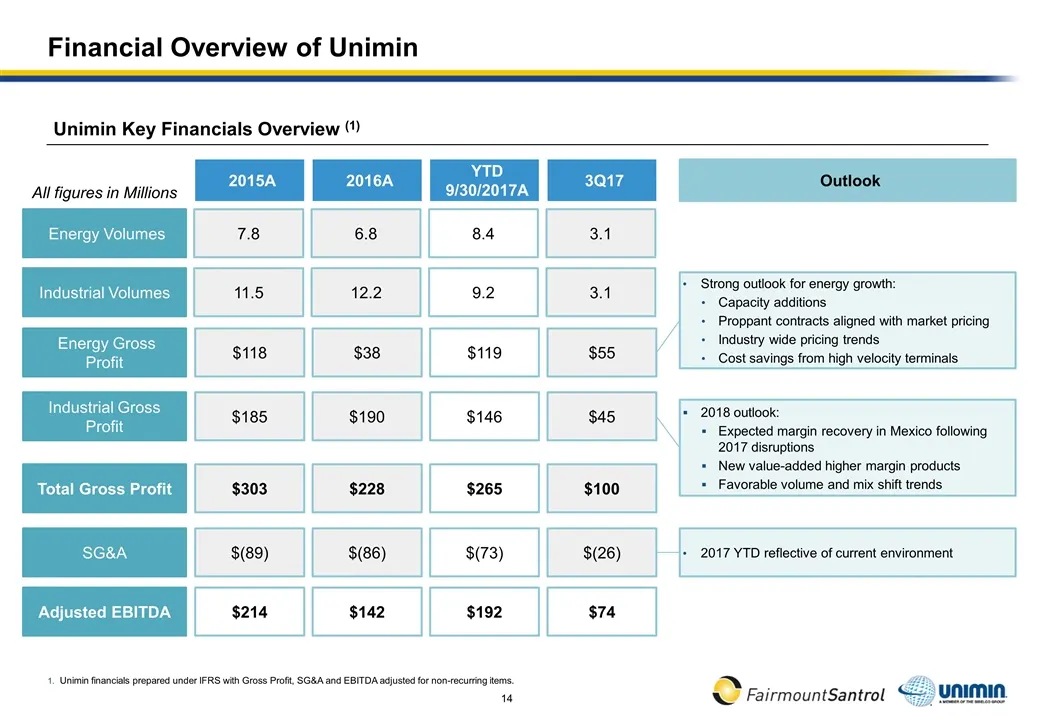
Slide 14: Financial Overview of Unimin
Financial Overview of Unimin Unimin financials prepared under IFRS with Gross Profit, SG&A and EBITDA adjusted for non-recurring items. Outlook Strong outlook for energy growth: Capacity additions Proppant contracts aligned with market pricing Industry wide pricing trends Cost savings from high velo
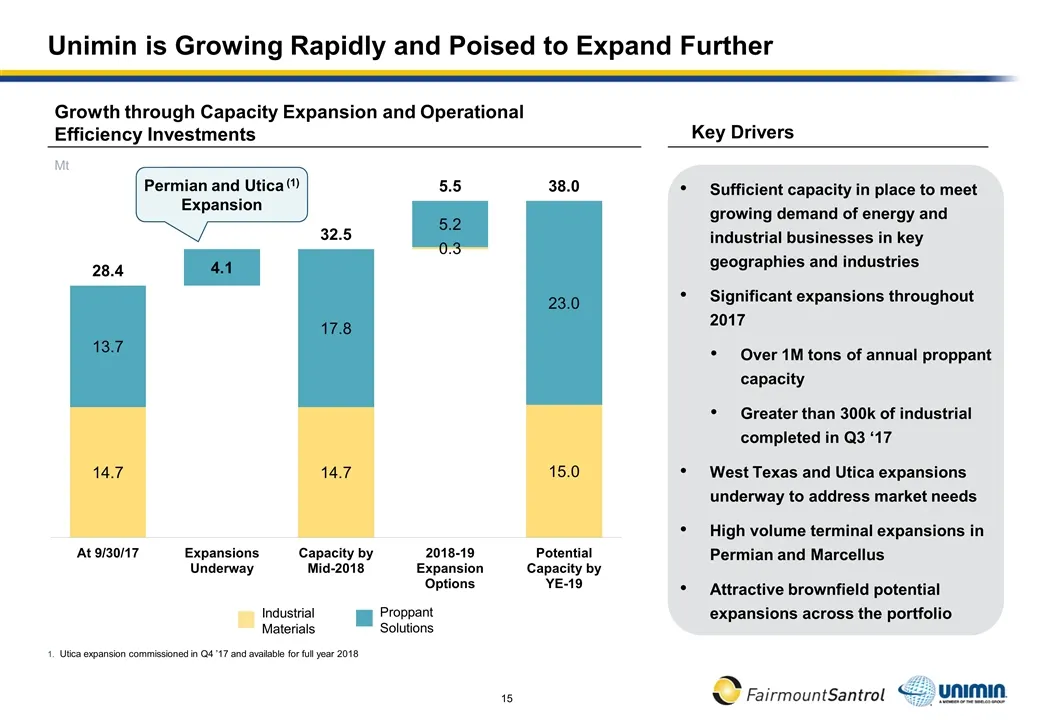
Slide 15: Unimin is Growing Rapidly and Poised to Expand Further
Unimin is Growing Rapidly and Poised to Expand Further Mt Growth through Capacity Expansion and Operational Efficiency Investments Industrial Materials Proppant Solutions Sufficient capacity in place to meet growing demand of energy and industrial businesses in key geographies and industries Signifi
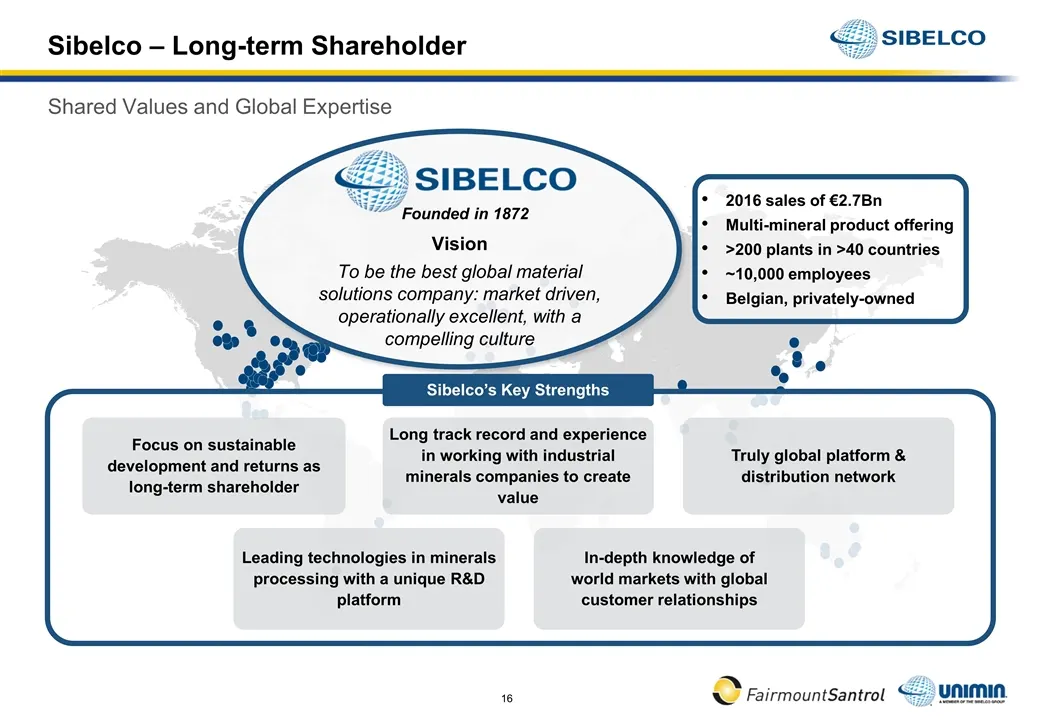
Slide 16: Sibelco – Long-term Shareholder Shared Values and Global Expertise
Sibelco – Long-term Shareholder Shared Values and Global Expertise Long track record and experience in working with industrial minerals companies to create value Focus on sustainable development and returns as long-term shareholder In-depth knowledge of world markets with global customer relationshi
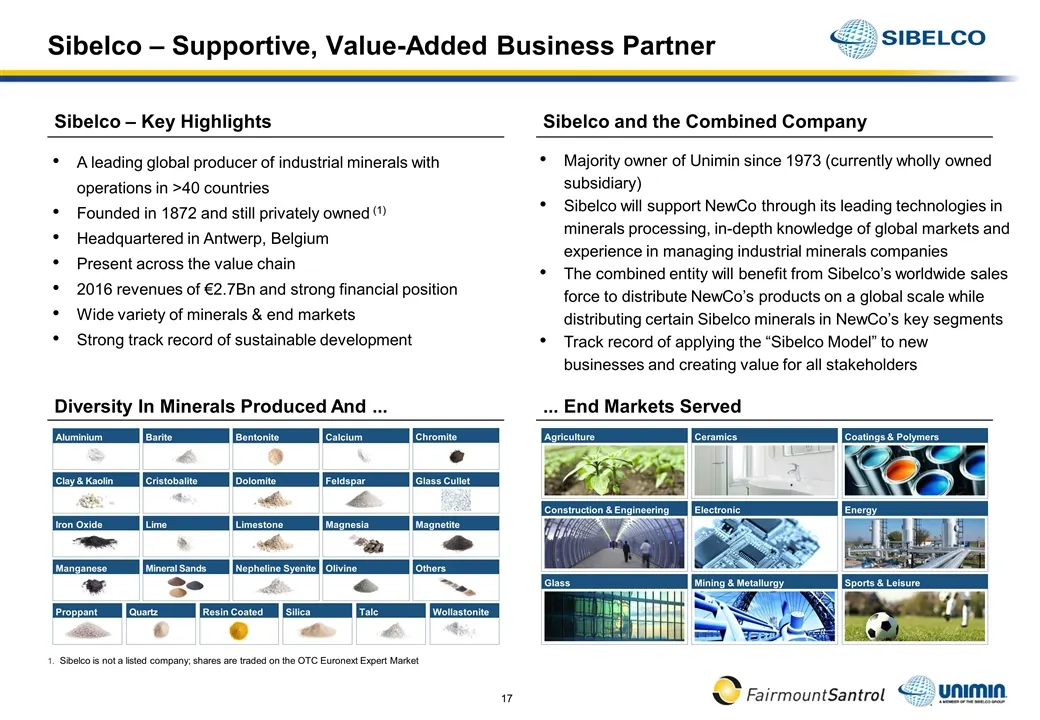
Slide 17: Sibelco – Supportive, Value-Added Business Partner
Diversity In Minerals Produced And .... ... End Markets Served Sibelco – Supportive, Value-Added Business Partner Sibelco – Key Highlights Sibelco and the Combined Company Sibelco is not a listed company; shares are traded on the OTC Euronext Expert Market A leading global producer of industrial min
Slide 18: Value Creation for Fairmount Shareholders
Section 2 Value Creation for Fairmount Shareholders
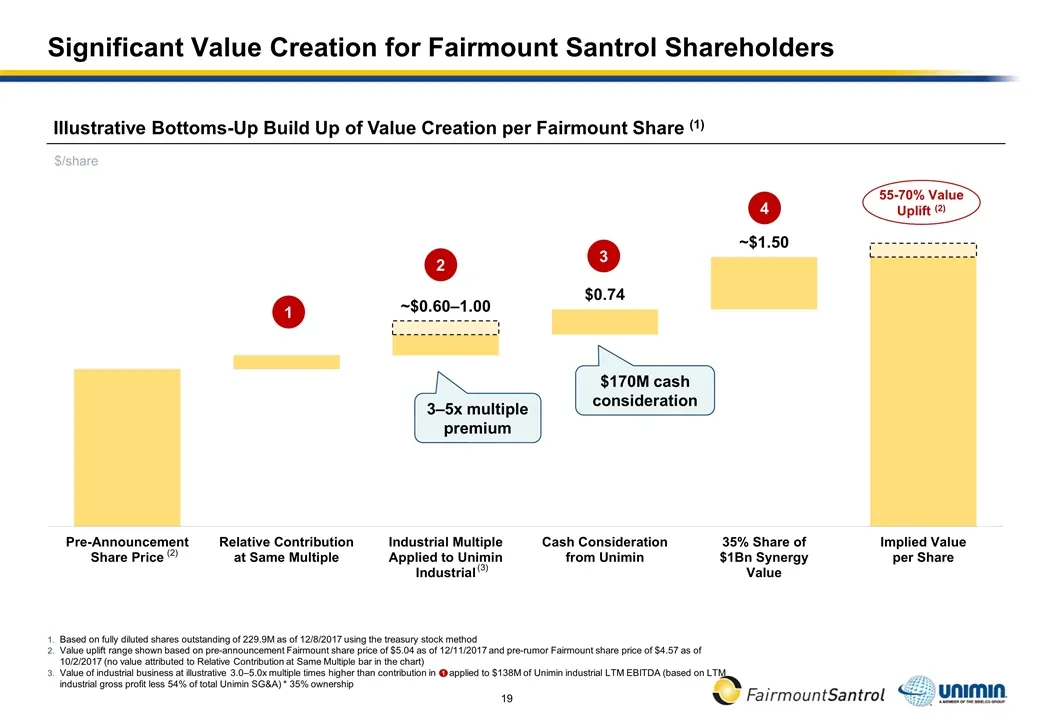
Slide 19: Significant Value Creation for Fairmount Santrol Shareholders
Significant Value Creation for Fairmount Santrol Shareholders Illustrative Bottoms-Up Build Up of Value Creation per Fairmount Share (1) $/share 1 2 3 4 3–5x multiple premium $170M cash consideration (3) Based on fully diluted shares outstanding of 229.9M as of 12/8/2017 using the treasury stock met
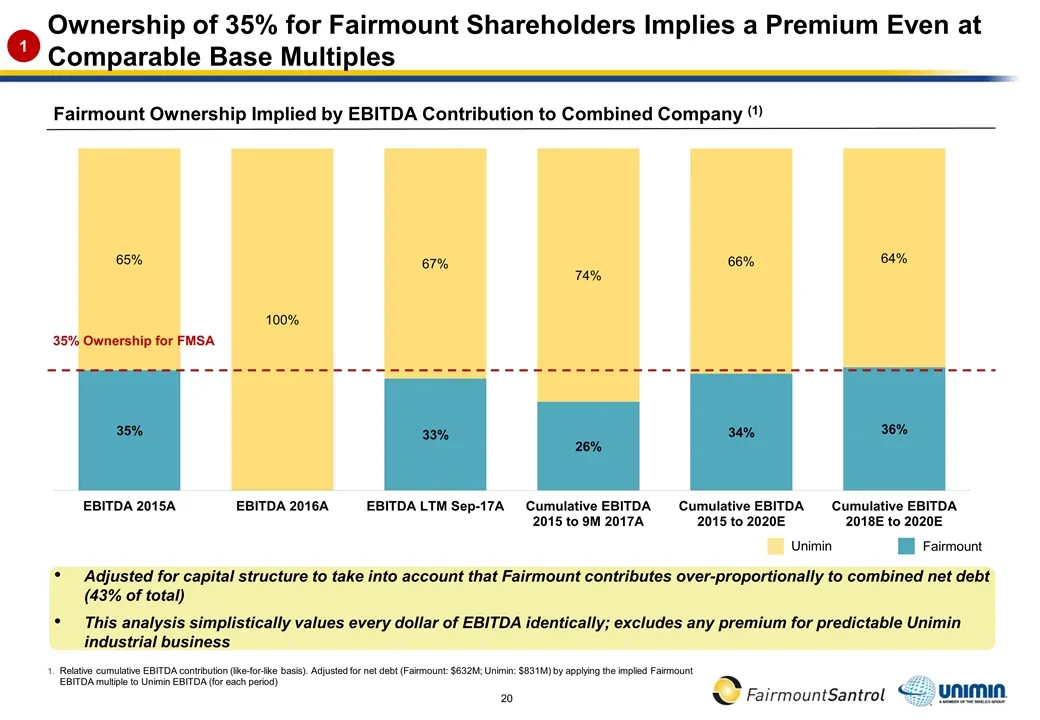
Slide 20: Ownership of 35% Implies a Premium Even at Comparable Base Multiples
Ownership of 35% for Fairmount Shareholders Implies a Premium Even at Comparable Base Multiples Fairmount Ownership Implied by EBITDA Contribution to Combined Company (1) Relative cumulative EBITDA contribution (like-for-like basis). Adjusted for net debt (Fairmount: $632M; Unimin: $831M) by applyin
Slide 21: Value of Stability Reflected in Industrial Trading Multiples
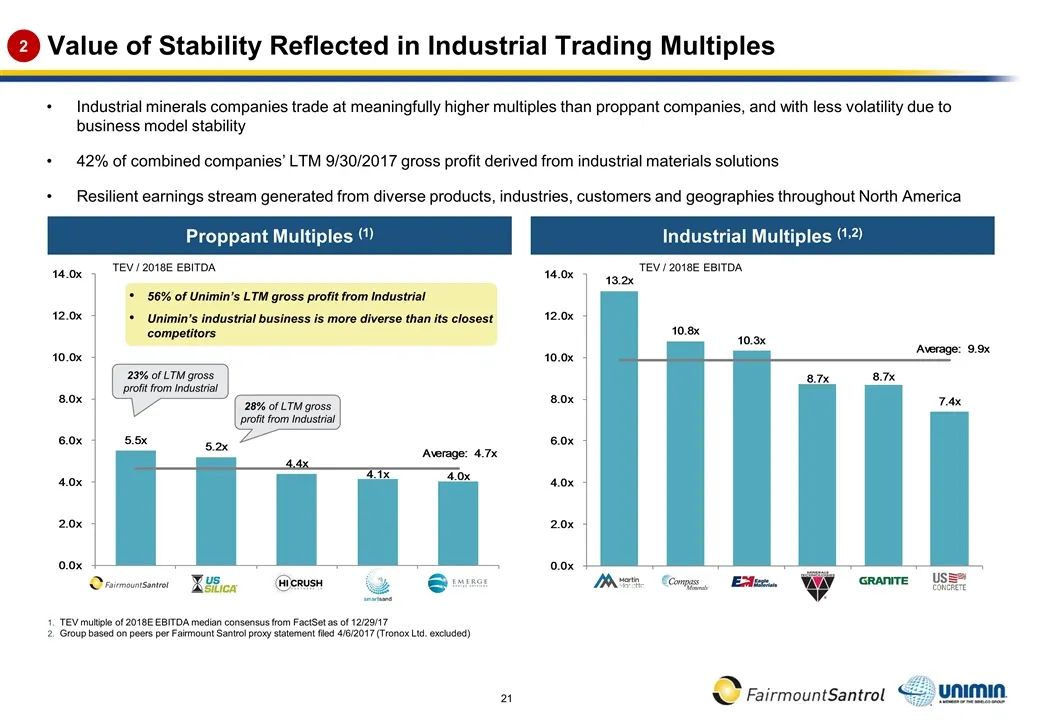
Value of Stability Reflected in Industrial Trading Multiples Industrial minerals companies trade at meaningfully higher multiples than proppant companies, and with less volatility due to business model stability 42% of combined companies’ LTM 9/30/2017 gross profit derived from industrial materials
Slide 22: Indicative Transaction Sources & Uses
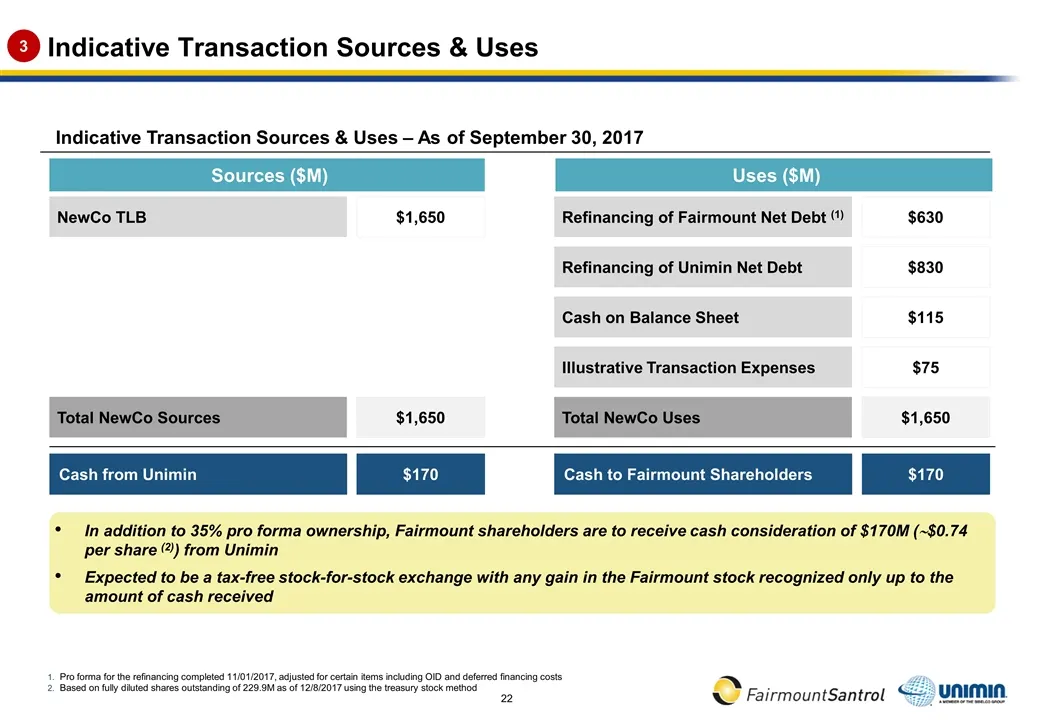
Indicative Transaction Sources & Uses Indicative Transaction Sources & Uses – As of September 30, 2017 Sources ($M) Total NewCo Sources $1,650 NewCo TLB Uses ($M) Total NewCo Uses $630 Refinancing of Fairmount Net Debt (1) $830 Refinancing of Unimin Net Debt $115 Cash on Balance Sheet $75 Illustrati
Slide 23: >$1Bn Value Creation from Quantified Synergies
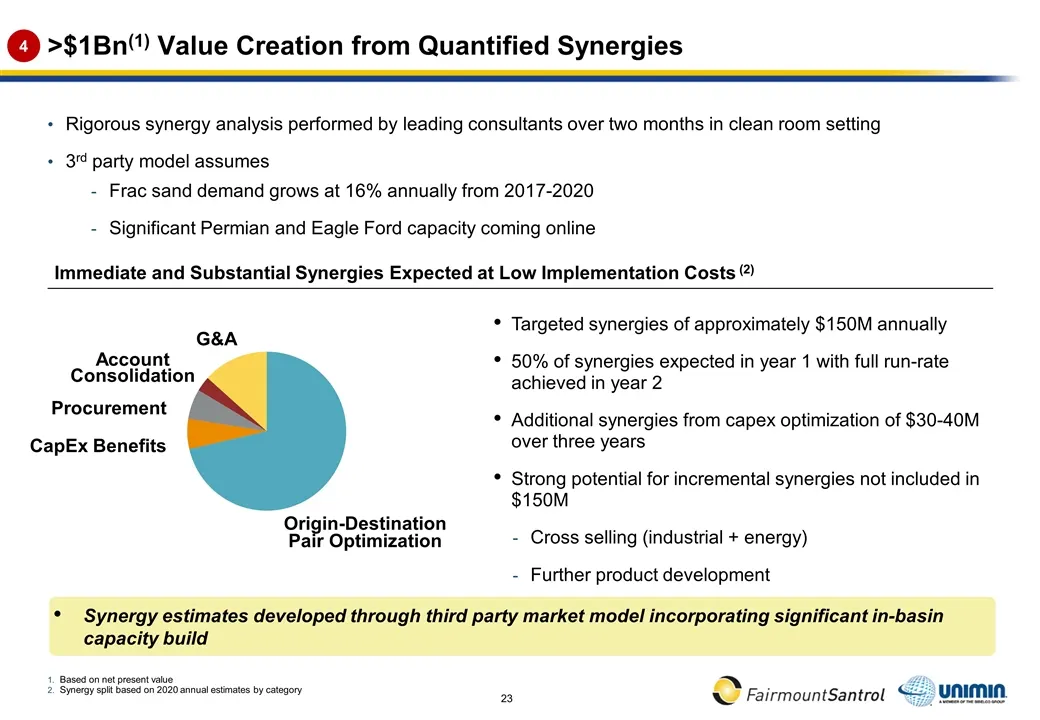
>$1Bn(1) Value Creation from Quantified Synergies Based on net present value Synergy split based on 2020 annual estimates by category 4 Rigorous synergy analysis performed by leading consultants over two months in clean room setting 3rd party model assumes Immediate and Substantial Synergies Expecte
Slide 24: Market Dynamics
Section 3 Market Dynamics
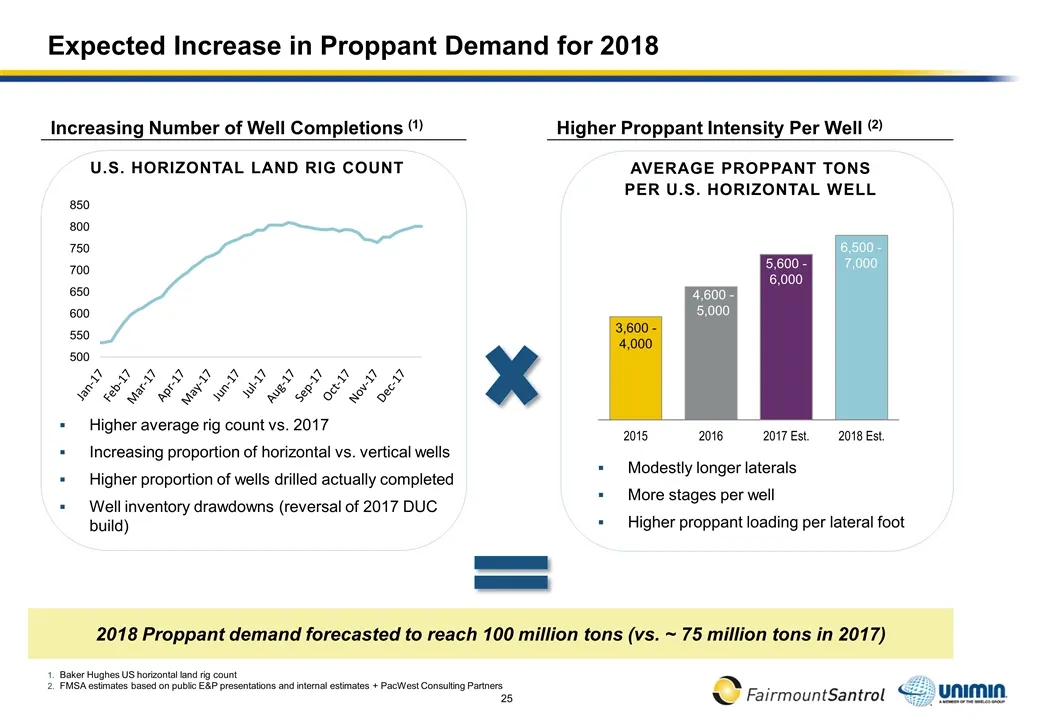
Slide 25: Expected Increase in Proppant Demand for 2018
Expected Increase in Proppant Demand for 2018 Average Proppant Tons per U.S. Horizontal Well 4,600 - 5,000 5,600 - 6,000 3,600 - 4,000 6,500 - 7,000 2018 Proppant demand forecasted to reach 100 million tons (vs. ~ 75 million tons in 2017) U.S. Horizontal Land Rig Count Higher average rig count vs. 2
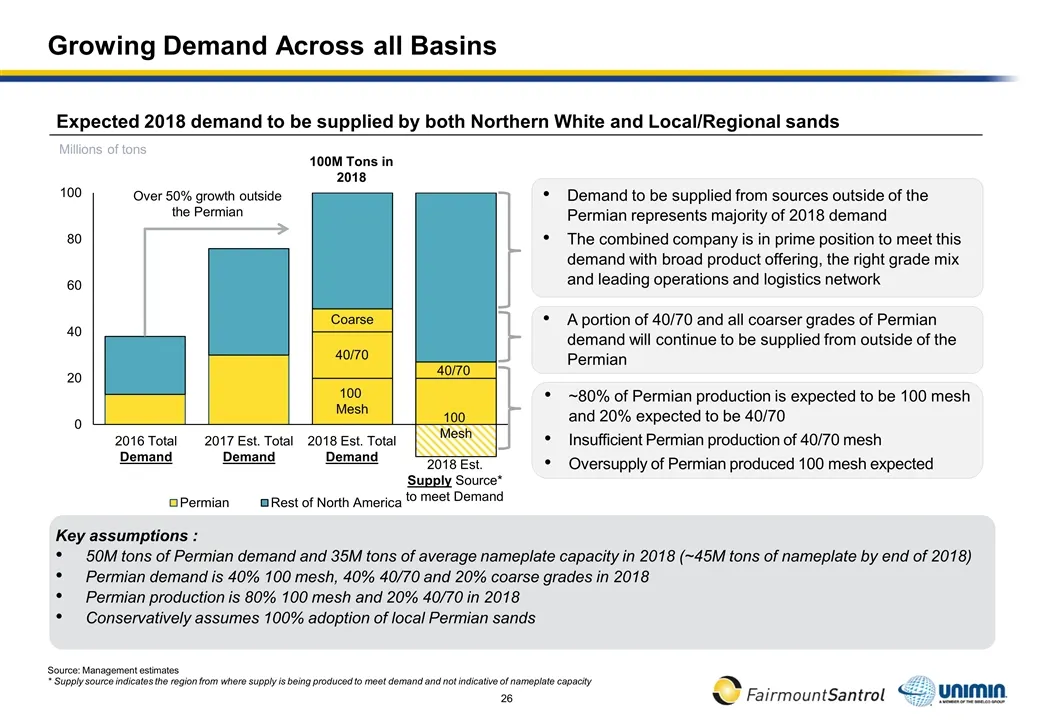
Slide 26: Growing Demand Across all Basins
Growing Demand Across all Basins Expected 2018 demand to be supplied by both Northern White and Local/Regional sands Millions of tons Over 50% growth outside the Permian 100M Tons in 2018 Coarse 40/70 100 Mesh 40/70 Demand to be supplied from sources outside of the Permian represents majority of 201
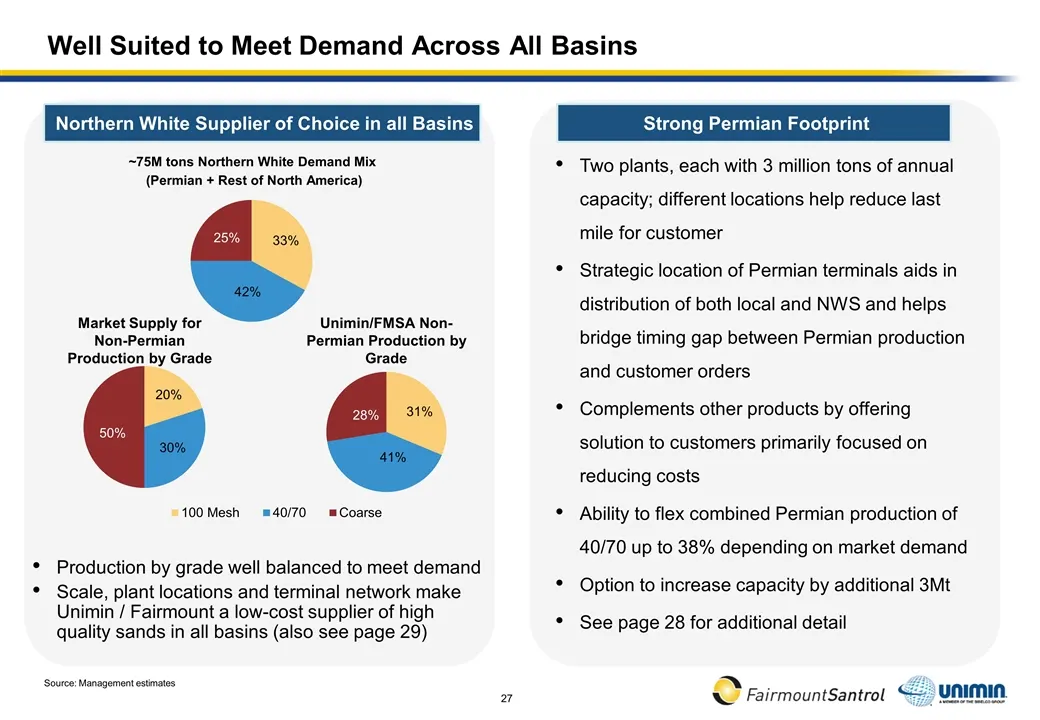
Slide 27: Well Suited to Meet Demand Across All Basins
Well Suited to Meet Demand Across All Basins Northern White Supplier of Choice in all Basins Strong Permian Footprint ~75M tons Northern White Demand Mix (Permian + Rest of North America) Unimin/FMSA Non-Permian Production by Grade Market Supply for Non-Permian Production by Grade Production by grad
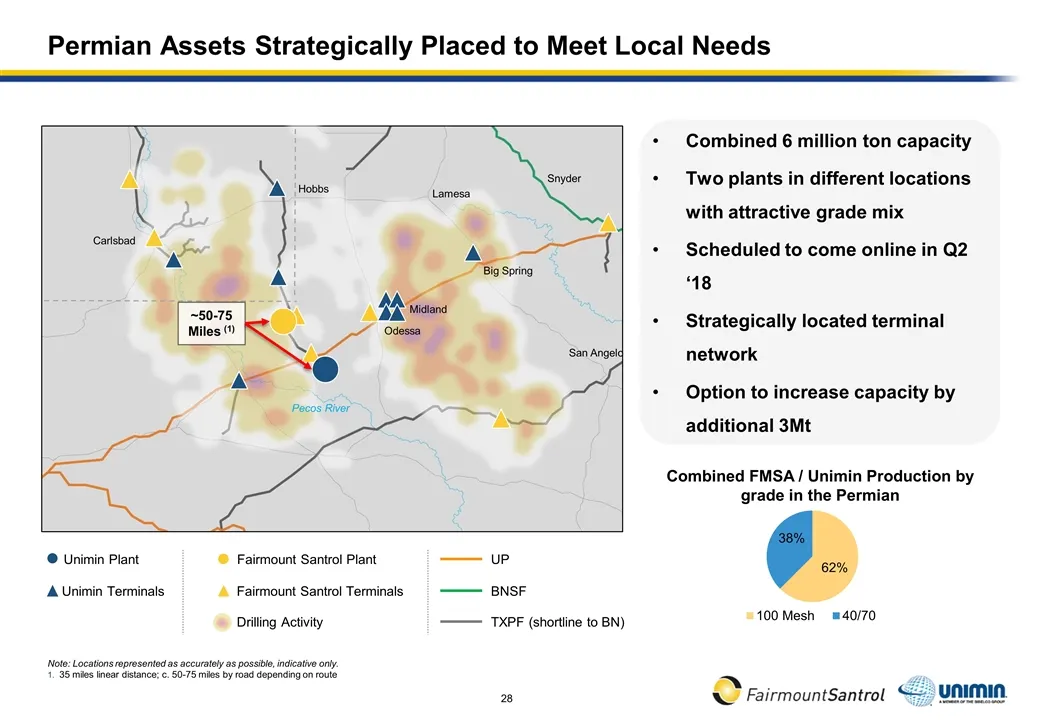
Slide 28: Permian Assets Strategically Placed to Meet Local Needs
Permian Assets Strategically Placed to Meet Local Needs Unimin Terminals Fairmount Santrol Plant Fairmount Santrol Terminals Combined 6 million ton capacity Two plants in different locations with attractive grade mix Scheduled to come online in Q2 ‘18 Strategically located terminal network Option to
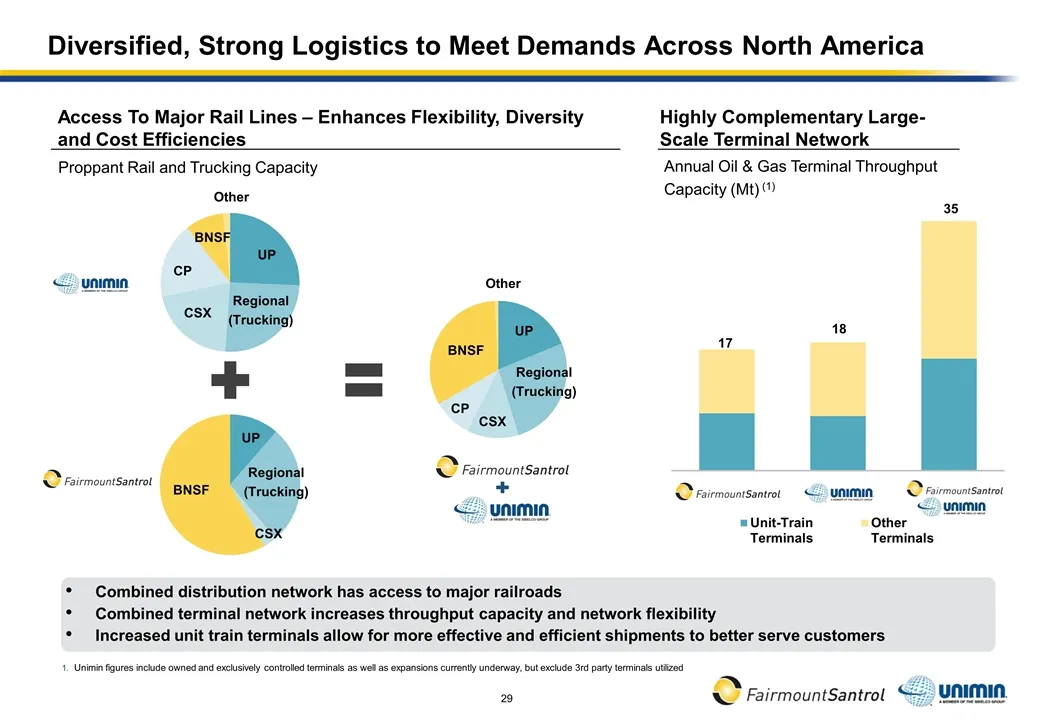
Slide 29: Diversified, Strong Logistics to Meet Demands Across North America
Combined distribution network has access to major railroads Combined terminal network increases throughput capacity and network flexibility Increased unit train terminals allow for more effective and efficient shipments to better serve customers Diversified, Strong Logistics to Meet Demands Across N
Slide 30: Compelling Pro Forma Investment Thesis
Compelling Pro Forma Investment Thesis Section 4
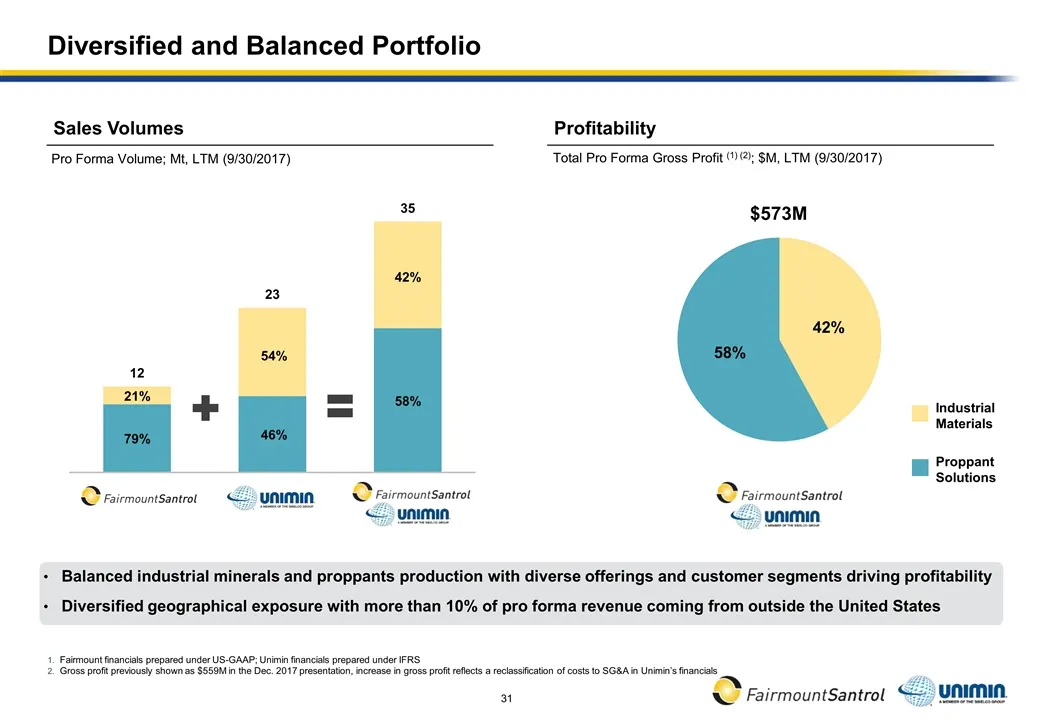
Slide 31: Diversified and Balanced Portfolio
Balanced industrial minerals and proppants production with diverse offerings and customer segments driving profitability Diversified geographical exposure with more than 10% of pro forma revenue coming from outside the United States Diversified and Balanced Portfolio Pro Forma Volume; Mt, LTM (9/30/
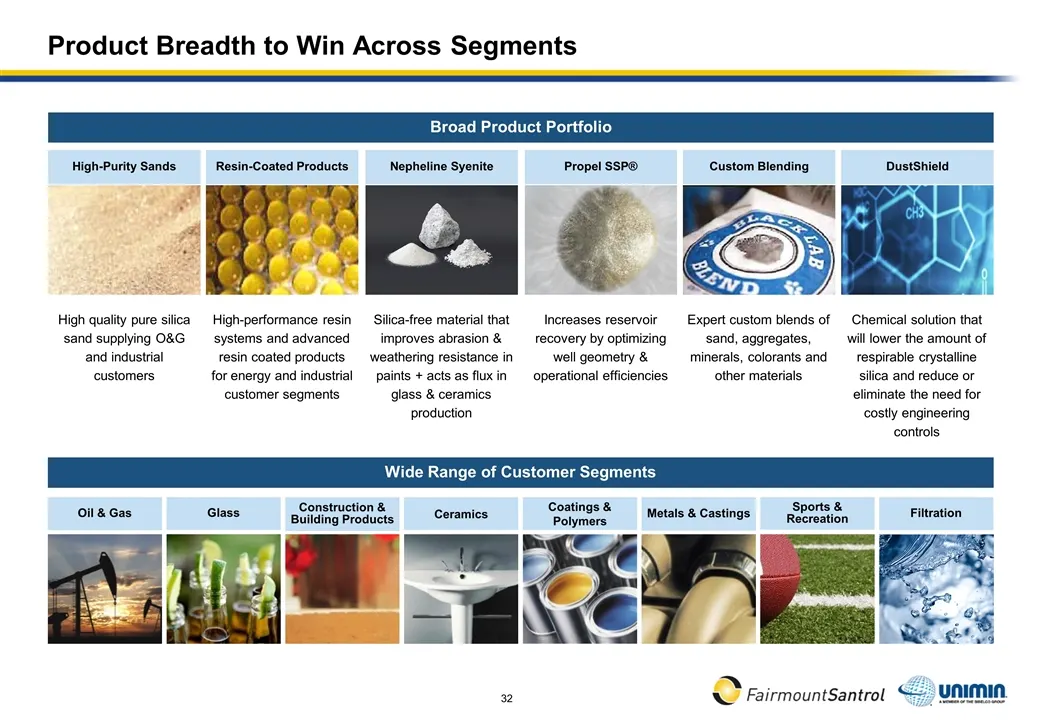
Slide 32: Product Breadth to Win Across Segments
Product Breadth to Win Across Segments Broad Product Portfolio Wide Range of Customer Segments Glass Construction & Building Products Ceramics Coatings & Polymers Metals & Castings Filtration Oil & Gas High-Purity Sands High quality pure silica sand supplying O&G and industrial customers Custom Blen
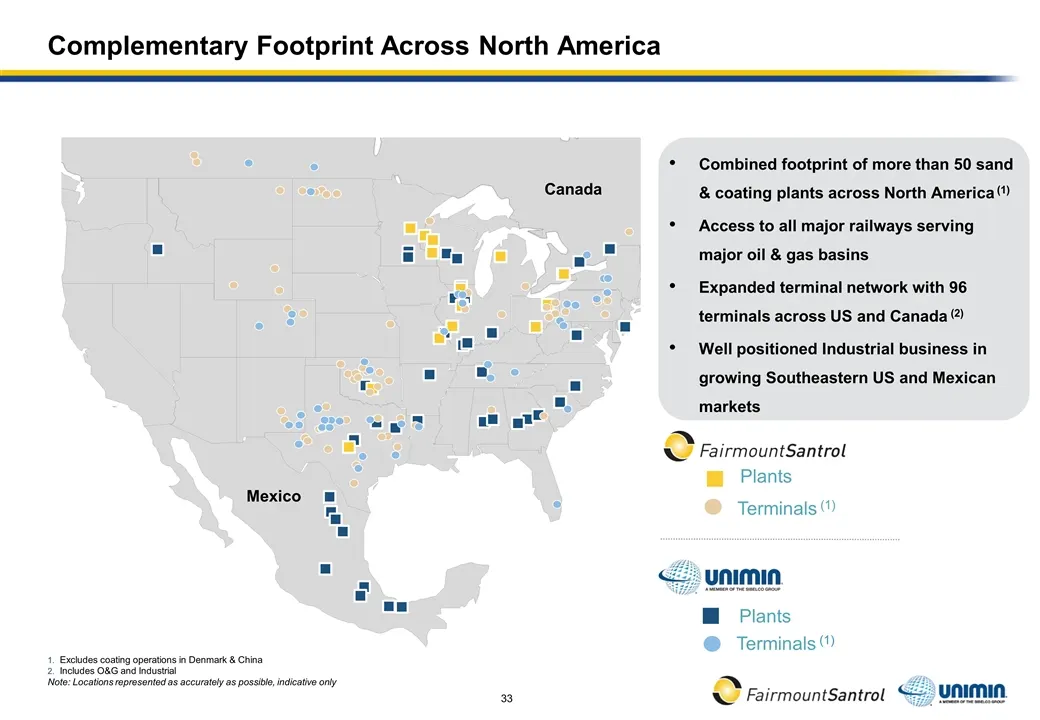
Slide 33: Complementary Footprint Across North America
Complementary Footprint Across North America Plants Plants Terminals (1) Terminals (1) Excludes coating operations in Denmark & China Includes O&G and Industrial Note: Locations represented as accurately as possible, indicative only Combined footprint of more than 50 sand & coating plants across Nor
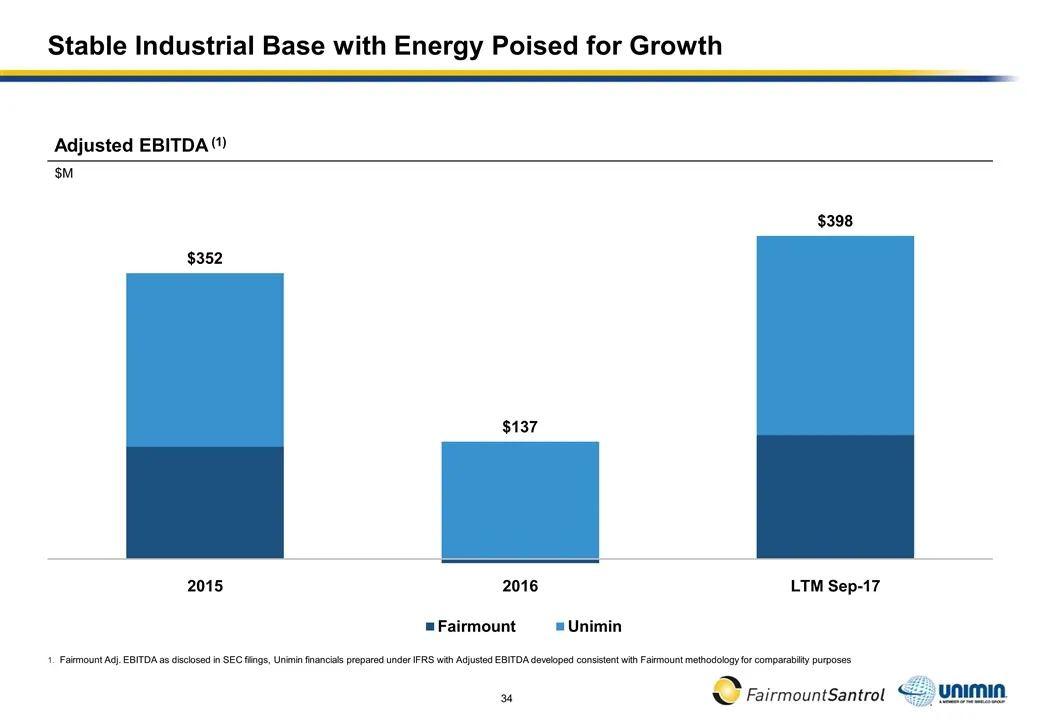
Slide 34: Stable Industrial Base with Energy Poised for Growth
Stable Industrial Base with Energy Poised for Growth Adjusted EBITDA (1) Fairmount Adj. EBITDA as disclosed in SEC filings, Unimin financials prepared under IFRS with Adjusted EBITDA developed consistent with Fairmount methodology for comparability purposes $M
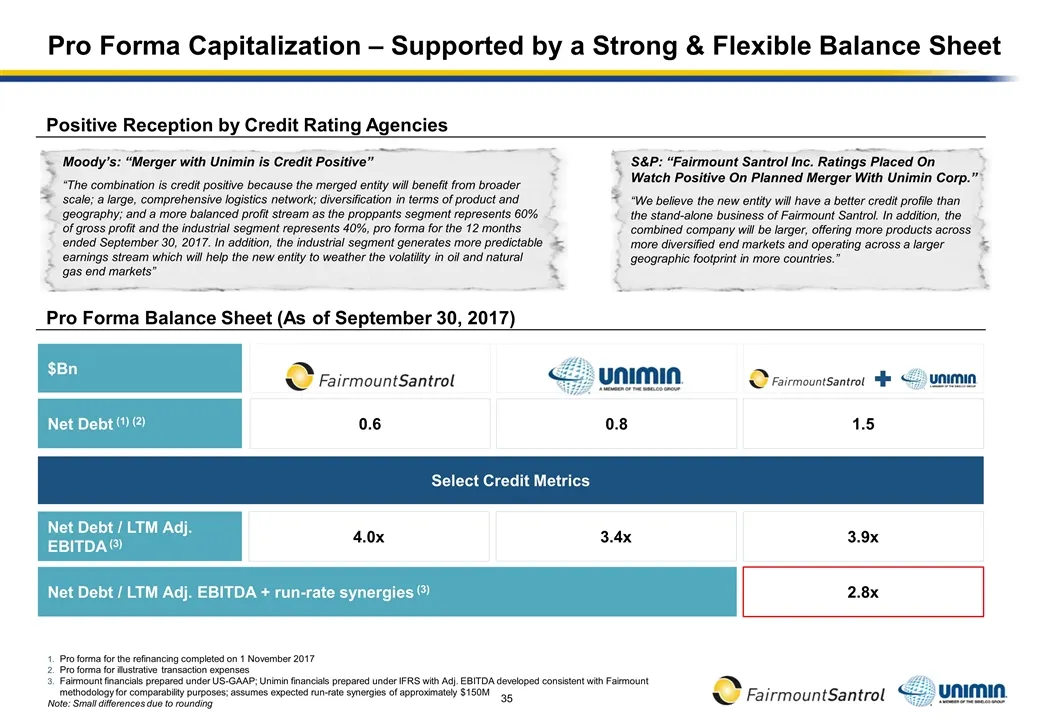
Slide 35: Pro Forma Capitalization – Supported by a Strong & Flexible Balance Sheet
Pro Forma Capitalization – Supported by a Strong & Flexible Balance Sheet Pro forma for the refinancing completed on 1 November 2017 Pro forma for illustrative transaction expenses Fairmount financials prepared under US-GAAP; Unimin financials prepared under IFRS with Adj. EBITDA developed consisten
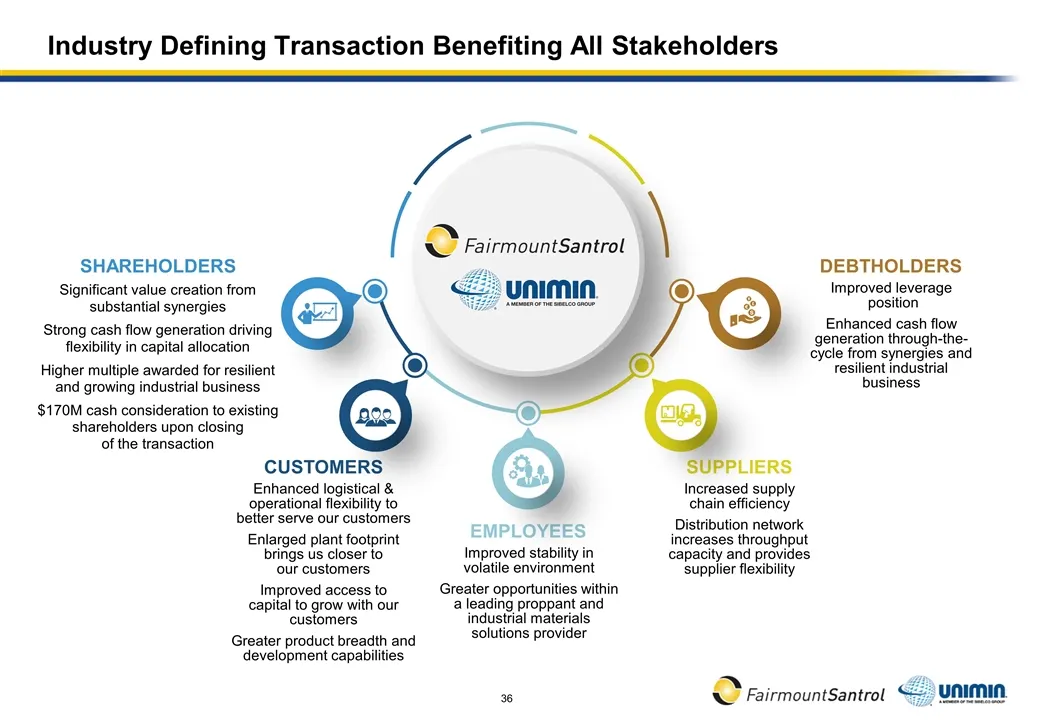
Slide 36: Industry Defining Transaction Benefiting All Stakeholders
Industry Defining Transaction Benefiting All Stakeholders SUPPLIERS Increased supply chain efficiency Distribution network increases throughput capacity and provides supplier flexibility CUSTOMERS Enhanced logistical & operational flexibility to better serve our customers Enlarged plant footprint br
Slide 37: Roadmap to Completion
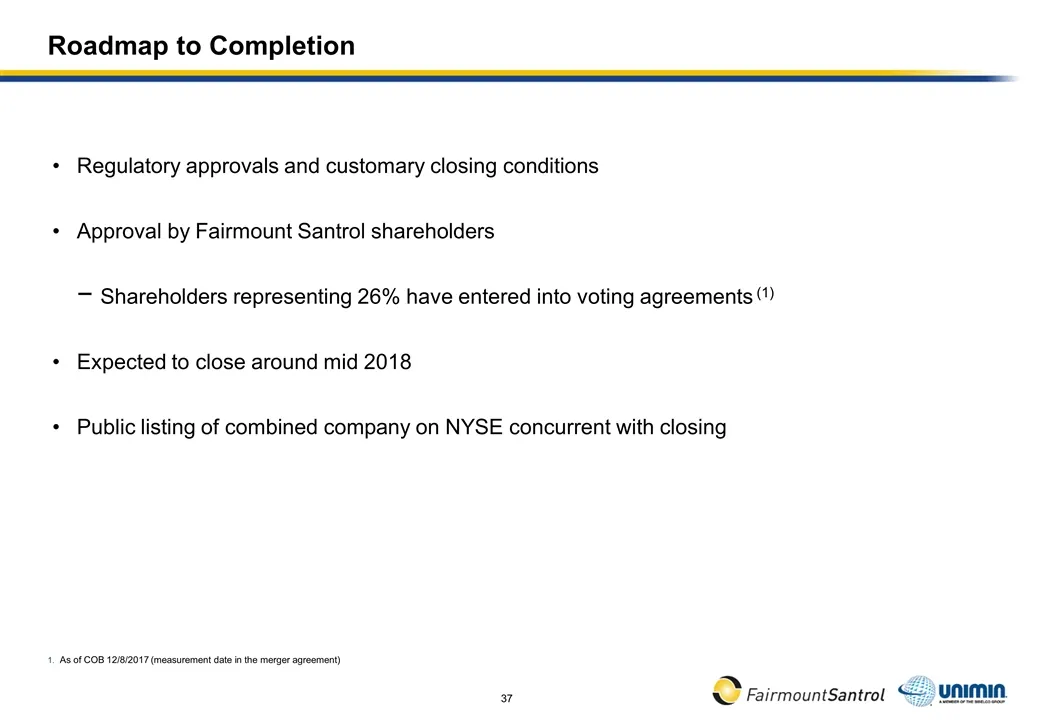
Roadmap to Completion Regulatory approvals and customary closing conditions Approval by Fairmount Santrol shareholders Shareholders representing 26% have entered into voting agreements (1) Expected to close around mid 2018 Public listing of combined company on NYSE concurrent with closing As of COB
Slide 38: Appendix: Unimin Selected Assets
Appendix Unimin Selected Assets
Slide 39: Unimin's Industrial Business – Glass and Ceramics
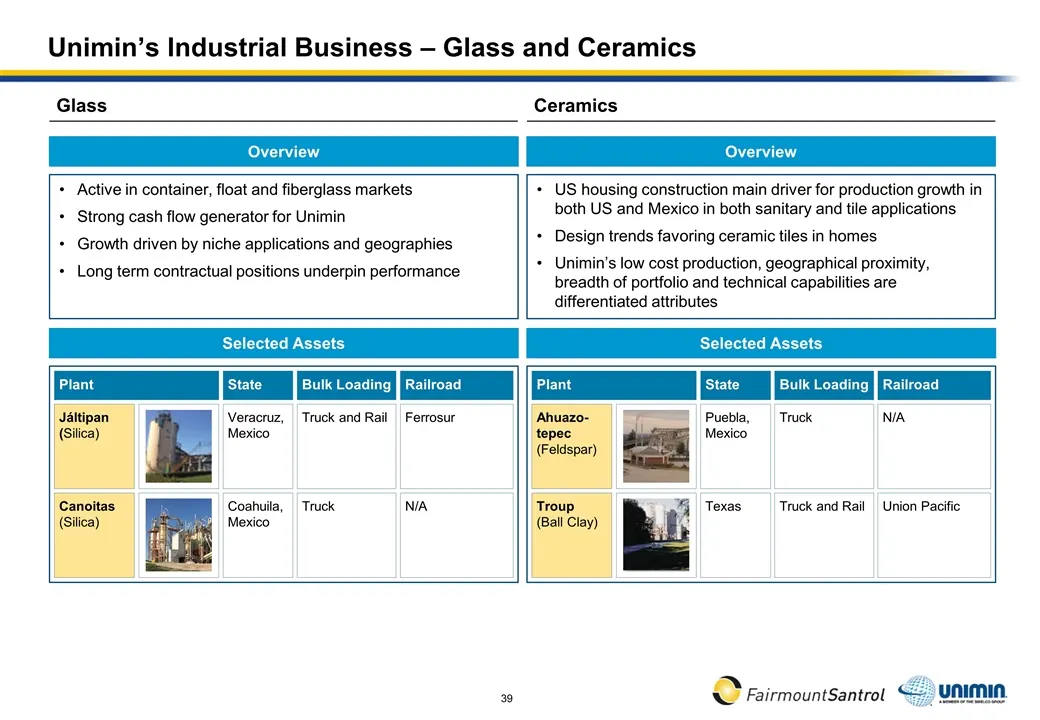
Unimin’s Industrial Business – Glass and Ceramics Ceramics Glass Overview Active in container, float and fiberglass markets Strong cash flow generator for Unimin Growth driven by niche applications and geographies Long term contractual positions underpin performance Overview US housing construction
Slide 40: Unimin's Industrial Business – Coatings & Polymers
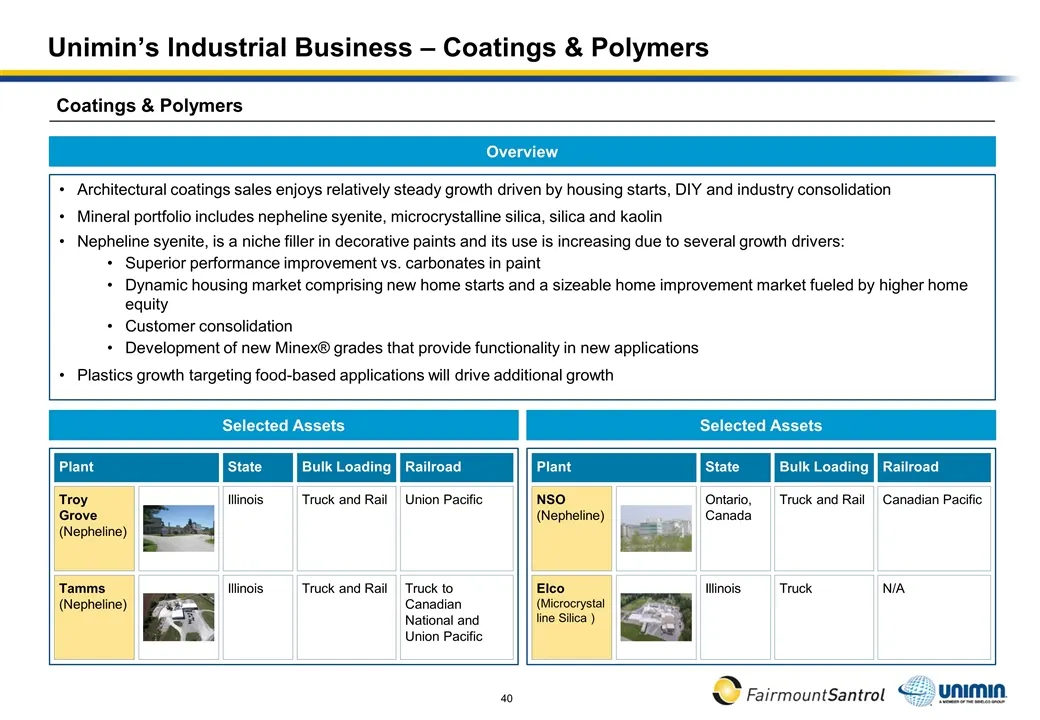
Architectural coatings sales enjoys relatively steady growth driven by housing starts, DIY and industry consolidation Mineral portfolio includes nepheline syenite, microcrystalline silica, silica and kaolin Nepheline syenite, is a niche filler in decorative paints and its use is increasing due to se
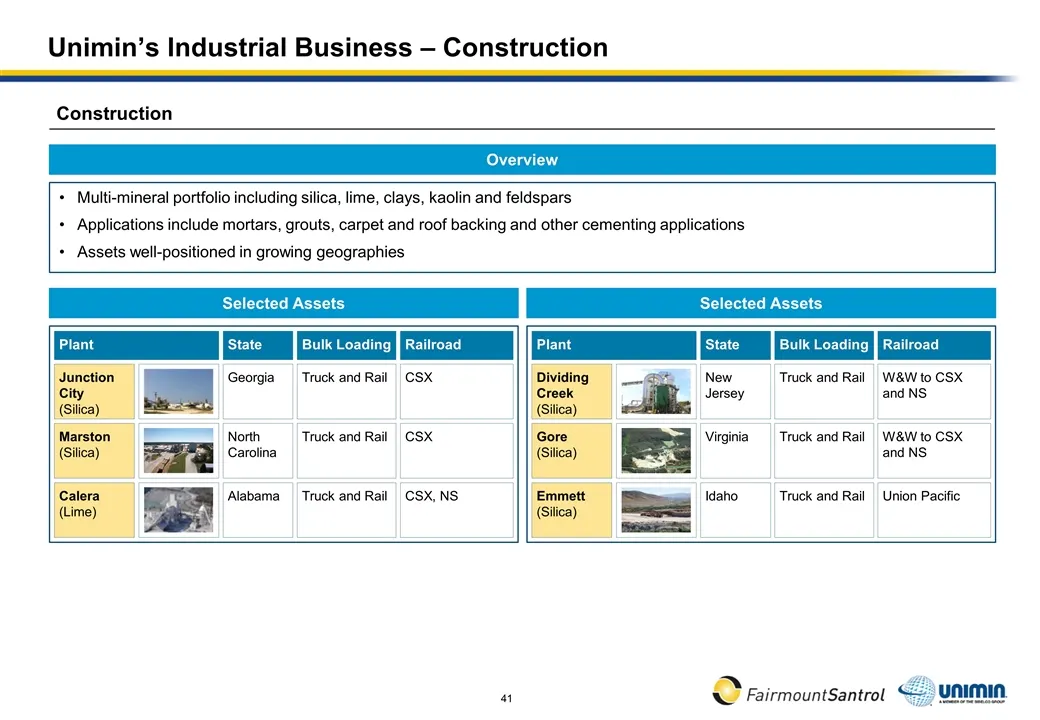
Slide 41: Unimin's Industrial Business – Construction
Multi-mineral portfolio including silica, lime, clays, kaolin and feldspars Applications include mortars, grouts, carpet and roof backing and other cementing applications Assets well-positioned in growing geographies Unimin’s Industrial Business – Construction Construction Overview Selected Assets S
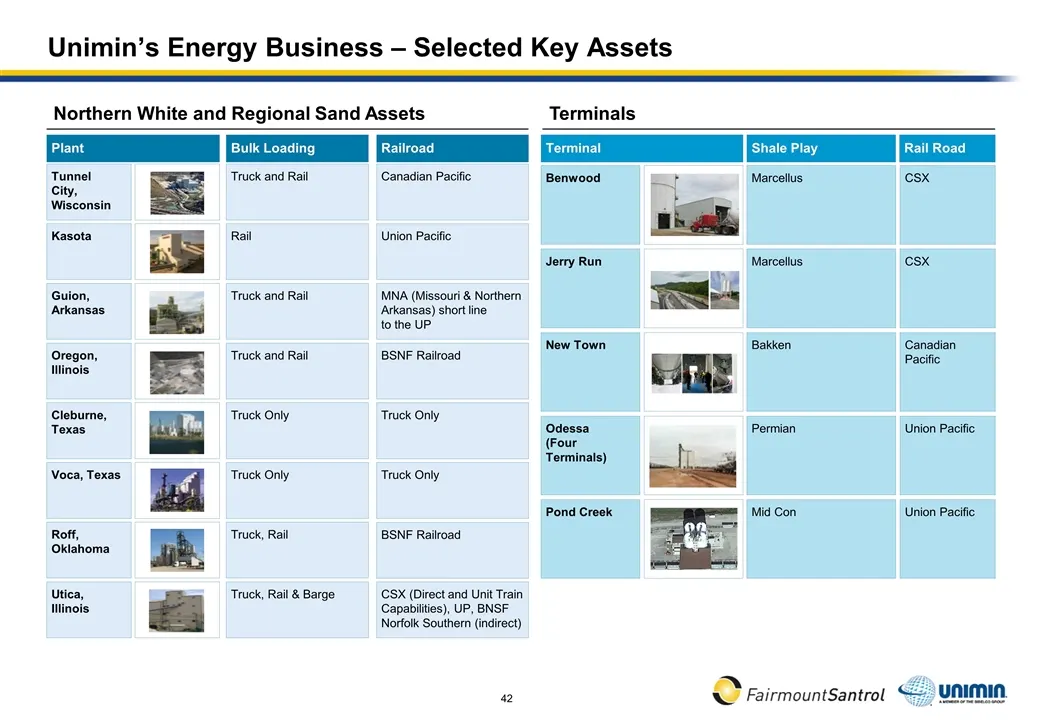
Slide 42: Unimin's Energy Business – Selected Key Assets
Unimin’s Energy Business – Selected Key Assets Terminal New Town Odessa (Four Terminals) Pond Creek Benwood Bulk Loading Truck Only Truck and Rail Truck and Rail Truck Only Truck and Rail Rail Railroad Truck Only MNA (Missouri & Northern Arkansas) short line to the UP BSNF Railroad Truck Only Canadi
Source: SEC EDGAR · 425 filed Jan 3, 2018
More decks from Fairmount Santrol Holdings Inc
 Merger or Acquisition (May 2018)44 slides · May 15, 2018
 Merger or Acquisition (May 2018)44 slides · May 9, 2018
 Debt Investor Presentation (May 2018)62 slides · May 8, 2018
 Merger or Acquisition (March 2018)31 slides · Mar 26, 2018
 Merger or Acquisition (December 2017)26 slides · Dec 12, 2017
 Corporate Update (July 2017)14 slides · Jul 24, 2017