Airtran — 2008 Calyon Airline Conference
27 slides from Airtran's conference presentation, Sep 19, 2008
Slide 1: 2008 Calyon Airline Conference
September 18, 2008 2008 Calyon Airline Conference Exhibit 99.1 September 18, 2008 2008 Calyon Airline Conference

Slide 2: Safe Harbor
2 Safe Harbor Certain of the statements contained herein should be considered “forward-looking statements,” including within the meaning of the Private Securities Litigation Reform Act of 1995. These forward-looking statements may be identified by words such as “may”, “will”, “expect,” “intend,” “in

Slide 3: Today's Discussion
3 Today’s Discussion How has AirTran been impacted in 2008? Is a dramatic change in AirTran’s strategy needed to adapt? How are recent changes impacting our revenue? Where do we see opportunities?
Slide 4: 2008 Has Been A Difficult Year For All Airlines
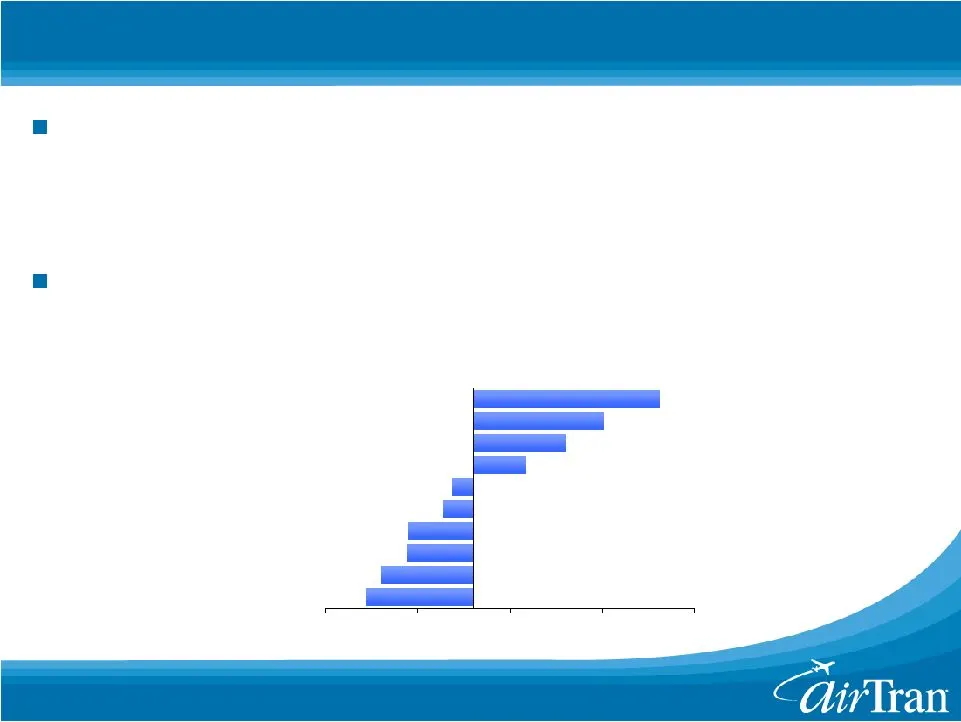
4 2008 Has Been A Difficult Year For All Airlines Challenges emerged on multiple fronts — Cost: Unprecedented rise in fuel — Cash: Financial crisis in credit markets — Revenue: Slowing domestic economy AirTran’s challenge was magnified by industry leading capacity growth -6% -5% -4% -4% -2% -1% 3% 5
Slide 5: Large Industry Losses In 2008
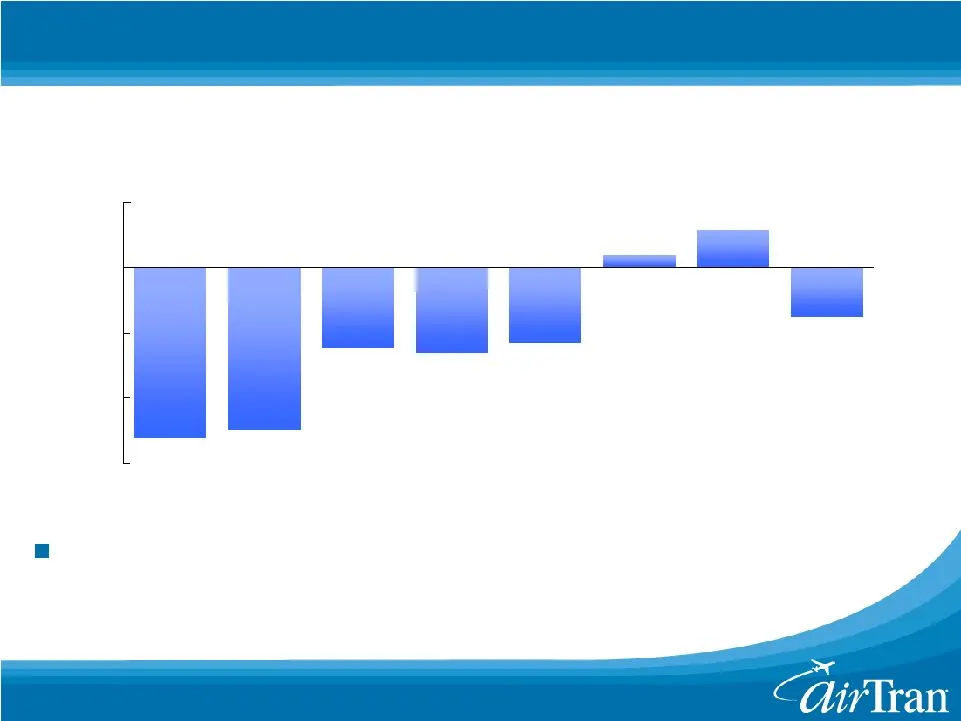
5 -13 -12 -6 -7 -6 3 -4 Large Industry Losses In 2008 Industry Profits / (Losses) ($15) ($10) ($5) $0 $5 2001 2002 2003 2004 2005 2006 2007 1H08 (Billions) Industry losses during first six months of 2008 amount to the total profits earned in the last two years * Source: Air Transport Association

Slide 6: Keys To Repositioning The Company
6 Keys To Repositioning The Company Problem doesn’t need to get any bigger — We need to slow growth and limit exposure to fuel volatility Maintaining low cost advantage is critical — All carriers will face unit cost increases from capacity cuts — While AirTran’s costs will also rise, capacity cuts w

Slide 7: AirTran Responded Quickly And Decisively
7 AirTran Responded Quickly And Decisively Reduced growth — Deferred 22 aircraft — Agreements to sell / return 11 aircraft — Supports increasing unit revenues Reduced costs — Closed three cities — Cut non-aircraft CAPEX by 50% — 1H08 non-fuel CASM down 0.3% Raised cash — $135MM equity / convertible

Slide 8: AirTran Responded Quickly And Decisively
8 AirTran Responded Quickly And Decisively Limit fuel exposure — Active and discipline hedging program Increase revenues — Significant changes in ancillary revenues — Multiple fare increases Now being supported by capacity reductions
Slide 9: Quick And Decisive Plan: Reduce Growth
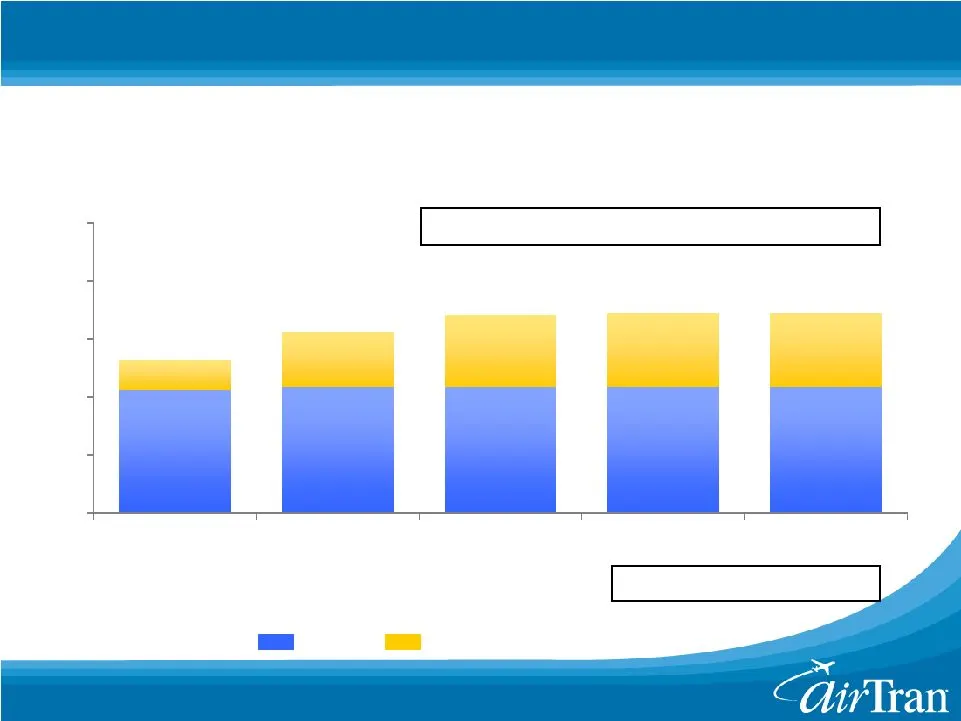
9 Quick And Decisive Plan: Reduce Growth 135-140 135-140 2005 2006 2007 2008 2009 (Aircraft) ASM Growth 28% 24% 20% 5 - 6% (3) - (7)% 717s 737s Previous Plan: 147 161 Currently 139 Aircraft: 86 717s / 53 737s

Slide 10: Quick And Decisive Plan: Reduce Costs
10 Quick And Decisive Plan: Reduce Costs Fuel conservation program — Single engine taxi — Reduced APU usage — Blended winglets on all 737 aircraft Reducing non-aircraft capital expenditures 50% — Non-aircraft CAPEX reduced from $25-30MM to $12-15MM Reducing operating costs — Closing three cities — F

Slide 11: Quick And Decisive Plan: Raise Cash
11 Quick And Decisive Plan: Raise Cash April: $135MM in equity and debt offering July: $150MM Letter of Credit Ongoing: Aircraft sales
Slide 12: Quick And Decisive Plan: Limit Fuel Exposure
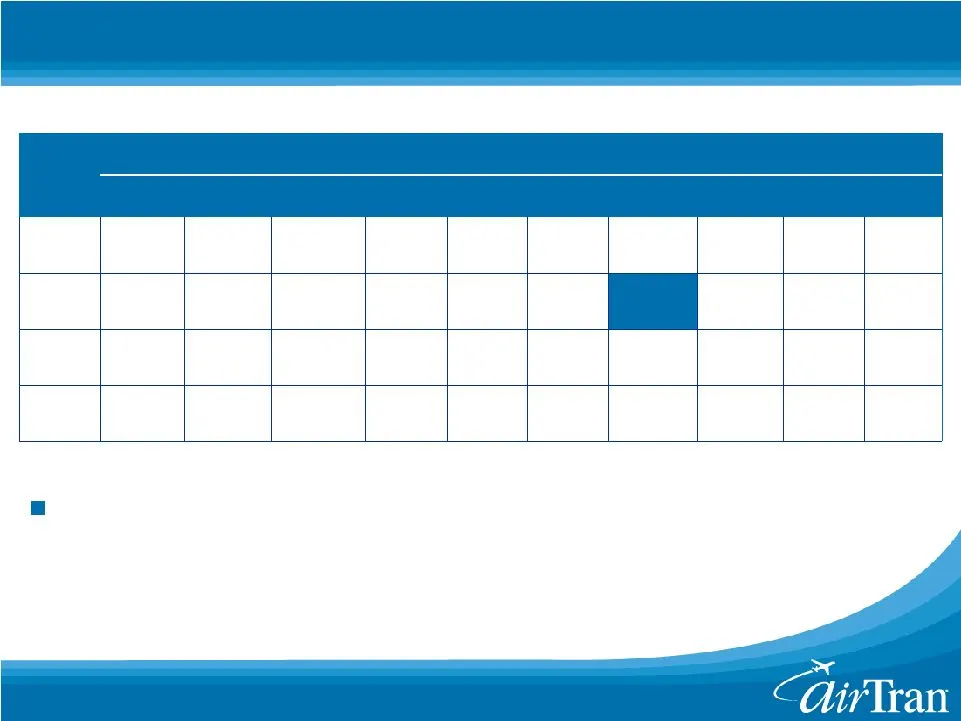
12 Dec07 Jun08 Hedge % Current $80 $90 Crude Price Period $100 $105 $110 $140 $130 $120 Quick And Decisive Plan: Limit Fuel Exposure 1% 18% 10% 15% 21% 56% 51% 72% 29% 64% 74% 82% $83 $84 $92 $93 $88 $89 $95 $95 2009 2008 Q408 Q308 $89 $96 $99 $100 $98 $103 $106 $125 $115 $107 $126 $119 $111 $122 $1

Slide 13: Quick And Decisive Plan: Increase Revenues
13 Quick And Decisive Plan: Increase Revenues Numerous fare increases — Multiple fare increases since Sep 2007 — Fuel surcharge implemented in Nov 2007 and increased in Jan and Apr 2008 Ancillary fees have also increased — Seat assignment fees — Change / cancel fees — Call center fees — Second bag f

Slide 14: Fundamentals Remain Strong
14 Fundamentals Remain Strong Youngest all-Boeing fleet in America — Airplanes – 86 717s / 53 737s Unique, high quality product Industry leading non-fuel costs Growing ancillary revenues Demonstrated ability to manage through challenges and capitalize on opportunities

Slide 15
Slide 16: Strong Fundamentals: Low Cost Structure
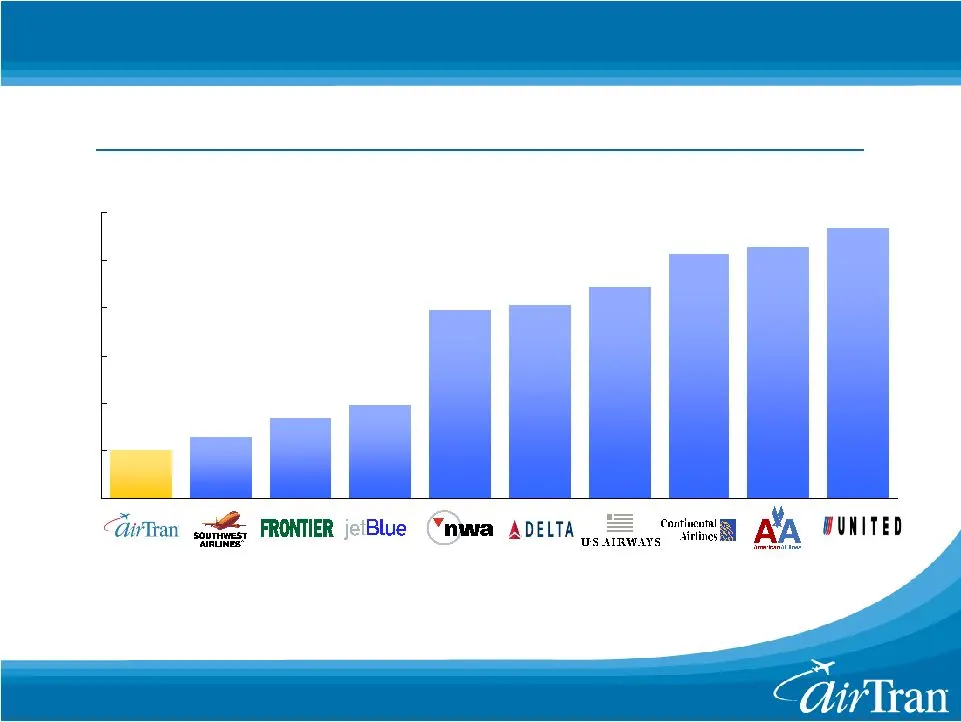
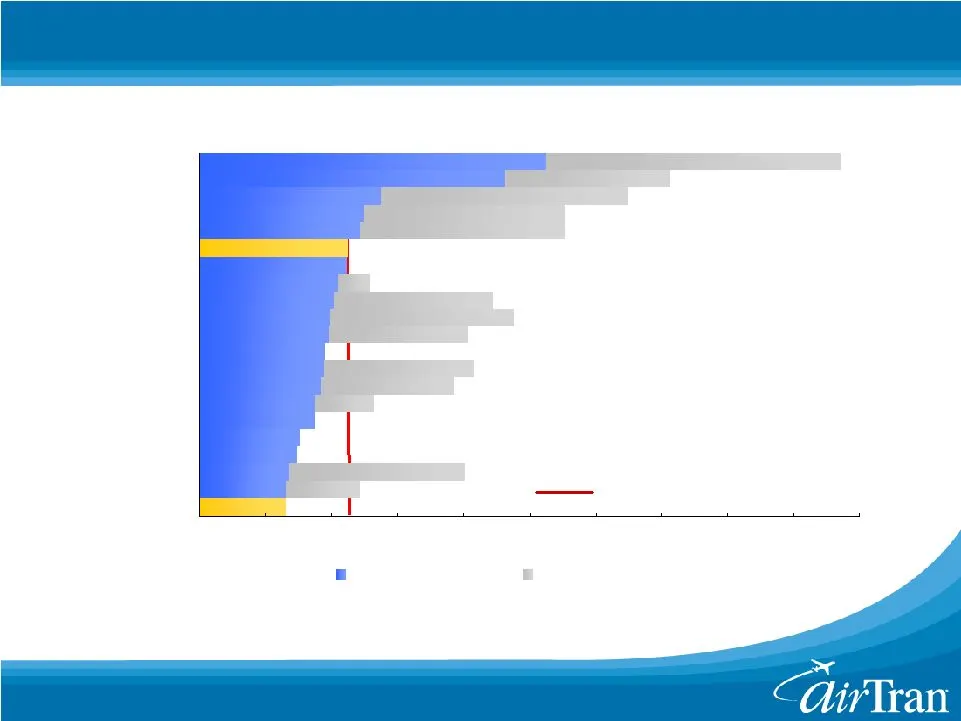
16 Strong Fundamentals: Low Cost Structure (Cents) While legacy costs are down, gap remains large * Excludes fuel and special items Industry Cost Comparison Non-Fuel Unit Costs at 734 Miles for 1H08 TM

Slide 17: Strong Fundamentals: #1 In Quality
17 AirTran AirTran AirTran AirTran AirTran Strong Fundamentals: #1 In Quality 2005 2004 2003 2006 2007 JetBlue Southwest Northwest Frontier Continental Alaska United American Delta JetBlue Alaska Southwest America West US Airways Northwest Continental United ATA JetBlue Independence Southwest United
Slide 18: Strong Fundamentals: World's Largest LCC Hub
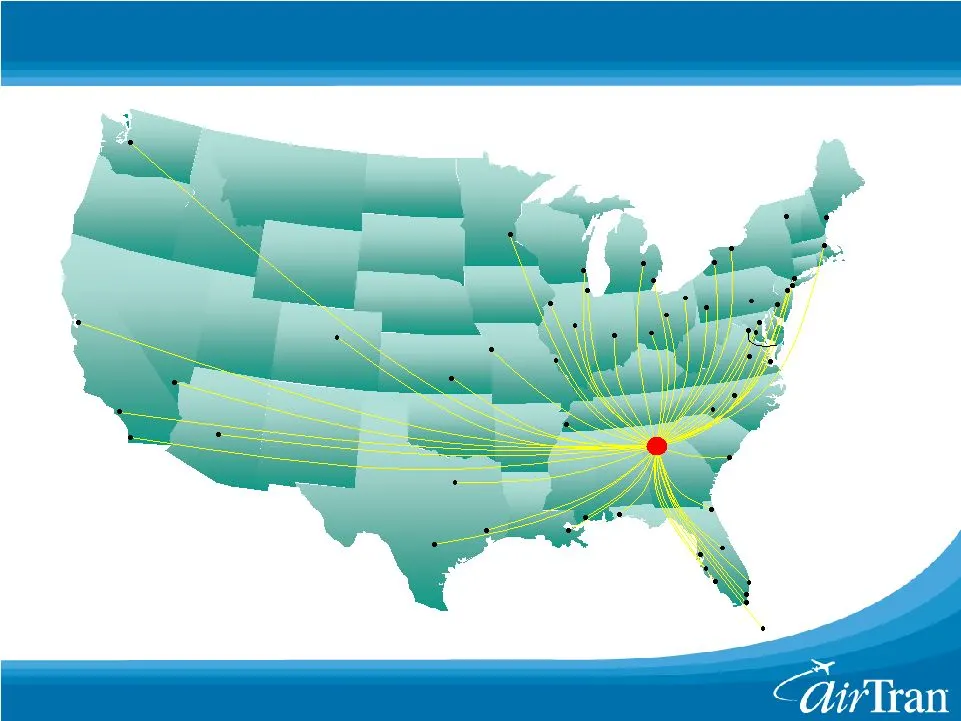
18 Strong Fundamentals: World’s Largest LCC Hub 225 departures in December 2008 1,000 AAI - Atlanta (2000) UAUA - San Francisco LCC - Philadelphia LUV - Baltimore JBLU - New York LUV - Phoenix LCC - Phoenix UAUA - Denver AMR - Chicago LUV - Chicago CAL - Newark NWA - Detroit NWA - Minneapolis AMR -
Slide 19: Strong Fundamentals: Successful Diversification
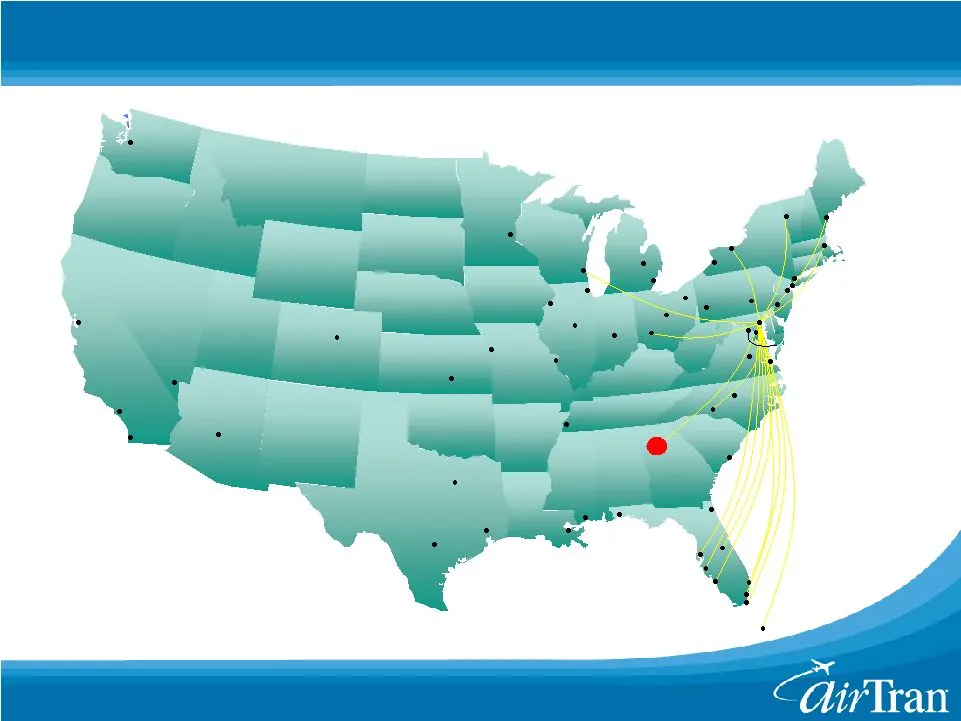
19 Strong Fundamentals: Successful Diversification Portland Portland Boston Boston Dallas/Ft. Worth Dallas/Ft. Worth Ft. Lauderdale Ft. Lauderdale San Juan San Juan Las Vegas Las Vegas Denver Denver San Francisco San Francisco Minneapolis Minneapolis Burlington Burlington San Antonio San Antonio Akr
Slide 20: Strong Fundamentals: Successful Diversification
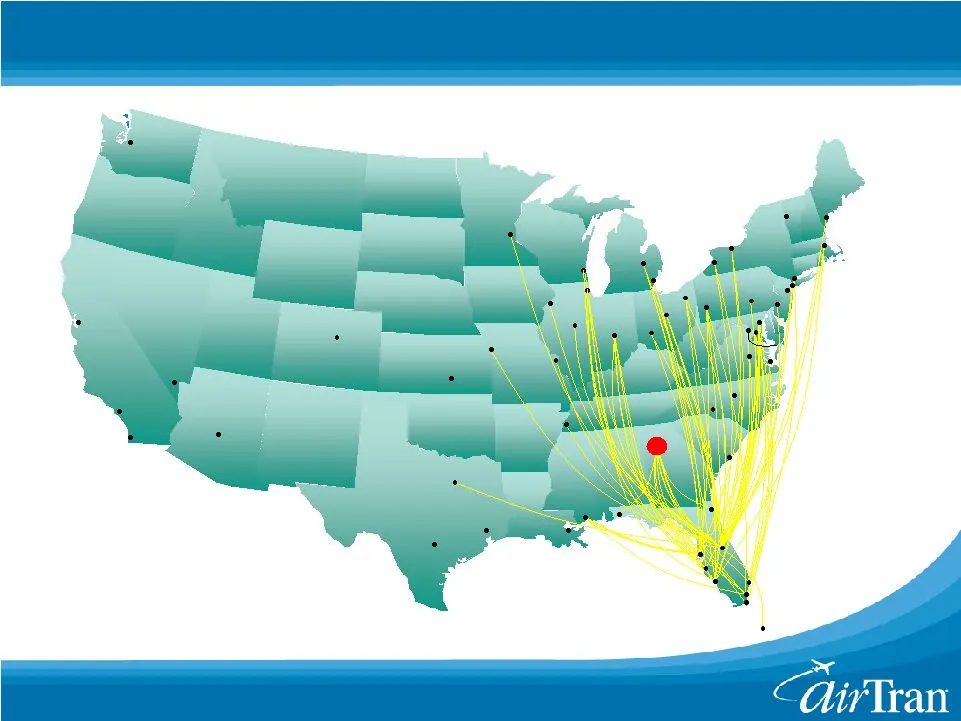
20 Strong Fundamentals: Successful Diversification Portland Portland Boston Boston Dallas/Ft. Worth Dallas/Ft. Worth San Juan San Juan Houston Houston Las Vegas Las Vegas Denver Denver San Francisco San Francisco Minneapolis Minneapolis Burlington Burlington San Antonio San Antonio Columbus Columbus
Slide 21: Strong Fundamentals: Successful Diversification
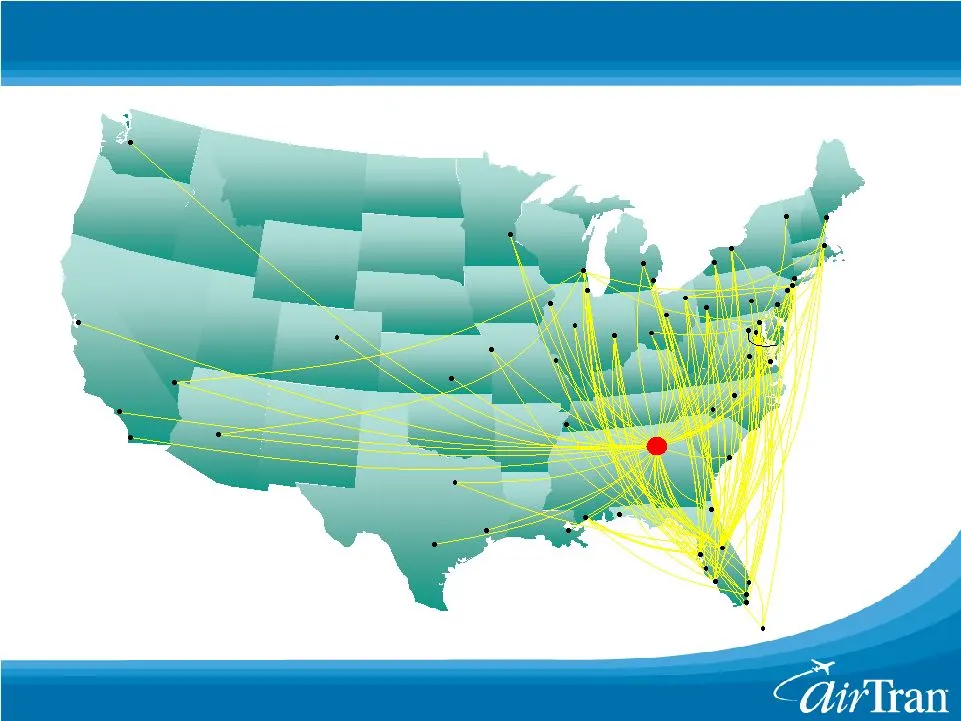
21 Strong Fundamentals: Successful Diversification Portland Portland Boston Boston Dallas/Ft. Worth Dallas/Ft. Worth Las Vegas Las Vegas Denver Denver San Francisco San Francisco Minneapolis Minneapolis Burlington Burlington San Antonio San Antonio Flint Flint Seattle Seattle December 2008 – Florida
Slide 22: Strong Fundamentals: Successful Diversification
22 Strong Fundamentals: Successful Diversification Portland Portland Boston Boston Dallas/Ft. Worth Dallas/Ft. Worth Las Vegas Las Vegas Denver Denver San Francisco San Francisco Minneapolis Minneapolis Burlington Burlington San Antonio San Antonio Flint Flint Seattle Seattle December 2008 – Full Ne

Slide 23: Opportunities: Domestic Capacity Is Shrinking
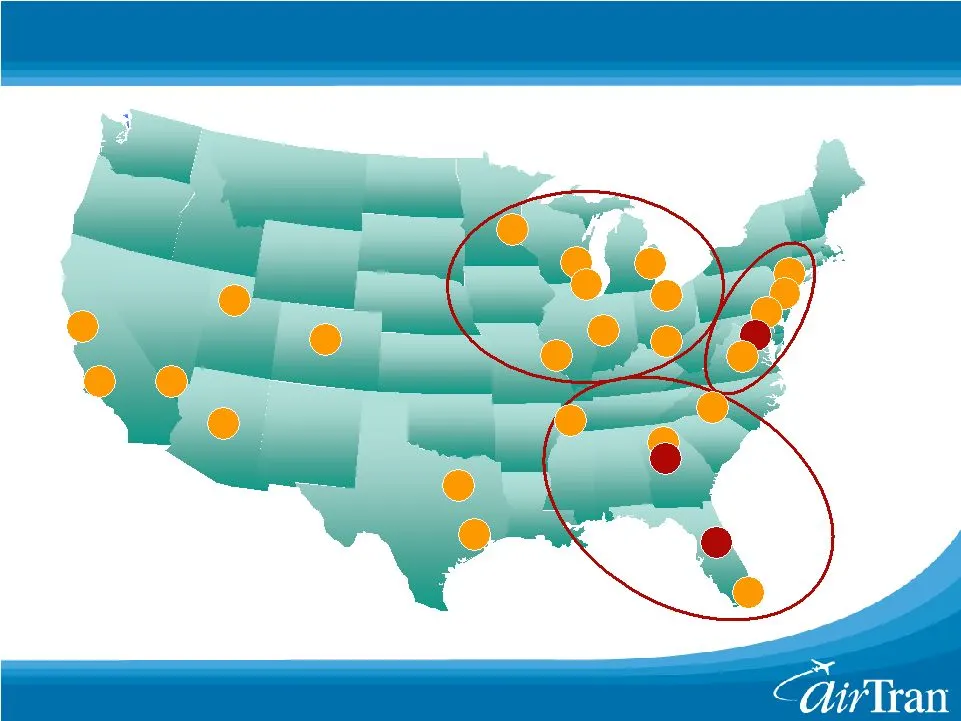
23 Opportunities: Domestic Capacity Is Shrinking Competitors have also announced mainline domestic capacity reductions — United capacity will be down 15-16% in Q408 — American capacity will be down 11-12% in Q408 — Continental capacity will be down 10% in Q408 — US Airways capacity will be down 6-8%
Slide 24: Opportunities: Redundant Legacy Capacity Remains
24 Opportunities: Redundant Legacy Capacity Remains Salt Salt Lake Lake City City - - DAL DAL Las Las Vegas Vegas - - LCC LCC Legacy Hub Redundancies San San Francisco Francisco - - UAUA UAUA Los Los Angeles Angeles - - UAUA UAUA Chicago Chicago - - AMR AMR Denver Denver - - UAUA UAUA Detroit Detroi
Slide 25: Opportunities: Demonstrated Record Of Adapting
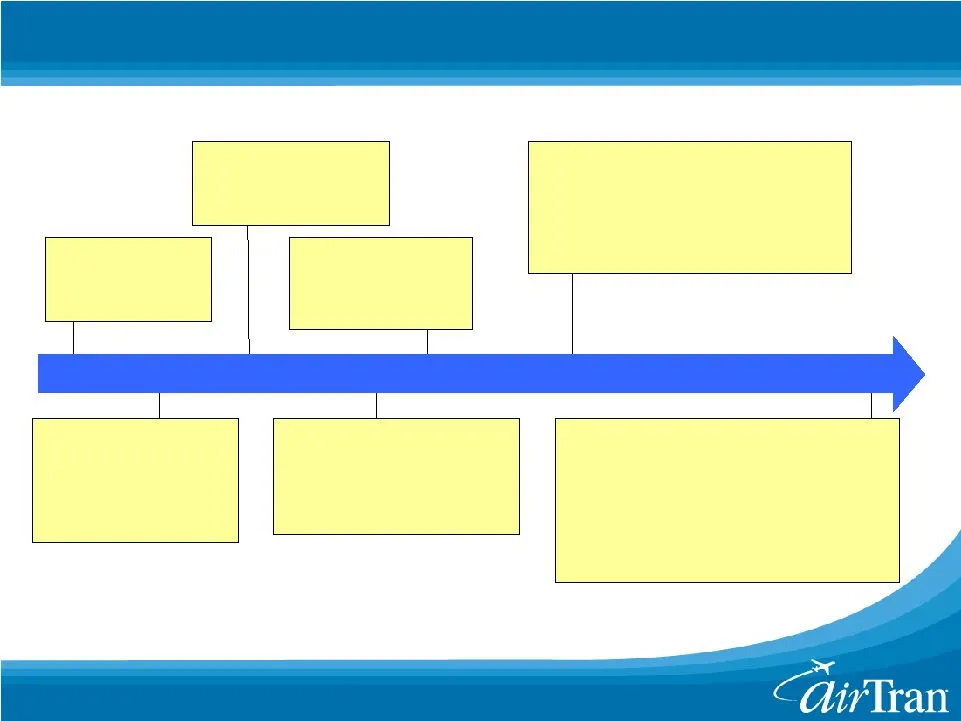
25 2000 1999 2002 2004 2006 2001 2003 2005 2007 2008 Opportunities: Demonstrated Record Of Adapting • Under new management AirTran restores profitability in 1999 • Emerged stronger from 9/11 by lowering costs and capitalizing on legacy domestic retrenching • Increased cash balance to $100MM from low

Slide 26: Summary
26 Summary 2008 has been a difficult year AirTran has moved quickly and decisively Fundamentals remain strong Positioning the company to return to profitability and capitalize on opportunities
Slide 27
Source: SEC EDGAR · 8-K filed Sep 19, 2008
More decks from Airtran Holdings Inc
 Merger or Acquisition (September 2010)21 slides · Sep 27, 2010
 Bank of America - Merrill Lynch Global Transportation Conference 201025 slides · Jun 15, 2010
 Shareholder Meeting (May 2010)33 slides · May 18, 2010
 Investor Presentation (May 2010)26 slides · May 13, 2010
 JP Morgan Aviation, Transportation and Defense Conference 201025 slides · Mar 9, 2010
 Raymond James 2010 Growth Airline Conference25 slides · Feb 4, 2010