Guaranty Bancorp — D.A. Davidson 17th Annual Financial Institutions Conference (May 2015)
26 slides from Guaranty Bancorp's conference presentation, May 12, 2015

Slide 1: D.A. Davidson 17th Annual Financial Institutions Conference
D.A. Davidson 17th Annual Financial Institutions Conference Denver, CO May 12-13, 2015
Slide 2: Forward Looking Statements
Forward Looking Statements This presentation contains forward-looking statements, which are included in accordance with the “safe harbor” provisions of the Private Securities Litigation Reform Act of 1995. In some cases, you can identify forward-looking statements by terminology such as “may,” “will
Slide 3: About Us – Guaranty Bancorp
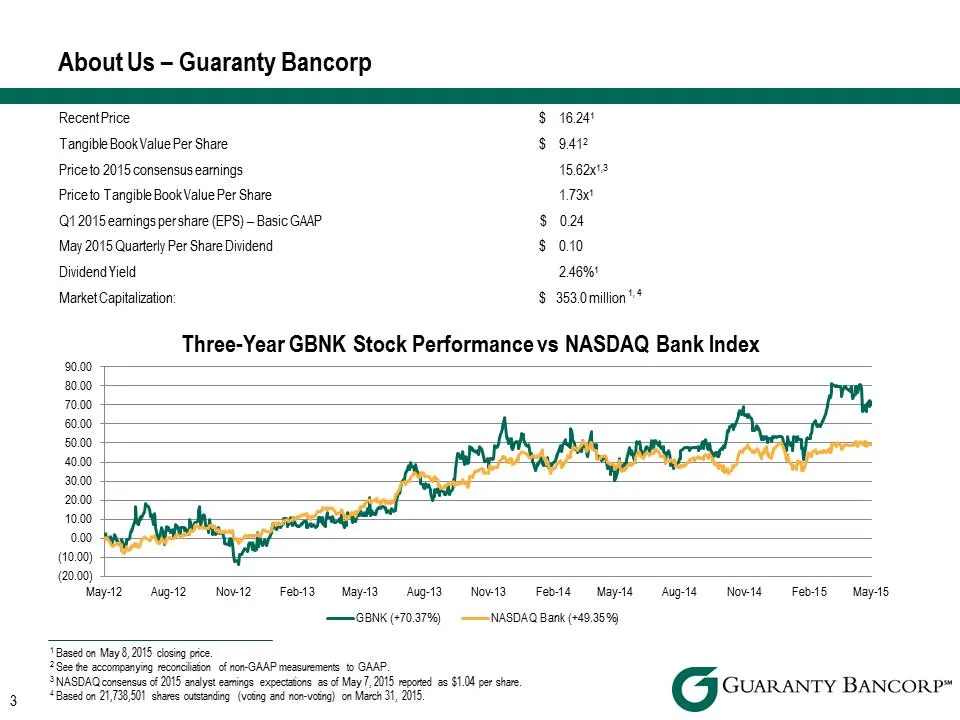
About Us – Guaranty Bancorp Recent Price $ 16.241 Tangible Book Value Per Share $ 9.412 Price to 2015 consensus earnings 15.62x1,3 Price to Tangible Book Value Per Share 1.73x1 Q1 2015 earnings per share (EPS) – Basic GAAP $ 0.24 May 2015 Quarterly Per Share Dividend $ 0.10 Dividend Yield 2.46%1 Mar
Slide 4: About Us – Guaranty Bancorp
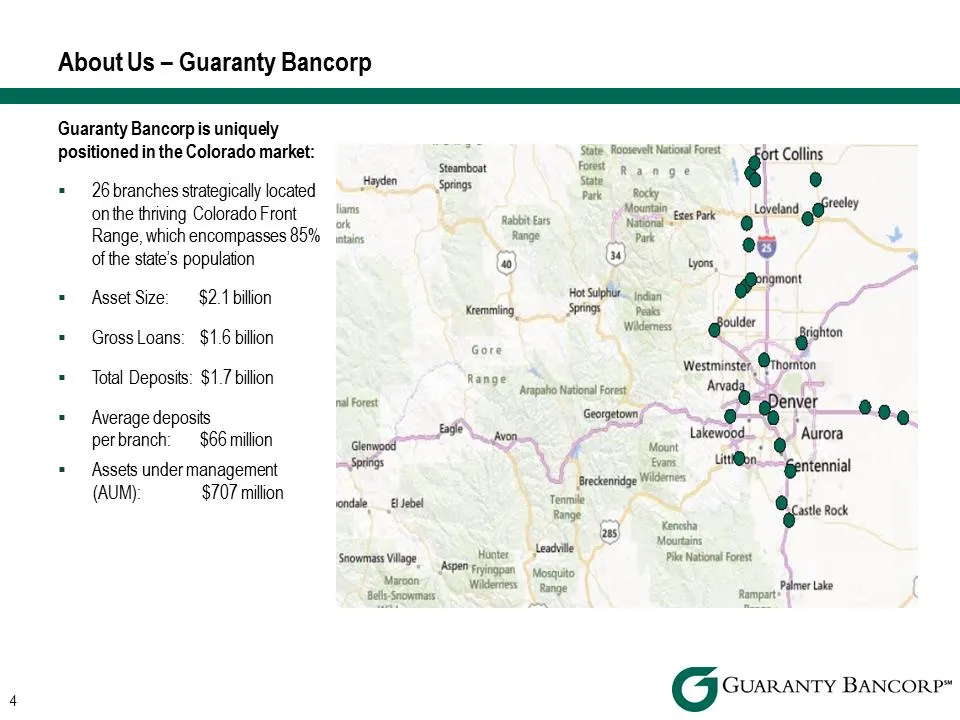
About Us – Guaranty Bancorp Guaranty Bancorp is uniquely positioned in the Colorado market: . 26 branches strategically located on the thriving Colorado Front Range, which encompasses 85% of the state’s population . Asset Size: $2.1 billion . Gross Loans: $1.6 billion . Total Deposits: $1.7 billion
Slide 5: Investment Considerations
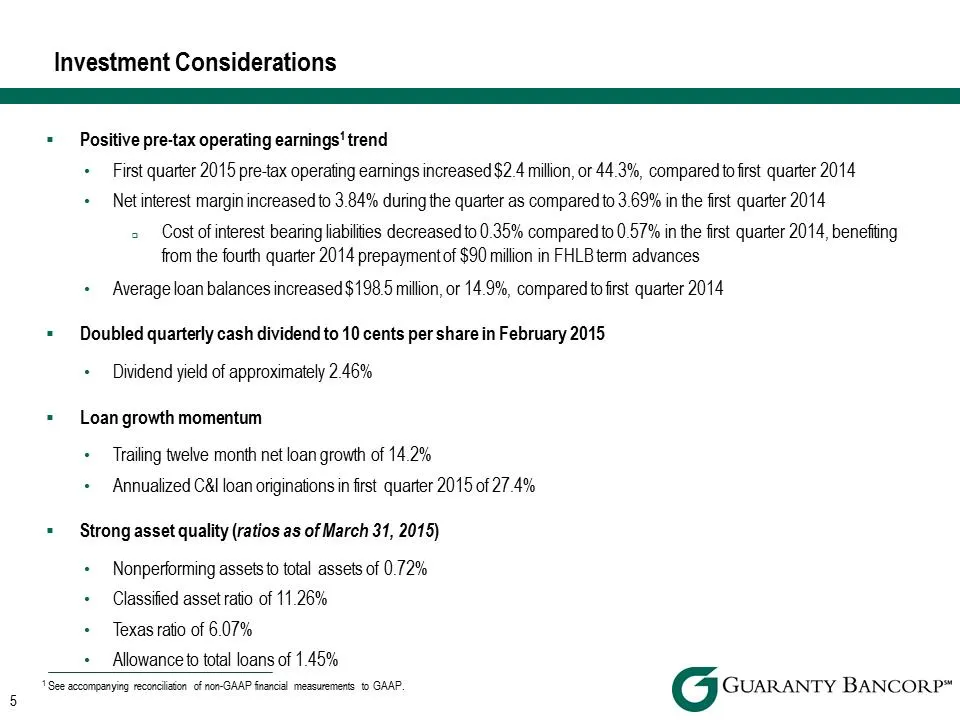
Investment Considerations . Positive pre-tax operating earnings1 trend • First quarter 2015 pre-tax operating earnings increased $2.4 million, or 44.3%, compared to first quarter 2014 • Net interest margin increased to 3.84% during the quarter as compared to 3.69% in the first quarter 2014 Cost of i
Slide 6: Investment Considerations
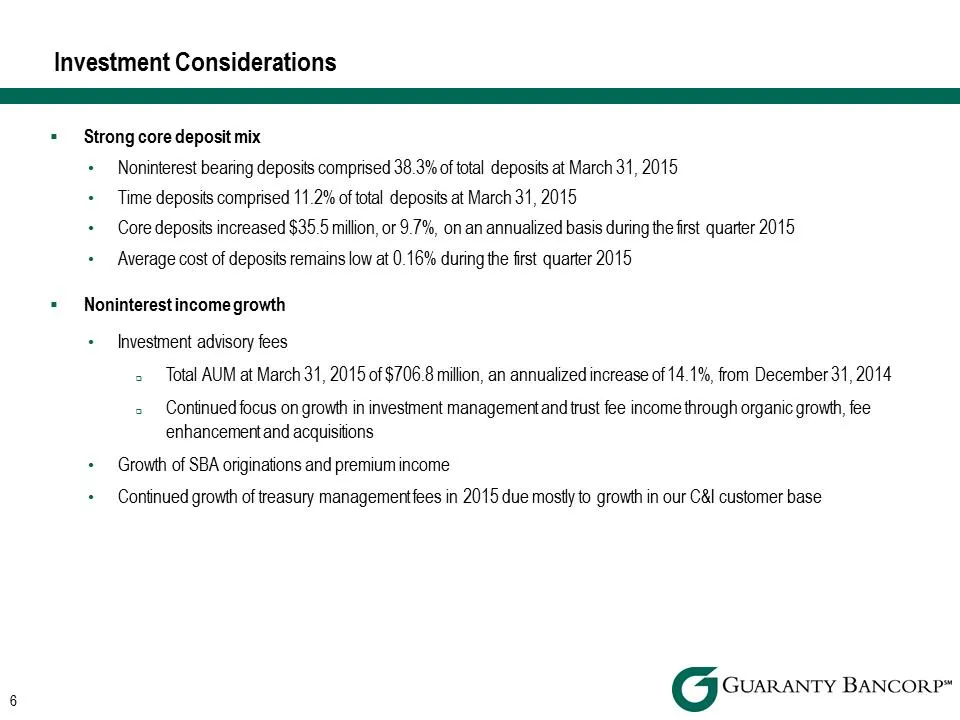
Investment Considerations . Strong core deposit mix • Noninterest bearing deposits comprised 38.3% of total deposits at March 31, 2015 • Time deposits comprised 11.2% of total deposits at March 31, 2015 • Core deposits increased $35.5 million, or 9.7%, on an annualized basis during the first quarter
Slide 7: Investment Considerations
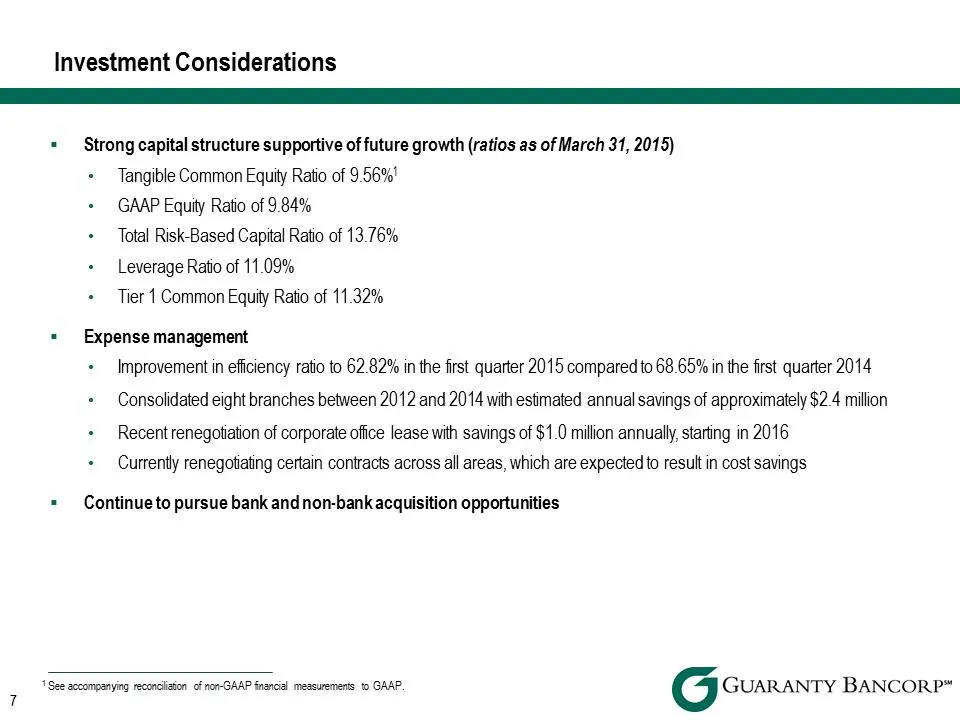
Investment Considerations . Strong capital structure supportive of future growth (ratios as of March 31, 2015) • Tangible Common Equity Ratio of 9.56%1 • GAAP Equity Ratio of 9.84% • Total Risk-Based Capital Ratio of 13.76% • Leverage Ratio of 11.09% • Tier 1 Common Equity Ratio of 11.32% . Expense
Slide 8: Net Interest Income
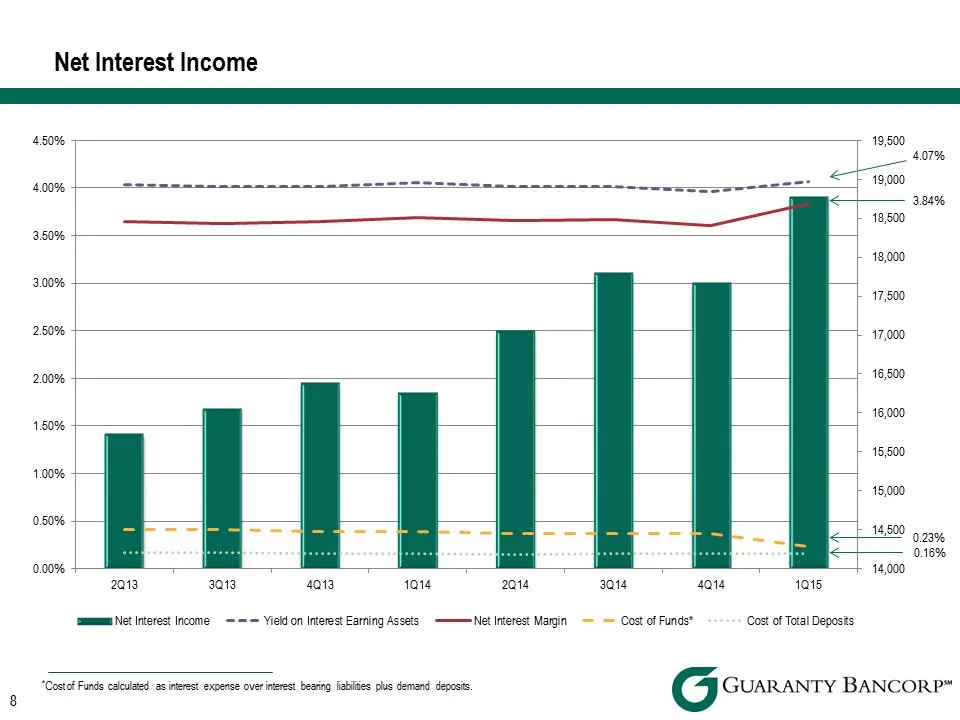
Net Interest Income 4.50% 19,500 4.07% 19,000 4.00% 3.84% 18,500 3.50% 18,000 3.00% 17,500 2.50% 17,000 16,500 2.00% 16,000 1.50% 15,500 1.00% 15,000 0.50% 14,500 0.23% 0.16% 0.00% 14,000 2Q13 3Q13 4Q13 1Q14 2Q14 3Q14 4Q14 1Q15 Net Interest Income Yield on Interest Earning Assets Net Interest Margin
Slide 9: Core Noninterest Income
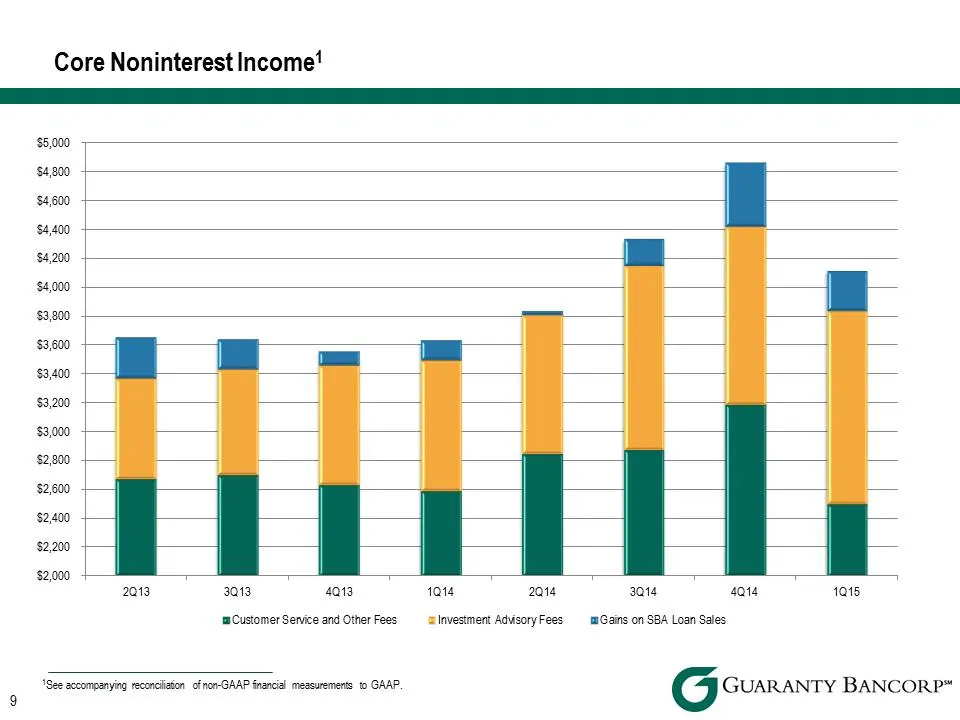
Core Noninterest Income1 $2,000$2,200$2,400$2,600$2,800$3,000$3,200$3,400$3,600$3,800$4,000$4,200$4,400$4,600$4,800$5,0002Q133Q134Q131Q142Q143Q144Q141Q15Customer Service and Other Fees Investment Advisory Fees Gains on SBA Loan Sales 1See accompanying reconciliation of non-GAAP financial measurement
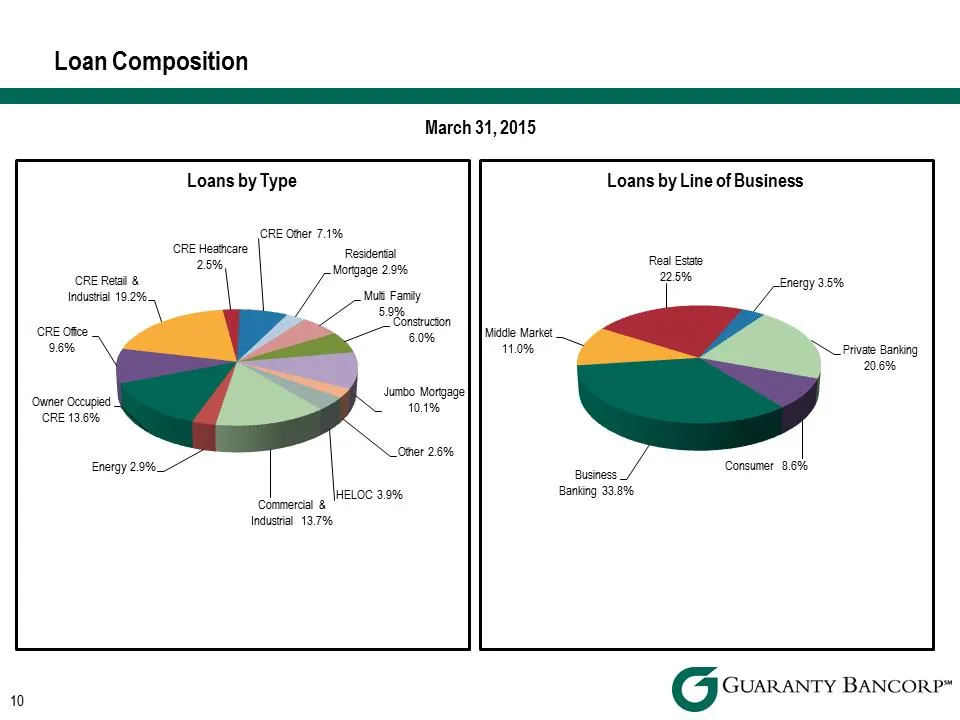
Slide 10: Loan Composition
Loan Composition March 31, 2015 Consumer8.6%BusinessBanking33.8%MiddleMarket11.0%RealEstate22.5%Energy3.5%PrivateBanking20.6%LoansbyLineofBusinessCommercial&Industrial13.7%Energy2.9%OwnerOccupiedCRE13.6%CREOffice9.6%CRERetail&Industrial19.2%CREHeathcare2.5%CREOther7.1%ResidentialMortgage2.9%MultiFam
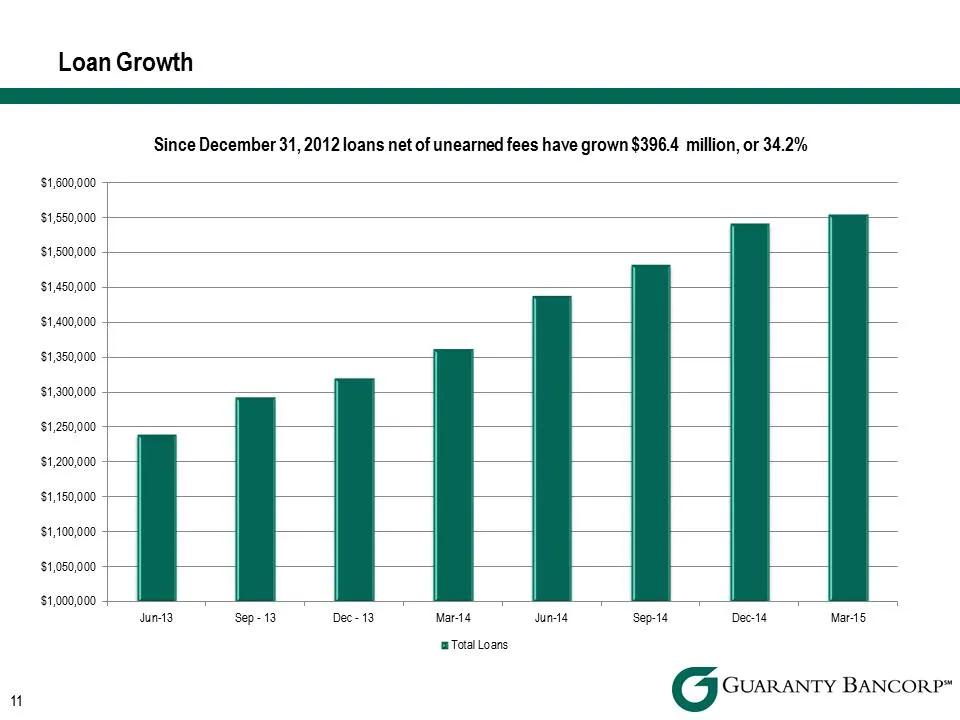
Slide 11: Loan Growth
Loan Growth $1,000,000$1,050,000$1,100,000$1,150,000$1,200,000$1,250,000$1,300,000$1,350,000$1,400,000$1,450,000$1,500,000$1,550,000$1,600,000Since December 31, 2012 loans net of unearned fees have grown $396.4 million, or 34.2% Jun-13 Sep -13 Dec -13 Mar-14 Jun-14 Sep-14 Dec-14 Mar-15 Total Loans
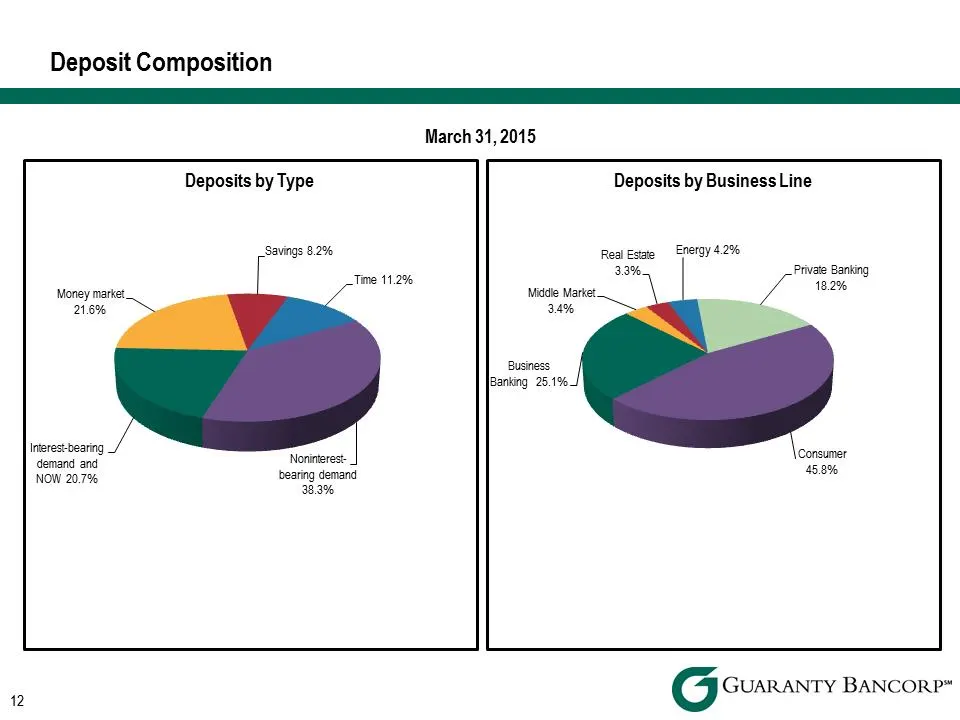
Slide 12: Deposit Composition
Deposit Composition March 31, 2015 Consumer45.8%BusinessBanking25.1%MiddleMarket3.4%RealEstate3.3%Energy4.2%PrivateBanking18.2%DepositsbyBusinessLineNoninterest-bearingdemand38.3%Interest-bearingdemandandNOW20.7%Moneymarket21.6%Savings8.2%Time11.2%DepositsbyType
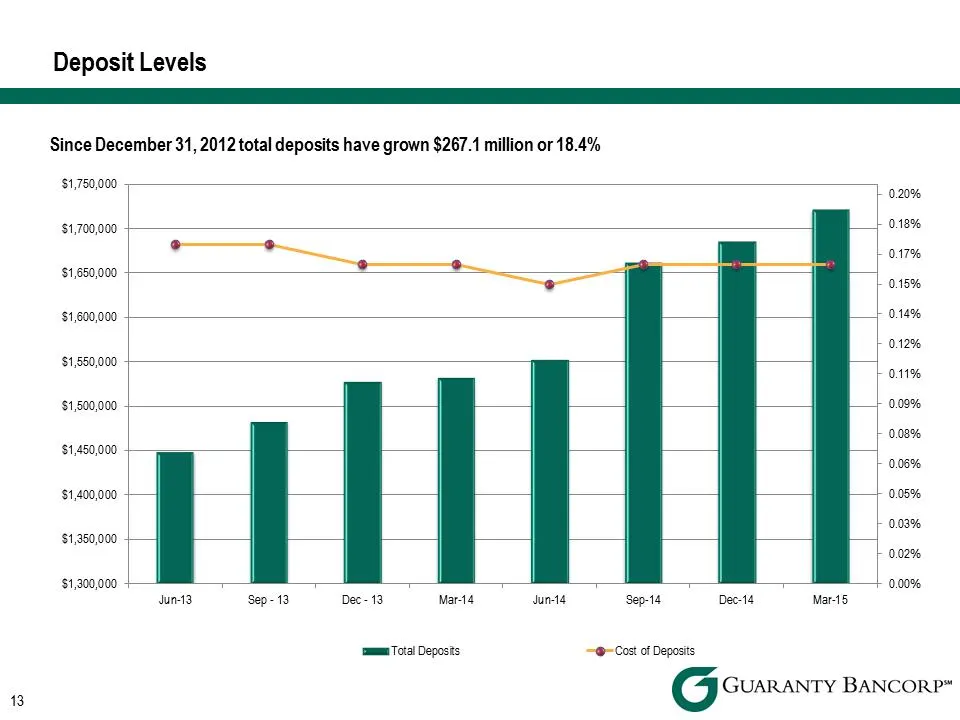
Slide 13: Deposit Levels
Deposit Levels Since December 31, 2012 total deposits have grown $267.1 million or 18.4% 0.00%0.02%0.03%0.05%0.06%0.08%0.09%0.11%0.12%0.14%0.15%0.17%0.18%0.20%$1,300,000$1,350,000$1,400,000$1,450,000$1,500,000$1,550,000$1,600,000$1,650,000$1,700,000$1,750,000Jun-13Sep-13Dec-13Mar-14Jun-14Sep-14Dec-1
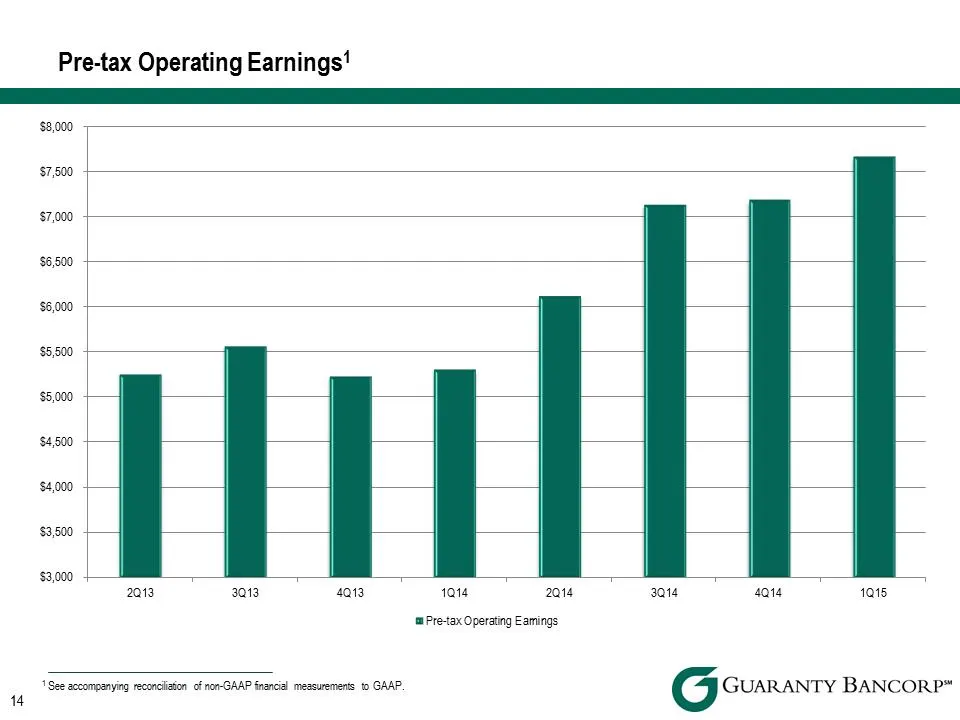
Slide 14: Pre-tax Operating Earnings
Pre-tax Operating Earnings1 $3,000$3,500$4,000$4,500$5,000$5,500$6,000$6,500$7,000$7,500$8,0002Q133Q134Q131Q142Q143Q144Q141Q15Pre-tax Operating Earnings 1 See accompanying reconciliation of non-GAAP financial measurements to GAAP.
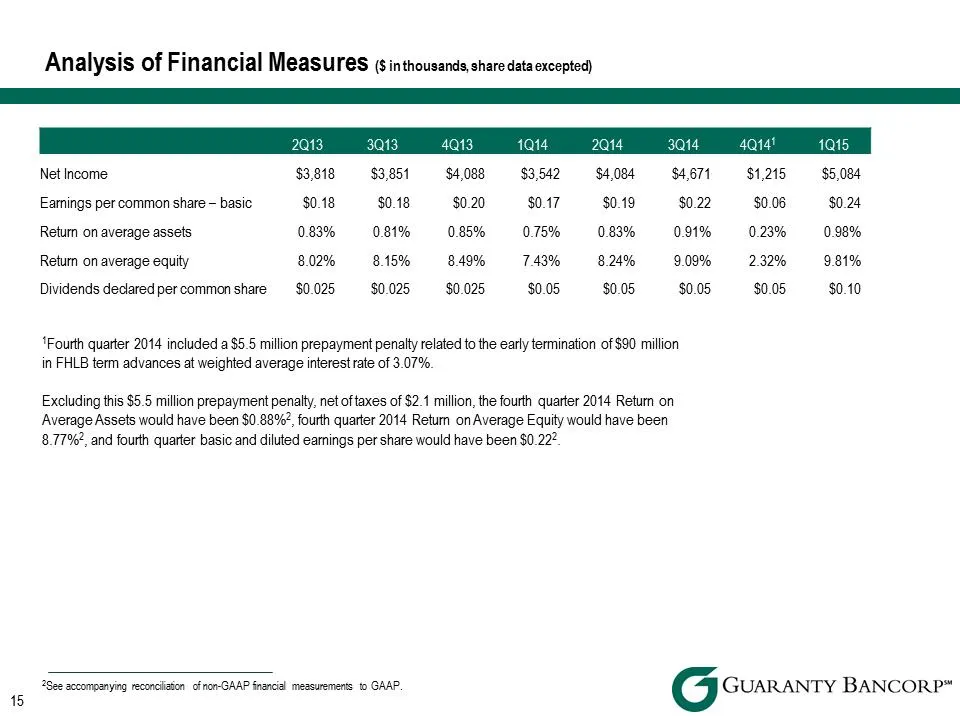
Slide 15: Analysis of Financial Measures
Analysis of Financial Measures ($ in thousands, share data excepted) 2Q13 3Q13 4Q13 1Q14 2Q14 3Q14 4Q141 1Q15 Net Income $3,818 $3,851 $4,088 $3,542 $4,084 $4,671 $1,215 $5,084 Earnings per common share – basic Return on average assets Return on average equity Dividends declared per common share $0.
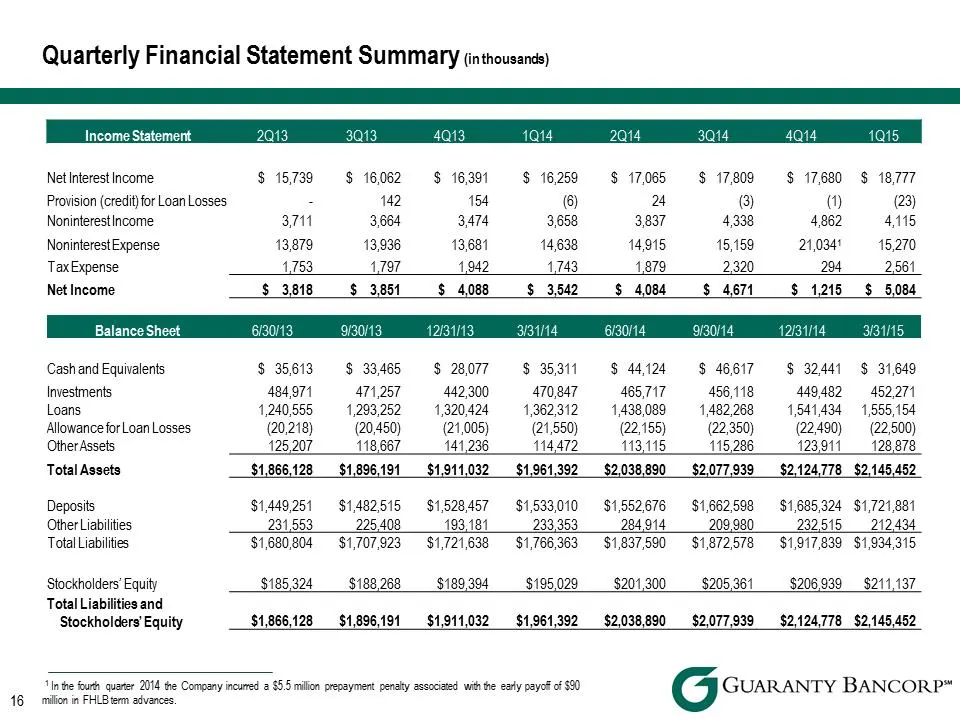
Slide 16: Quarterly Financial Statement Summary
Quarterly Financial Statement Summary (in thousands) Income Statement 2Q13 3Q13 4Q13 1Q14 2Q14 3Q14 4Q14 1Q15 Net Interest Income $ 15,739 $ 16,062 $ 16,391 $ 16,259 $ 17,065 $ 17,809 17,680 18,777 Provision (credit) for Loan Losses -142 154 (6) 24 (3) (1) (23) Noninterest Income 3,711 3,664 3,474 3

Slide 17: Colorado Market
7 Colorado Market G GUARANTY BANCORP*
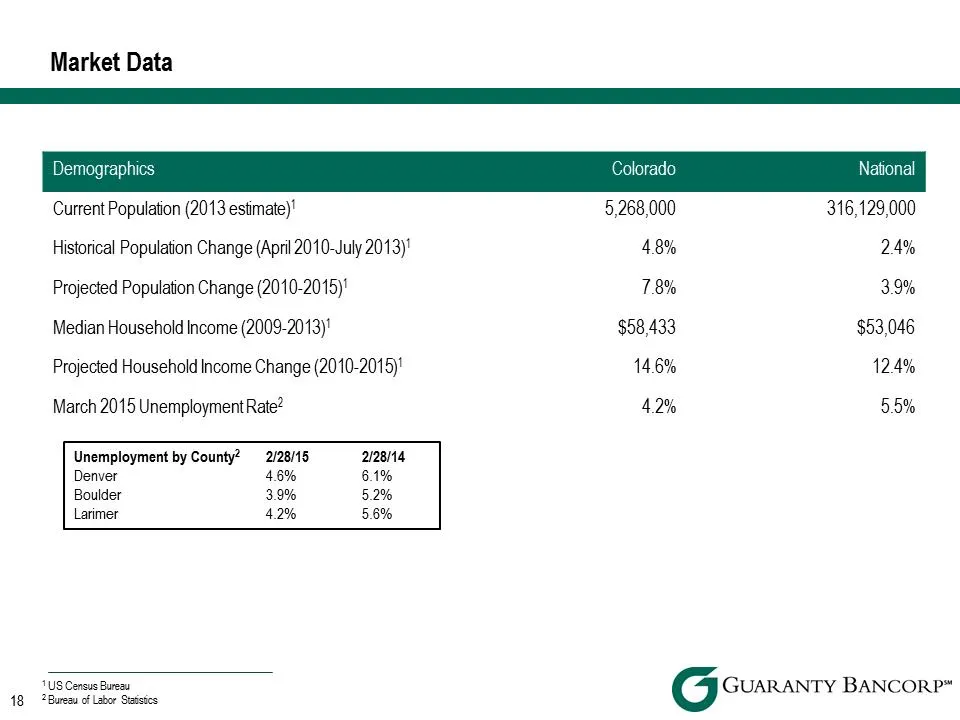
Slide 18: Market Data
Market Data DemographicsColoradoNationalCurrent Population (2013 estimate)1 5,268,000 316,129,000 Historical Population Change (April 2010-July 2013)1 4.8% 2.4% Projected Population Change (2010-2015)1 7.8% 3.9% Median Household Income (2009-2013)1 $58,433 $53,046 Projected Household Income Change (
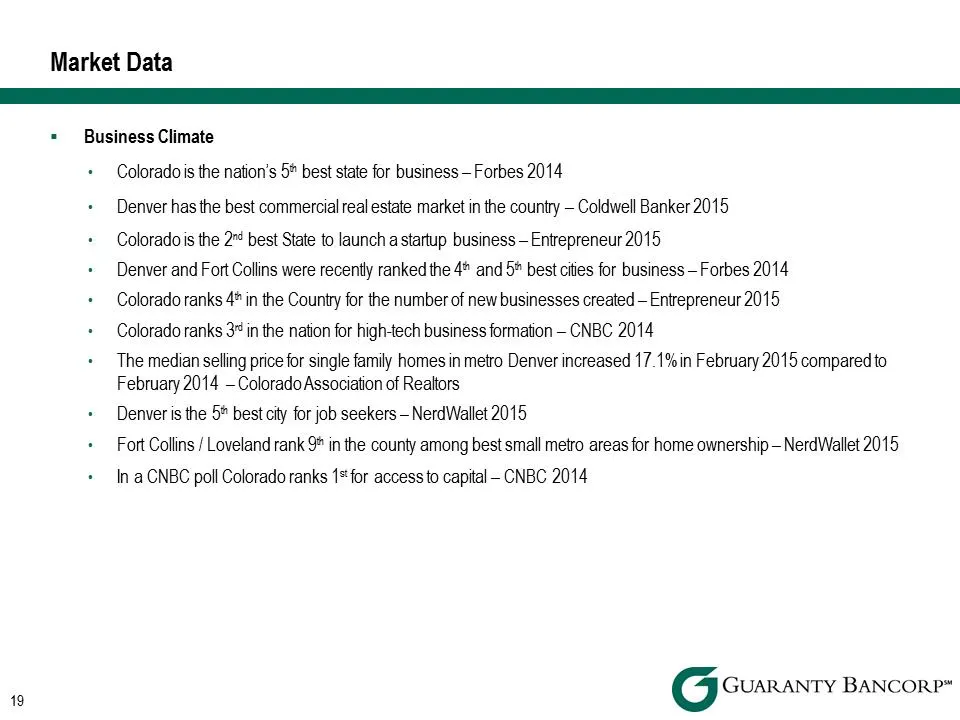
Slide 19: Market Data – Business Climate
Market Data . Business Climate • Colorado is the nation’s 5th best state for business – Forbes 2014 • Denver has the best commercial real estate market in the country – Coldwell Banker 2015 • Colorado is the 2nd best State to launch a startup business – Entrepreneur 2015 • Denver and Fort Collins we
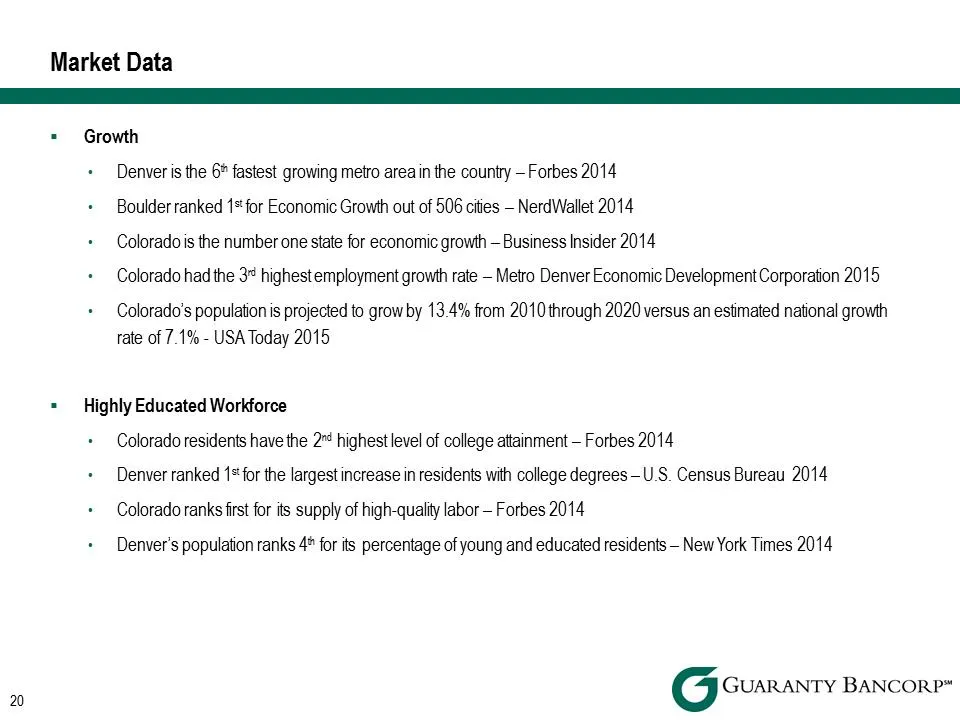
Slide 20: Market Data – Growth
Market Data . Growth • Denver is the 6th fastest growing metro area in the country – Forbes 2014 • Boulder ranked 1st for Economic Growth out of 506 cities – NerdWallet 2014 • Colorado is the number one state for economic growth – Business Insider 2014 • Colorado had the 3rd highest employment growt
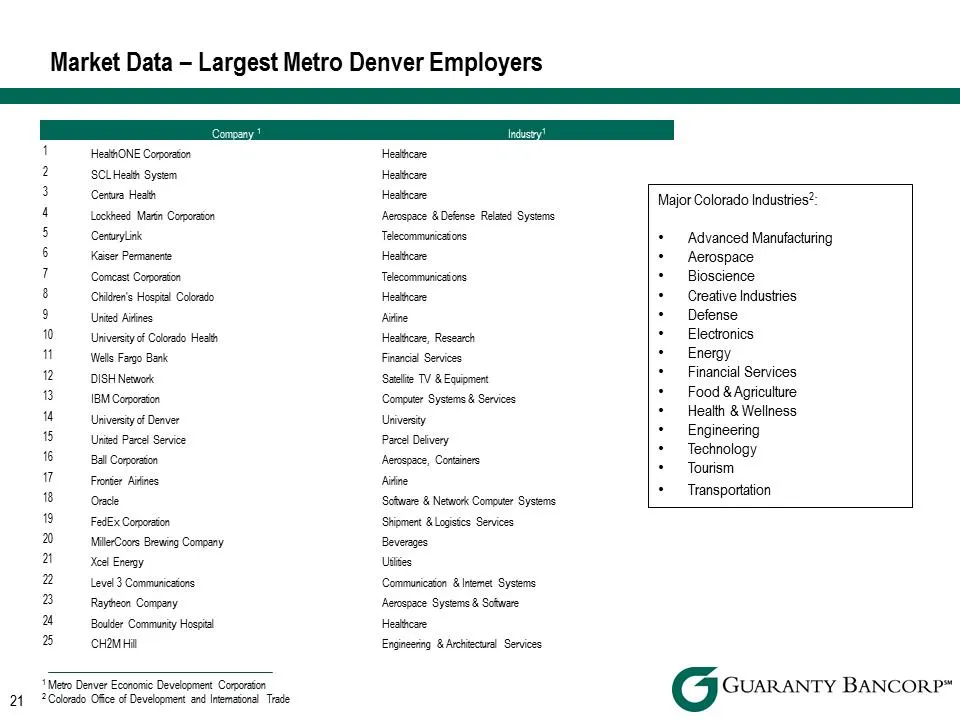
Slide 21: Market Data – Largest Metro Denver Employers
Market Data – Largest Metro Denver Employers Company1Industry11 HealthONE Corporation Healthcare 2 SCL Health System Healthcare 3 Centura Health Healthcare 4 Lockheed Martin Corporation Aerospace & Defense Related Systems CenturyLink Telecommunications 6 Kaiser Permanente Healthcare 7 Comcast Corpor
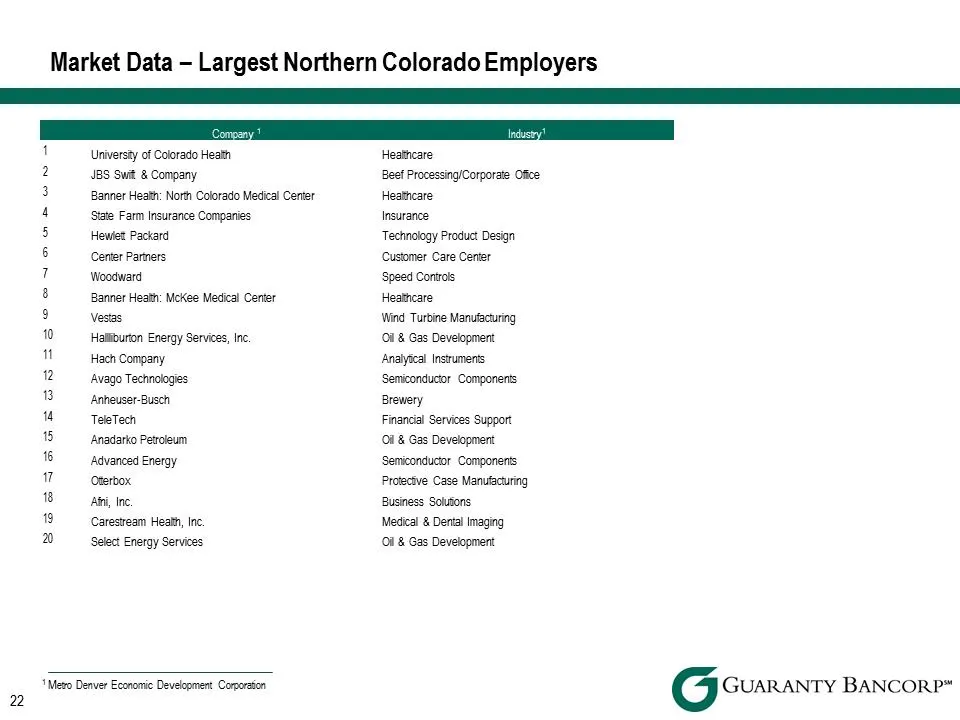
Slide 22: Market Data – Largest Northern Colorado Employers
Market Data – Largest Northern Colorado Employers Company1Industry11 University of Colorado Health Healthcare 2 JBS Swift & Company Beef Processing/Corporate Office 3 Banner Health: North Colorado Medical Center Healthcare 4 State Farm Insurance Companies Insurance 5 Hewlett Packard Technology Produ
Slide 23: Reconciliation of Non-GAAP Financial Measures
Reconciliation of Non-GAAP Financial Measures
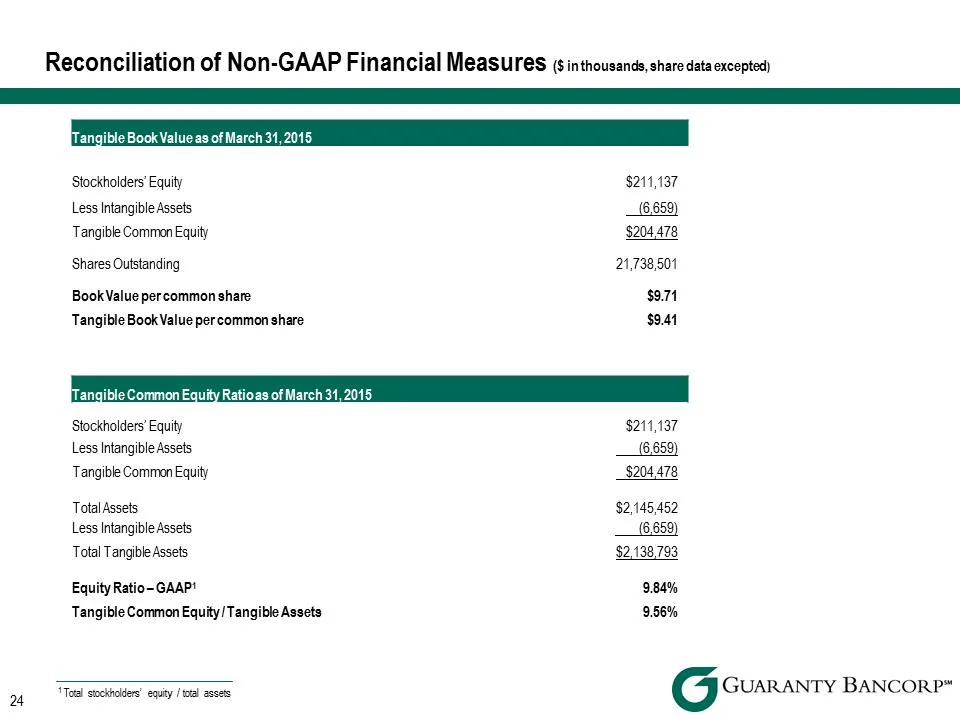
Slide 24: Reconciliation of Non-GAAP Financial Measures
Reconciliation of Non-GAAP Financial Measures ($ in thousands, share data excepted) TangibleBookValueasofMarch31,2015Stockholders’ Equity $211,137 Less Intangible Assets (6,659) Tangible Common Equity $204,478 Shares Outstanding 21,738,501 Book Value per common share $9.71 Tangible Book Value per co
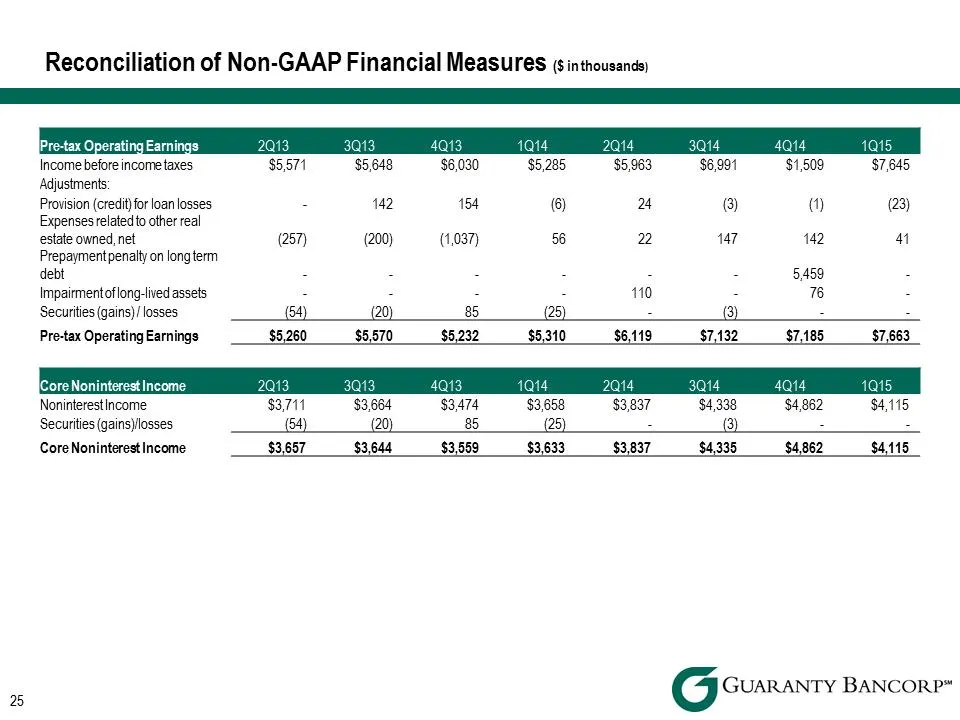
Slide 25: Reconciliation of Non-GAAP Financial Measures
Reconciliation of Non-GAAP Financial Measures ($ in thousands) Pre tax Operating Earnings 2Q13 3Q13 4Q13 1Q14 2Q14 3Q14 4Q14 1Q15 Income before income taxes $5,571 $5,648 $6,030 $5,285 $5,963 $6,991 $1,509 $7,645 Adjustments: Provision (credit) for loan losses -142 154 (6) 24 (3) (1) (23) Expenses r
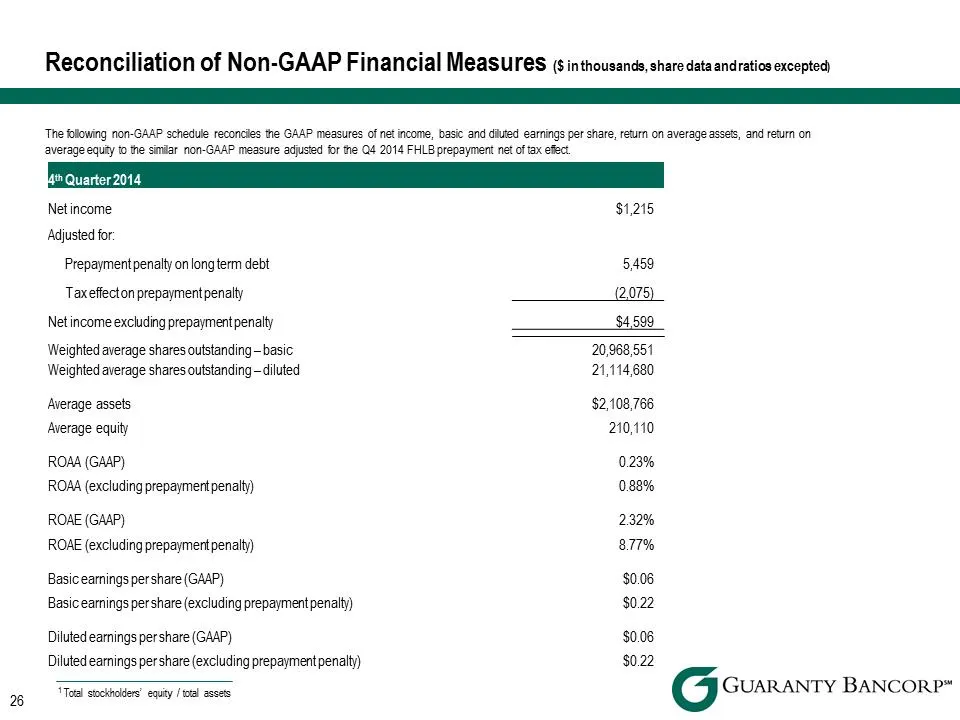
Slide 26: Reconciliation of Non-GAAP Financial Measures
Reconciliation of Non-GAAP Financial Measures ($ in thousands, share data and ratios excepted) The following non-GAAP schedule reconciles the GAAP measures of net income, basic and diluted earnings per share, return on average assets, and return on average equity to the similar non-GAAP measure adju
Source: SEC EDGAR · 8-K filed May 12, 2015
More decks from Guaranty Bancorp
 Merger or Acquisition (May 2018)19 slides · May 23, 2018
 Merger or Acquisition (July 2017)8 slides · Jul 19, 2017
 D.A. Davidson 19th Annual Financial Services Conference 201722 slides · May 9, 2017
 FIG Partners 8th Annual West Coast Bank CEO Forum 201727 slides · Jan 31, 2017
 2016 FBR 23rd Annual Investor Conference27 slides · Nov 28, 2016
 2016 KBW Community Bank Investor Conference26 slides · Aug 1, 2016