AAC — Investor Presentation (May 2017)
39 slides from AAC's investor presentation, May 22, 2017
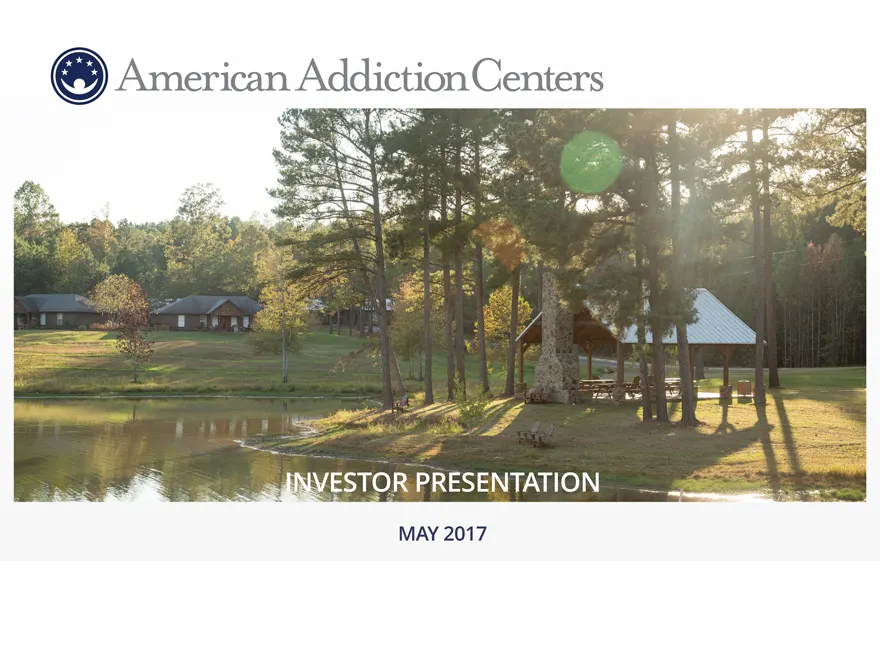
Slide 1: Investor Presentation May 2017
INVESTOR PRESENTATION MAY 2017
Slide 2: Important Presentation Information
IMPORTANT PRESENTATION INFORMATION Notice to We use market data and industry forecasts and projections throughout this presentation, including data from publicly available information and industry publications. These sources generally state that the information they provide has been obtained from so
Slide 3: Presenters
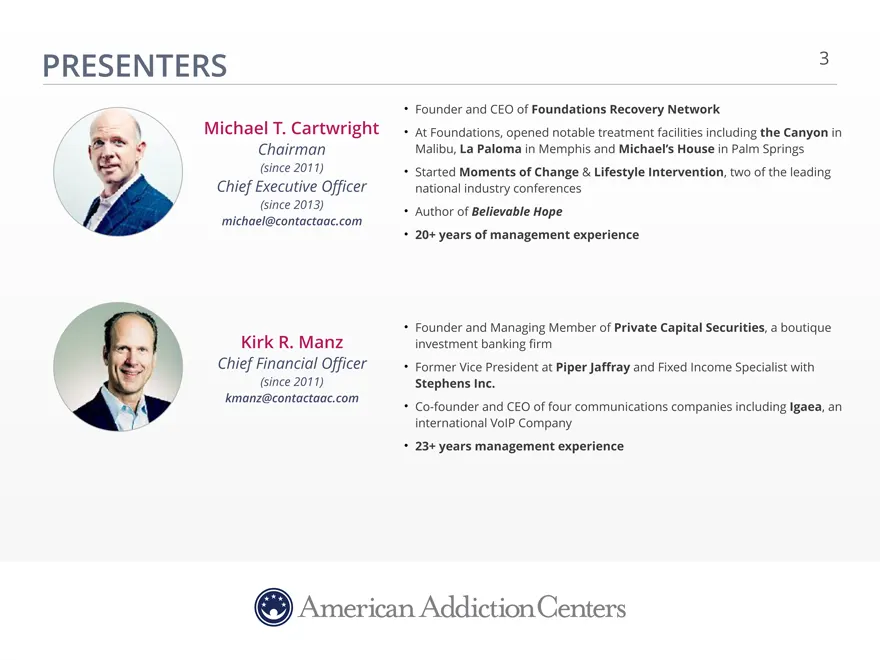
PRESENTERS 3 Founder and CEO of Foundations Recovery Network Michael T. Cartwright At Foundations, opened notable treatment facilities including the Canyon in Chairman Malibu, La Paloma in Memphis and Michael’s House in Palm Springs (since 2011) Started Moments of Change & Lifestyle Intervention, tw
Slide 4: Industry Primer
American Addiction Centers ey INDUSTRY PRIMER
Slide 5: Significant Unmet Need
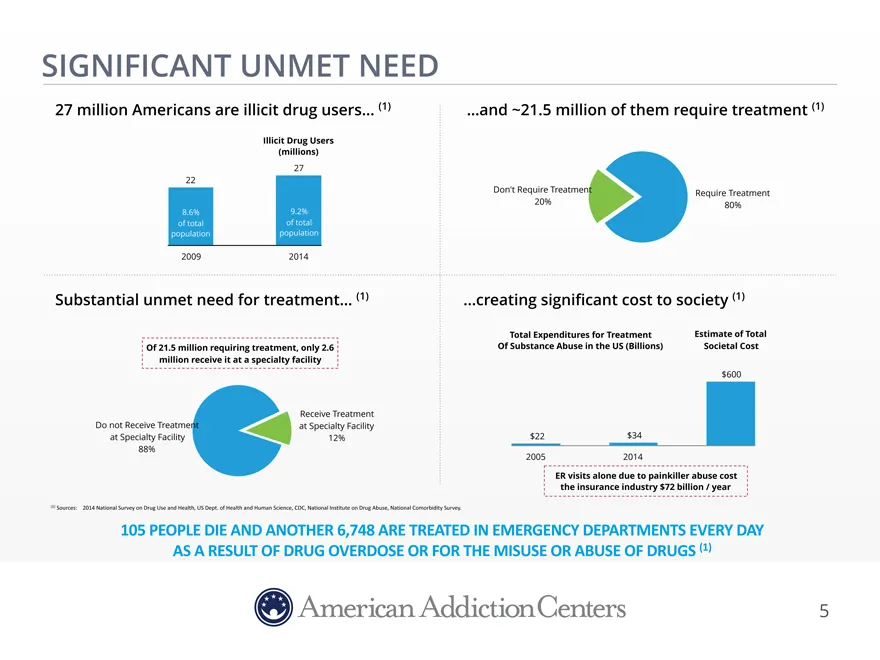
SIGNIFICANT UNMET NEED 27 million Americans are illicit drug users… (1) …and ~21.5 million of them require treatment (1) Illicit Drug Users (millions) 27 22 Don’t Require TreatmentRequire Treatment 20%80% 8.6% 9.2% of total of total population population 2009 2014 Substantial unmet need for treatmen
Slide 6: Current Addiction Headlines
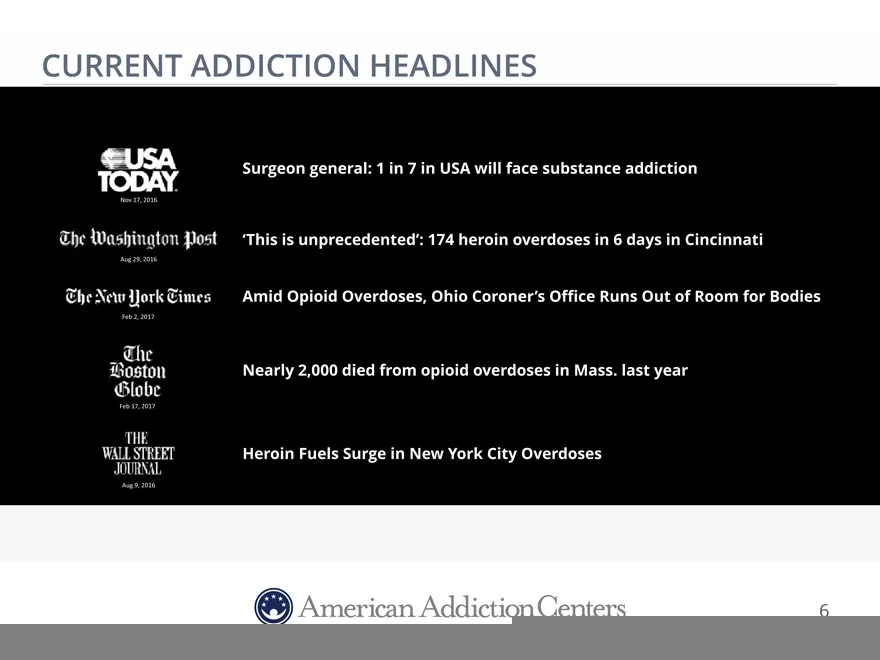
CURRENT ADDICTION HEADLINES Surgeon general: 1 in 7 in USA will face substance addiction Nov 17, 2016 ‘This is unprecedented’: 174 heroin overdoses in 6 days in Cincinnati Aug 29, 2016 Amid Opioid Overdoses, Ohio Coroner’s Office Runs Out of Room for Bodies Feb$2,$2017 Nearly 2,000 died from opioid
Slide 7: Types of Treatment Services
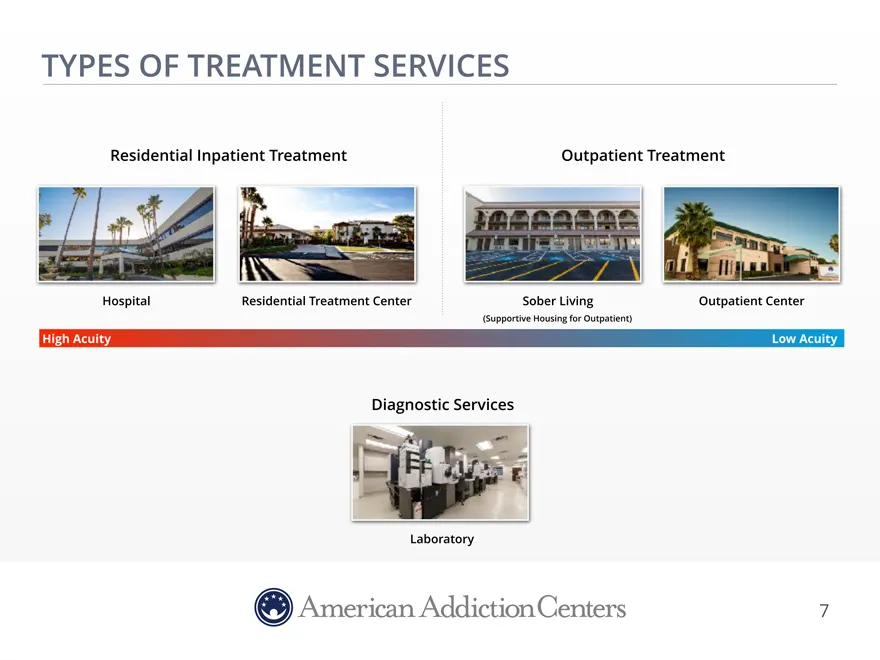
TYPES OF TREATMENT SERVICES Residential Inpatient Treatment Outpatient Treatment Hospital Residential Treatment Center Sober Living Outpatient Center (Supportive Housing for Outpatient) High Acuity Low Acuity Diagnostic Services Laboratory 7
Slide 8: Inpatient versus Outpatient
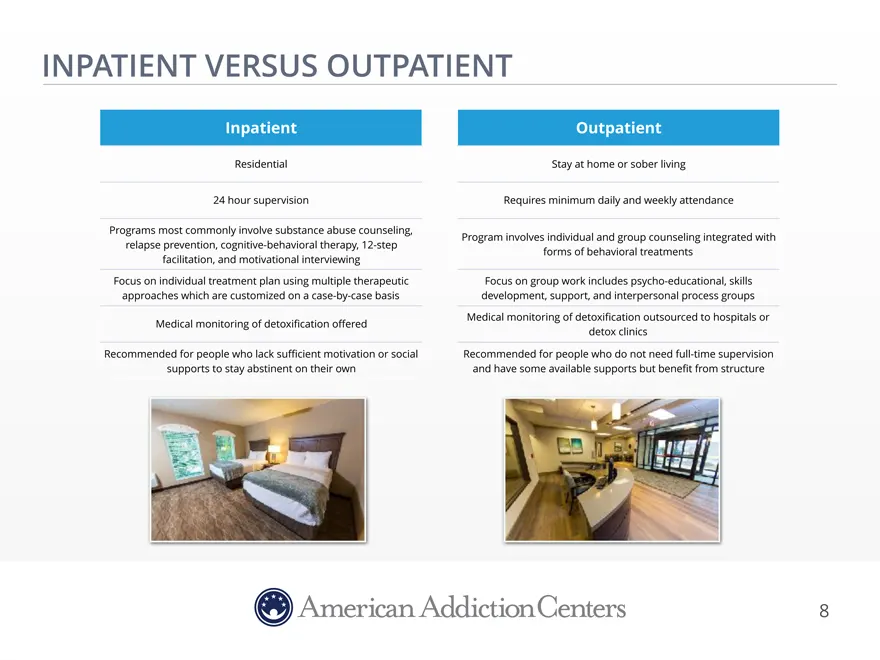
INPATIENT VERSUS OUTPATIENT Inpatient Outpatient Residential Stay at home or sober living 24 hour supervision Requires minimum daily and weekly attendance Programs most commonly involve substance abuse counseling, Program involves individual and group counseling integrated with relapse prevention, c
Slide 9: Levels of Care Overview
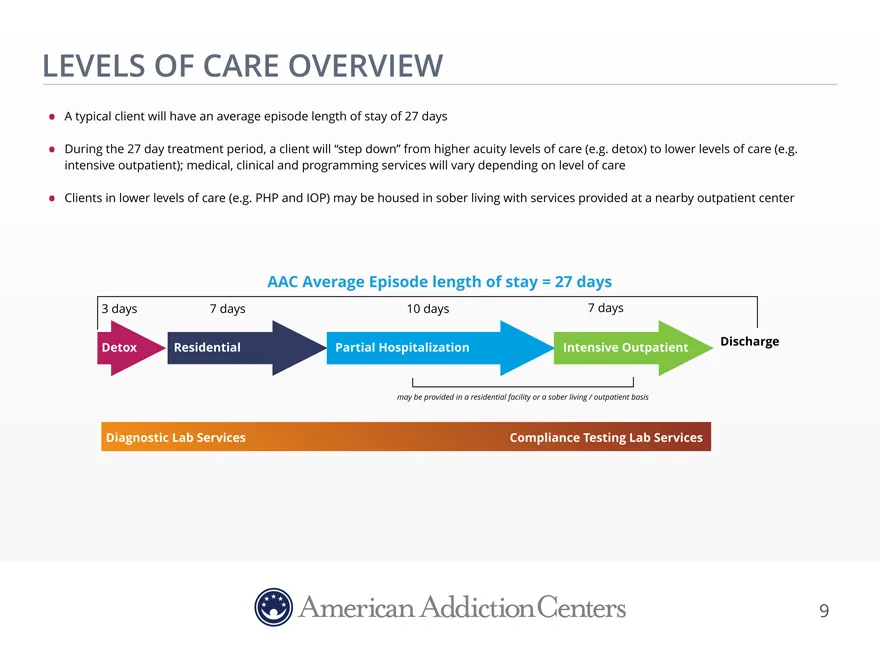
LEVELS OF CARE OVERVIEW A typical client will have an average episode length of stay of 27 days During the 27 day treatment period, a client will “step down” from higher acuity levels of care (e.g. detox) to lower levels of care (e.g. intensive outpatient); medical, clinical and programming services
Slide 10: Favorable Legislative Tailwinds
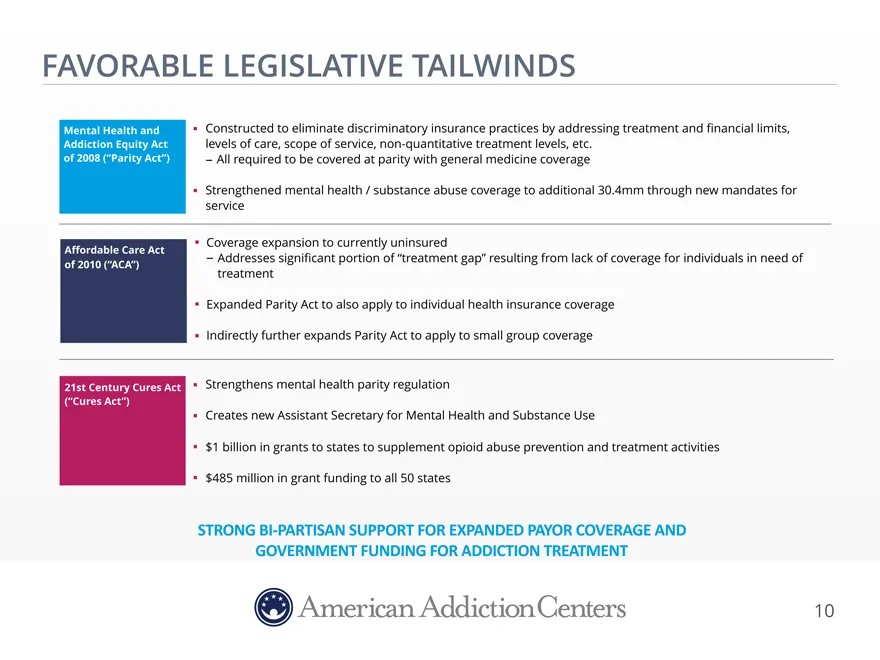
FAVORABLE LEGISLATIVE TAILWINDS Mental Health and Constructed to eliminate discriminatory insurance practices by addressing treatment and financial limits, Addiction Equity Act levels of care, scope of service, non-quantitative treatment levels, etc. of 2008 (“Parity Act”) - All required to be cover
Slide 11: AAC: At a Glance
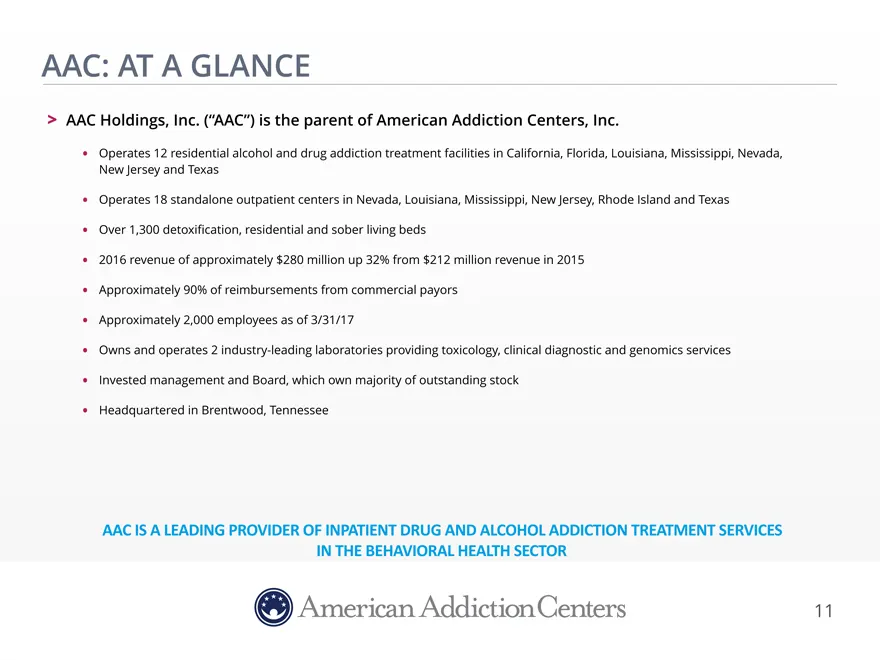
AAC: AT A GLANCE AAC Holdings, Inc. (“AAC”) is the parent of American Addiction Centers, Inc. Operates 12 residential alcohol and drug addiction treatment facilities in California, Florida, Louisiana, Mississippi, Nevada, New Jersey and Texas Operates 18 standalone outpatient centers in Nevada, Loui
Slide 12: Timeline of AAC's Success
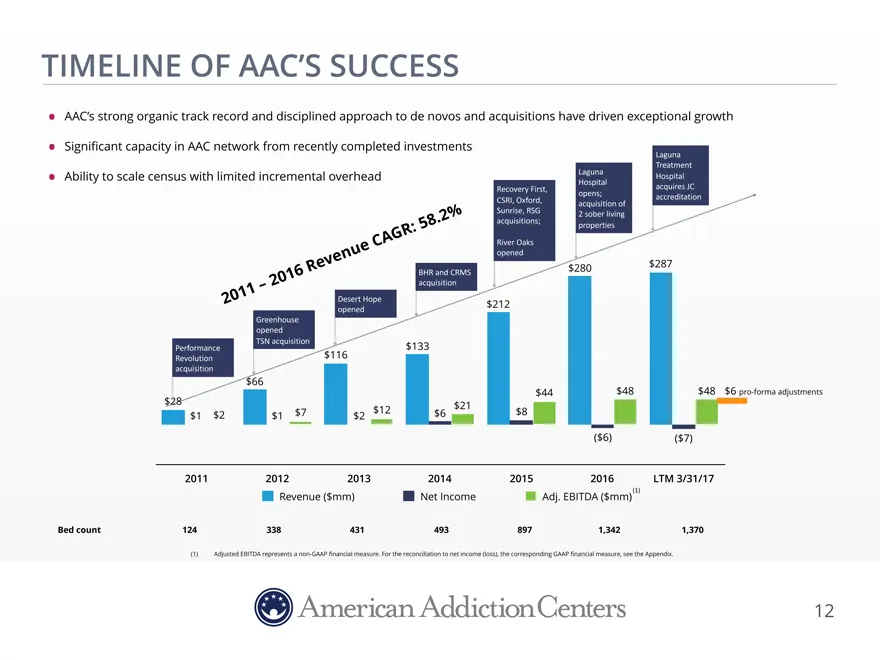
TIMELINE OF AAC’S SUCCESS AAC’s strong organic track record and disciplined approach to de novos and acquisitions have driven exceptional growth Significant capacity in AAC network from recently completed investments Laguna Treatment LagunaHospital$ Ability to scale census with limited incremental o
Slide 13: Market Focus and Clinical Excellence
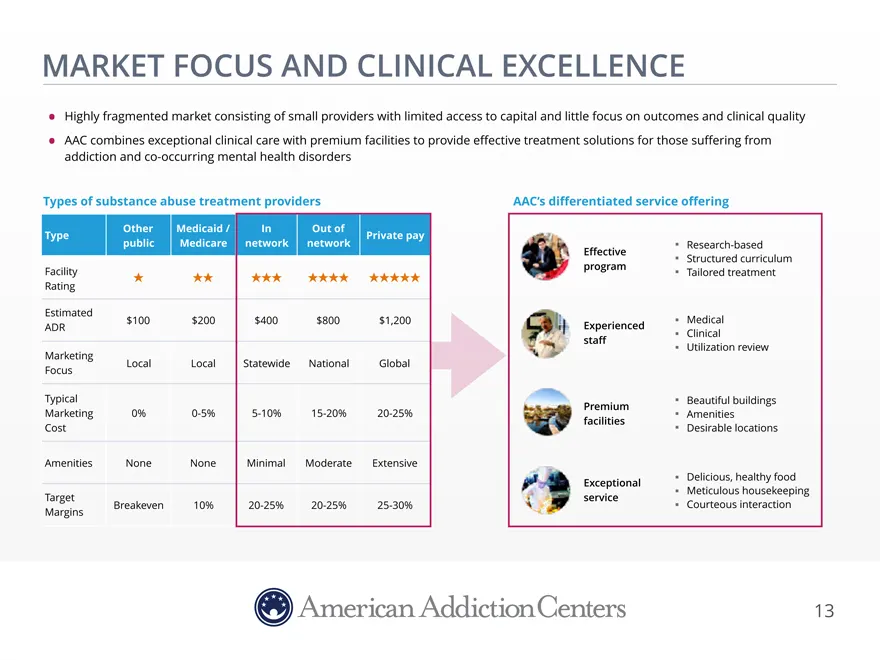
MARKET FOCUS AND CLINICAL EXCELLENCE Highly fragmented market consisting of small providers with limited access to capital and little focus on outcomes and clinical quality AAC combines exceptional clinical care with premium facilities to provide effective treatment solutions for those suffering fro
Slide 14: Best-in-Class Sales and Marketing Engine
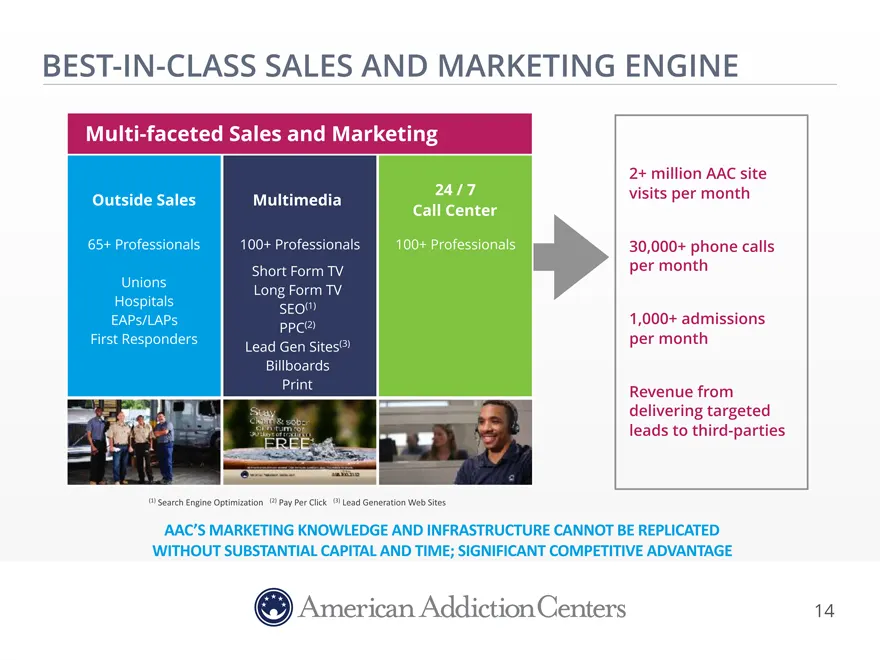
BEST-IN-CLASS SALES AND MARKETING ENGINE Multi-faceted Sales and Marketing 2+ million AAC site Outside Sales Multimedia 24 / 7visits per month Call Center 65+ Professionals 100+ Direct Professionals 100+ Professionalsper 30,000+ month phone calls Short Form TV Hospitals Unions ReferLong FormalsTV SE
Slide 15: Strong, National Demand for Services
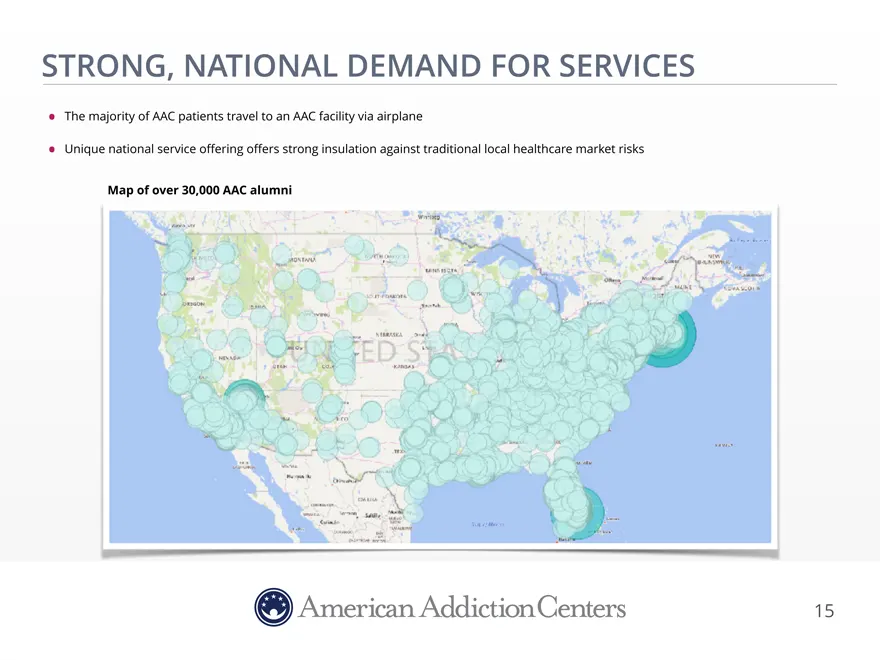
STRONG, NATIONAL DEMAND FOR SERVICES The majority of AAC patients travel to an AAC facility via airplane Unique national service offering offers strong insulation against traditional local healthcare market risks Map of over 30,000 AAC alumni 15
Slide 16: Geographic Footprint
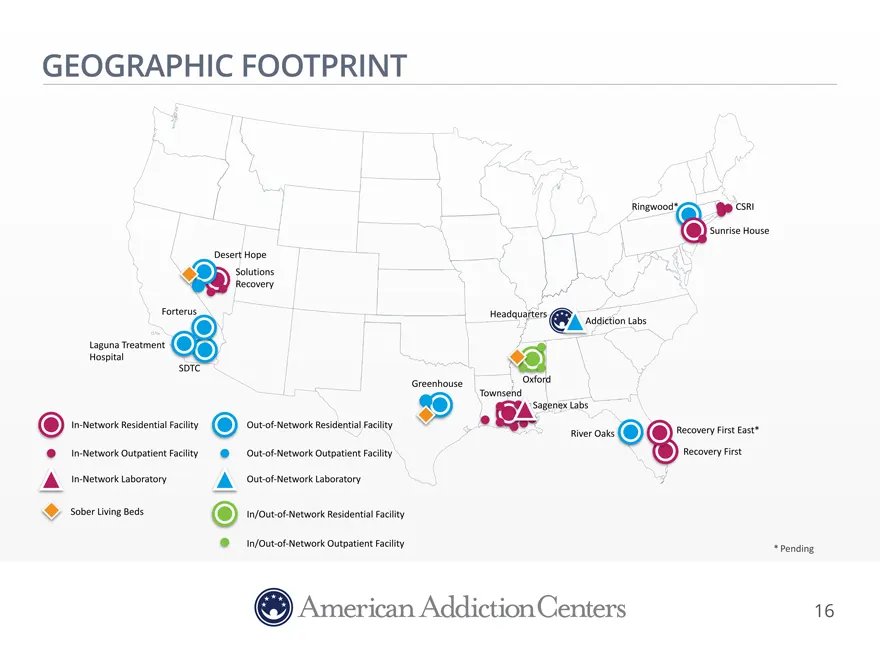
GEOGRAPHIC FOOTPRINT Ringwood CSRI Sunrise$House Desert Hope Solutions$ Recovery Forterus Headquarters ddiction$Labs Laguna Treatment$ Hospital SD Greenhouse Oxford Townsend agenex$Labs In-Network$Residential$Facility Out-of-Network$Residential$Facility River$Oaks Recovery$First East* In-Network$Out
Slide 17: Proven Improvement in Patient Outcomes
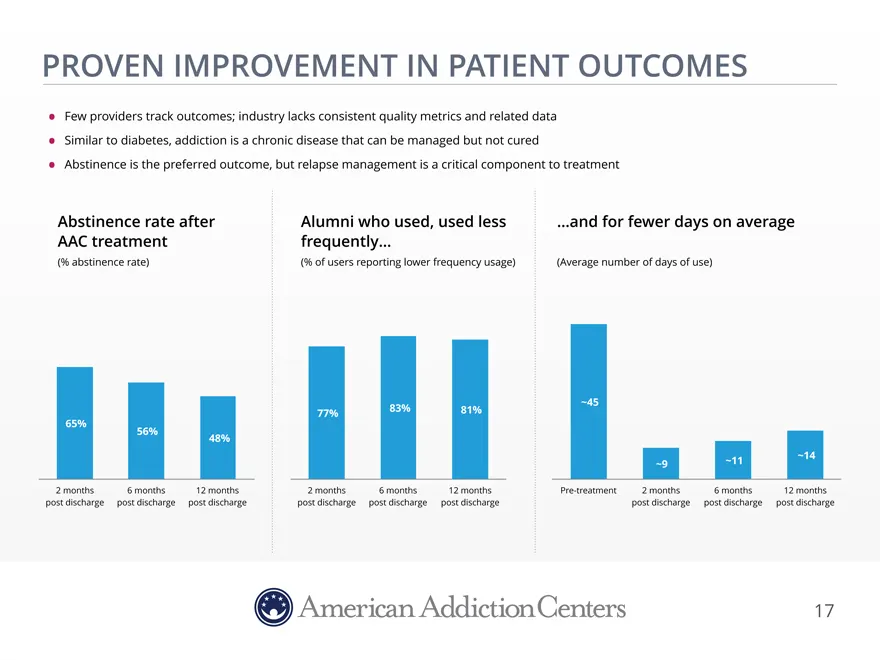
PROVEN IMPROVEMENT IN PATIENT OUTCOMES Few providers track outcomes; industry lacks consistent quality metrics and related data Similar to diabetes, addiction is a chronic disease that can be managed but not cured Abstinence is the preferred outcome, but relapse management is a critical component to
Slide 18: Laboratory and Diagnostics Capabilities
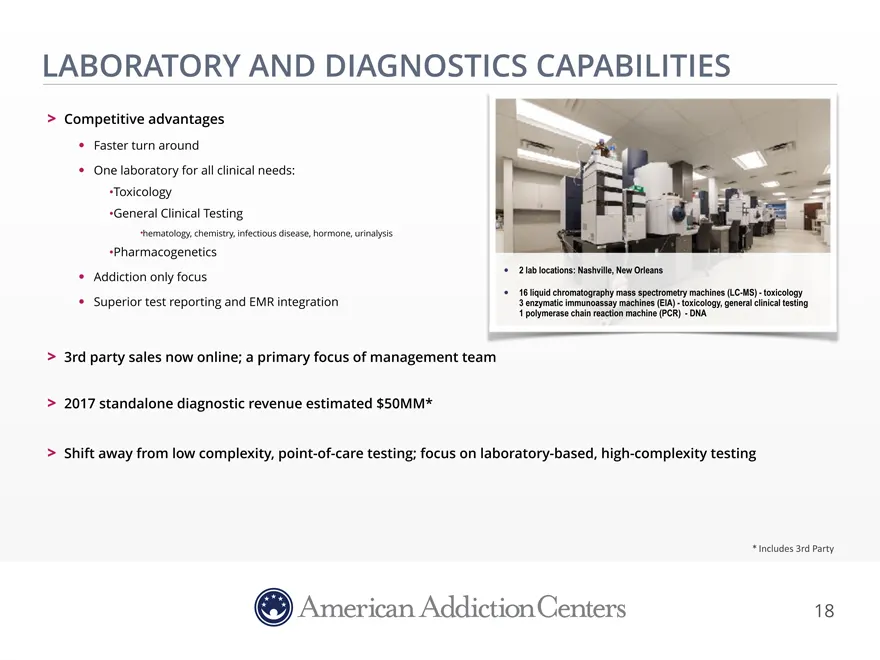
LABORATORY AND DIAGNOSTICS CAPABILITIES Competitive advantages Faster turn around One laboratory for all clinical needs: Toxicology General Clinical Testing hematology, chemistry, infectious disease, hormone, urinalysis Pharmacogenetics Addiction only focus 2 lab locations: Nashville, New Orleans 16
Slide 19: Employees and Operations
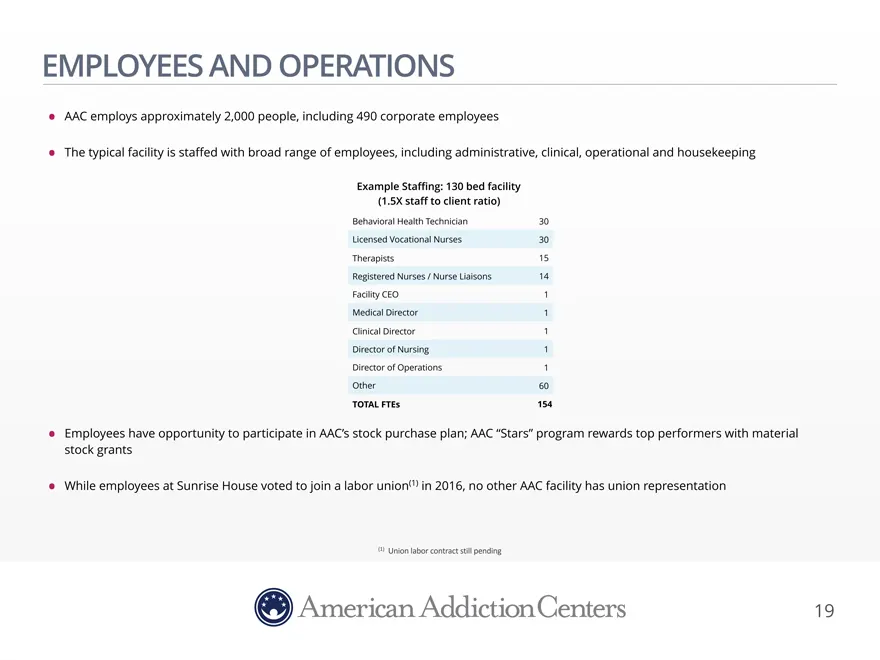
EMPLOYEES AND OPERATIONS AAC employs approximately 2,000 people, including 490 corporate employees The typical facility is staffed with broad range of employees, including administrative, clinical, operational and housekeeping Example Staffing: 130 bed facility (1.5X staff to client ratio) Behaviora
Slide 20: Compliance Program
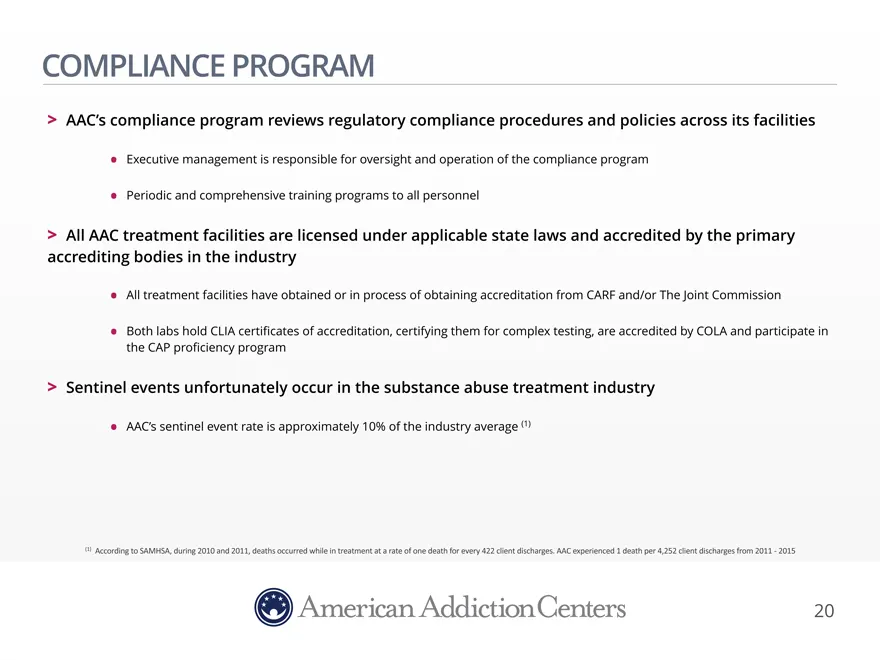
COMPLIANCE PROGRAM AAC’s compliance program reviews regulatory compliance procedures and policies across its facilities Executive management is responsible for oversight and operation of the compliance program Periodic and comprehensive training programs to all personnel All AAC treatment facilities
Slide 21: Recent Expense Reduction Initiatives
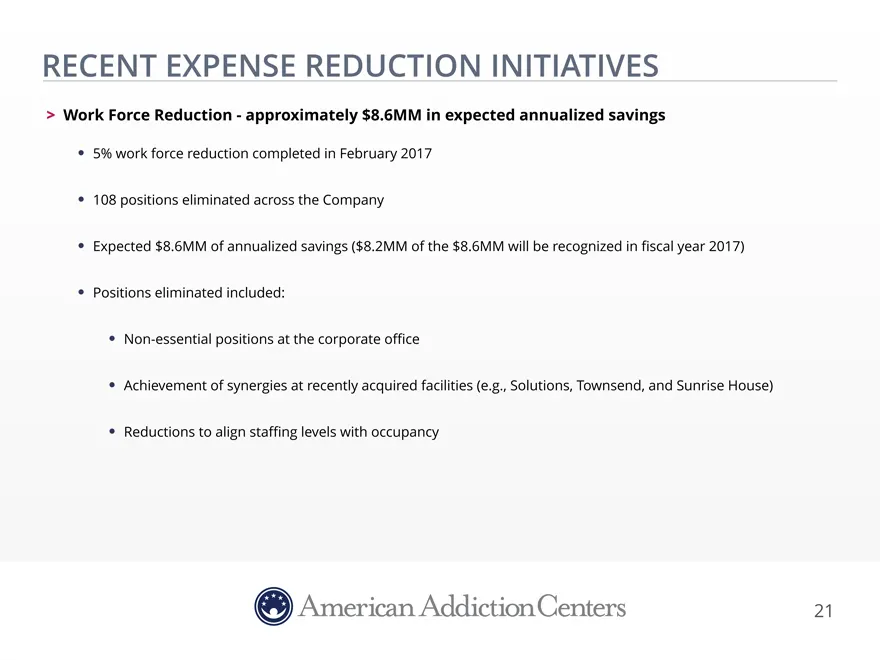
RECENT EXPENSE REDUCTION INITIATIVES Work Force Reduction—approximately $8.6MM in expected annualized savings 5% work force reduction completed in February 2017 108 positions eliminated across the Company Expected $8.6MM of annualized savings ($8.2MM of the $8.6MM will be recognized in fiscal year 2
Slide 22: Recent Developments and Company Updates
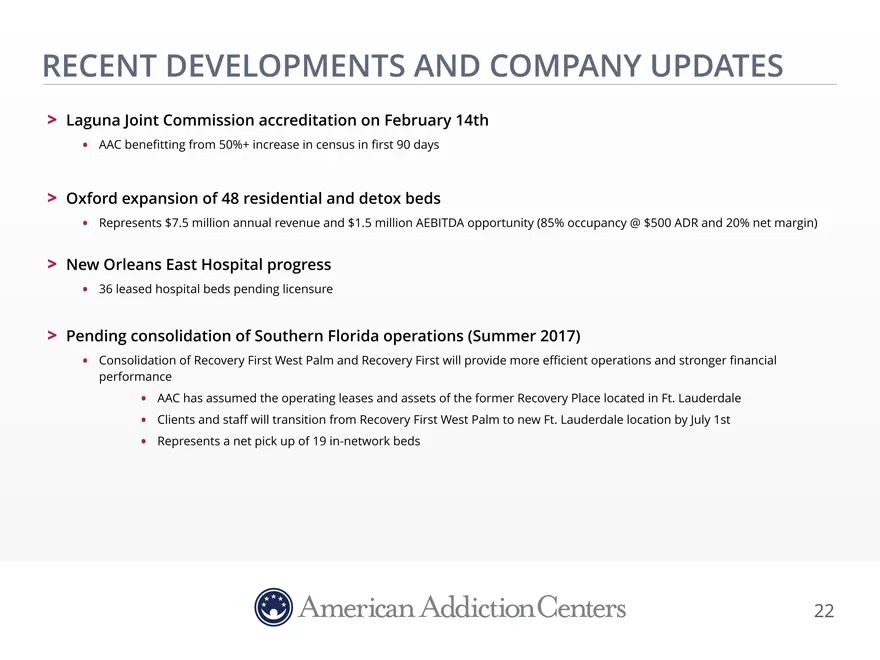
RECENT DEVELOPMENTS AND COMPANY UPDATES Laguna Joint Commission accreditation on February 14th AAC benefitting from 50%+ increase in census in first 90 days Oxford expansion of 48 residential and detox beds Represents $7.5 million annual revenue and $1.5 million AEBITDA opportunity (85% occupancy @
Slide 23: The AAC Difference
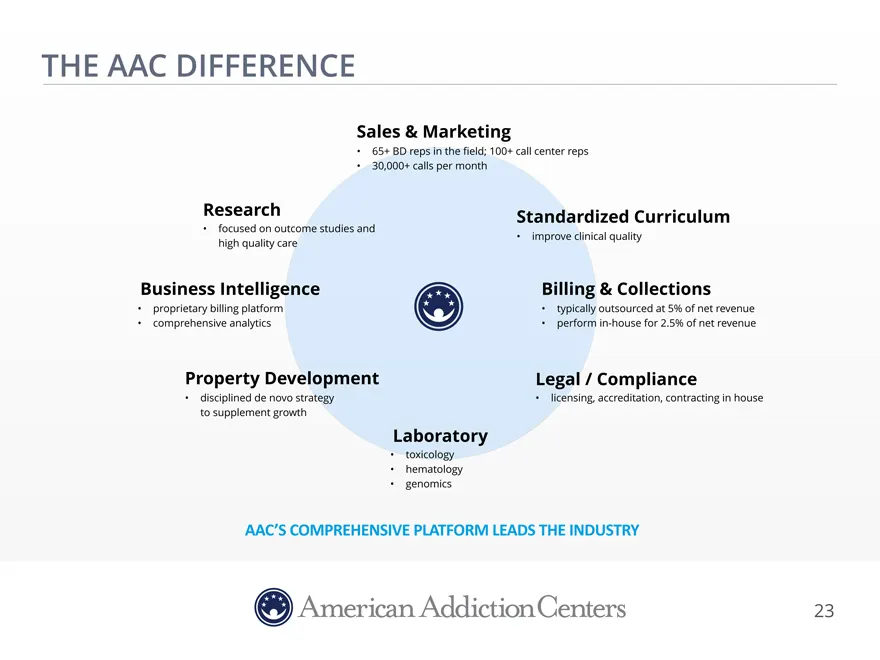
THE AAC DIFFERENCE Sales & Marketing 65+ BD reps in the field; 100+ call center reps 30,000+ calls per month Research Standardized Curriculum focused on outcome studies and improve clinical quality high quality care Business Intelligence Billing & Collections proprietary billing platform typically o
Slide 24: Greenhouse Financial Update
GREENHOUSE FINANCIAL UPDATE 24
Slide 25: Embedded Growth from Recent Investments
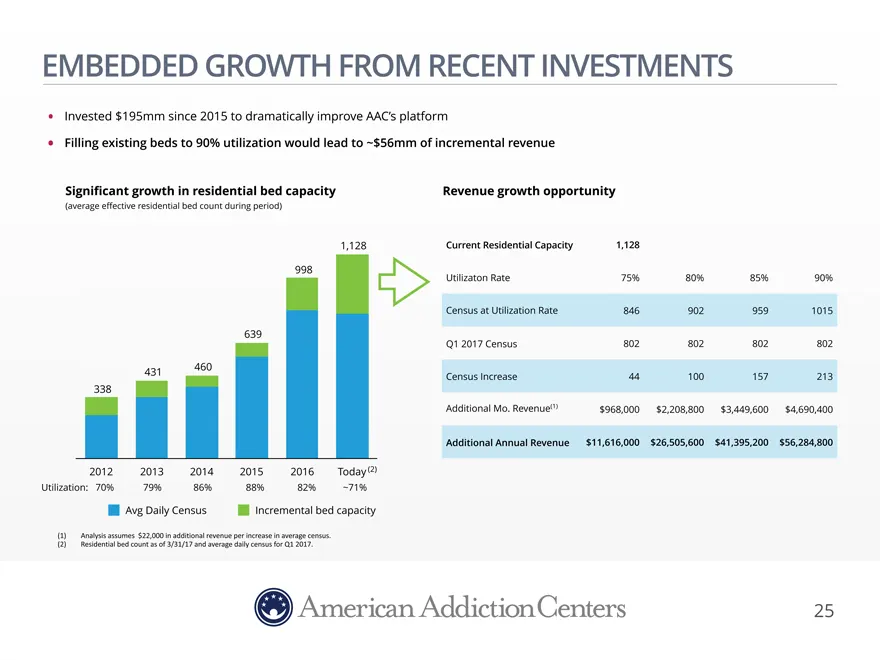
EMBEDDED GROWTH FROM RECENT INVESTMENTS Invested $195mm since 2015 to dramatically improve AAC’s platform Filling existing beds to 90% utilization would lead to ~$56mm of incremental revenue Significant growth in residential bed capacity (average effective residential bed count during period) 1,128
Slide 26: High Growth Platform with Operating Leverage
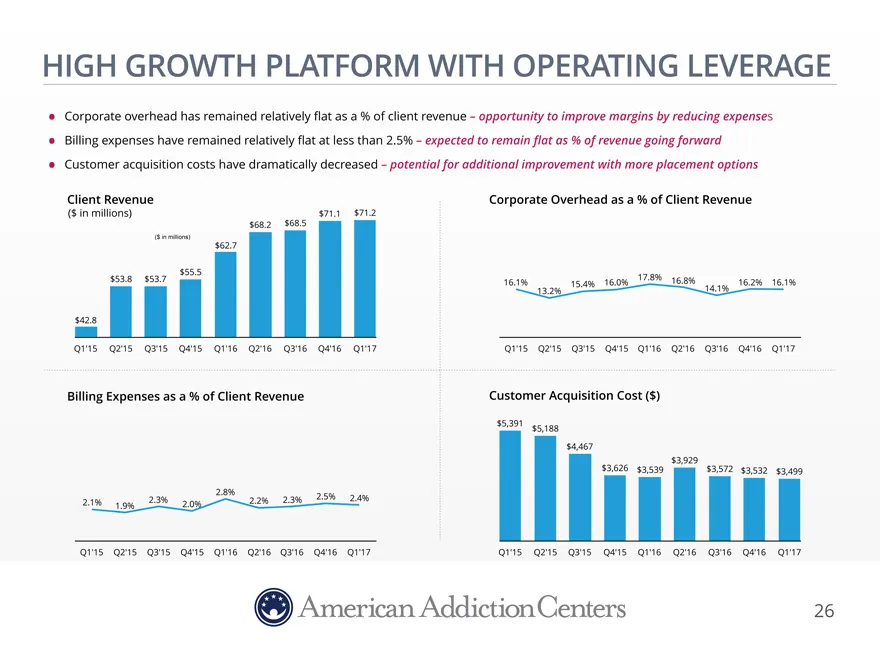
HIGH GROWTH PLATFORM WITH OPERATING LEVERAGE Corporate overhead has remained relatively flat as a % of client revenue – opportunity to improve margins by reducing expenses Billing expenses have remained relatively flat at less than 2.5% – expected to remain flat as % of revenue going forward Custome
Slide 27: Diversified Payor Base
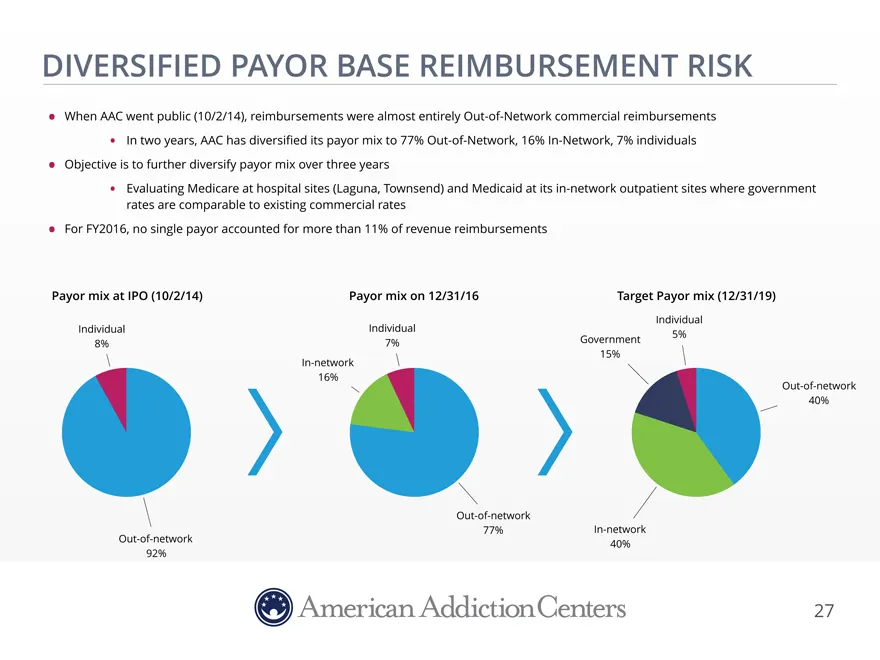
DIVERSIFIED PAYOR BASE REIMBURSEMENT RISK When AAC went public (10/2/14), reimbursements were almost entirely Out-of-Network commercial reimbursements In two years, AAC has diversified its payor mix to 77% Out-of-Network, 16% In-Network, 7% individuals Objective is to further diversify payor mix ove
Slide 28: Residential Client Economics
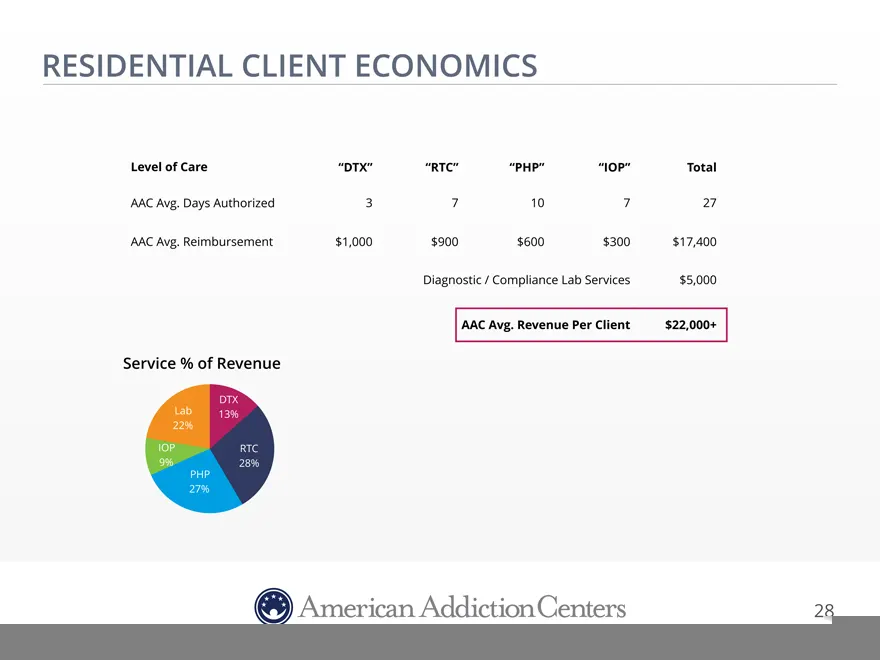
RESIDENTIAL CLIENT ECONOMICS Level of Care “DTX”“RTC”“PHP”“IOP”Total AAC Avg. Days Authorized 3 710727 AAC Avg. Reimbursement $1,000 $900$600$300$17,400 Diagnostic / Compliance Lab Services$5,000 AAC Avg. Revenue Per Client$22,000+ Service % of Revenue DTX Lab 13% 22% IOP RTC 9% 28% PHP 27% 28
Slide 29: Valuable Real Estate & Significant Collateral
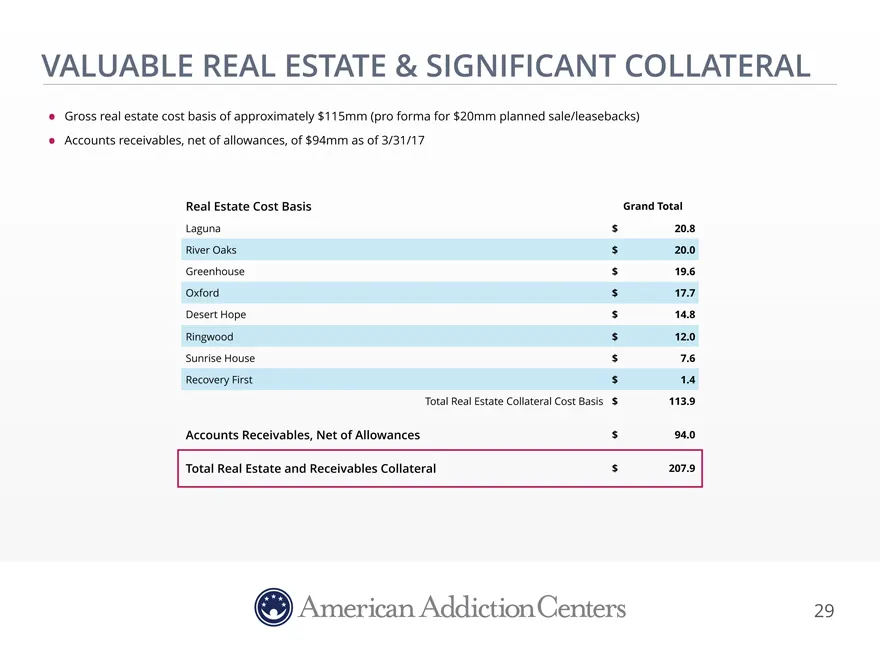
VALUABLE REAL ESTATE & SIGNIFICANT COLLATERAL Gross real estate cost basis of approximately $115mm (pro forma for $20mm planned sale/leasebacks) Accounts receivables, net of allowances, of $94mm as of 3/31/17 Real Estate Cost Basis Grand Total Laguna $ 20.8 River Oaks $ 20.0 Greenhouse $ 19.6 Oxford
Slide 30: De Novo Analysis: River Oaks, First Full Year
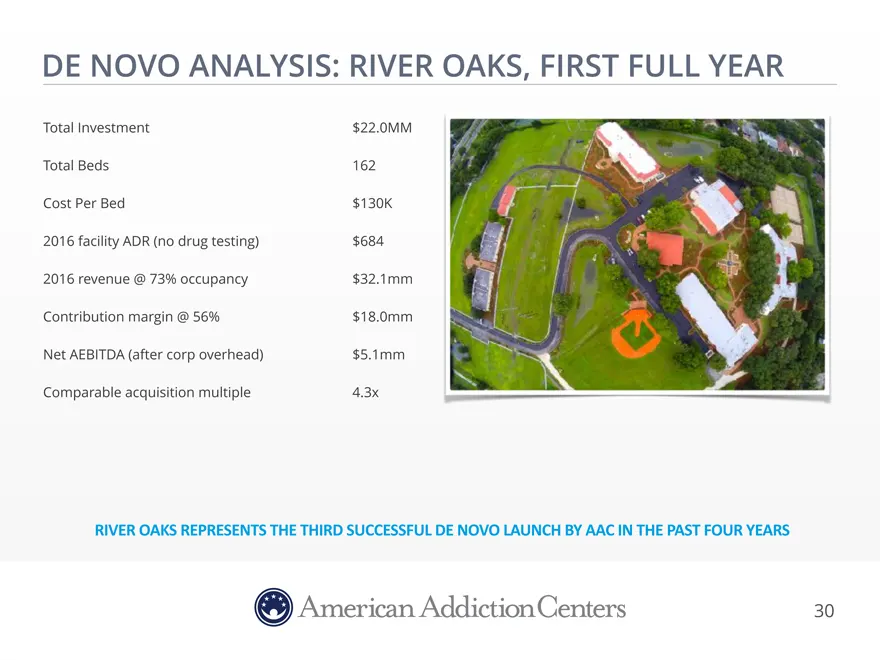
DE NOVO ANALYSIS: RIVER OAKS, FIRST FULL YEAR Total Investment $22.0MM Total Beds 162 Cost Per Bed $130K 2016 facility ADR (no drug testing) $684 2016 revenue @ 73% occupancy $32.1mm Contribution margin @ 56% $18.0mm Net AEBITDA (after corp overhead) $5.1mm Comparable acquisition multiple 4.3x RIVER
Slide 31: Diagnostic Evolution
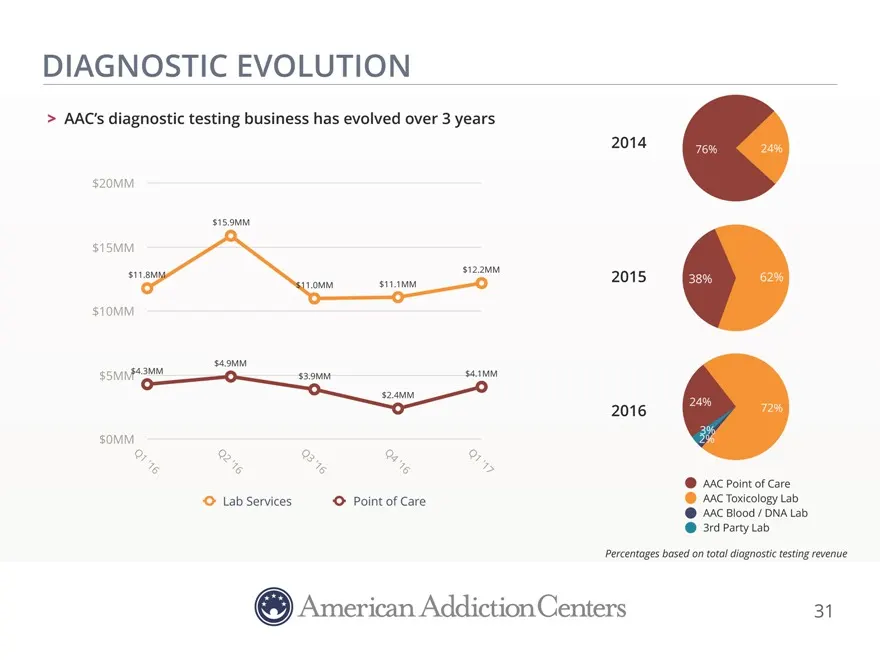
DIAGNOSTIC EVOLUTION AAC’s diagnostic testing business has evolved over 3 years 2014 76% 24% $20MM $15.9MM $15MM $12.2MM $11.8MM $11.1MM 2015 38% 62% $11.0MM $10MM $4.9MM $4.3MM $4.1MM $5MM $3.9MM $2.4MM 24% 2016 72% 3% $0MM 2% Q1 Q2 Q3 Q4 Q1 ‘16 ‘16 ‘16 ‘16 ‘17 AAC Point of Care Lab Services Point
Slide 32: Operating Metrics
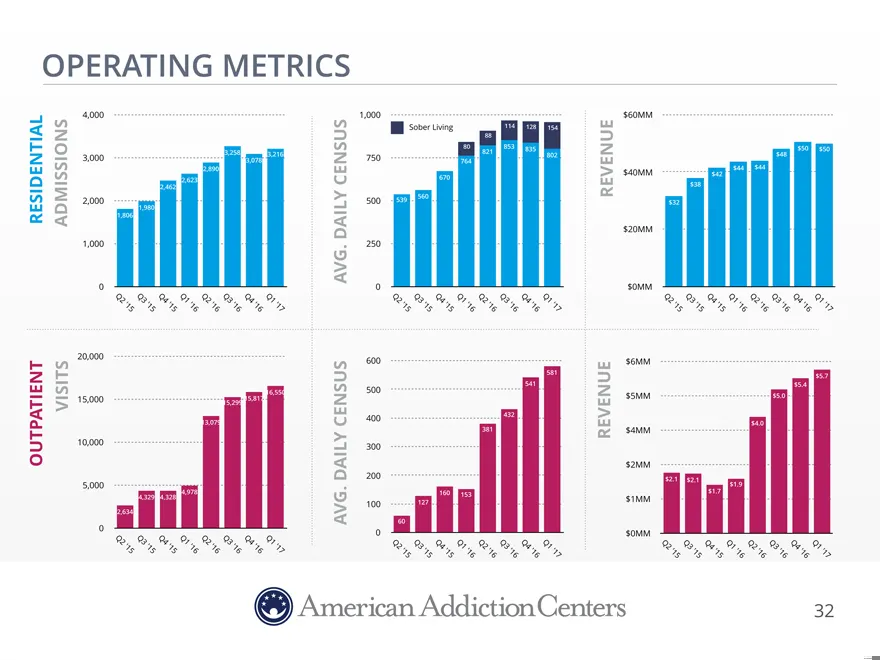
OPERATING METRICS 4,000 1,000$60MM Sober Living114128154 88 80853835$50 $50 3,000 3,258 3,0783,216750821802$48 764 2,890$40MM$42 $44 $44 2,623 670 2,462 $38 2,000 500539560$32 1,980 RESIDENTIAL ADMISSIONS 1,806 CENSUSREVENUE DAILY$20MM 1,000 .250 AVG 0 0$0MM Q2 Q3 Q4 Q1 Q2 Q3 Q4Q1Q2Q3 Q4 Q1Q2Q3Q4Q1Q
Slide 33: Historical Financial Performance
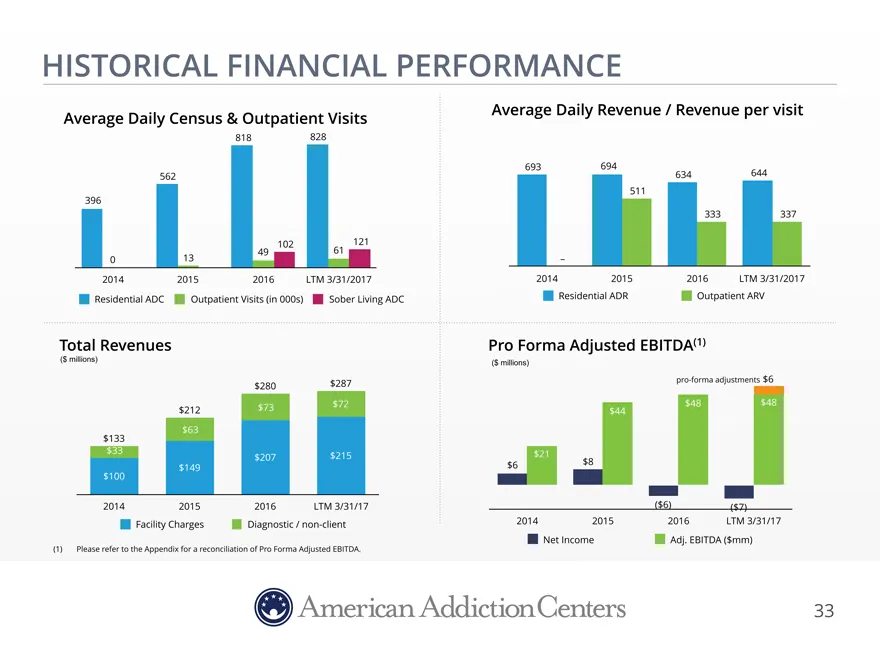
HISTORICAL FINANCIAL PERFORMANCE Average Daily Census & Outpatient Visits 818 828 562 396 102 121 0 13 49 61 2014 2015 2016 LTM 3/31/2017 Residential ADC Outpatient Visits (in 000s) Sober Living ADC Total Revenues ($ millions) $280 $287 $212 $73 $72 $63 $133 $33 $207 $215 $149 $100 2014 2015 2016 LT
Slide 34: DSOs Increased, Collections Were Stable
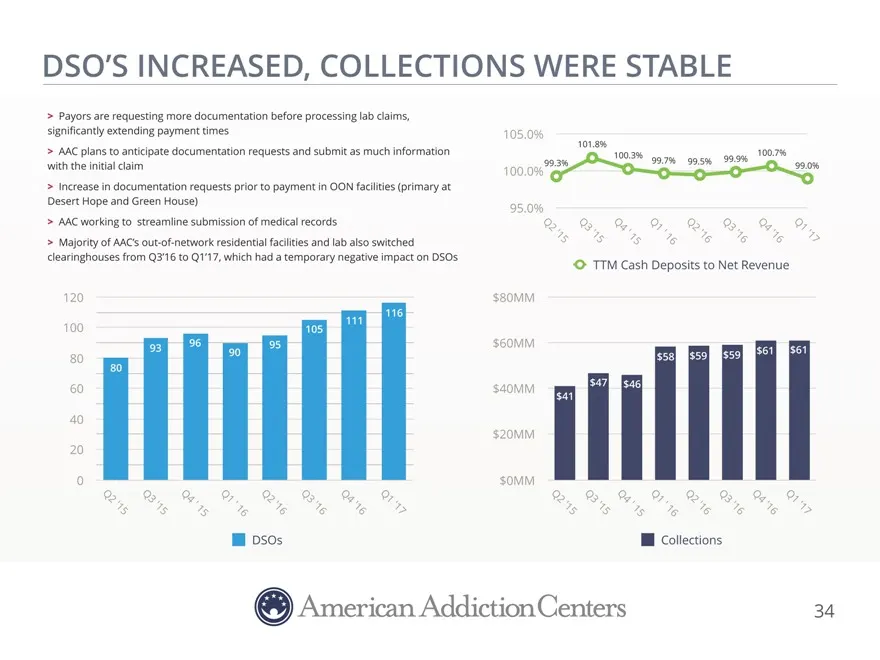
DSO’S INCREASED, COLLECTIONS WERE STABLE Payors are requesting more documentation before processing lab claims, significantly extending payment times 105.0% 101.8% AAC plans to anticipate documentation requests and submit as much information 100.3%100.7% with the initial claim 100.0% 99.3%99.7%99.5%
Slide 35: 2017 DSO Update
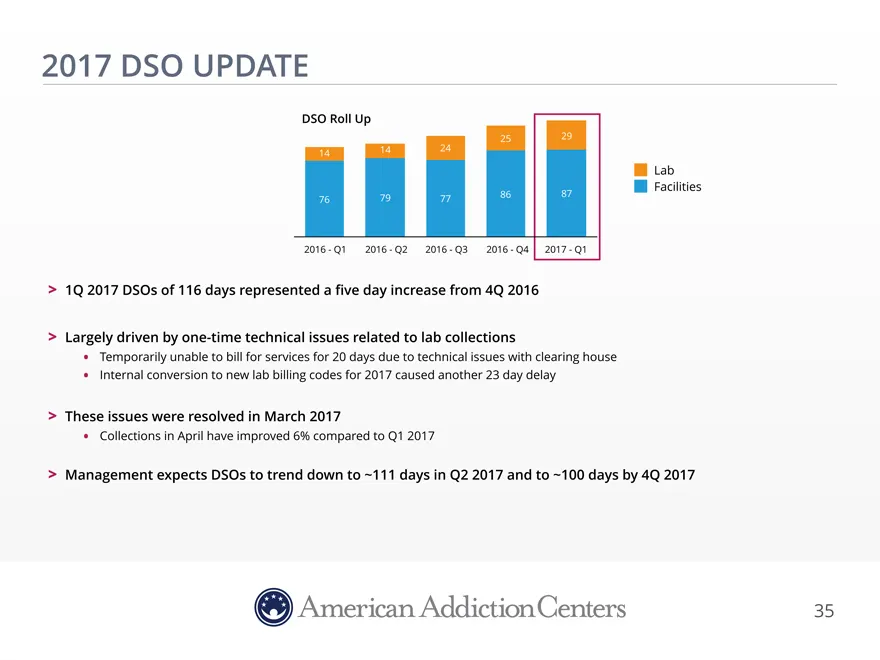
2017 DSO UPDATE DSO Roll Up 25 29 14 24 14 Lab Facilities 79 86 87 76 77 2016—Q1 2016—Q2 2016—Q3 2016—Q4 2017—Q1 1Q 2017 DSOs of 116 days represented a five day increase from 4Q 2016 Largely driven by one-time technical issues related to lab collections Temporarily unable to bill for services for 20
Slide 36: Appendix
American Addiction Centers Me DESERT HOPE APPENDIX 36
Slide 37: Appendix: Non-GAAP Financial Measures
APPENDIX: NON-GAAP FINANCIAL MEASURES Adjusted EBITDA and Adjusted Pro Forma Adjusted EBITDA, (herein collectively referred to as “Non-GAAP Disclosures”) are “non-GAAP financial measures” as defined under the rules and regulations promulgated by the U.S. Securities and Exchange Commission, which is
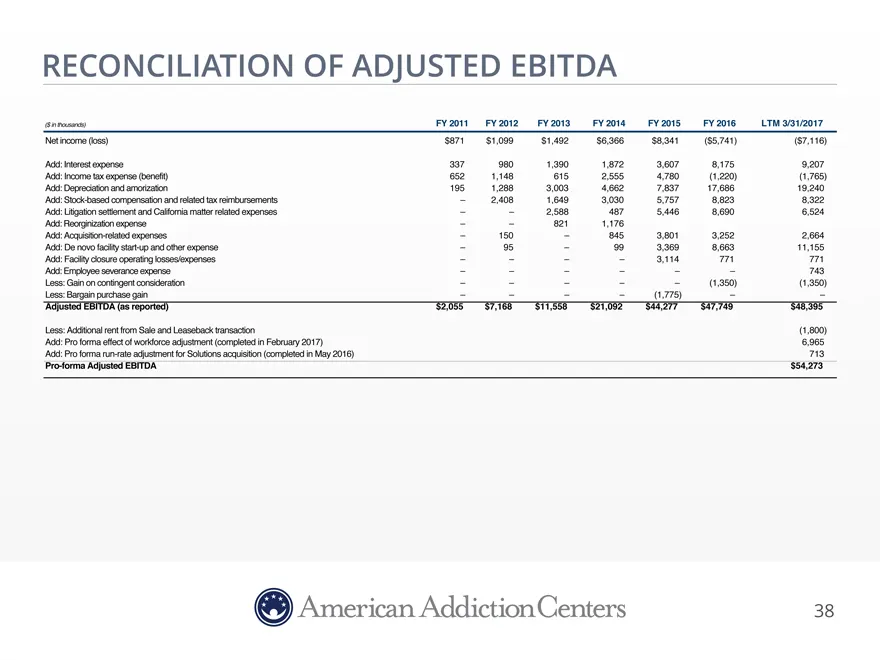
Slide 38: Reconciliation of Adjusted EBITDA
RECONCILIATION OF ADJUSTED EBITDA ($ in thousands) FY 2011 FY 2012FY 2013FY 2014FY 2015FY 2016LTM 3/31/2017 Net income (loss) $871 $1,099$1,492$6,366$8,341($5,741)($7,116) Add: Interest expense 337 9801,3901,8723,6078,1759,207 Add: Income tax expense (benefit) 652 1,1486152,5554,780(1,220)(1,765) Ad
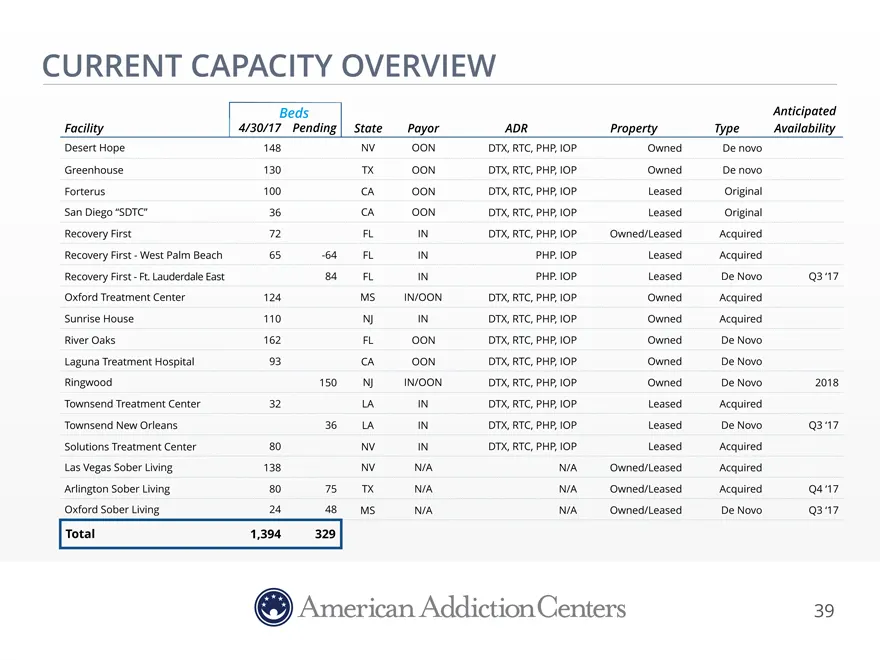
Slide 39: Current Capacity Overview
CURRENT CAPACITY OVERVIEW Beds Anticipated Facility 4/30/17 PendingStatePayorADRPropertyTypeAvailability Desert Hope 148 NVOONDTX, RTC, PHP, IOPOwnedDe novo Greenhouse 130 TXOONDTX, RTC, PHP, IOPOwnedDe novo Forterus 100 CAOONDTX, RTC, PHP, IOPLeasedOriginal San Diego “SDTC” 36 CAOONDTX, RTC, PHP, I
Source: SEC EDGAR · 8-K filed May 22, 2017