SI Financial — Investor Presentation (July 2014)
8 slides from SI Financial's investor presentation, Jul 29, 2014
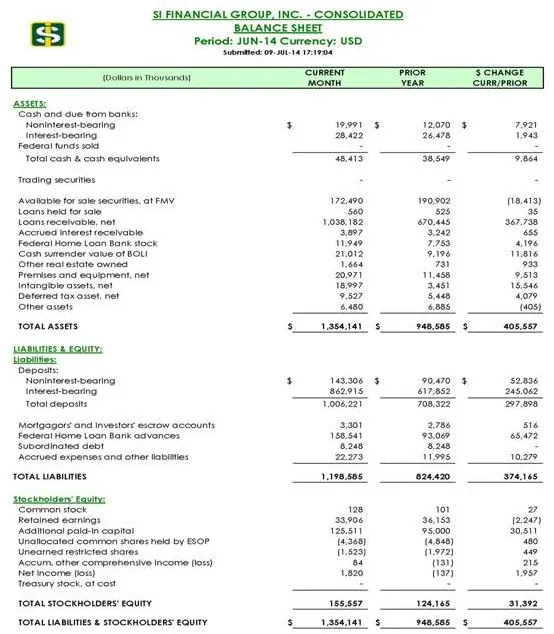
Slide 1: Consolidated Balance Sheet
SLFINANCIAL GROUP, INC. - CONSOLIDATED BALANCE SHEET <5] ae Damn Te aan rg SSe Noninterest beating ’ ws 12070 § 79a Interest bearing Eve 264078 tat Total casn & cosh equivalents a a a Trading securities 7 . i ‘Avatobie fo sale secuties at FMV 172490 1903902 sais) {Sans nei tr sole ‘00 225 38 Acctued
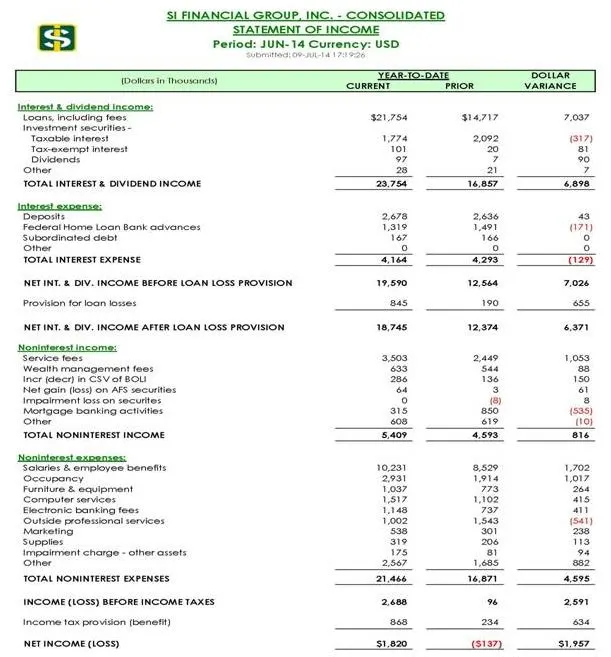
Slide 2: Consolidated Statement of Income
IAL GROUP, INC, - C¢ u ‘STATEMENT OF INCOME &3 ogni ia corer USD {Bokaro Mowsonds come mon VARIANCE tore hetero 21754 sar 7097 Taxcbie hierest ara 2092 Taxcoserpt interest ‘or 0 Dividends or > omer bo FA TOTALINTEREST & DIVIDEND INCOME ae ywae7 dntecestexnense: Deporte 2678 296 “2 Foderatiome Loan B
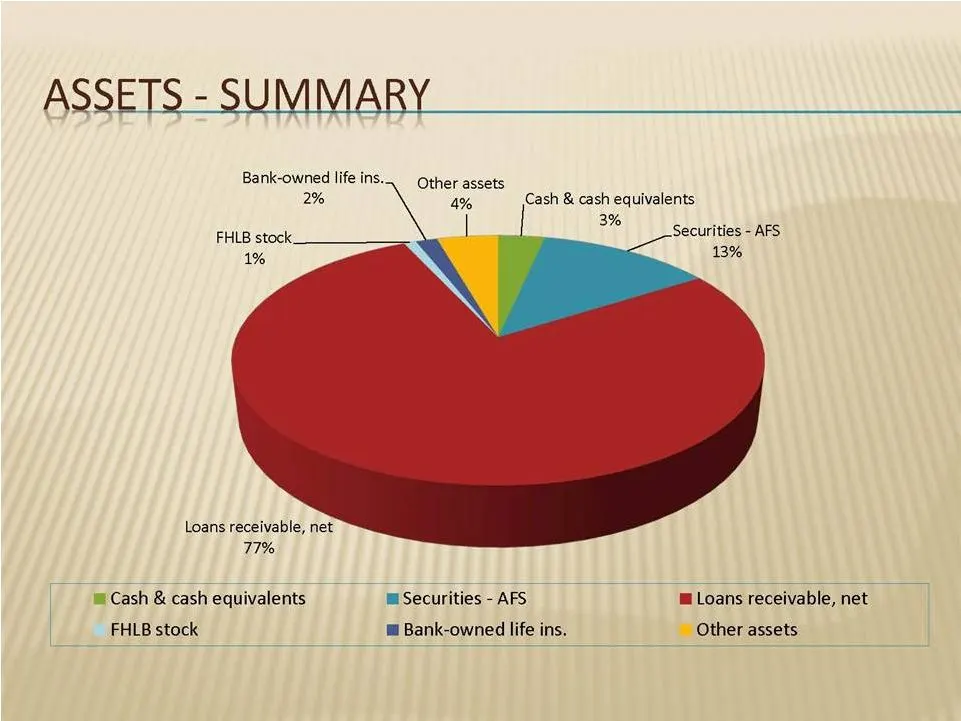
Slide 3: Assets - Summary
ASSETS - SUMMARY Bank-owned life ins... Other assets 2% 4% Cash & cash equivalents FHLB stock. ee Securities - AFS 1% 13% Loans receivable, net 77% ™ Cash & cash equivalents Securities - AFS ‘mLoans receivable, net FHLB stock i Bank-owned life ins. _ Other assets
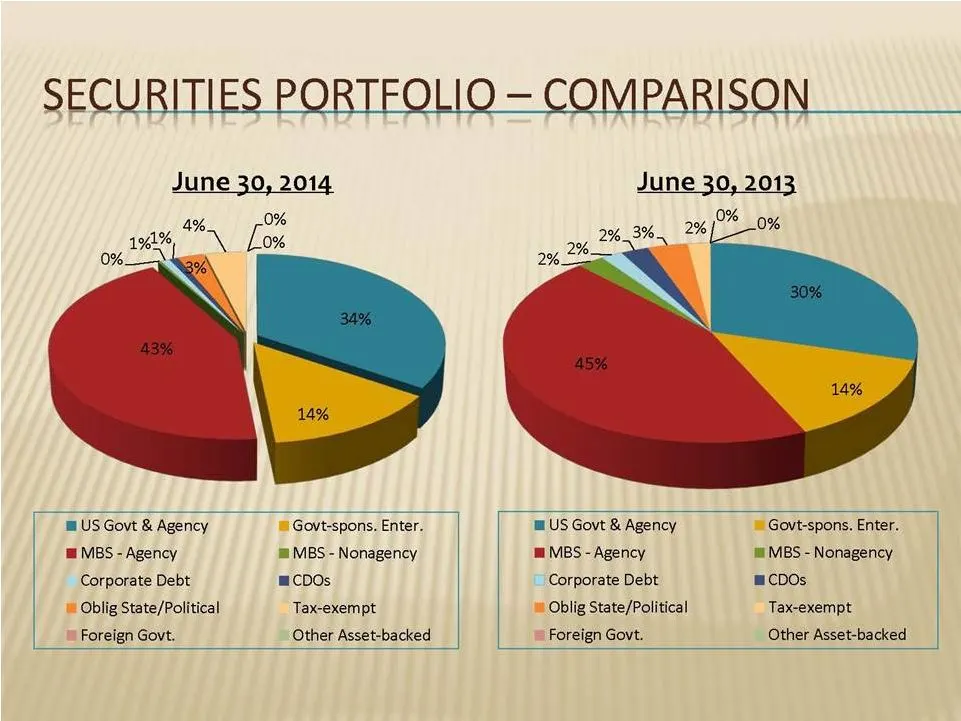
Slide 4: Securities Portfolio - Comparison
SECURITIES PORTFOLIO - COMPARISON June ii Ane June 30, 2013, 0% 0% 2% US Govt & Agency © Govt-spons. Enter. US Govt & Agency © Govt-spons. Enter. 1 MBS - Agency MBS - Nonagency MBS - Agency l= MBS - Nonagency Corporate Debt CDOs Corporate Debt mCDOs © Oblig State/Political Tax-exempt © Oblig State/P
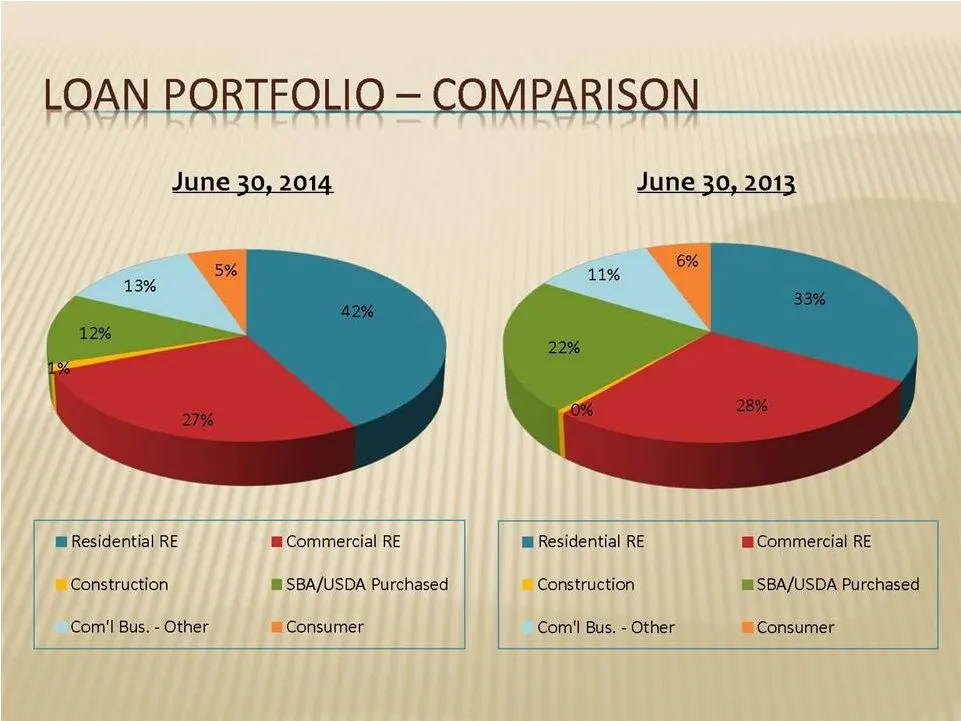
Slide 5: Loan Portfolio - Comparison
LOAN PORTFOLIO—- COMPARISON June 30, 2014 June 30, 2013, B Residential RE m Commercial RE lm Residential RE m Commercial RE © Construction ™SBA/USDA Purchased © Construction ™SBA/USDA Purchased Com'l Bus. - Other = Consumer Com'l Bus. - Other = Consumer
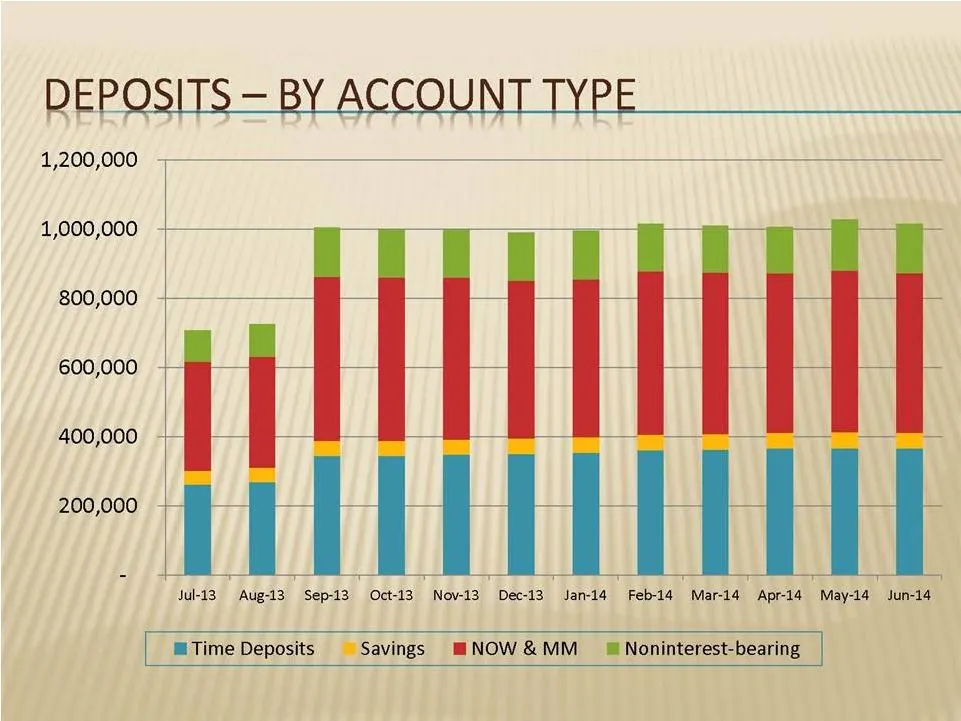
Slide 6: Deposits - By Account Type
DEPOSITS — BY ACCOUNT TYPE 1,200,000 1,000,000 800,000 600,000 400,000 200,000 {HH Jul-13 Aug-13. Sep-13 Oct-13 Nov-13 Dec-13 Jan-14. Feb-14 Mar-14 Apr-14 May-14 Jun-14 @ Time Deposits ~~ Savings =HNOW&MM _ Noninterest-bearing
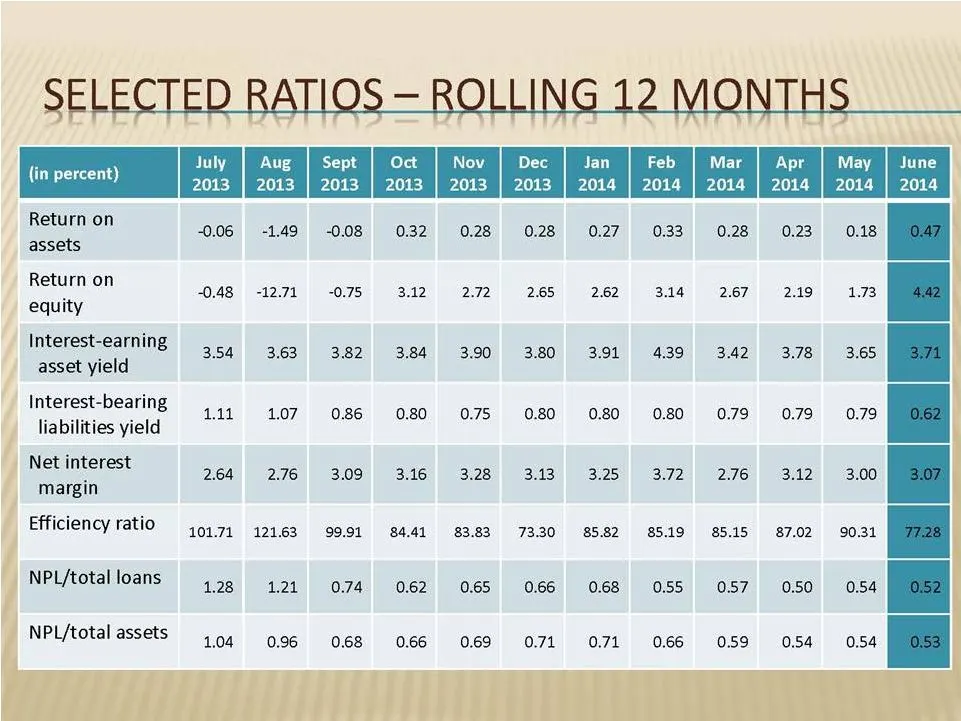
Slide 7: Monthly Performance Ratios
Return on assets Return on equity Interest-earning asset yield Se Interest-bearing liabilities yield Net interest margin Efficiency ratio NPL/total loans NPL/total assets 149 -0.08 0.48 1271 0.75 3.12 3.54 3.63 3.82 3.84 wait 1.07 0.86 0.80 2.64 2.76 3.09 3.16 101.71 12163 99.91 84.41 1.28 at 0.74 0
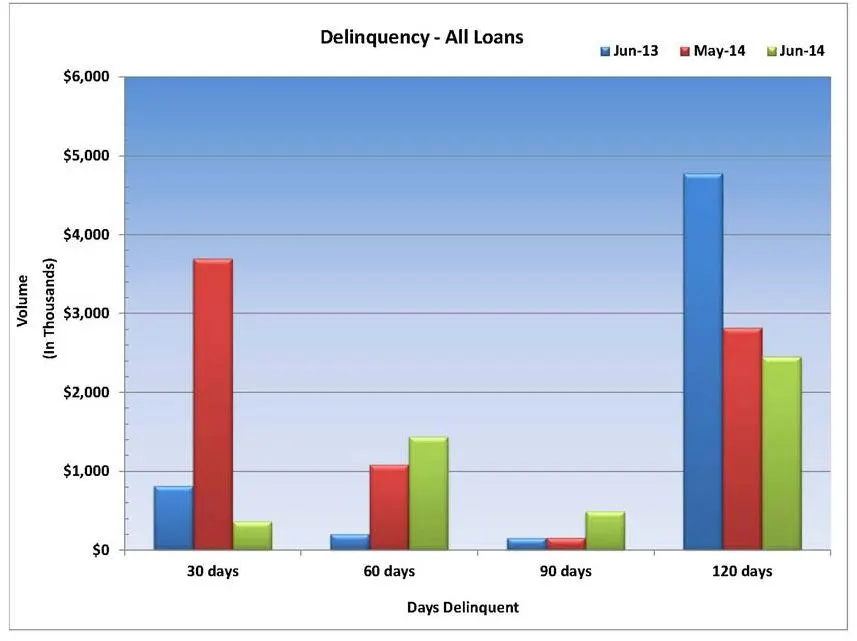
Slide 8: Delinquency - All Loans
$6,000 $5,000 $4,000 Volume $3,000 (In Thousands) $2,000 $1,000 $0 ie 30 days Delinquency - All Loans 60 days Days Delinquent 90 days wJun-13 wMay-14 wJun-14 120 days
Source: SEC EDGAR · 8-K filed Jul 29, 2014
More decks from SI Financial Group Inc
 Merger or Acquisition (December 2018)13 slides · Dec 11, 2018
 Investor Presentation (September 2018)18 slides · Sep 20, 2018
 Shareholder Meeting (May 2018)19 slides · May 9, 2018
 Investor Presentation (May 2017)18 slides · May 10, 2017
 Investor Presentation (May 2016)19 slides · May 11, 2016
 Shareholder Meeting (May 2015)19 slides · May 13, 2015