Florida East Coast Industries Inc
Florida East Coast Industries — Merrill Lynch Global Transportation Conference (June 2005)
12 slides from Florida East Coast Industries's conference presentation, Jun 8, 2005
Slide 1: Unlocking Value - Merrill Lynch Global Transportation Conference Investor Presentation
Exhibit 99 Ready To “Unlocking Merrill Lynch GotheGlobal Value”Transportation Conference Investor Presentation June 8, 2005
Slide 2: Forward-looking statements
Florida This amended. “expect,” such looking (particularly factors to 2 update presentation statements isEast statements. included the “aim,” These Coast in information the are forward-looking “believe,” contains in Industries state necessarily Important theof Company’s contained forward-looking Flo
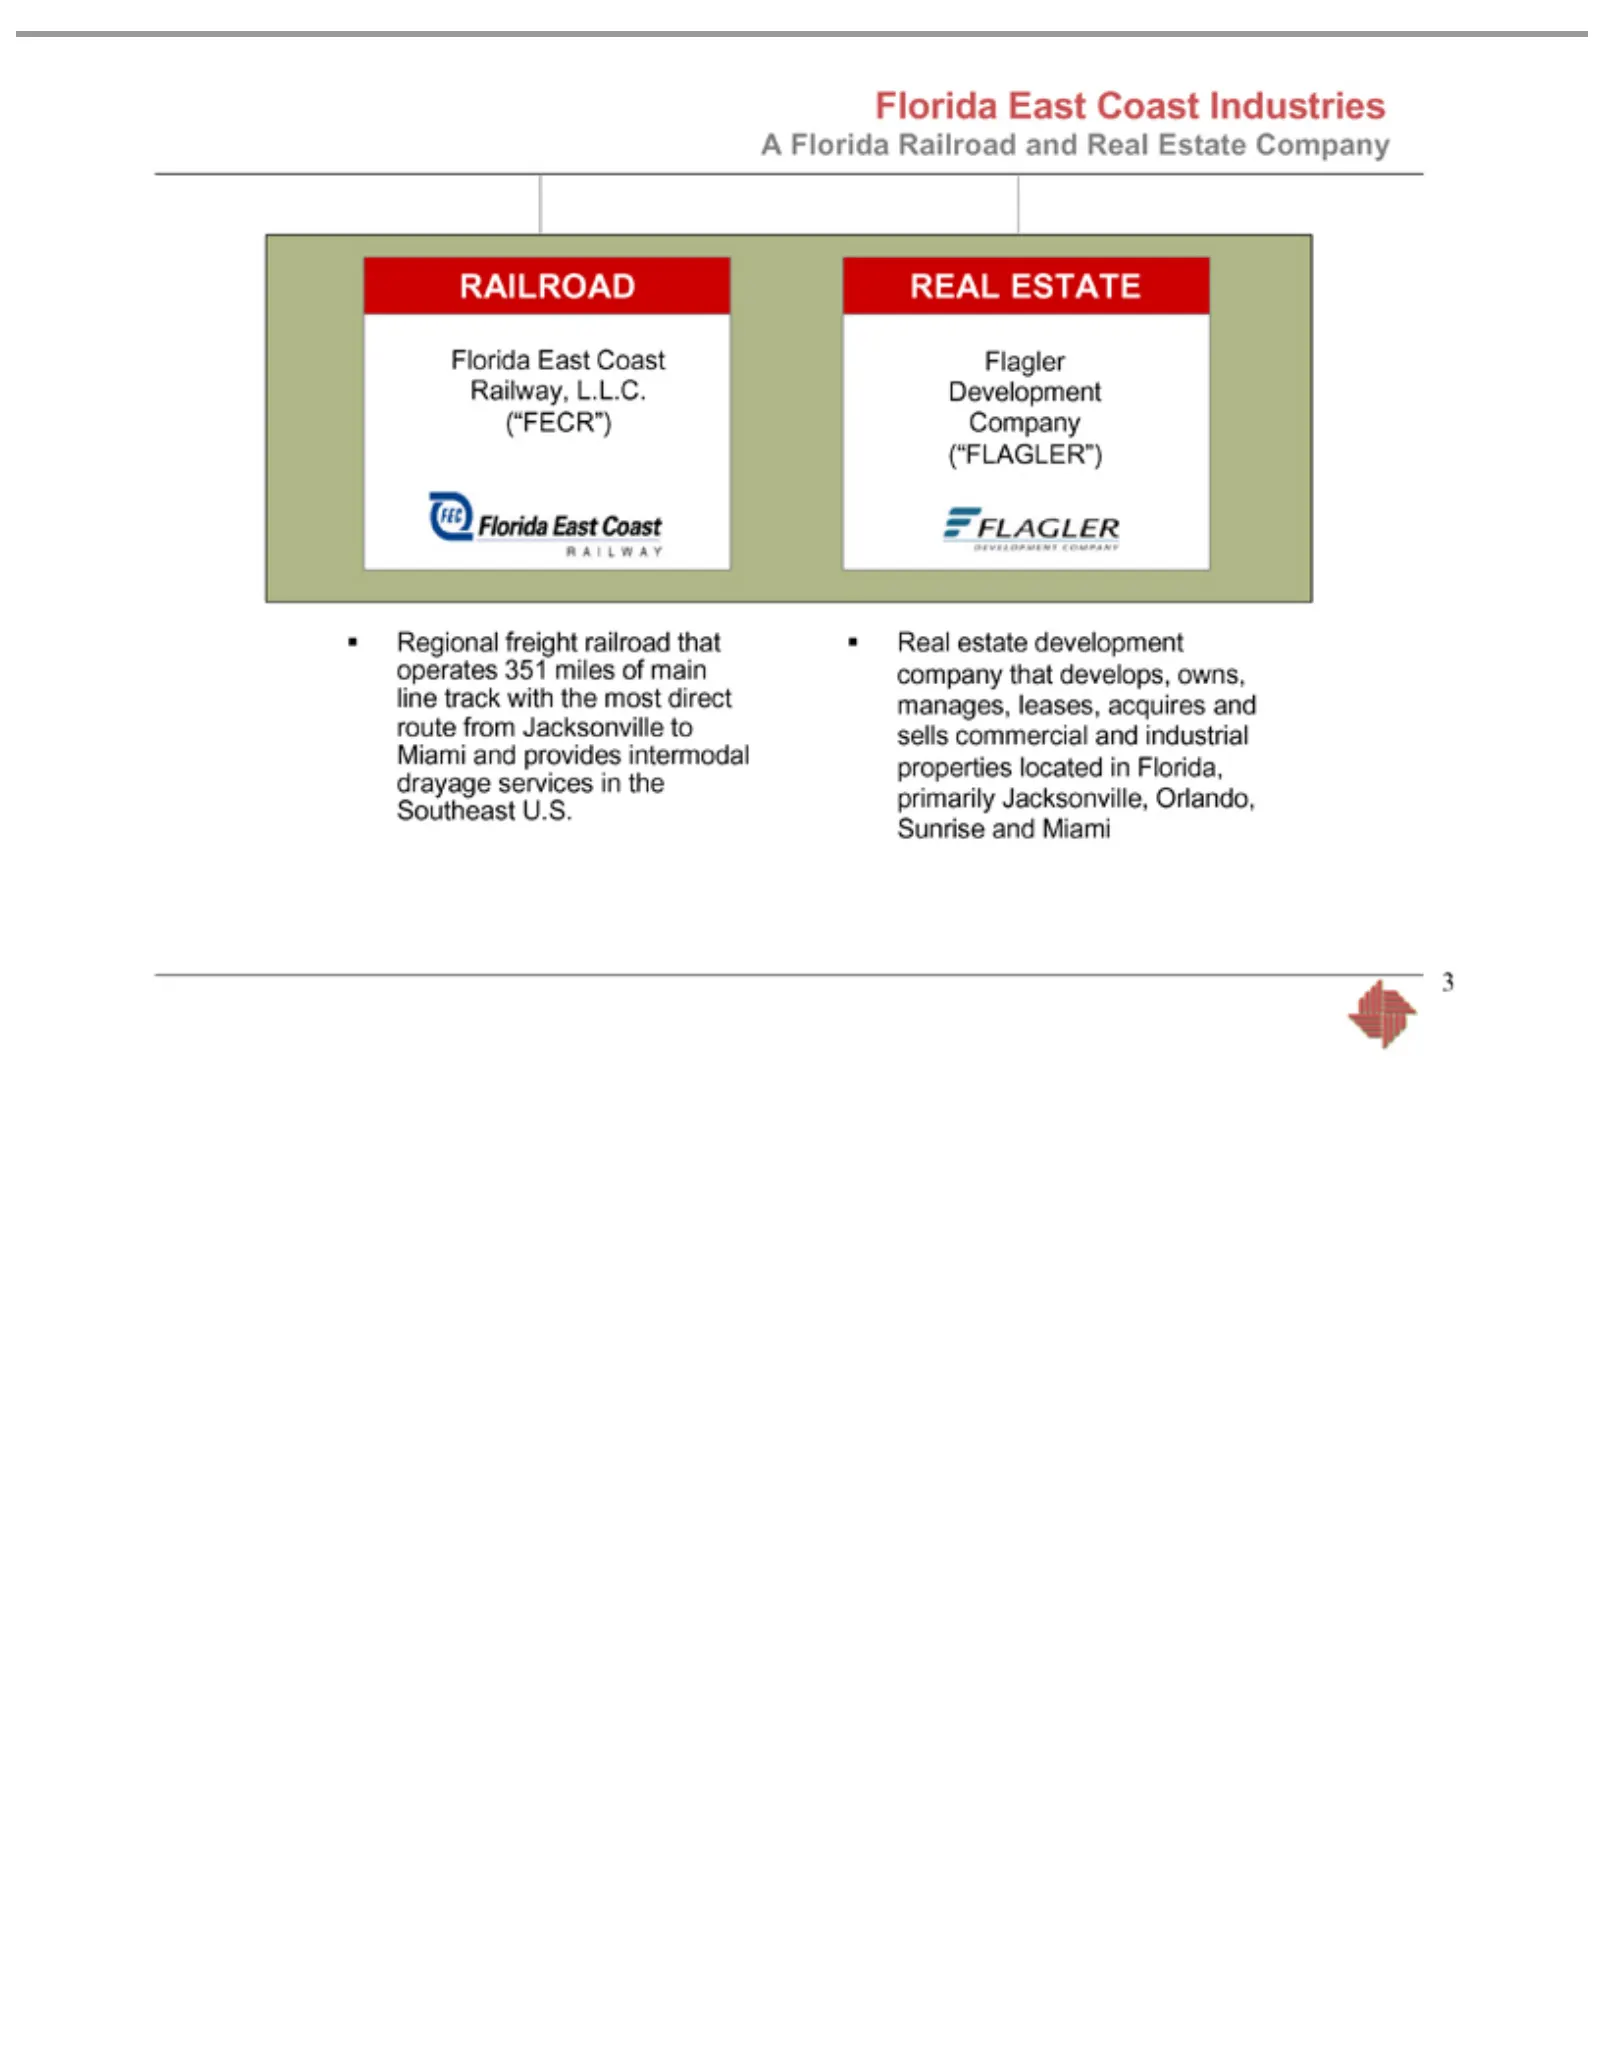
Slide 3: A Florida Railroad and Real Estate Development Company
A Florida Florida RAILROAD Regional (“FECR”) REAL Flagler Real 3 estate ESTATE Development East freight Railroad development Coast railroad Industries Railway, andCompany Real company thatL.L.C. Estate operates (“FLAGLER”) that Company 351 develops, miles of owns, mainmanages, line trackleases, with
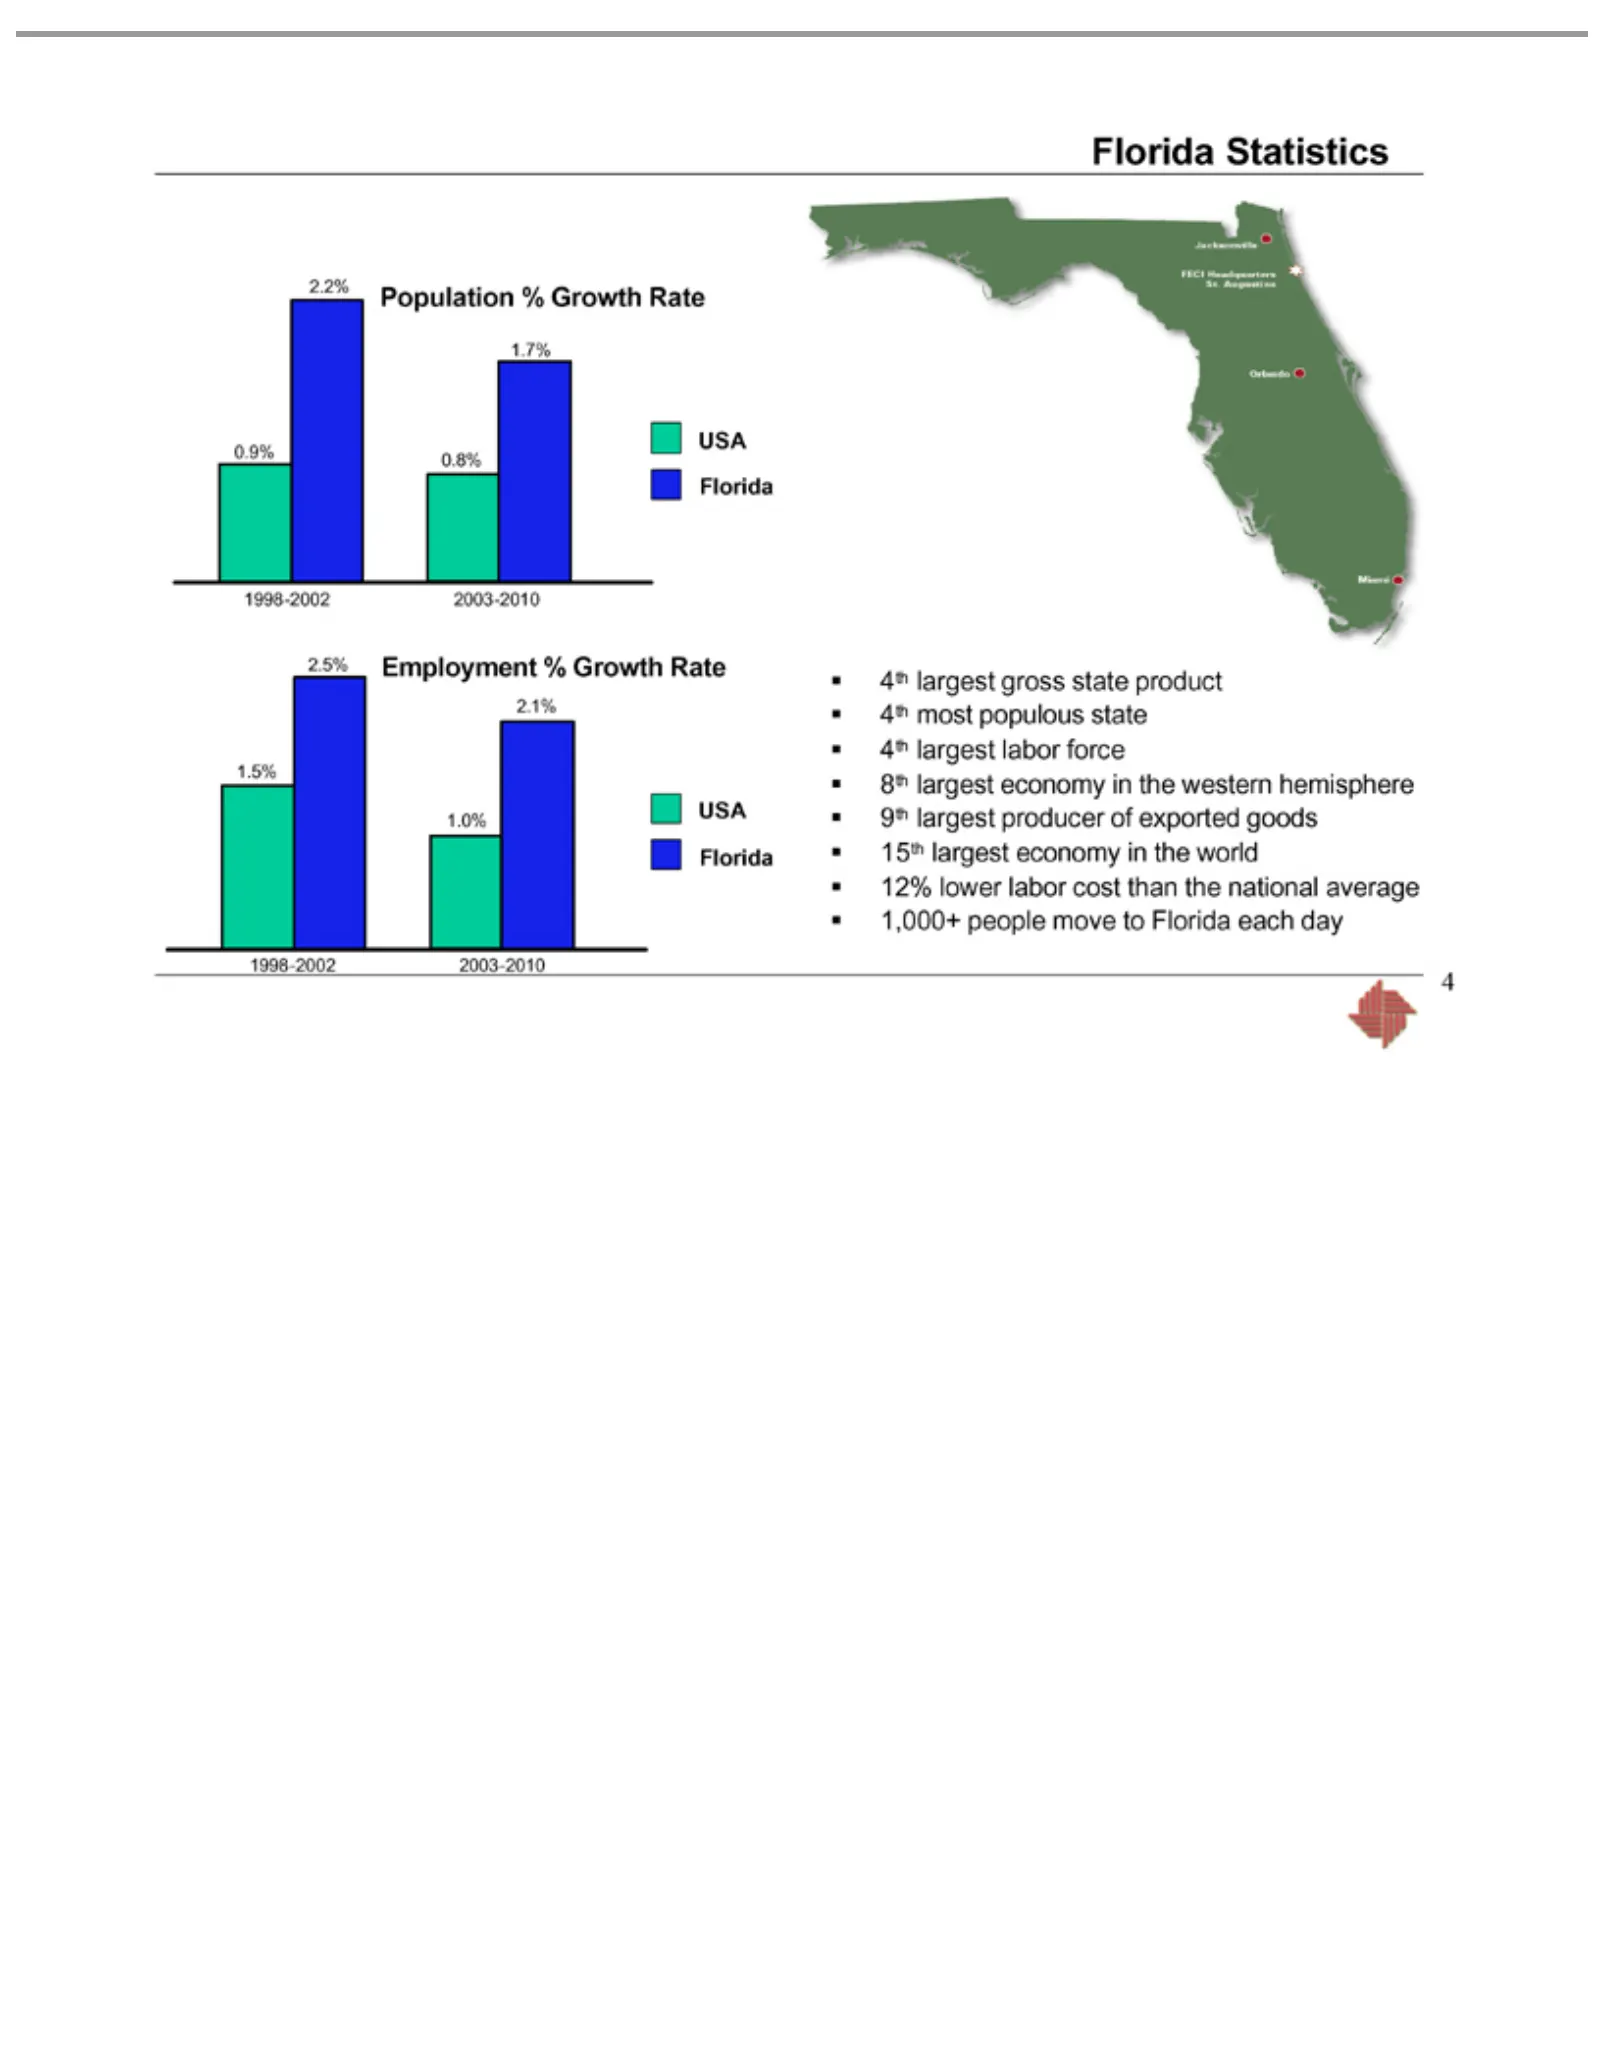
Slide 4: Florida population, employment and economy statistics
Population 0.9% 0.8% Employment 1.5% 1.0% 1998-2002 USA 2003-2010 FECI St. Orlando 4th 8th Florida 4 Augustine largest Florida 2.2% 1.7% 2.5% 2.1% Headquarters Statistics each Miami gross economy %day Jacksonville %Growth Growth stateinproduct Rate the Rate western 4th most hemisphere populous 9th s
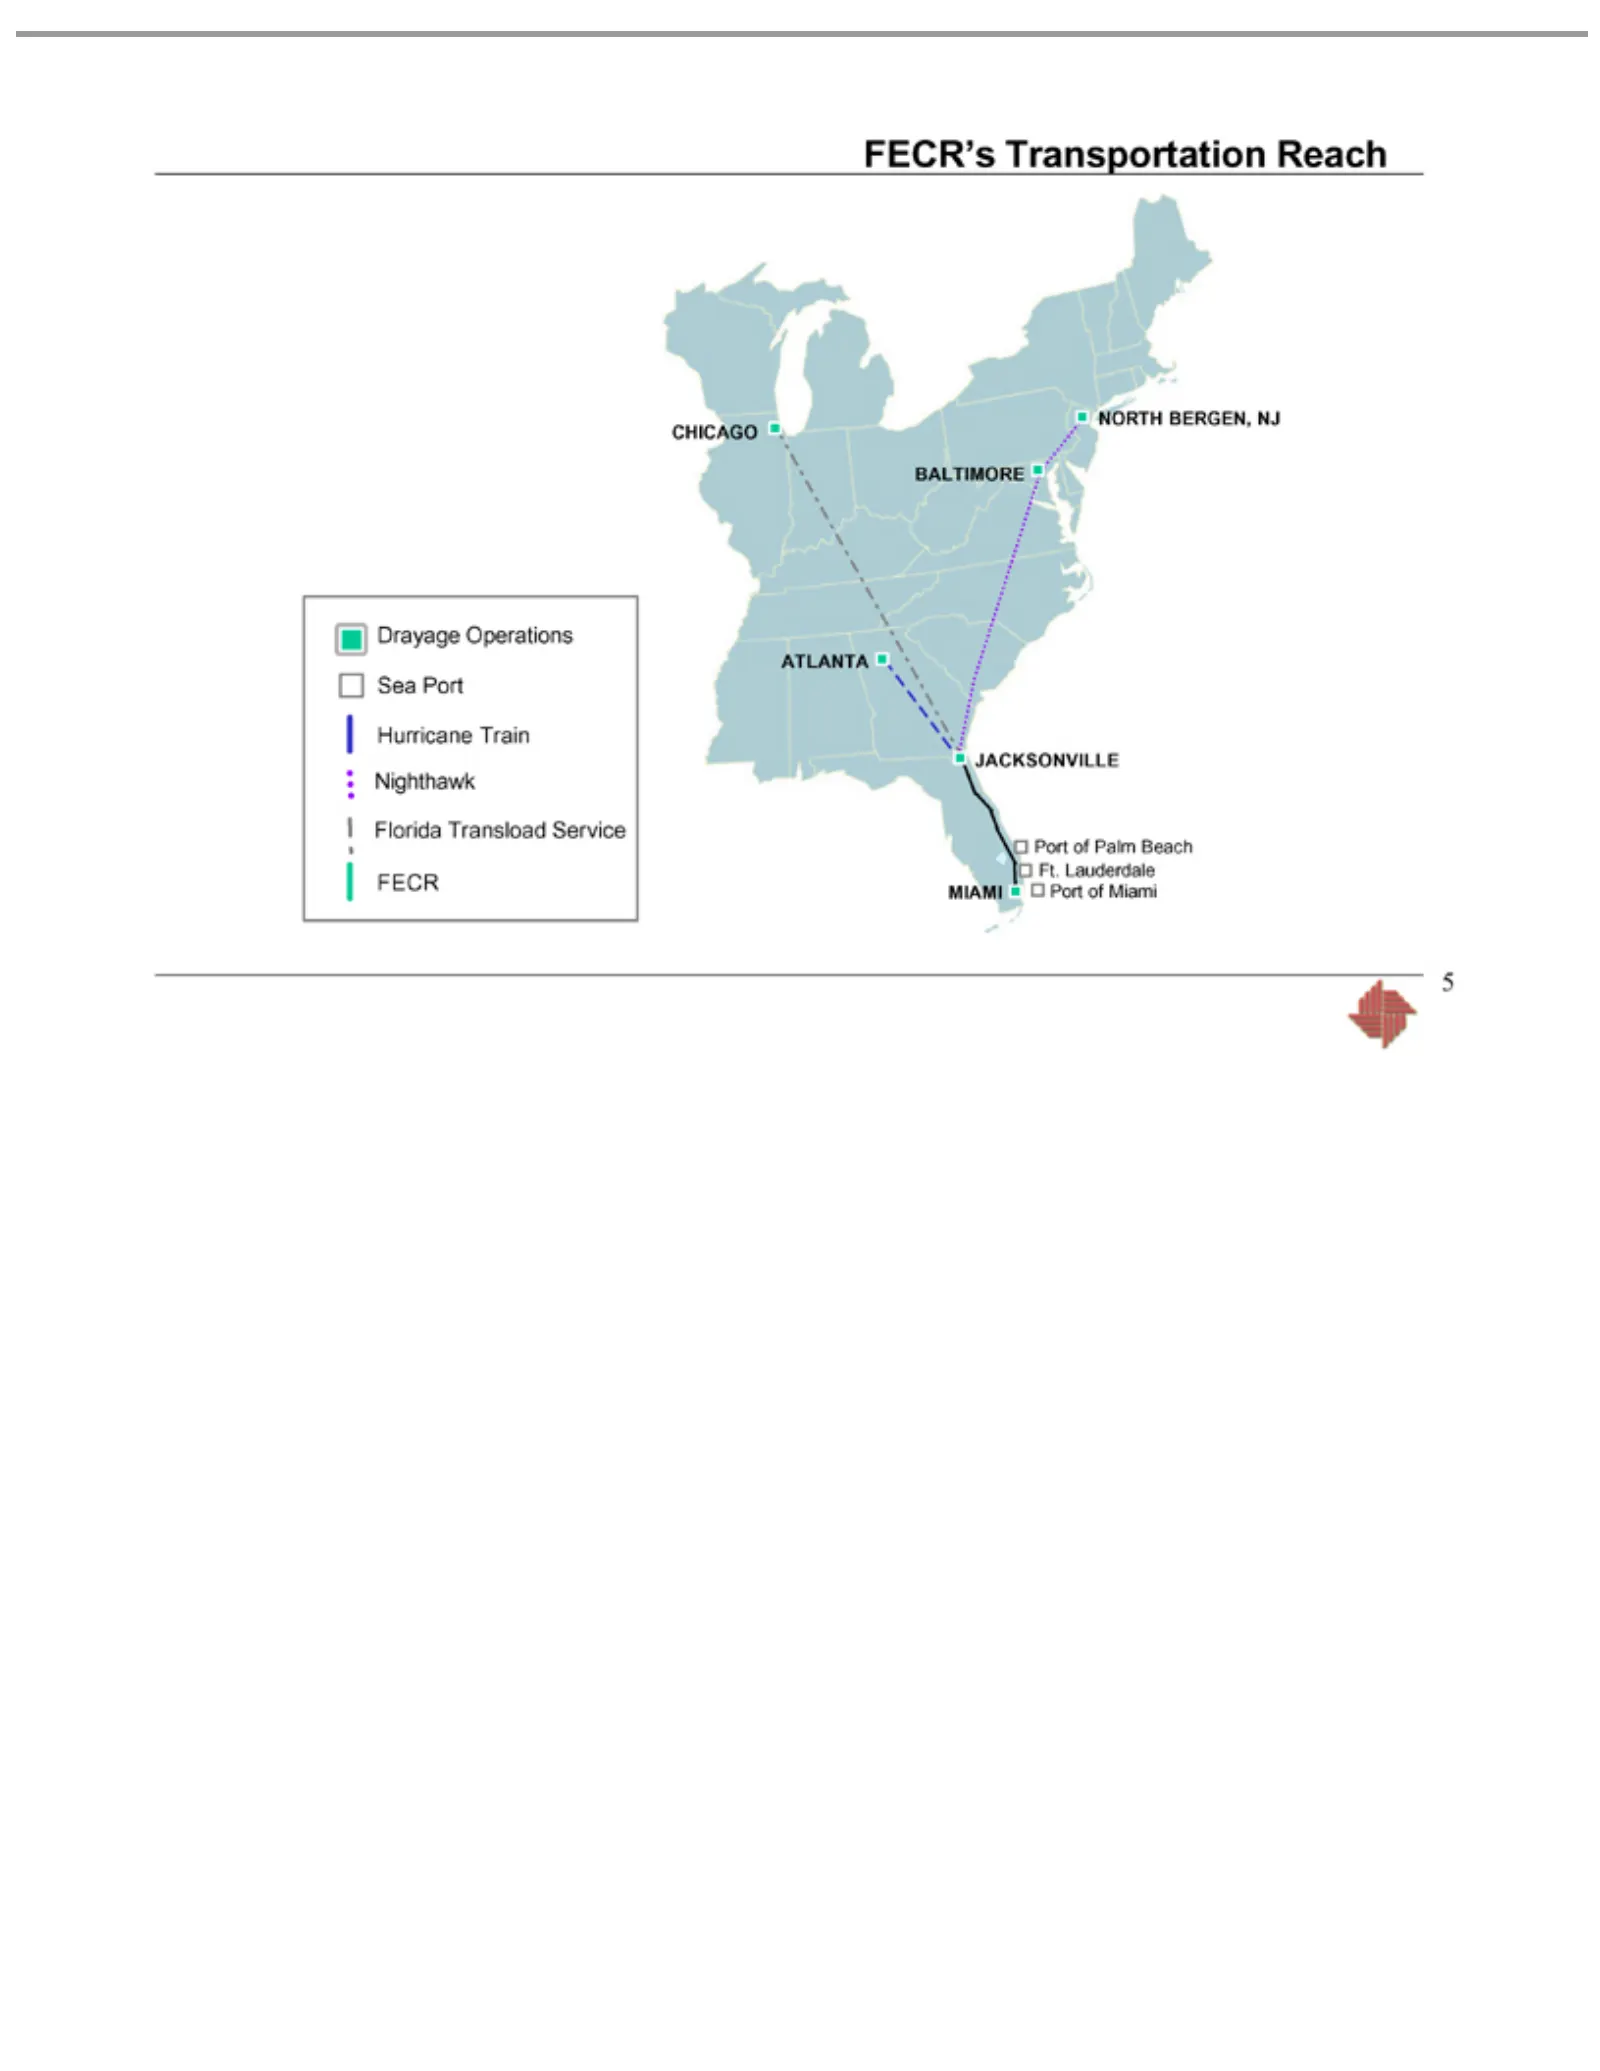
Slide 5: FECR's Drayage Operations
FECR’s Drayage NORTH BALTIMORE CHICAGO FECR MIAMI JACKSONVILLE ATLANTA Ft. Port 5 Lauderdale of Miami Palm Transportation BERGEN, Operations Beach NJSeaReach Port Hurricane Train Nighthawk Florida Transload Service
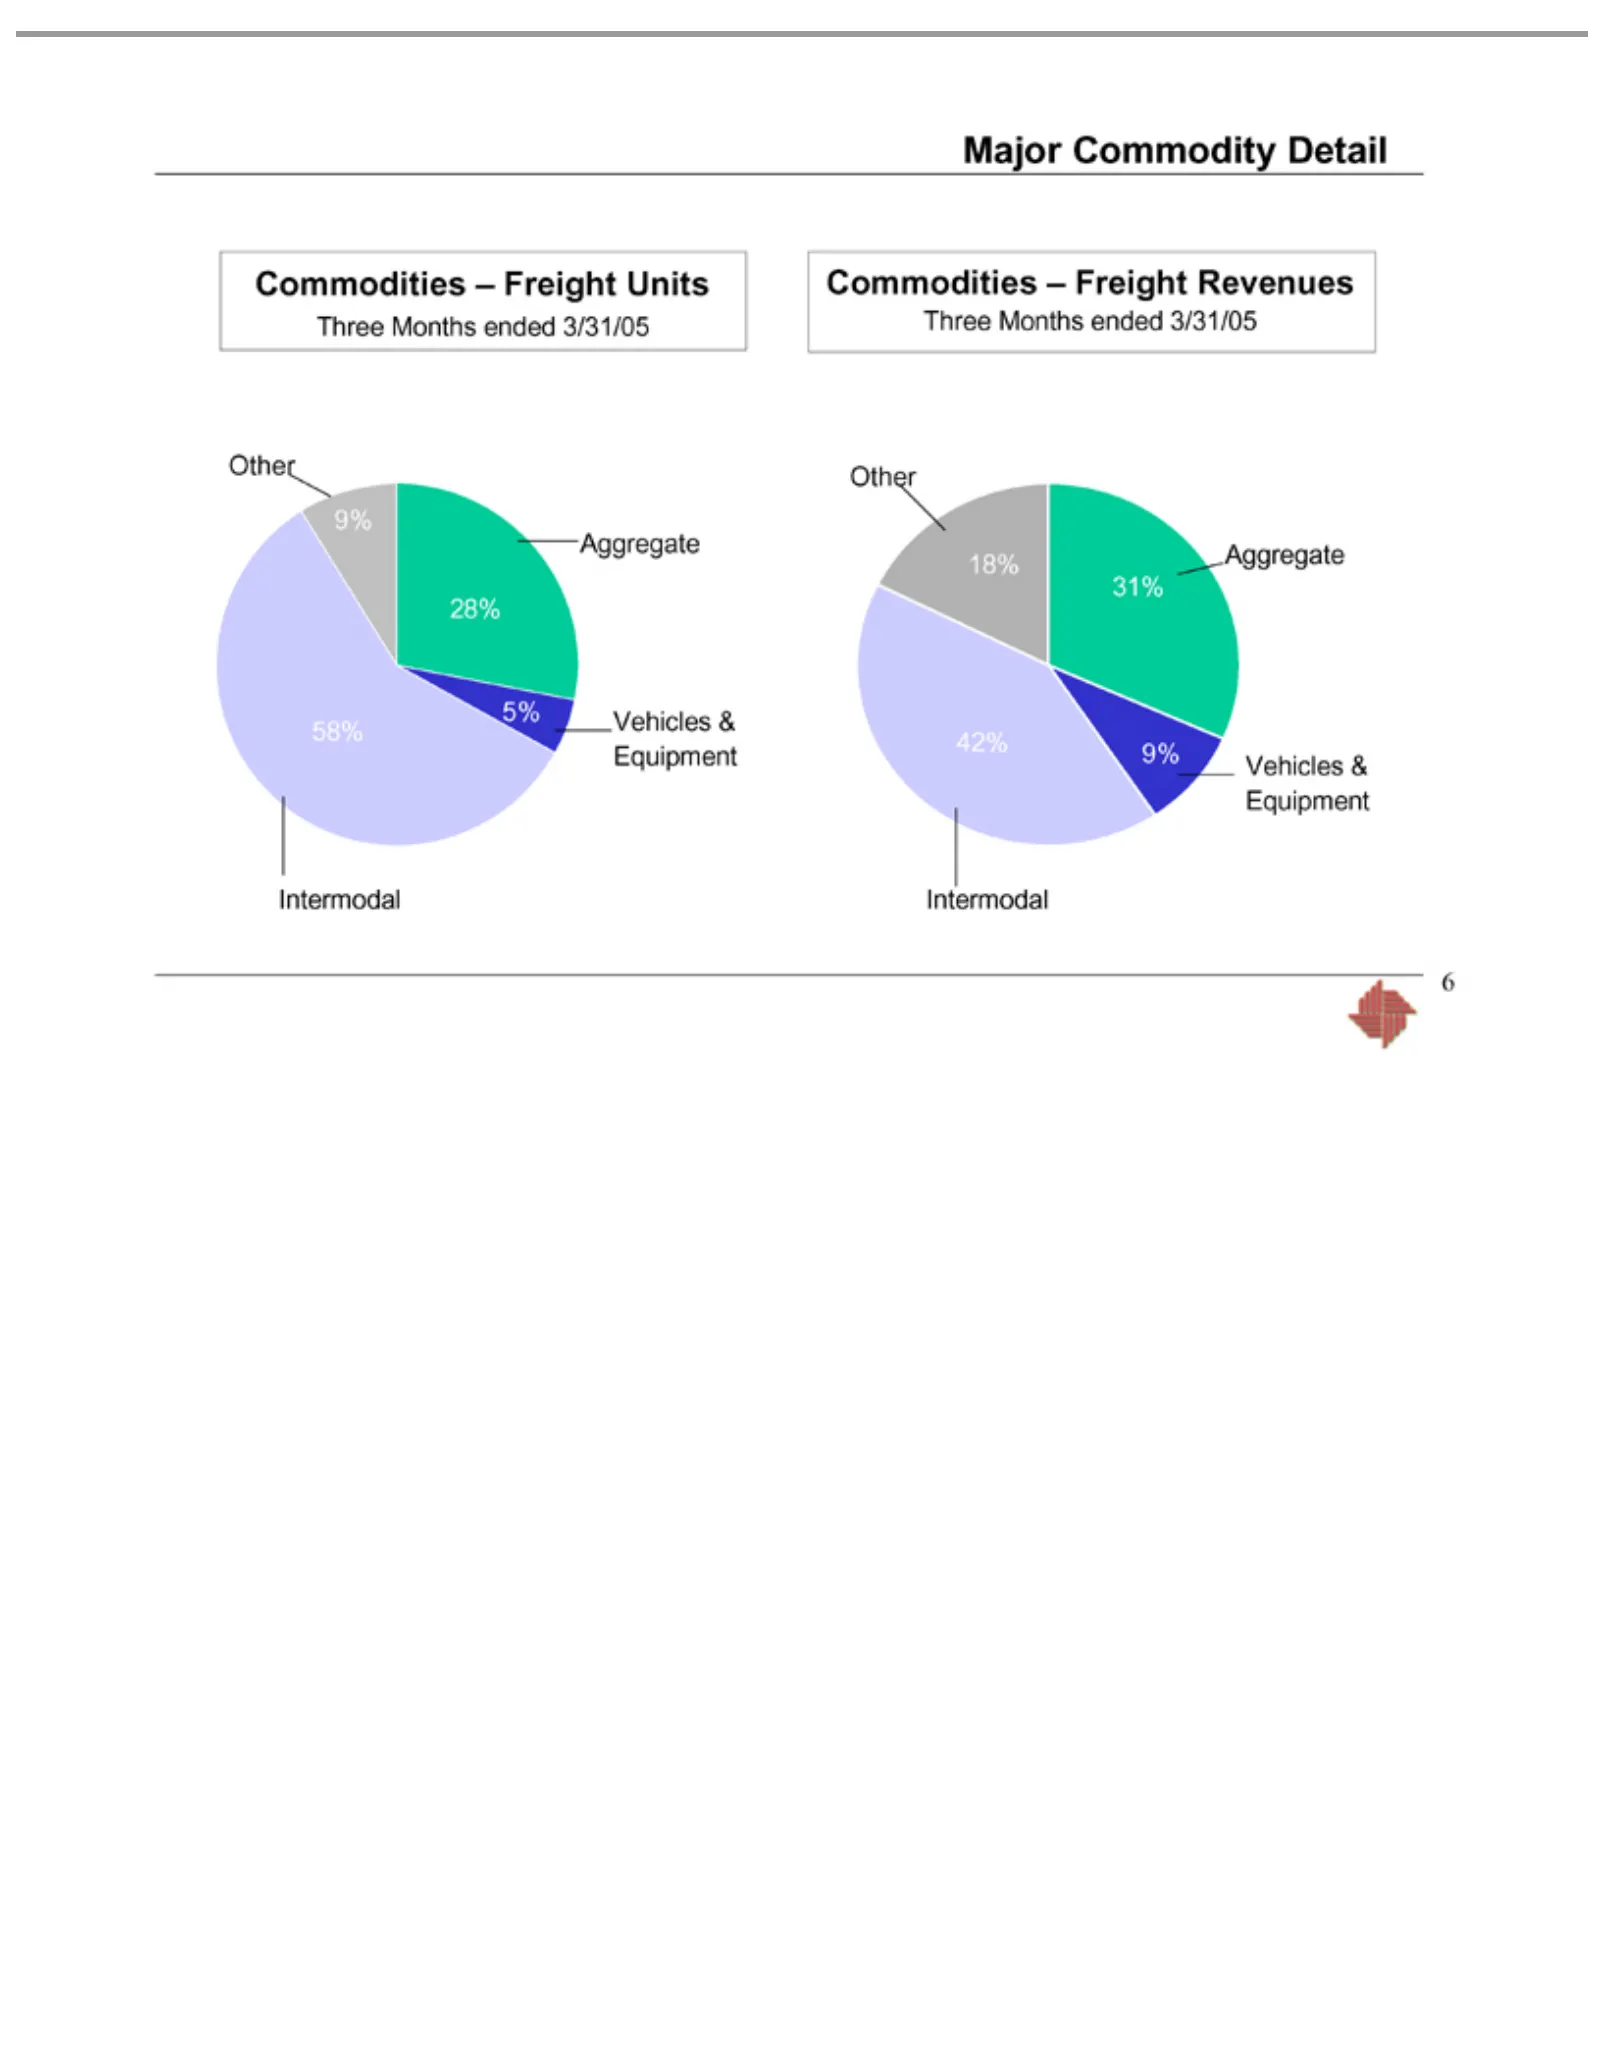
Slide 6: Major Commodities - Freight Detail
Major Months 58% Commodities 28% 5% Three Vehicles 42% Intermodal 18% Other 6 31% Aggregate 9% Commodity & Equipment –ended Freight Detail 3/31/05 Units Revenues
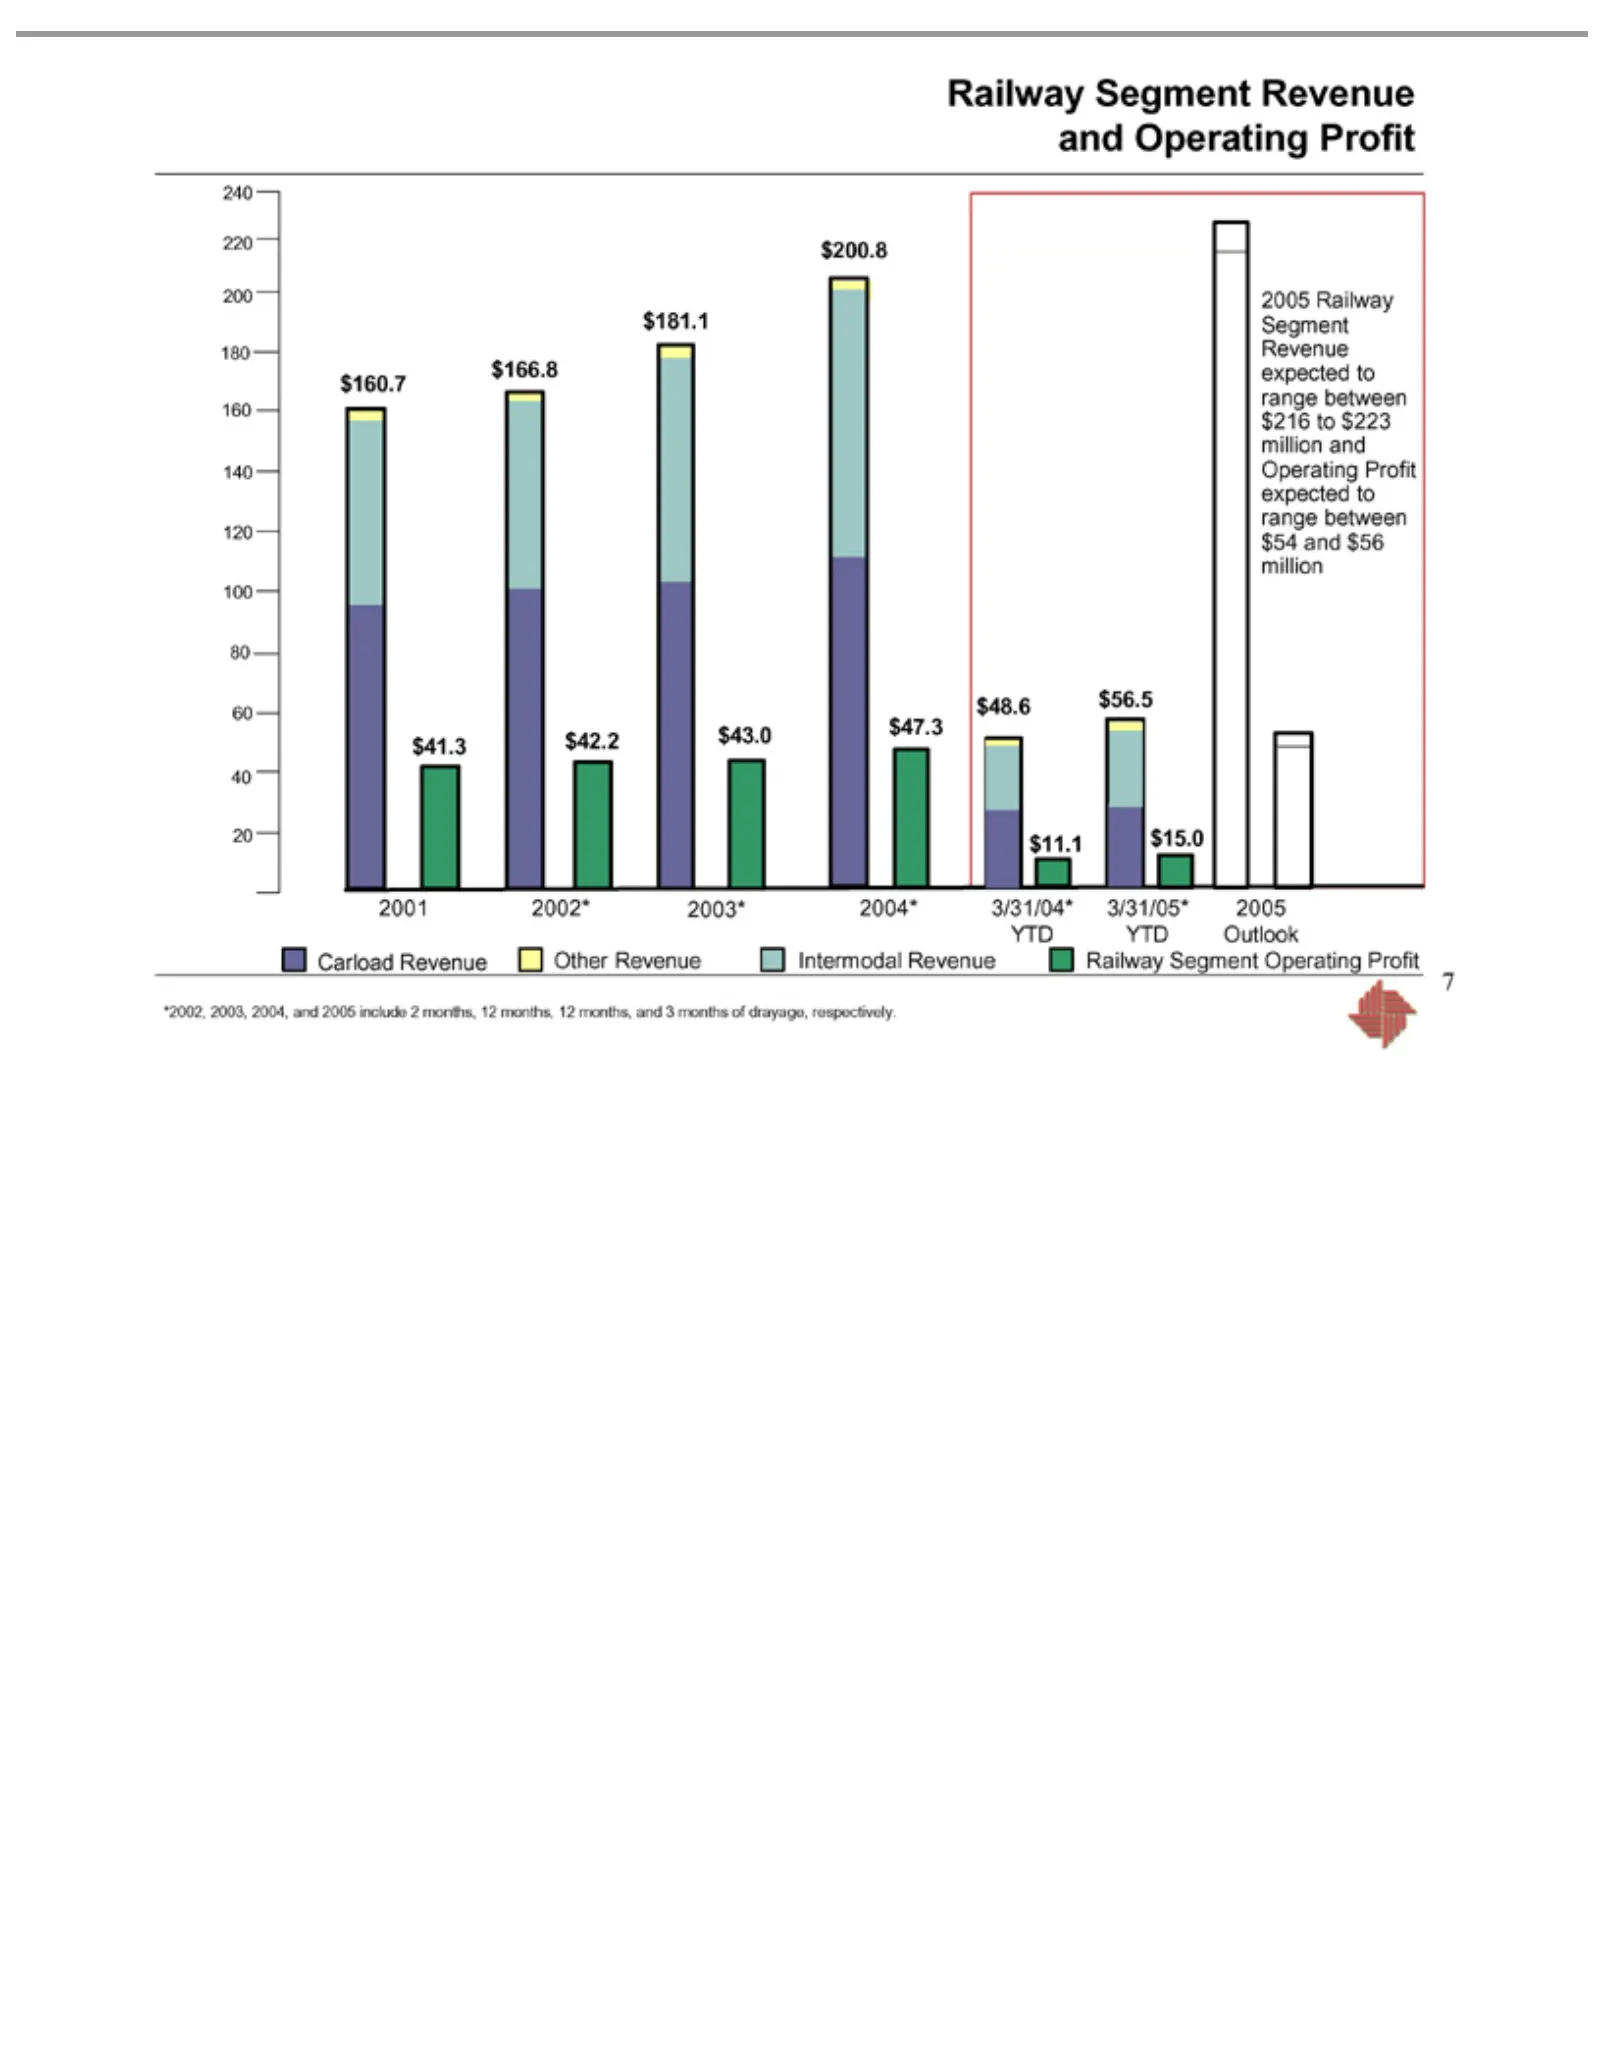
Slide 7: Railway Revenue and Operating Profit, Outlook
240 140 $160.7 $166.8 2001 $181.1 2002* $200.8 2003* $48.6 2004* 3/31/04* $56.5 3/31/05* 2005 Carload Other Intermodal Railway * 7 2002, 220 120 Railway Outlook $11.1 $15.0 Revenue $41.3 $42.2 $43.0 $47.3 2003, Revenue 200 100 Segment YTD Revenue 180 80 2004, Segment 60 160 Revenue Operating 40 and2
Slide 8: Flagler Development Company Overview
Flagler Development Company Overview 8
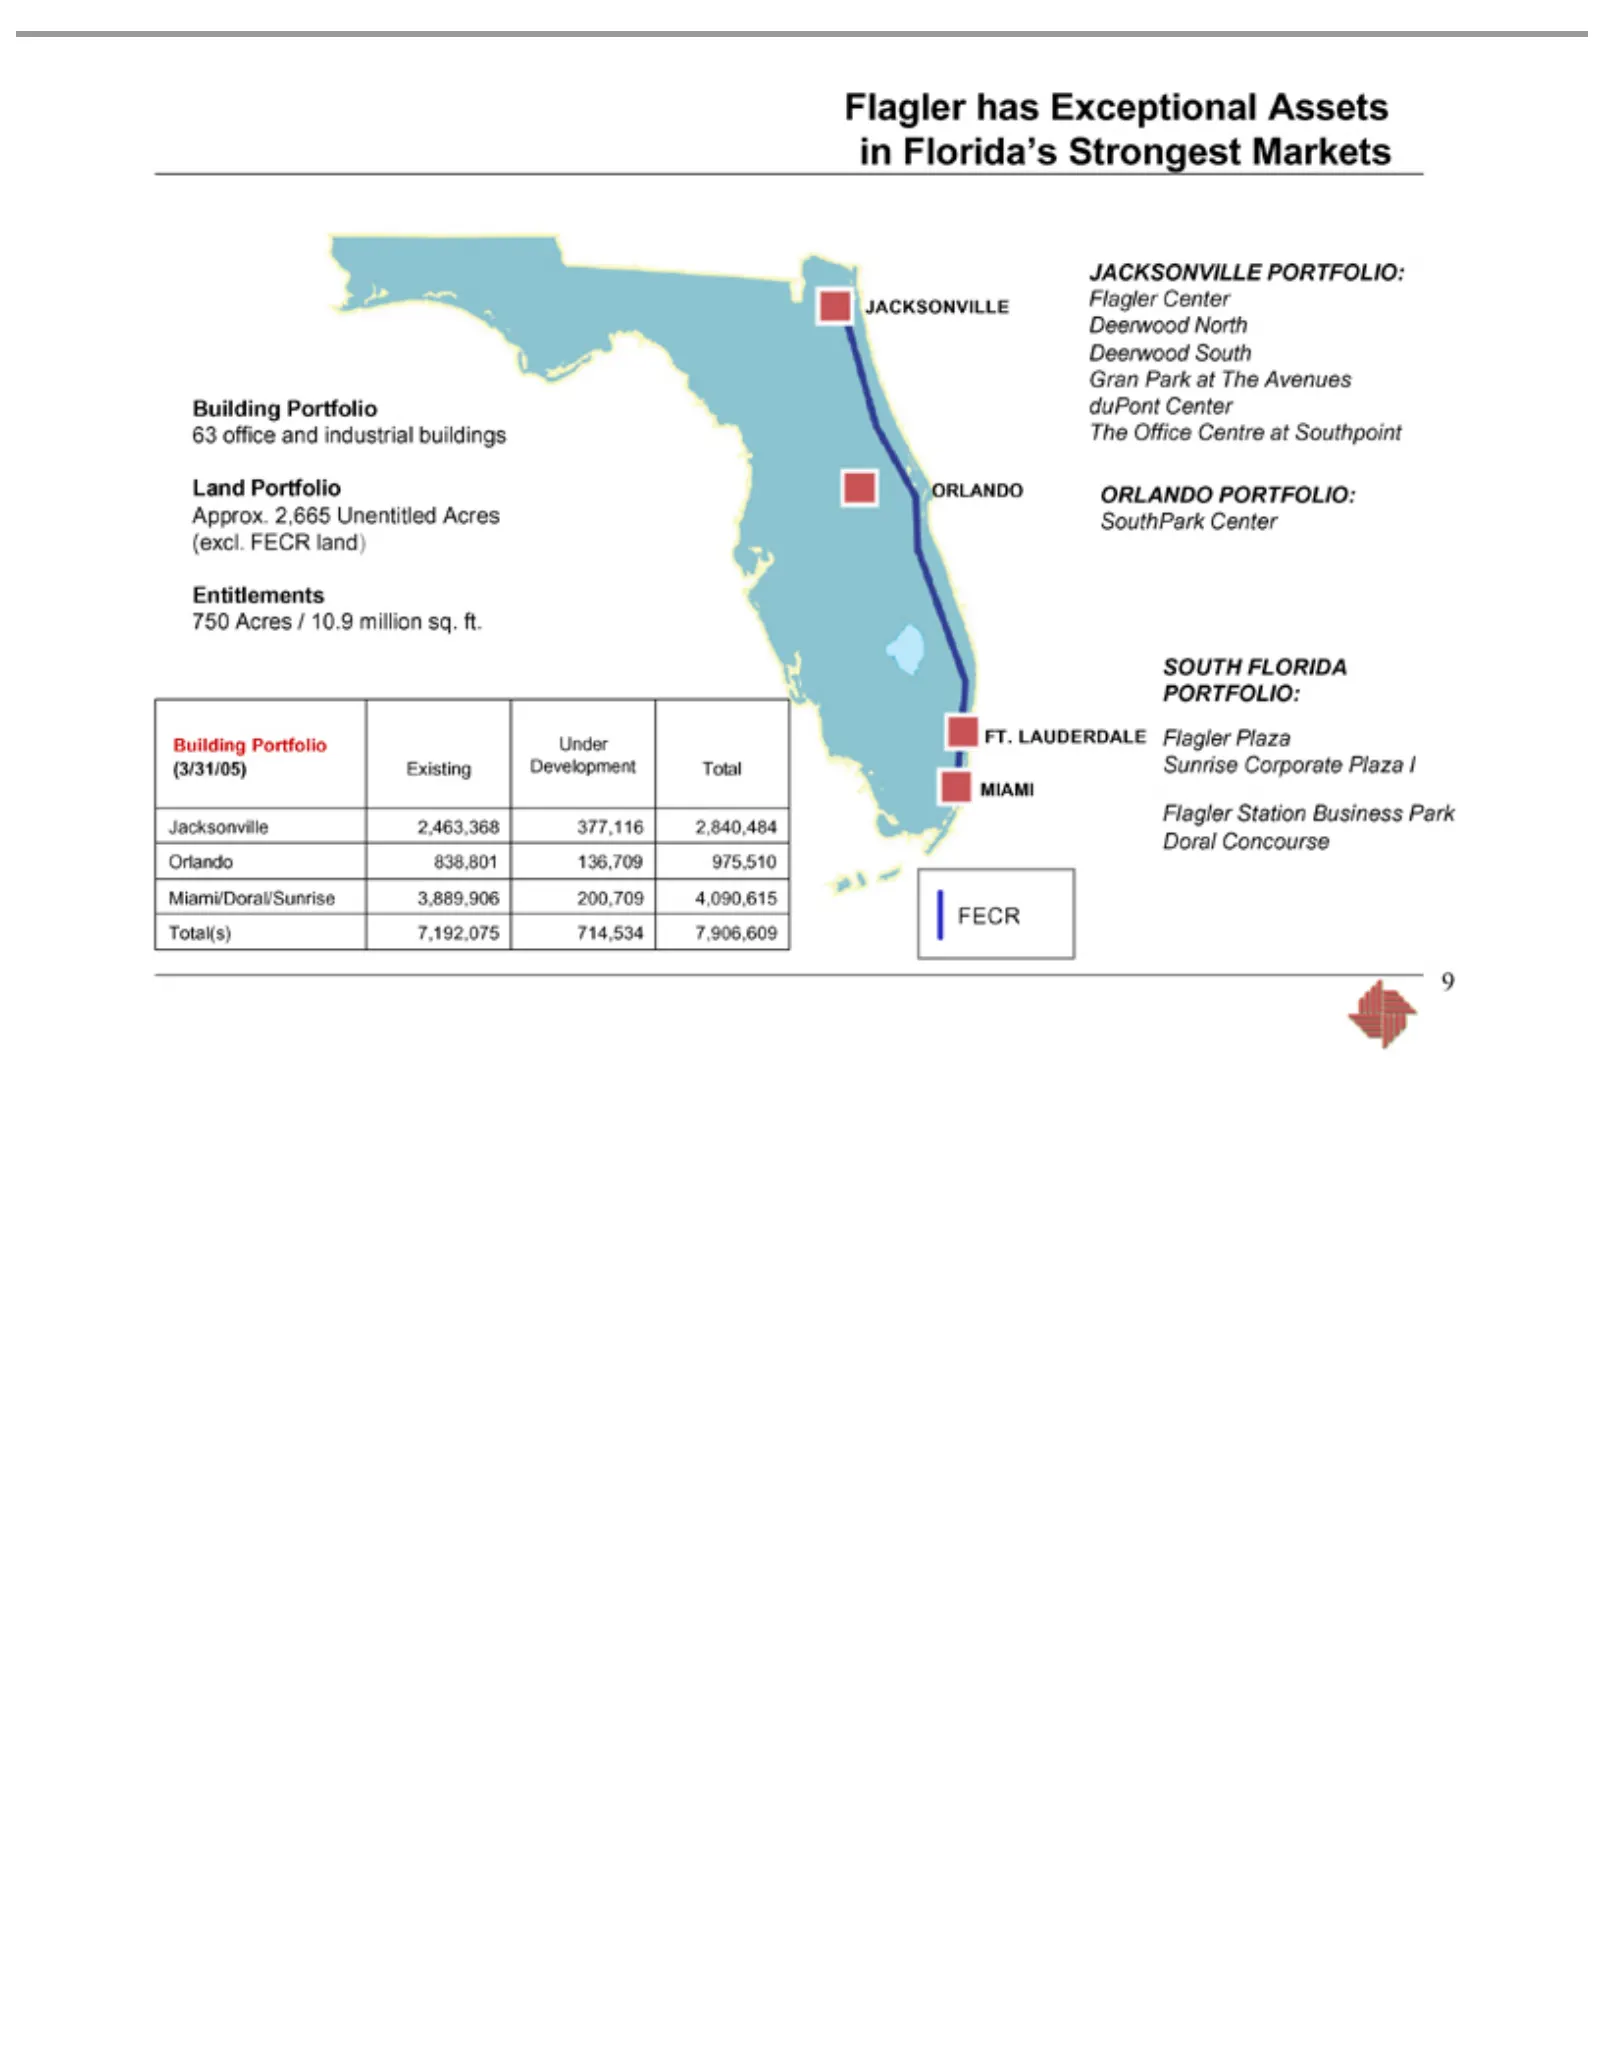
Slide 9: Flagler Portfolio in Florida's Strongest Markets
63 office Land Approx. 750 Entitlements Building (3/31/05) Development Jacksonville Orlando Miami/Doral/Sunrise Total(s) JACKSONVILLE Gran ORLANDO SouthPark SOUTH Sunrise Flagler 9 Acres Park Portfolio has Center Plaza Station Corporate 7,192,075 838,801 2,665 FLORIDA Portfolio and Existing /at Cent
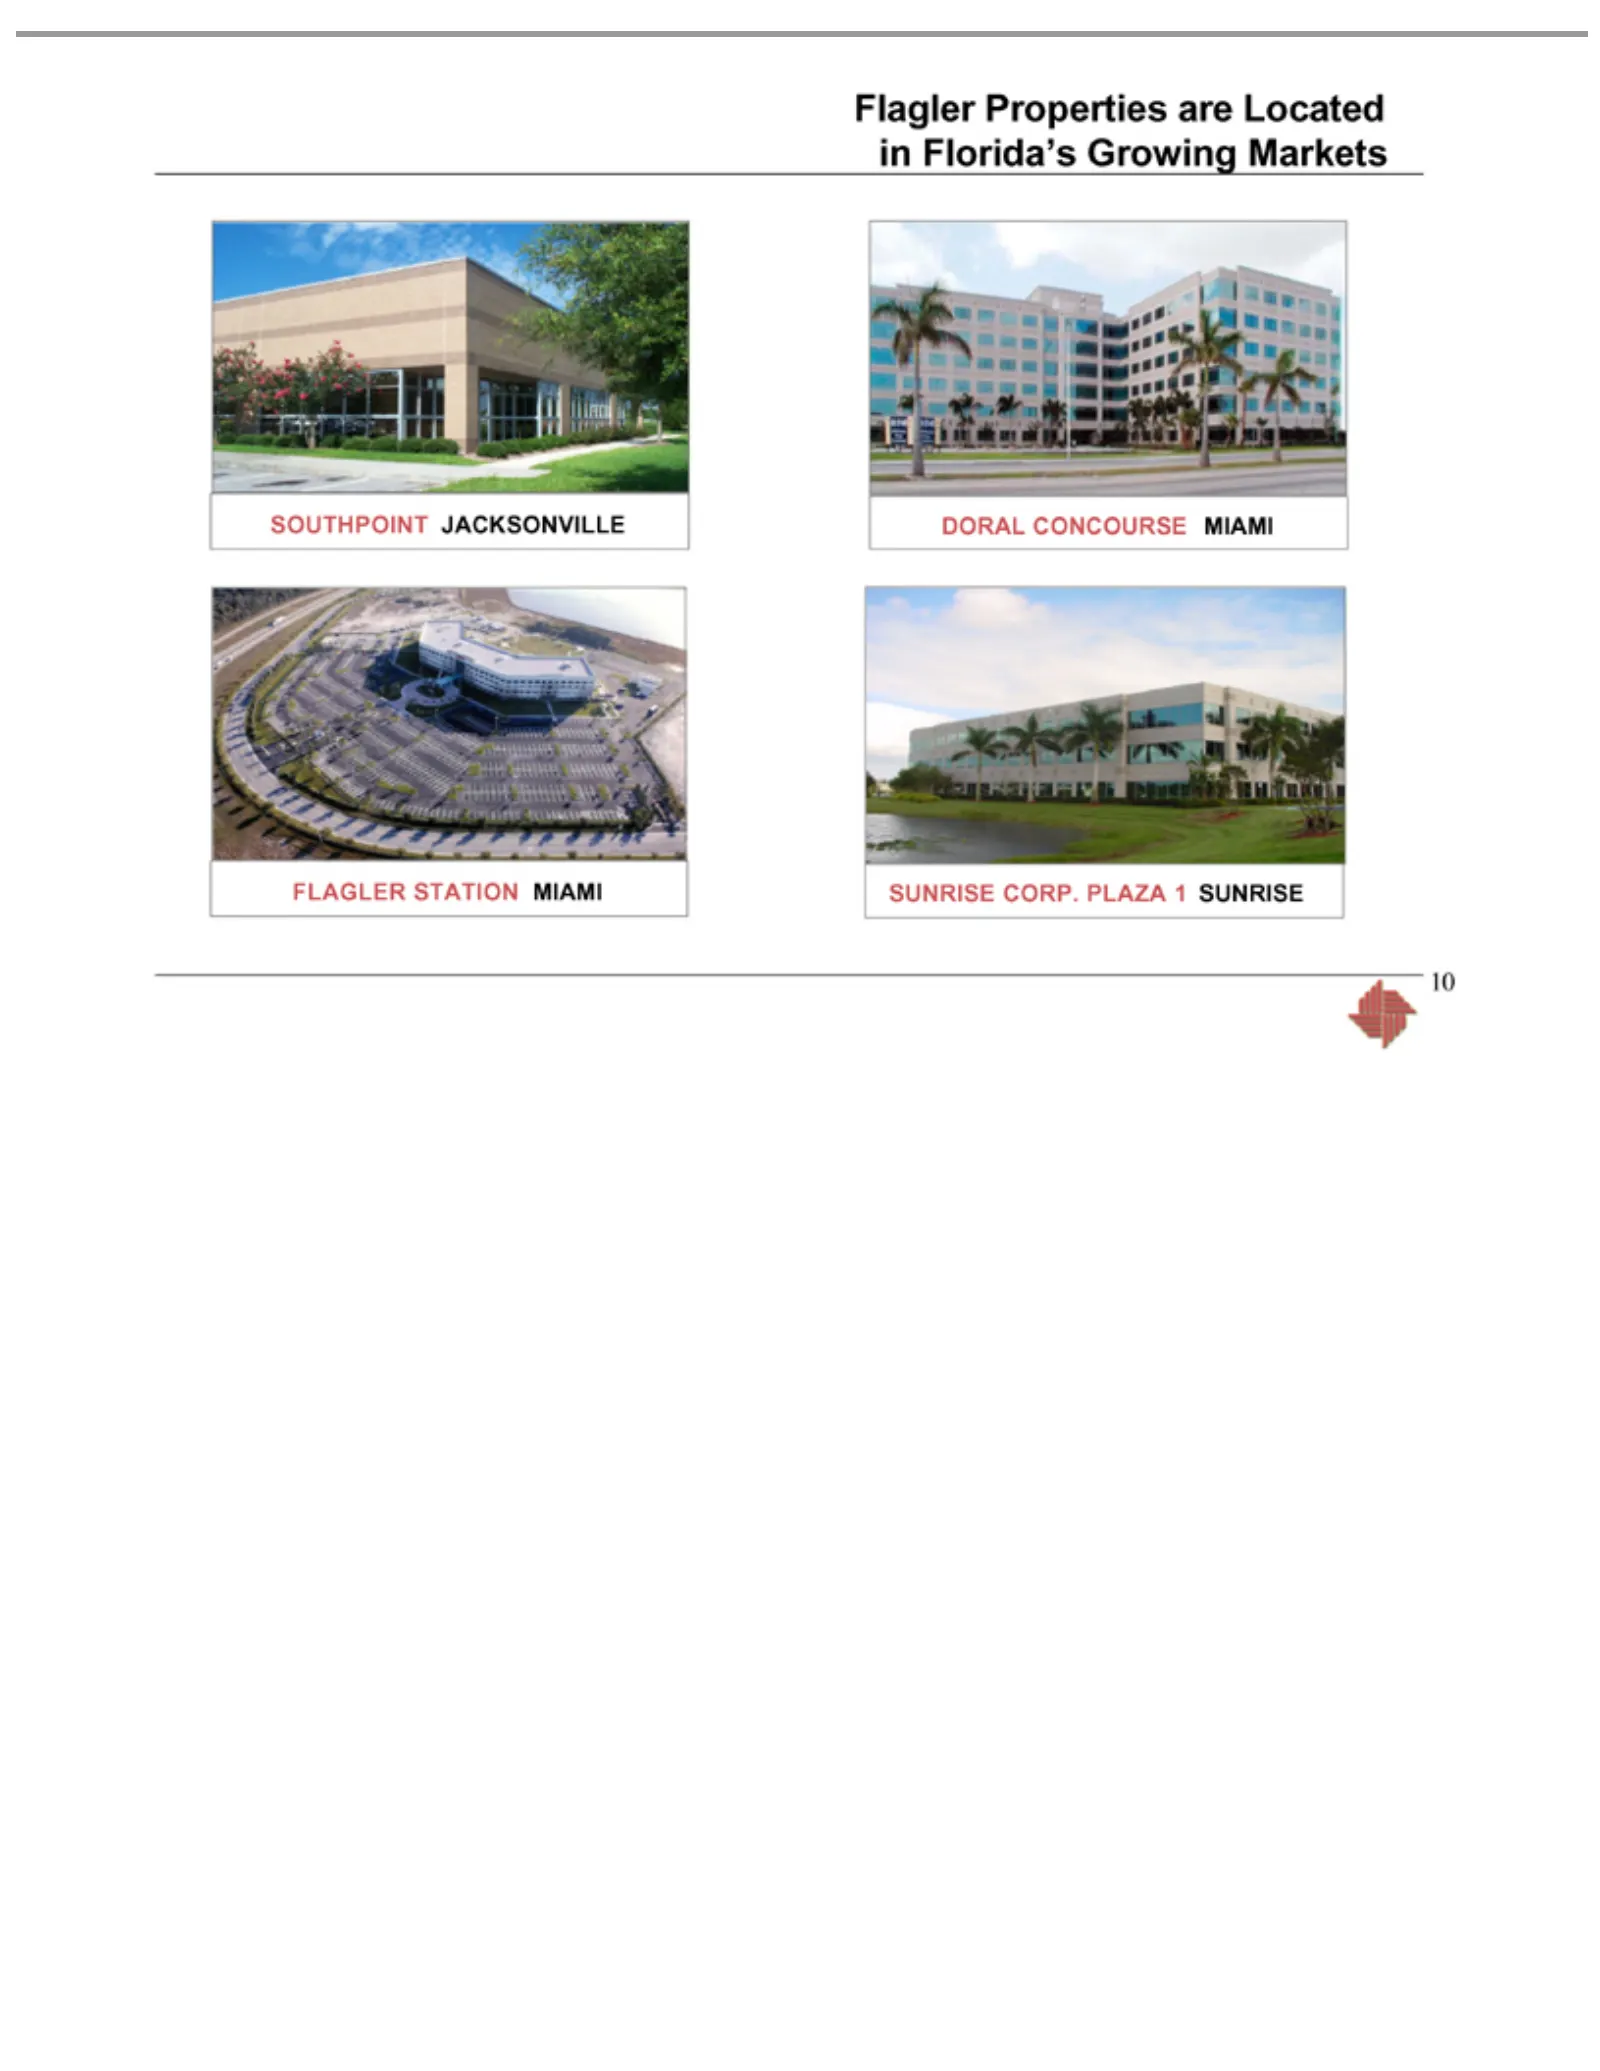
Slide 10: Flagler Properties Located in Florida's Growing Markets
Flagler Properties SOUTHPOINT FLAGLER DORAL SUNRISE 10 CONCOURSE CORP. STATION JACKSONVILLE are PLAZA Located MIAMI MIAMI 1 SUNRISE in Florida’s Growing Markets
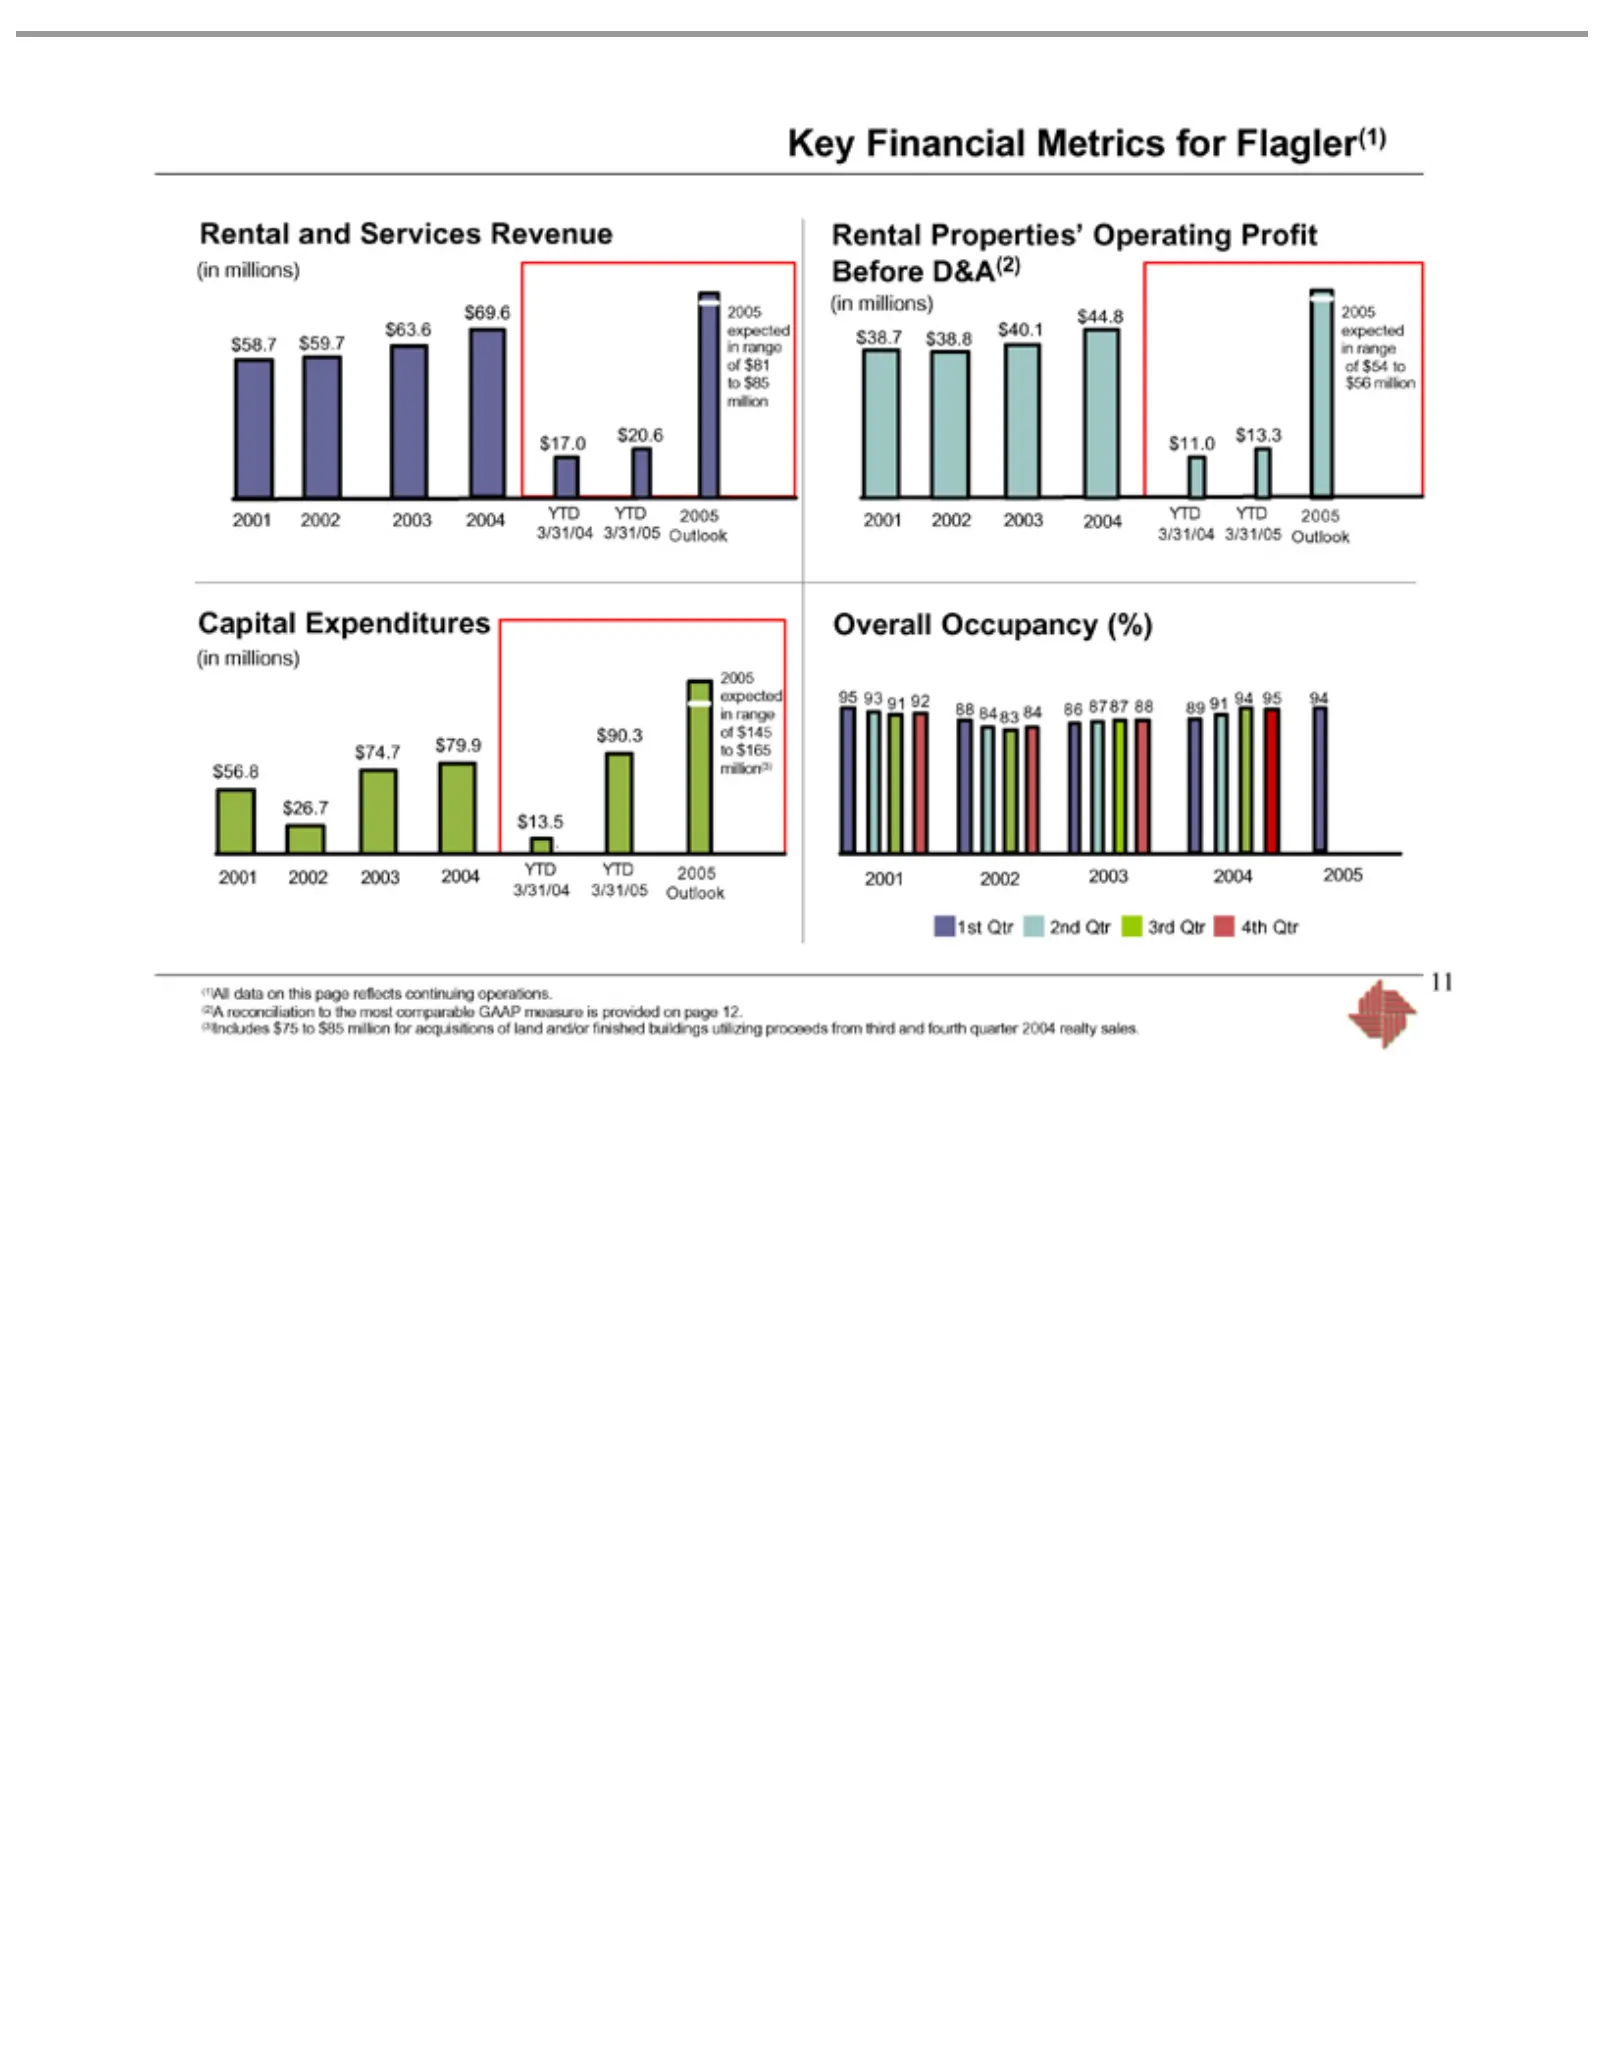
Slide 11: Flagler Key Financial Metrics and Outlook
Key91 $58.7 $20.6 Capital $56.8 $90.3 Rental (in $38.7 YTD $13.3 Overall 95 88 2001 86 2002 89 2003 1st 2005 94 2004 (1)All (2)A (3)Includes 11 93 84 87 millions) Qtr Financial reconciliation expected Outlook 3/31/04 3/31/05 2001 91 83 87 94 data and Properties’ 2nd Expenditures Occupancy 92Services
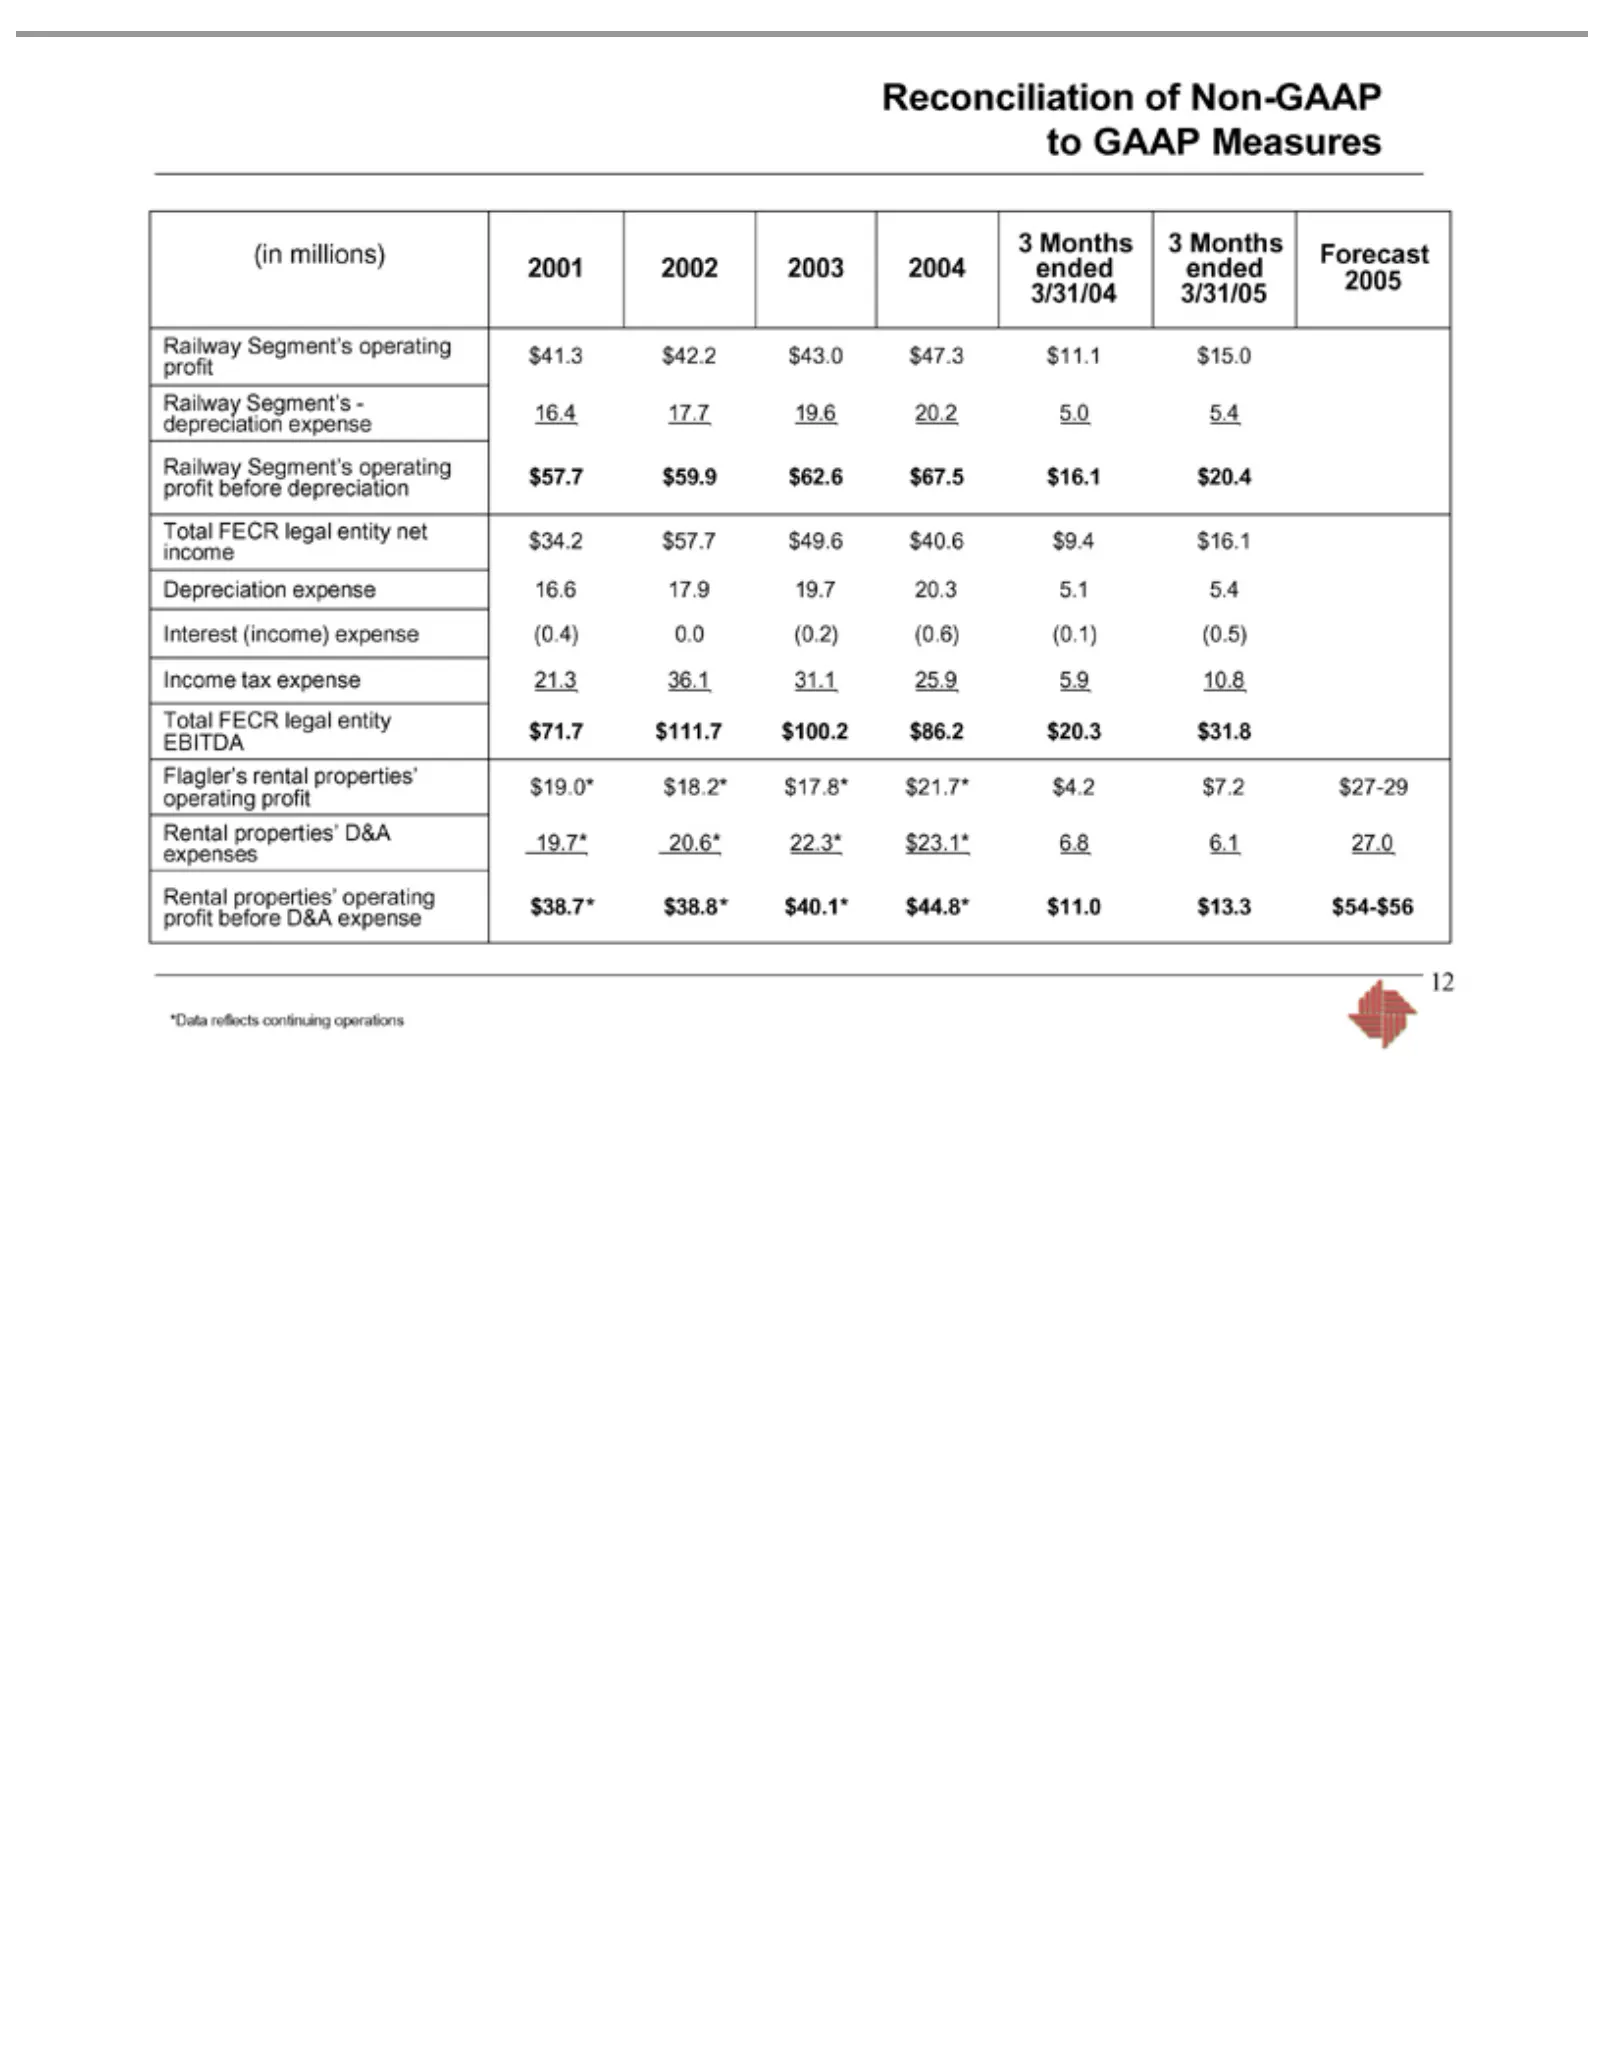
Slide 12: Reconciliation of Non-GAAP Measures
Reconciliation (in Railway Depreciation Interest Income Total EBITDA Flagler’s Rental *Data 12 millions) FECR reflects properties’ (income) tax Segment’s rental $71.7 expense legal 2001 expense continuing of properties’ $111.7 expense Non-GAAP entity D&A operating 2002 -21.3 operating depreciation 1
Source: SEC EDGAR · 8-K filed Jun 8, 2005
More decks from Florida East Coast Industries Inc
 Merger or Acquisition (May 2007)15 slides · May 31, 2007
 Q1 2007 Earnings Presentation26 slides · May 9, 2007
 Q4 2006 Earnings Presentation39 slides · Feb 15, 2007
 Q3 2006 Earnings Presentation36 slides · Nov 2, 2006
 Ryan Beck Investor Event (September 2006)80 slides · Sep 13, 2006
 Morgan Keegan 2006 Equity Conference30 slides · Sep 7, 2006