Sundance Energy — Sundance Energy Australia — Investor Presentation (November 2014)
21 slides from Sundance Energy's investor presentation, Nov 5, 2014
Slide 1: Execute – Deliver – Grow
Sundance Energy Australia Limited (ASX: SEA) Execute – Deliver – Grow October 2014
Slide 2: Disclaimer
This presentation has been prepared by Sundance Energy Australia Limited (ABN 76 112 202 883). Summary information The following disclaimer applies to this document and any information contained in it (the “Information”). The Information in this presentation is of general background and does not pur
Slide 3: Disclaimer and Forward Looking Statements
Not an offer The Information does not constitute an offer, invitation, solicitation or recommendation in relation to the subscription, purchase or sale of securities in any jurisdiction. Neither this presentation nor anything in it shall form any part of any contract for the acquisition of Sundance
Slide 4: Assets in Leading US Liquids Basins
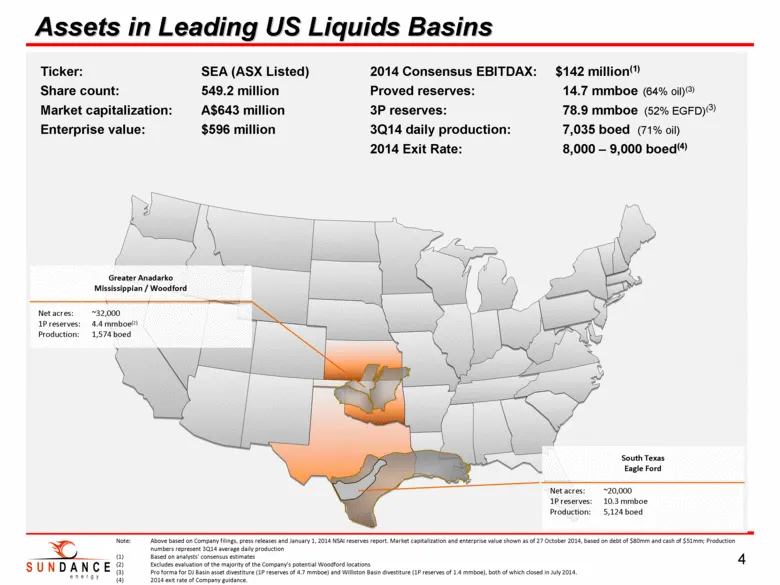
Assets in Leading US Liquids Basins Assets in Leading US Liquids Basins 4 Ticker: SEA (ASX Listed) Share count: 549.2 million Market capitalization: A$643 million Enterprise value: $596 million Note: Above based on Company filings, press release s and January 1, 2014 NSAI reserve s report. Market ca
Slide 5: Quarterly Overview
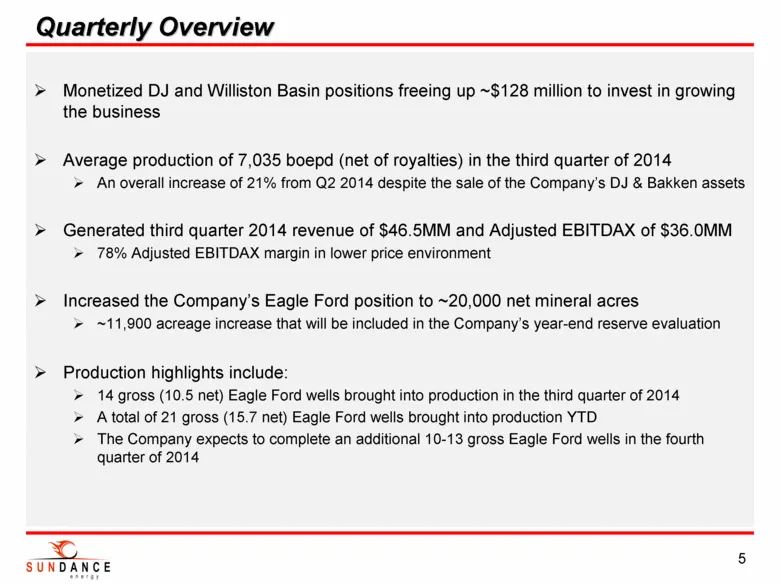
Monetized DJ and Williston Basin positions freeing up ~$128 million to invest in growing the business Average production of 7,035 boepd (net of royalties) in the third quarter of 2014 An overall increase of 21% from Q2 2014 despite the sale of the Company’s DJ & Bakken assets Generated third quarter
Slide 6: Production and Revenue Trend
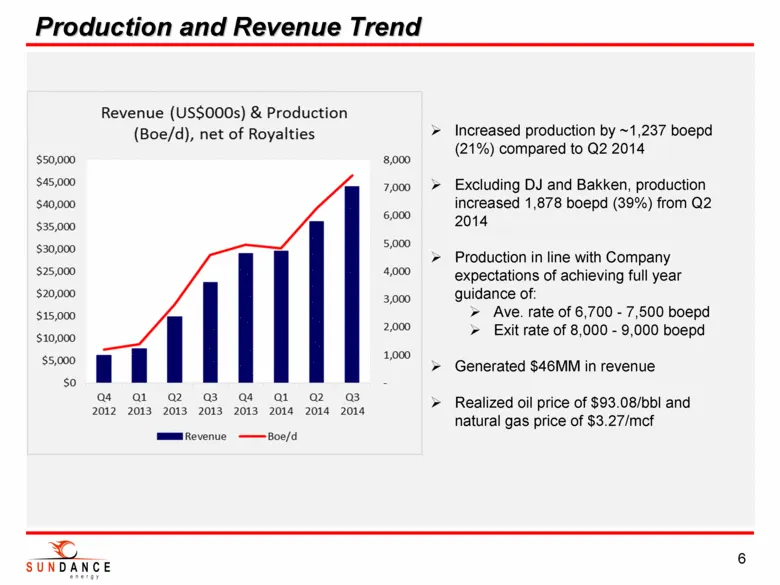
Production and Revenue Trend Production and Revenue Trend 6 Increased production by ~1,237 boepd (21%) compared to Q2 2014 Excluding DJ and Bakken, production increased 1,878 boepd (39%) from Q2 2014 Production in line with Company expectations of achieving full year guidance of: Ave. rate of 6,700
Slide 7: Adjusted EBITDAX Trend
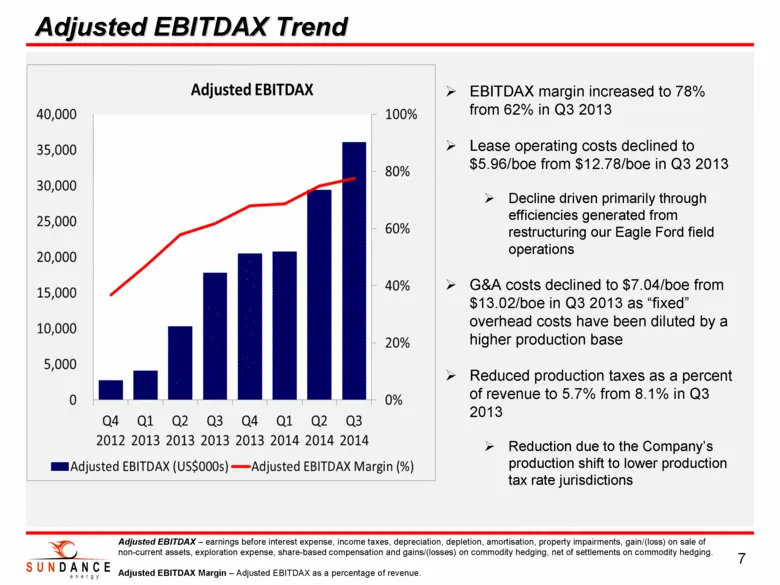
Adjusted EBITDAX Trend Adjusted EBITDAX Trend 7 EBITDAX margin increased to 78% from 62% in Q3 2013 Lease operating costs declined to $5.96/boe from $12.78/boe in Q3 2013 Decline driven primarily through efficiencies generated from restructuring our Eagle Ford field operations G&A costs declined to
Slide 8: Liquidity and Capital Expenditures
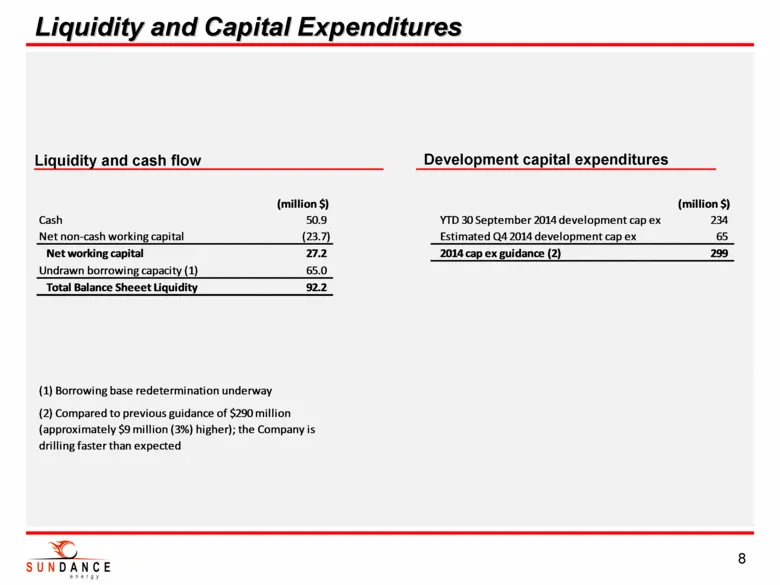
Liquidity and Capital Expenditures Liquidity and Capital Expenditures 8 Liquidity and cash flow Development capital expenditures (million $) (million $) Cash 50.9 YTD 30 September 2014 development cap ex 234 Net non-cash working capital (23.7) Estimated Q4 2014 development cap ex 65 Net working capi
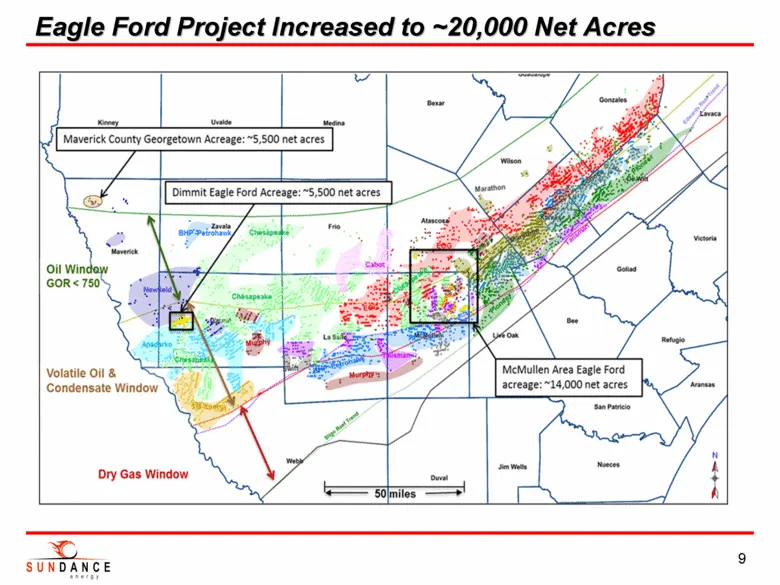
Slide 9: Eagle Ford Project Increased to ~20,000 Net Acres
Eagle Ford Project Increased to ~20,000 Net Acres Eagle Ford Project Increased to ~20,000 Net Acres 9
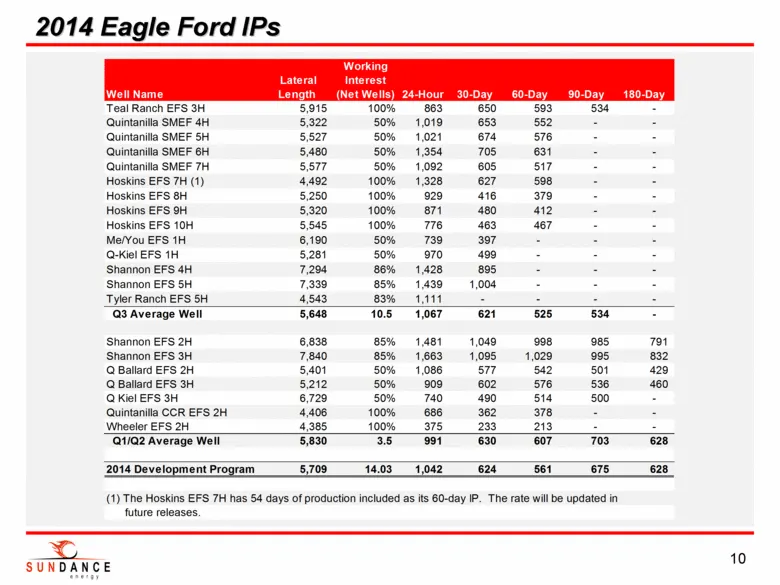
Slide 10: 2014 Eagle Ford IPs
2014 Eagle Ford IPs 2014 Eagle Ford IPs 10 Well Name Lateral Length Working Interest (Net Wells) 24-Hour 30-Day 60-Day 90-Day 180-Day Teal Ranch EFS 3H 5,915 100% 863 650 593 534 - Quintanilla SMEF 4H 5,322 50% 1,019 653 552 - - Quintanilla SMEF 5H 5,527 50% 1,021 674 576 - - Quintanilla SMEF 6H 5,4
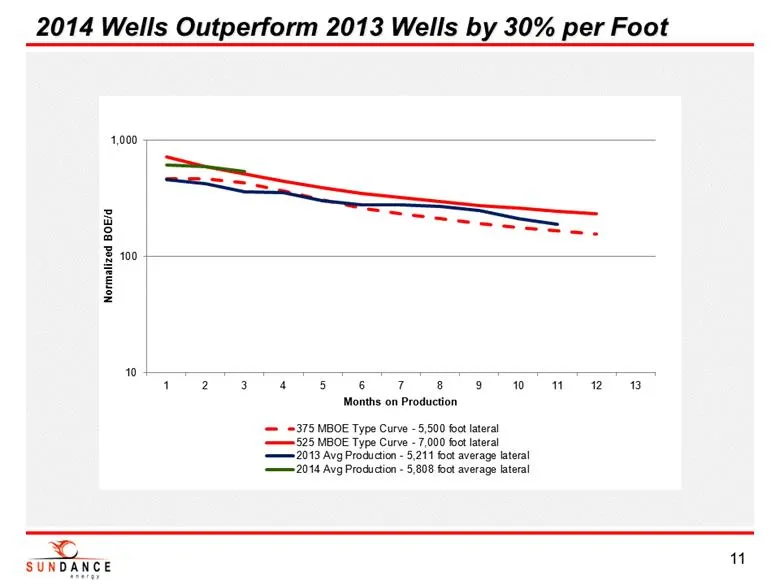
Slide 11: 2014 Wells Outperform 2013 Wells by 30% per Foot
2014 Wells Outperform 2013 Wells by 30% per Foot 2014 Wells Outperform 2013 Wells by 30% per Foot 11
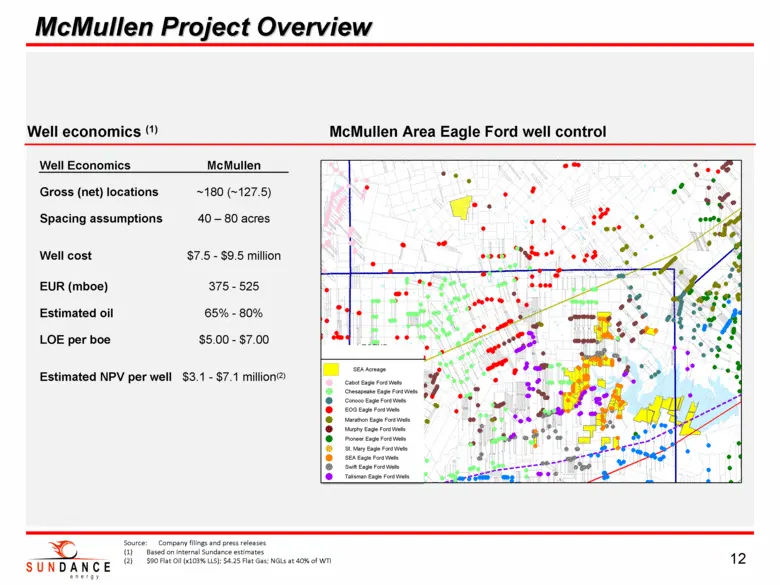
Slide 12: McMullen Project Overview
McMullen Project Overview McMullen Project Overview 12 Well Economics McMullen Gross (net) locations ~180 (~127.5) Spacing assumptions 40 – 80 acres Well cost $7.5 - $9.5 million EUR (mboe) 375 - 525 Estimated oil 65% - 80% LOE per boe $5.00 - $7.00 Estimated NPV per well $3.1 - $7.1 million(2) Well
Slide 13: Dimmit County Overview
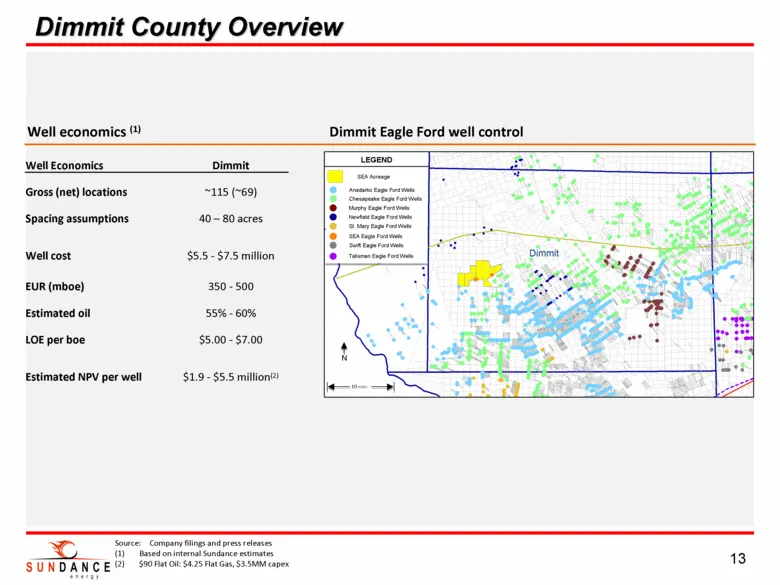
Dimmit County Overview Dimmit County Overview 13 Source: Company filings and press releases (1) Based on internal Sundance estimates (2) $90 Flat Oil: $4.25 Flat Gas, $3.5MM capex N 10 miles Dimmit Eagle Ford well control Well Economics Dimmit Gross (net) locations ~115 (~69) Spacing assumptions 40
Slide 14: Mississippian/Woodford Overview
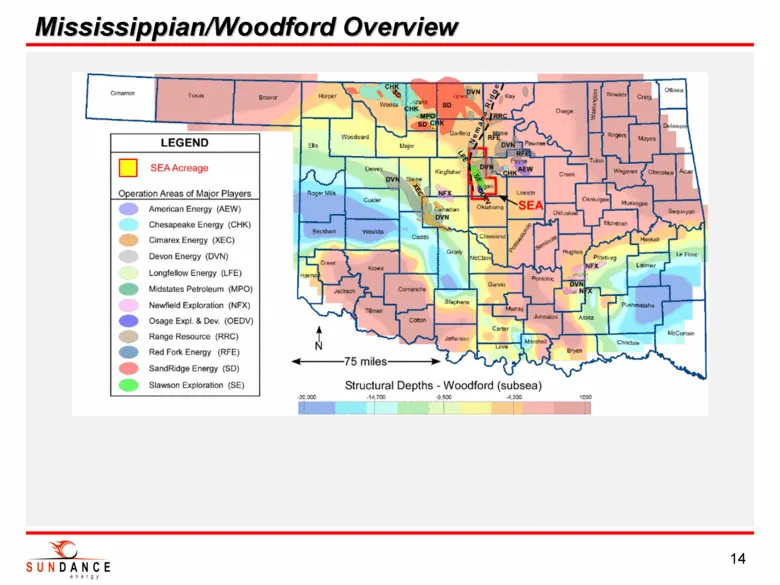
Mississippian/Woodford Overview Mississippian/Woodford Overview 14
Slide 15: Mississippian Zipper Fracs
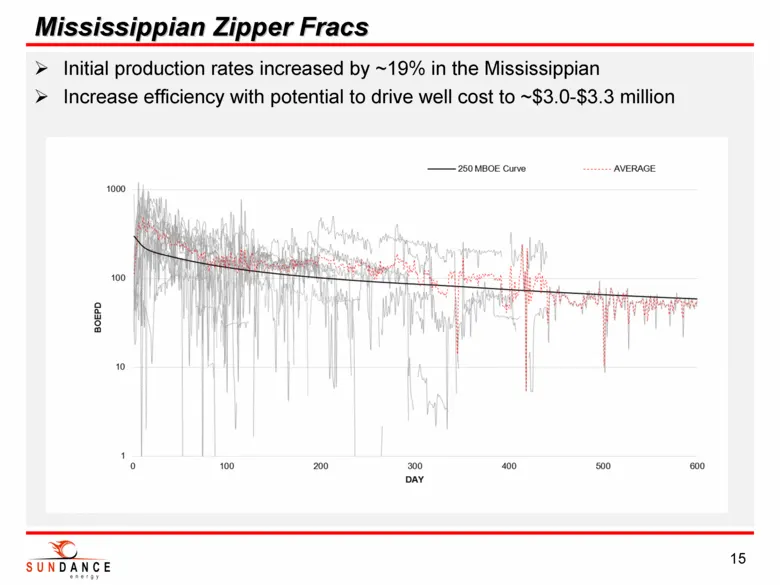
Initial production rates increased by ~19% in the Mississippian Increase efficiency with potential to drive well cost to ~$3.0-$3.3 million Mississippian Zipper Fracs Mississippian Zipper Fracs 15
Slide 16: Mississippian LOE Reduction
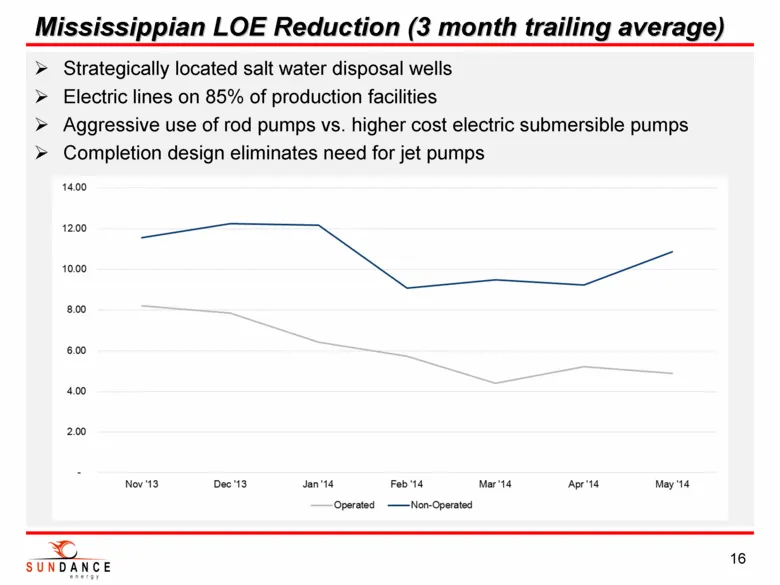
Strategically located salt water disposal wells Electric lines on 85% of production facilities Aggressive use of rod pumps vs. higher cost electric submersible pumps Completion design eliminates need for jet pumps Mississippian LOE Reduction (3 month trailing average) Mississippian LOE Reduction (3
Slide 17: Logan County – Mississippian Lime Economics
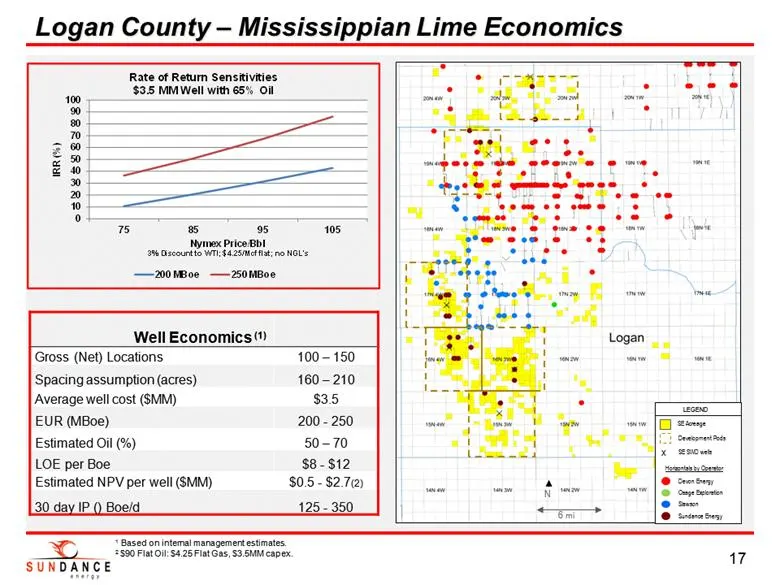
Logan County Logan County – Mississippian Lime Economics Mississippian Lime Economics 17 1 Based on internal management estimates. 2 $90 Flat Oil: $4.25 Flat Gas, $3.5MM capex. 0 10 20 30 40 50 60 70 80 90 100 75 85 95 105 IRR (%) Nymex Price/Bbl 3% Discount to WTI; $4.25/Mcf flat; no NGL's Rate of
Slide 18: Woodford Results
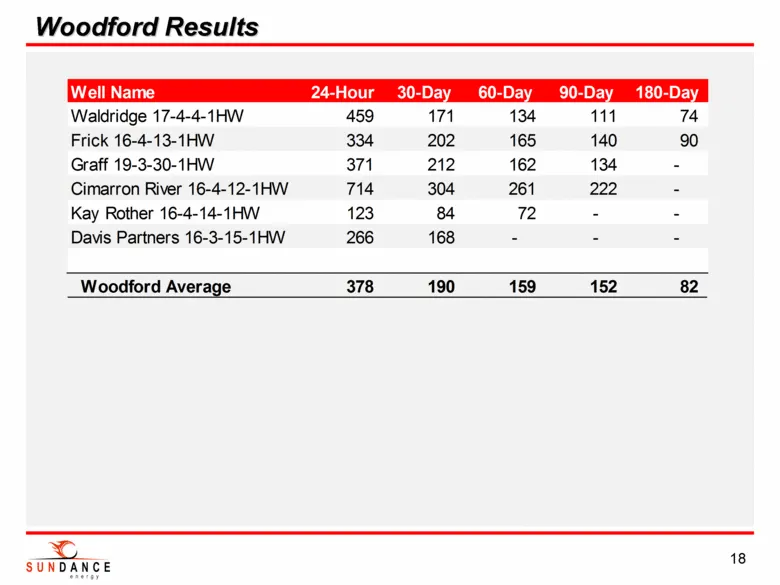
Woodford Results Woodford Results 18 Well Name 24-Hour 30-Day 60-Day 90-Day 180-Day Waldridge 17-4-4-1HW 459 171 134 111 74 Frick 16-4-13-1HW 334 202 165 140 90 Graff 19-3-30-1HW 371 212 162 134 - Cimarron River 16-4-12-1HW 714 304 261 222 - Kay Rother 16-4-14-1HW 123 84 72 - - Davis Partners 16-3-1
Slide 19: Activity Pipeline
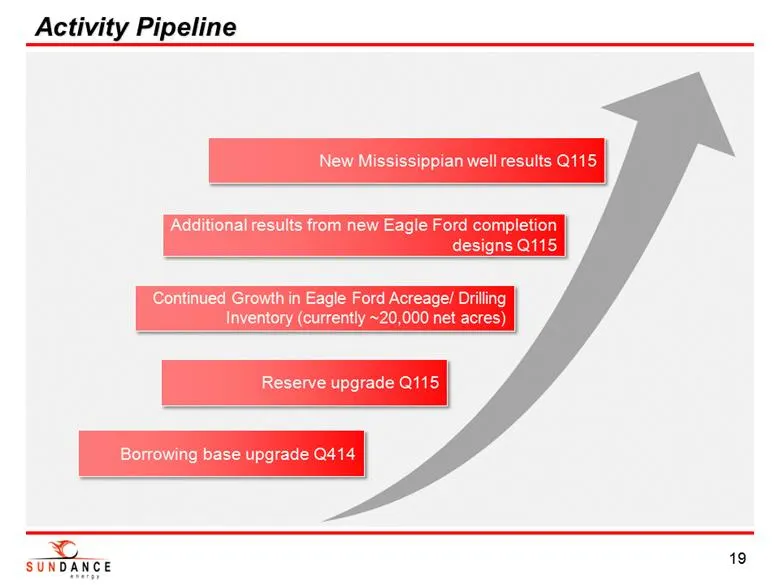
Activity Pipeline Activity Pipeline 19 Borrowing base upgrade Q414 New Mississippian well results Q115 Additional results from new Eagle Ford completion designs Q115 Continued Growth in Eagle Ford Acreage/ Drilling Inventory (currently ~20,000 net acres) Reserve upgrade Q115
Slide 20: Appendix
Appendix Appendix 20
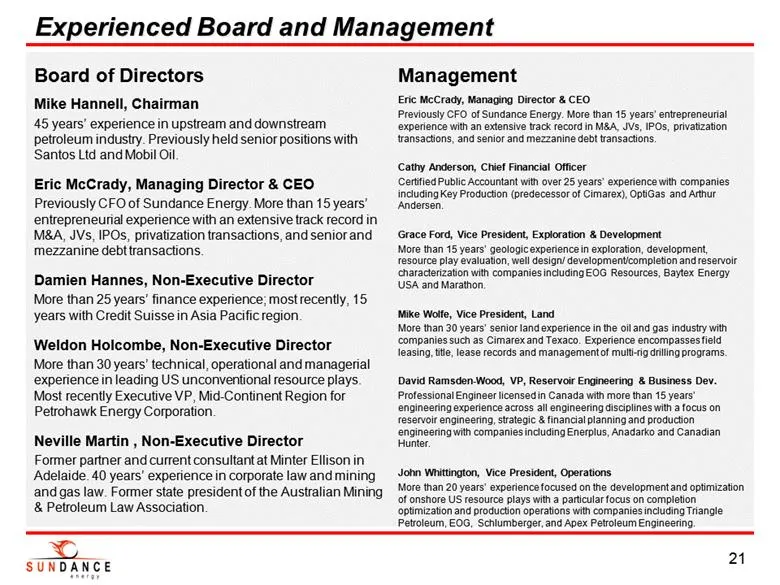
Slide 21: Board of Directors
Board of Directors Mike Hannell, Chairman 45 years’ experience in upstream and downstream petroleum industry. Previously held senior positions with Santos Ltd and Mobil Oil. Eric McCrady, Managing Director & CEO Previously CFO of Sundance Energy. More than 15 years’ entrepreneurial experience with a
Source: SEC EDGAR · 6-K filed Nov 5, 2014
More decks from Sundance Energy Inc
 Investor Presentation (February 2020)25 slides · Feb 10, 2020
 Sundance Energy Australia — Q3 2019 Earnings Presentation24 slides · Nov 18, 2019
 Sundance Energy Australia — Q2 2019 Earnings Presentation25 slides · Aug 16, 2019
 Sundance Energy Australia — Investor Presentation (July 2019)19 slides · Jul 24, 2019
 Sundance Energy Australia — Investor Presentation (June 2019)16 slides · Jun 3, 2019
 Sundance Energy Australia — Q1 2019 Earnings Presentation17 slides · May 21, 2019