Capstar Financial Holdings Inc
Capstar Financial — Shareholder Meeting (April 2020)
27 slides from Capstar Financial's shareholder meeting presentation, Apr 24, 2020

Slide 1: Annual Shareholder Meeting April 24, 2020
Exhibit 99.4 CAPSTAR. FINANCIAL HOLDINGS, INC. Annual Shareholder Meeting April 24, 2020
Slide 2: Forward-Looking Statements and Non-GAAP Measures
FORWARD-LOOKING STATEMENTS This investor presentation contains forward-looking statements, as defined by federal securities laws, including statements about CapStar Disclosures Financial Holdings, Inc. (“CapStar”) and its financial outlook and business environment. These statements are based on curr
Slide 3: Year in Review
Year in Review 3Year in Review 3
Slide 4: 2019 Results Accomplishments
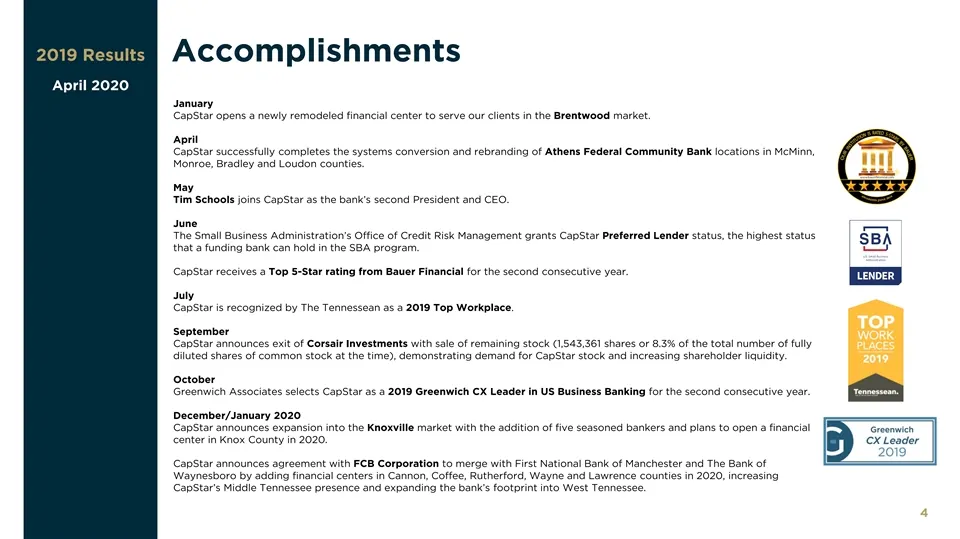
2019 Results Accomplishments April 2020 January CapStar opens a newly remodeled financial center to serve our clients in the Brentwood market. April CapStar successfully completes the systems conversion and rebranding of Athens Federal Community Bank locations in McMinn, Monroe, Bradley and Loudon c
Slide 5: 2019 Results History
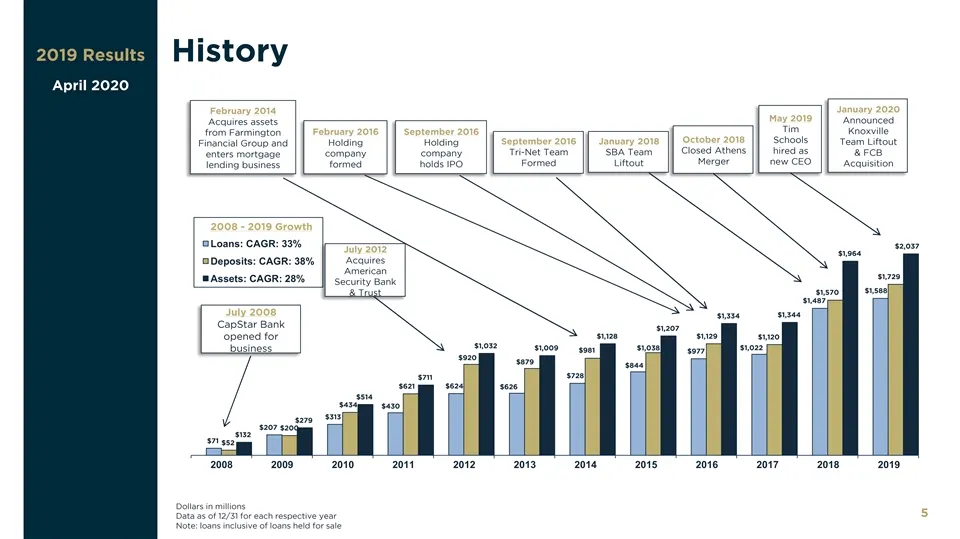
2019 Results History April 2020 January 2020 February 2014 May 2019 Announced Acquires assets Tim Knoxville February 2016 September 2016 from Farmington October 2018 Schools September 2016 January 2018 Team Liftout Holding Holding Financial Group and Closed Athens hired as Tri-Net Team SBA Team comp
Slide 6: 2019 Results Market Presence
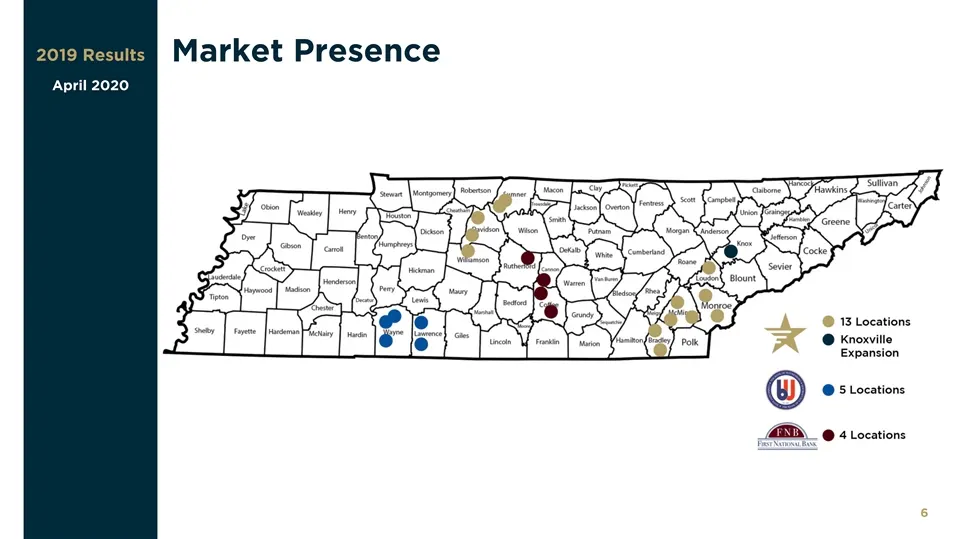
2019 Results Market Presence April 2020 62019 Results Market Presence April 2020 6
Slide 7: 2019 Results Financial Highlights
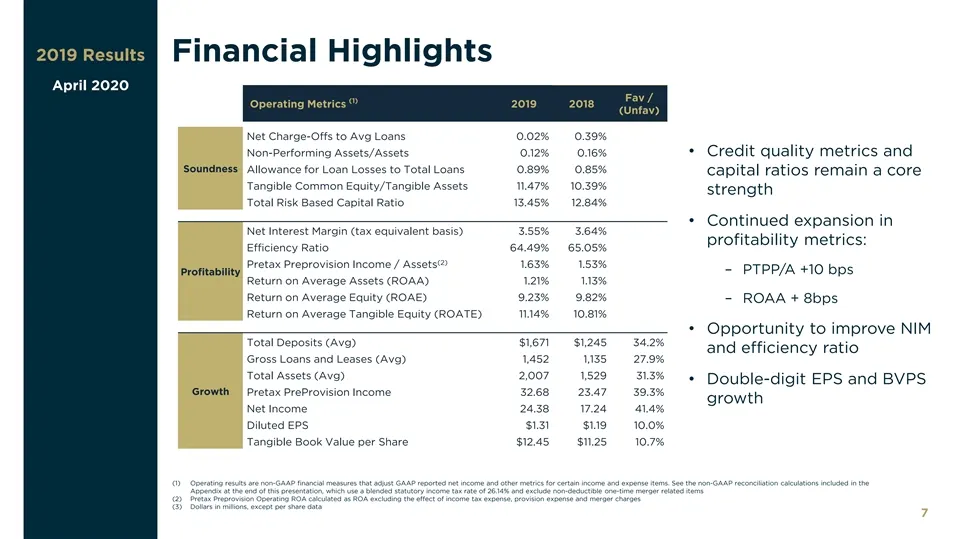
2019 Results Financial Highlights April 2020 Fav / (1) Operating Metrics 2019 2018 (Unfav) Net Charge-Offs to Avg Loans 0.02% 0.39% • Credit quality metrics and Non-Performing Assets/Assets 0.12% 0.16% Soundness Allowance for Loan Losses to Total Loans 0.89% 0.85% capital ratios remain a core Tangib
Slide 8: Historical Common Stock Performance
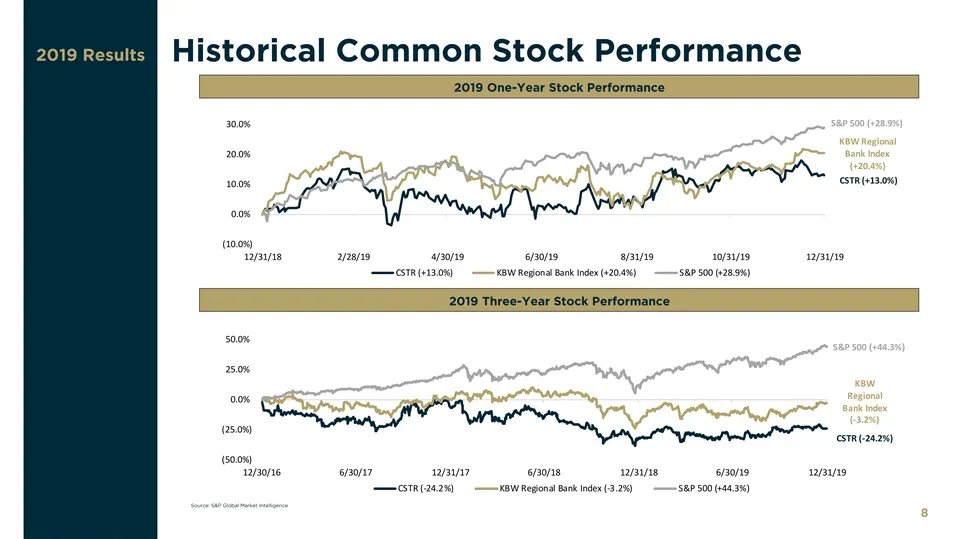
2019 Results Historical Common Stock Performance 2019 One-Year Stock Performance S&P 500 (+28.9%) 30.0% KBW Regional 20.0% Bank Index (+20.4%) CSTR (+13.0%) 10.0% 0.0% (10.0%) 12/31/18 2/28/19 4/30/19 6/30/19 8/31/19 10/31/19 12/31/19 CSTR (+13.0%) KBW Regional Bank Index (+20.4%) S&P 500 (+28.9%) 2
Slide 9: Looking Forward
Looking Forward 9Looking Forward 9
Slide 10: Looking Forward: Priorities
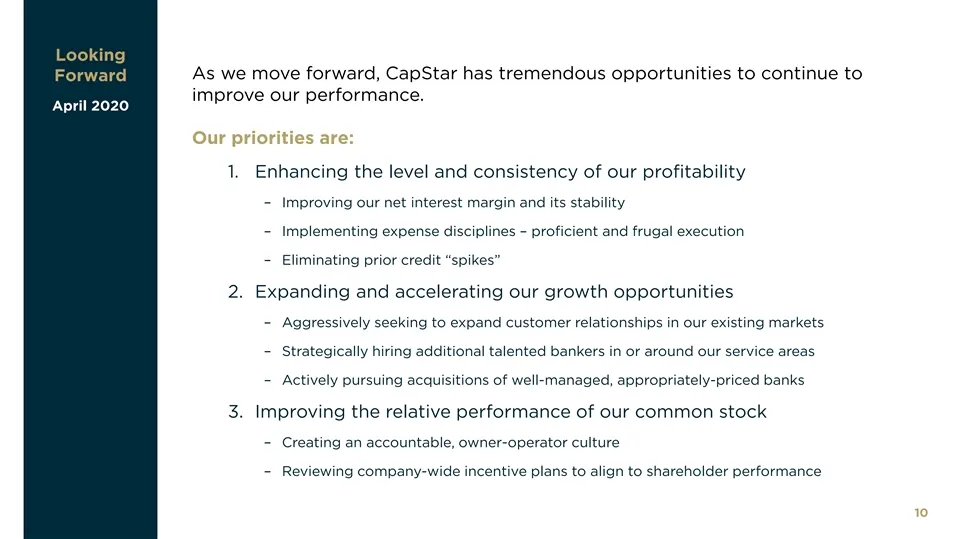
Looking As we move forward, CapStar has tremendous opportunities to continue to Forward improve our performance. April 2020 Our priorities are: 1. Enhancing the level and consistency of our profitability – Improving our net interest margin and its stability – Implementing expense disciplines – profi
Slide 11: Knoxville Expansion Strategy
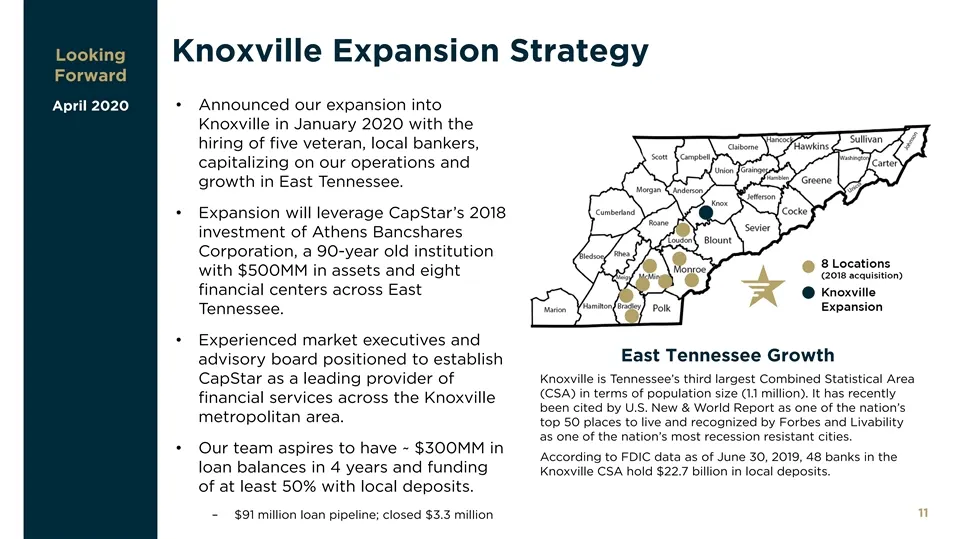
Looking Knoxville Expansion Strategy Forward • Announced our expansion into April 2020 Knoxville in January 2020 with the hiring of five veteran, local bankers, capitalizing on our operations and growth in East Tennessee. • Expansion will leverage CapStar’s 2018 investment of Athens Bancshares Corpo
Slide 12: FCB Merger Strategy
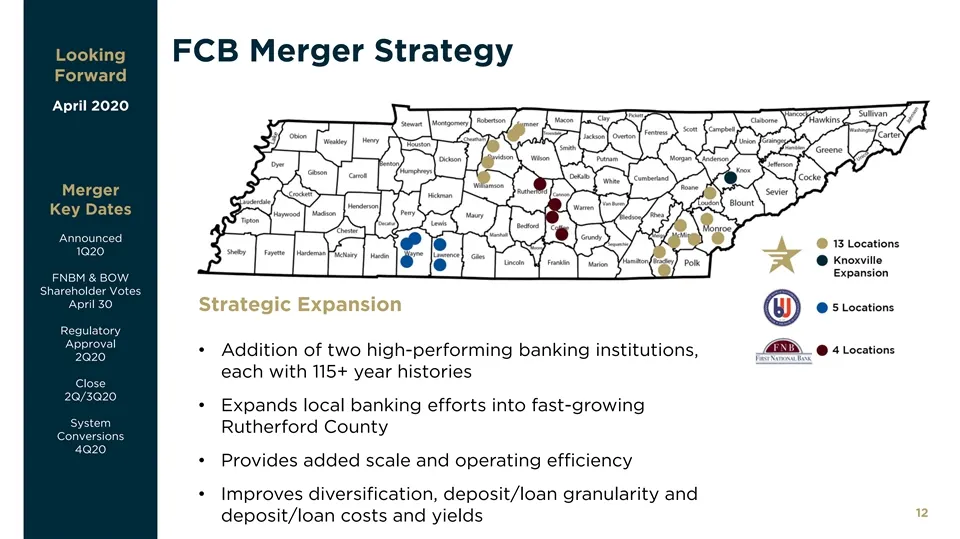
Looking FCB Merger Strategy Forward April 2020 Merger Key Dates Announced 1Q20 FNBM & BOW Shareholder Votes April 30 Strategic Expansion Regulatory Approval • Addition of two high-performing banking institutions, 2Q20 each with 115+ year histories Close 2Q/3Q20 • Expands local banking efforts into f
Slide 13: COVID-19 Response
COVID-19 Response 13COVID-19 Response 13
Slide 14: 2020 YTD Price Performance
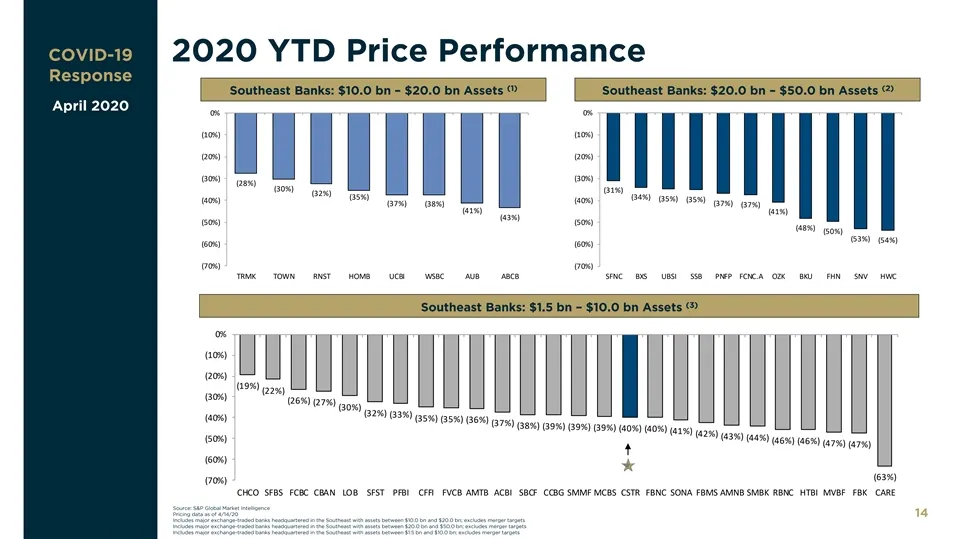
COVID-19 2020 YTD Price Performance Response (1) (2) Southeast Banks: $10.0 bn – $20.0 bn Assets Southeast Banks: $20.0 bn – $50.0 bn Assets April 2020 0% 0% (10%) (10%) (20%) (20%) (30%) (30%) (28%) (30%) (31%) (32%) (35%) (34%) (35%) (35%) (40%) (40%) (37%) (37%) (38%) (37%) (41%) (41%) (43%) (50%
Slide 15: Price / 2021 EPS
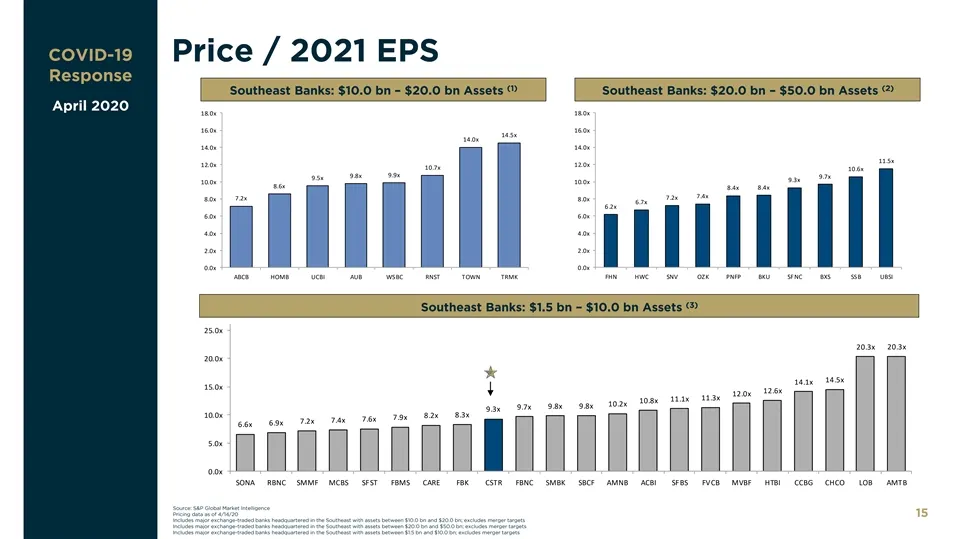
COVID-19 Price / 2021 EPS Response (1) (2) Southeast Banks: $10.0 bn – $20.0 bn Assets Southeast Banks: $20.0 bn – $50.0 bn Assets April 2020 18.0x 18.0x 16.0x 16.0x 14.5x 14.0x 14.0x 14.0x 11.5x 12.0x 12.0x 10.7x 10.6x 9.9x 9.8x 9.7x 9.5x 9.3x 10.0x 10.0x 8.6x 8.4x 8.4x 7.4x 7.2x 8.0x 7.2x 8.0x 6.7
Slide 16: Pandemic Oversight and Involvement
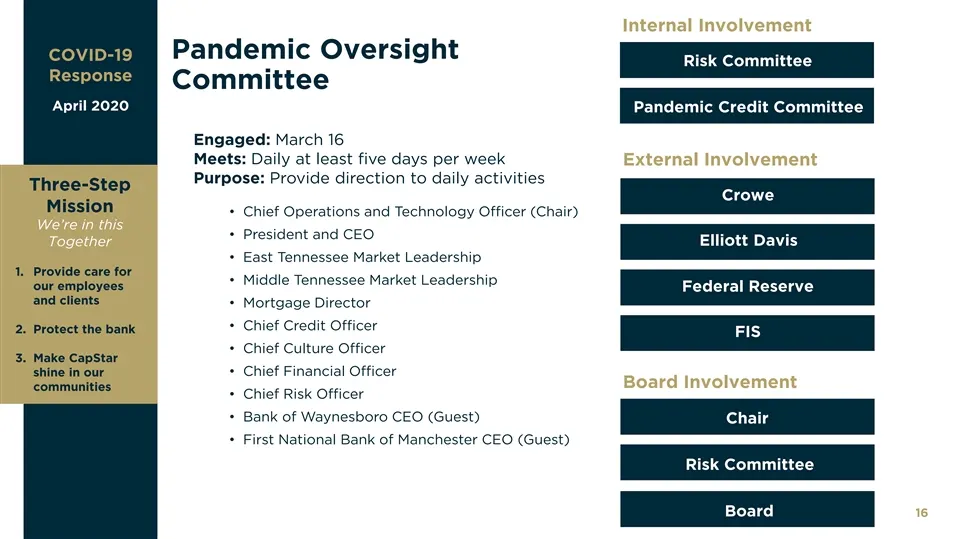
Internal Involvement Pandemic Oversight COVID-19 1Q20 Risk Committee Response Financial Committee Results April 2020 Pandemic Credit Committee April 2020 Engaged: March 16 Meets: Daily at least five days per week External Involvement Purpose: Provide direction to daily activities Three-Step Crowe Mi
Slide 17: Response Initiatives
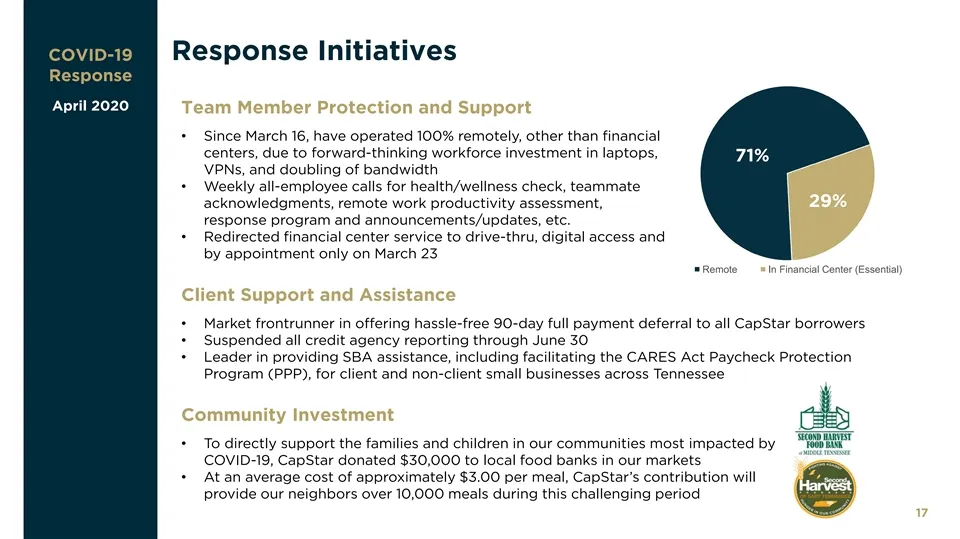
Response Initiatives COVID-19 Response 71% April 2020 Team Member Protection and Support • Since March 16, have operated 100% remotely, other than financial centers, due to forward-thinking workforce investment in laptops, 71% VPNs, and doubling of bandwidth • Weekly all-employee calls for health/we
Slide 18: Community Feedback
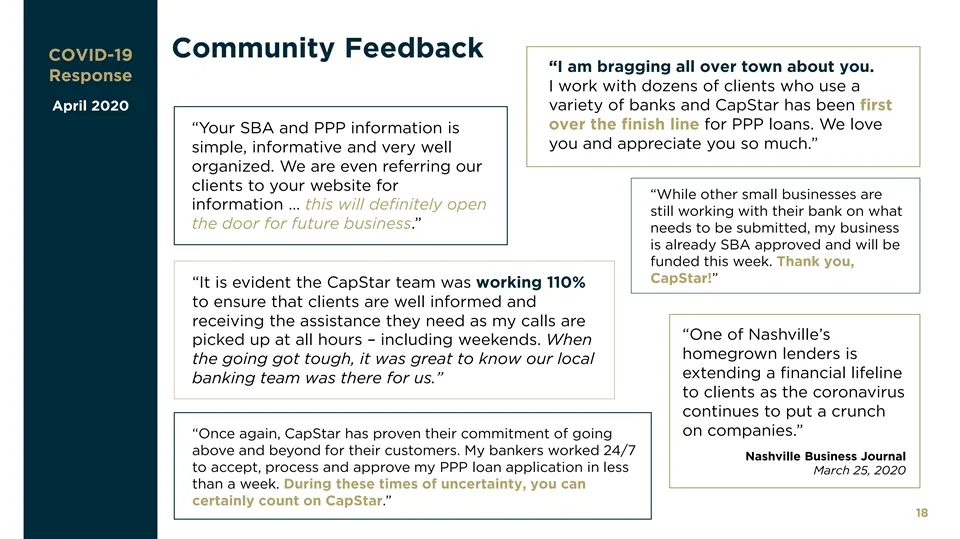
Community Feedback COVID-19 1Q20 “I am bragging all over town about you. Response Financial I work with dozens of clients who use a Results variety of banks and CapStar has been first April 2020 over the finish line for PPP loans. We love April 2020 “Your SBA and PPP information is you and appreciat

Slide 19: Questions
Questions 19Questions 19
Slide 20: Appendix: Non-GAAP Reconciliations
Appendix: Non-GAAP Reconciliations 20Appendix: Non-GAAP Reconciliations 20
Slide 21: Non-GAAP Financial Measures
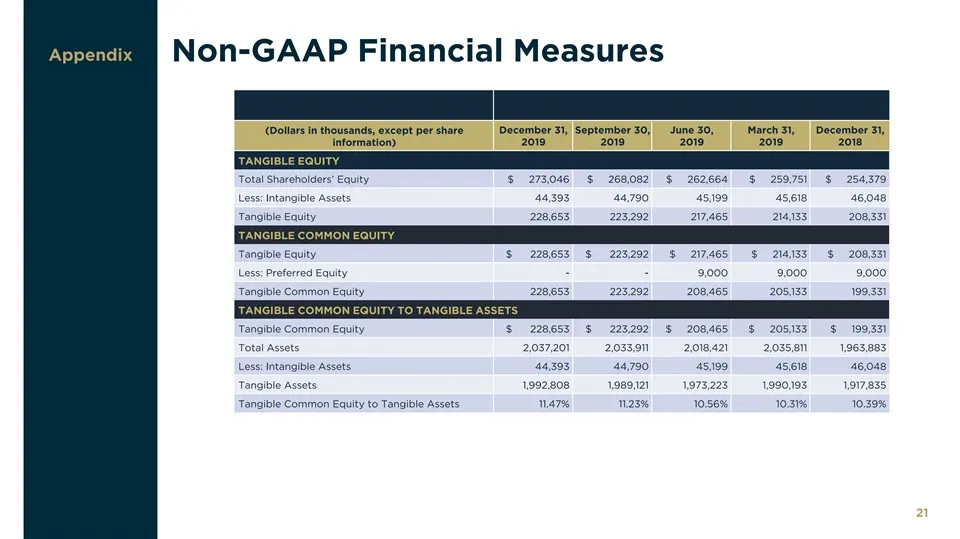
Appendix Non-GAAP Financial Measures (Dollars in thousands, except per share December 31, September 30, June 30, March 31, December 31, information) 2019 2019 2019 2019 2018 TANGIBLE EQUITY Total Shareholders’ Equity $ 273,046 $ 268,082 $ 262,664 $ 259,751 $ 254,379 Less: Intangible Assets 44,393 44
Slide 22: Non-GAAP Financial Measures
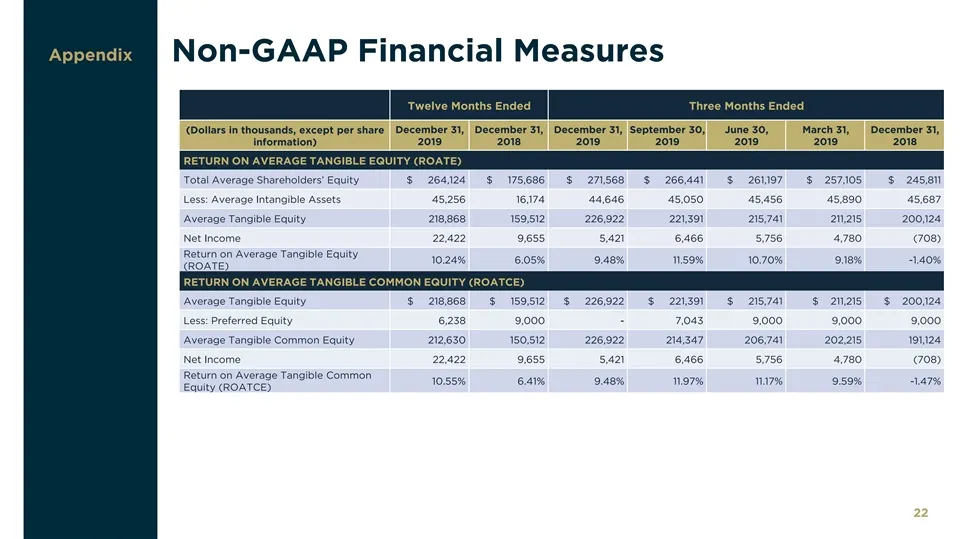
Appendix Non-GAAP Financial Measures Twelve Months Ended Three Months Ended December 31, December 31, December 31, September 30, June 30, March 31, December 31, (Dollars in thousands, except per share 2019 2018 2019 2019 2019 2019 2018 information) RETURN ON AVERAGE TANGIBLE EQUITY (ROATE) Total Ave
Slide 23: Non-GAAP Financial Measures
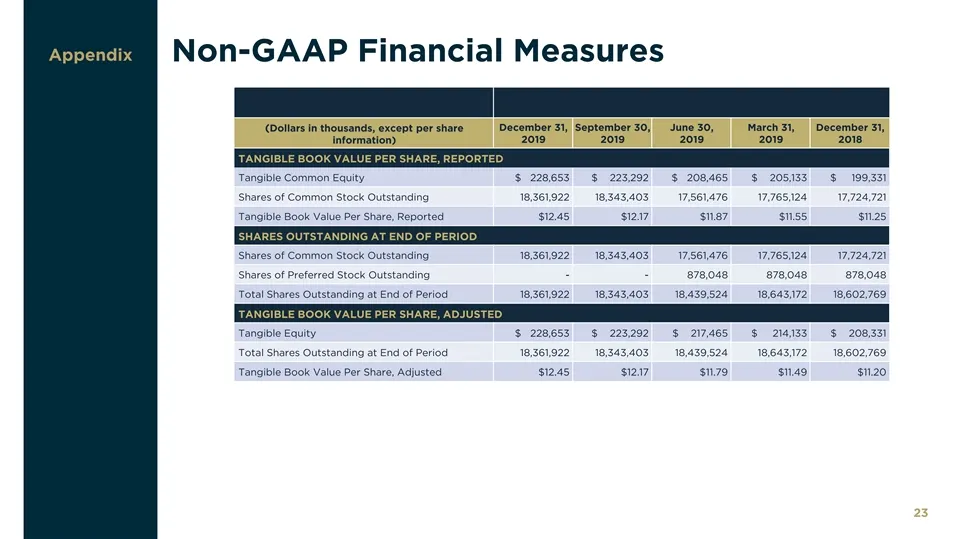
Appendix Non-GAAP Financial Measures December 31, September 30, June 30, March 31, December 31, (Dollars in thousands, except per share 2019 2019 2019 2019 2018 information) TANGIBLE BOOK VALUE PER SHARE, REPORTED Tangible Common Equity $ 228,653 $ 223,292 $ 208,465 $ 205,133 $ 199,331 Shares of Com
Slide 24: Non-GAAP Financial Measures
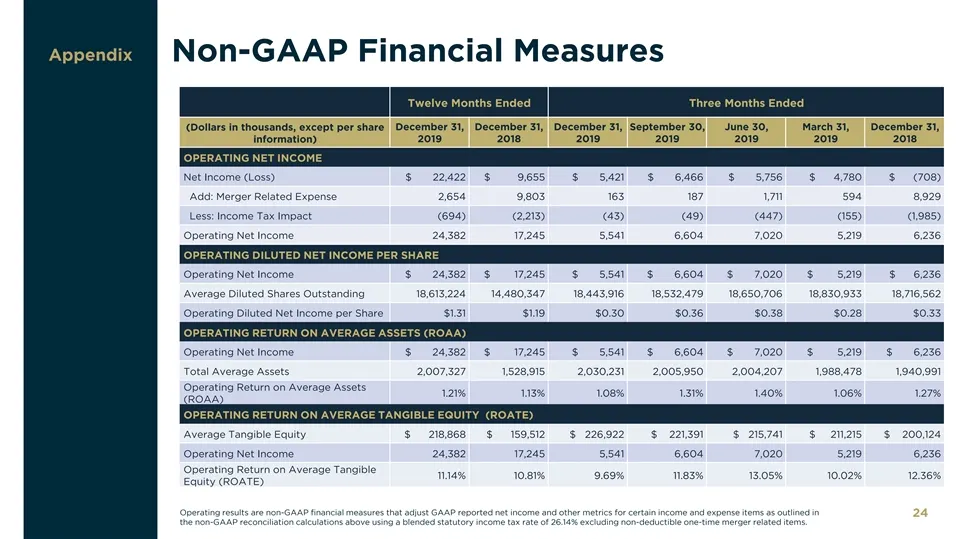
Appendix Non-GAAP Financial Measures Twelve Months Ended Three Months Ended December 31, December 31, December 31, September 30, June 30, March 31, December 31, (Dollars in thousands, except per share 2019 2018 2019 2019 2019 2019 2018 information) OPERATING NET INCOME Net Income (Loss) $ 22,422 $ 9
Slide 25: Non-GAAP Financial Measures
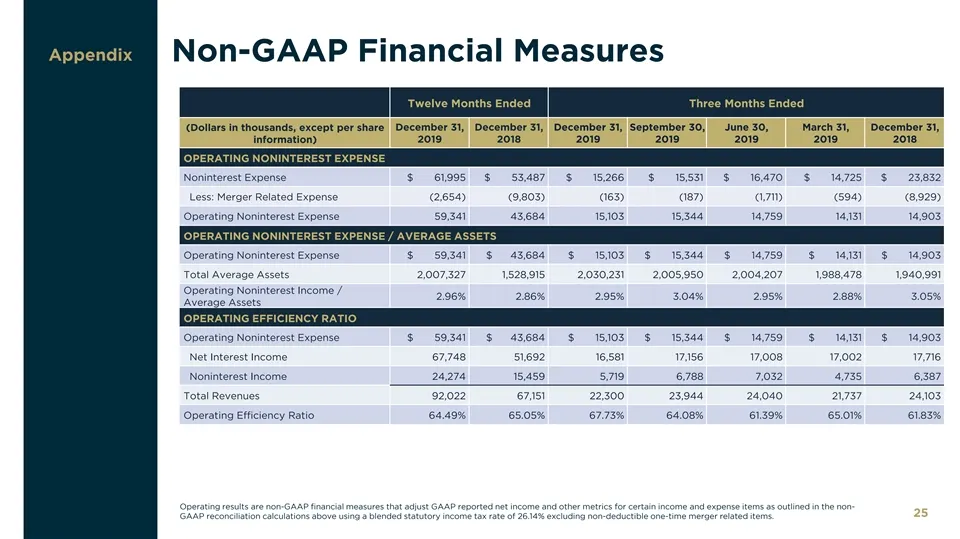
Appendix Non-GAAP Financial Measures Twelve Months Ended Three Months Ended (Dollars in thousands, except per share December 31, December 31, December 31, September 30, June 30, March 31, December 31, information) 2019 2018 2019 2019 2019 2019 2018 OPERATING NONINTEREST EXPENSE Noninterest Expense $
Slide 26: Contact
Contact Corporate Headquarters Executive Leadership Information Rob Anderson CapStar Financial Holdings, Inc. Chief Financial and Chief Administrative 1201 Demonbreun Street, Suite 700 Officer Nashville, TN 37203 CapStar Financial Holdings, Inc. (615) 732-6470 Mail: P.O. Box 305065 Email: randerson@

Slide 27: +7 eer Sa
+7 eer Sa | FINANCIAL HOLDINGS, INC.
Source: SEC EDGAR · 8-K filed Apr 24, 2020
More decks from Capstar Financial Holdings Inc
 Q4 2023 Earnings Presentation6 slides · Jan 23, 2024
 Merger or Acquisition (October 2023)16 slides · Oct 26, 2023
 Q2 2023 Earnings Presentation22 slides · Jul 21, 2023
 Q1 2023 Earnings Presentation32 slides · Apr 21, 2023
 Q4 2022 Earnings Presentation27 slides · Jan 20, 2023
 Investor Presentation (December 2022)31 slides · Dec 13, 2022