Strategic Hotels and Resorts Inc
Strategic Hotels and Resorts — Q1 2008 Earnings Presentation
36 slides from Strategic Hotels and Resorts's earnings presentation, May 14, 2008
Slide 1: Strategic Hotels & Resorts
STRATEGIC Hotels &° Resorts
Slide 2: Ryan Bowie, Vice President and Treasurer
Ryan Bowie Vice President and Treasurer

Slide 3: Agenda
Company Overview First Quarter Results and Outlook Overview of Chicago Market Fairmont Chicago / Aqua Master Plan Q&A Agenda
Slide 4: Value Creation Strategy
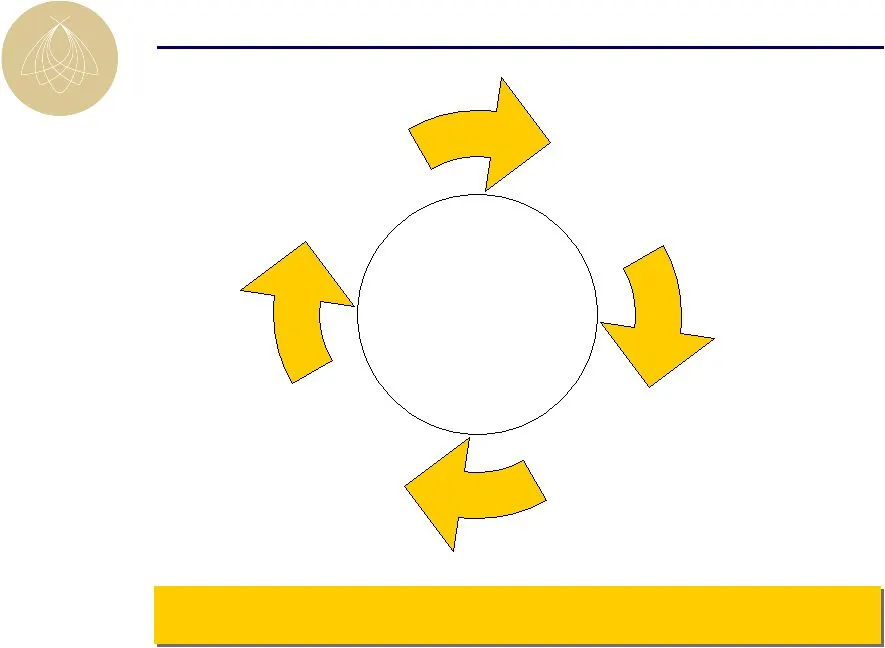
Value Creation Strategy Operations Acquisitions Dispositions Life Cycle Redevelopment & Collateral Opportunities Driving Long-Term Earnings Growth
Slide 5: Portfolio Overview
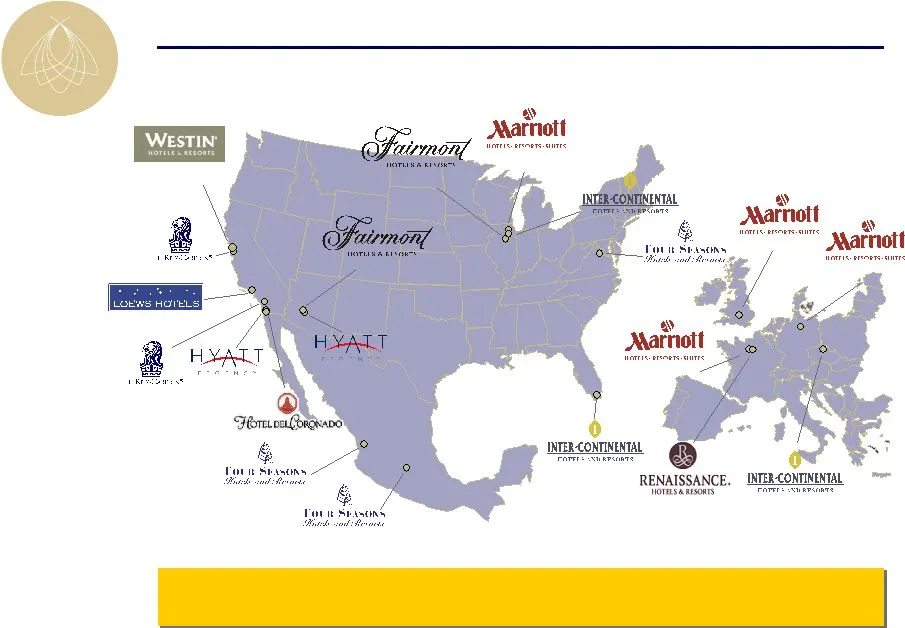
Paris, France Hamburg, Germany Prague, Czech Republic Chicago Mexico City Punta Mita Resort Phoenix at Civic Plaza Lincolnshire Resort Miami Half Moon Bay Mexico City Punta Mita Resort Miami Half Moon Bay Mexico City Punta Mita Resort Chicago Miami Santa Monica Beach Hotel Half Moon Bay La Jolla Was
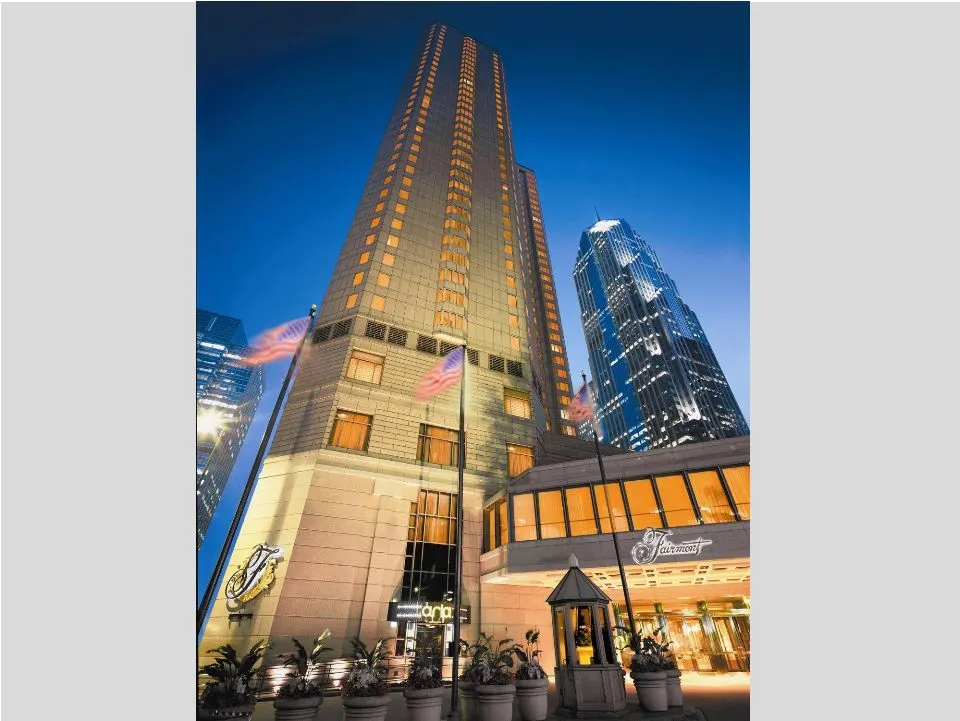
Slide 6: Fairmont Chicago
Fairmont Chicago
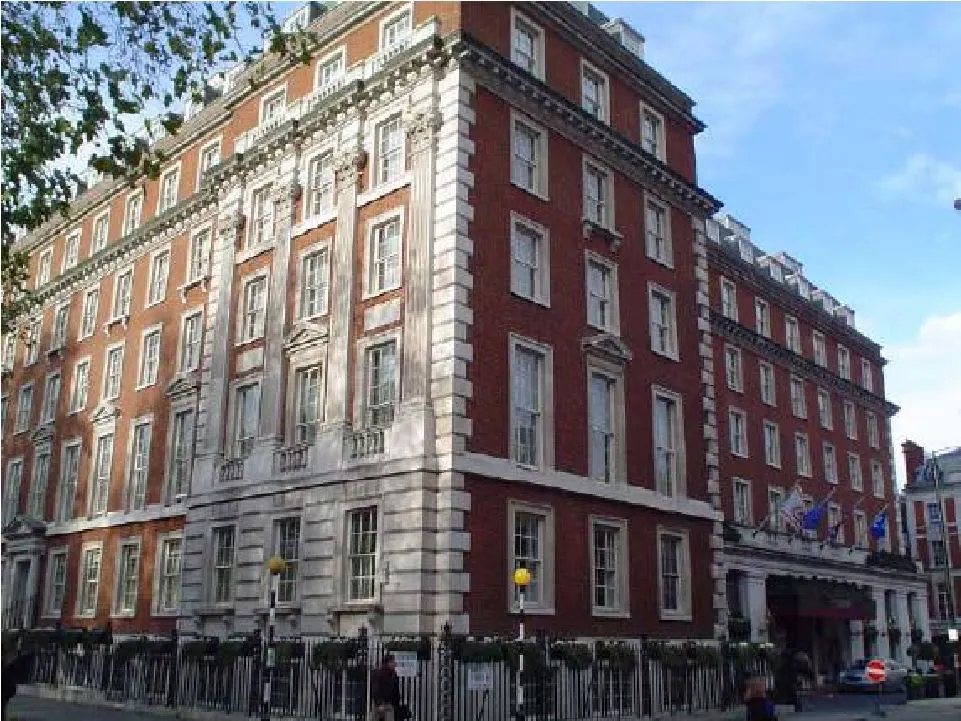
Slide 7: Marriott London Grosvenor Square
Marriott London Grosvenor Square
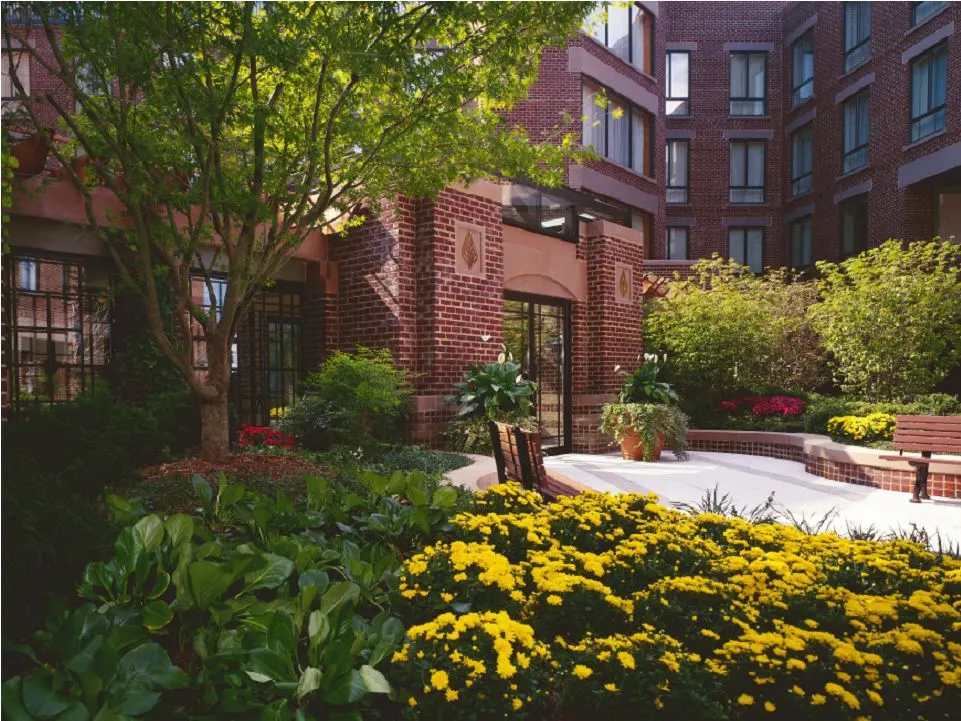
Slide 8: Four Seasons Washington, D.C.
Four Seasons Washington, D.C.
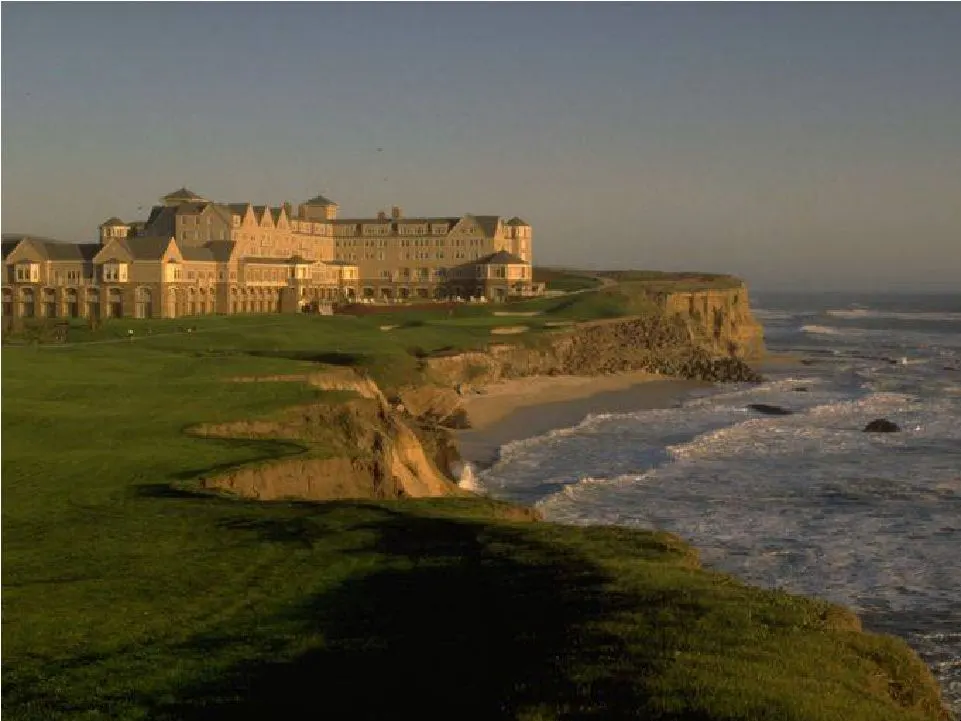
Slide 9: Ritz-Carlton Half Moon Bay
Ritz-Carlton Half Moon Bay
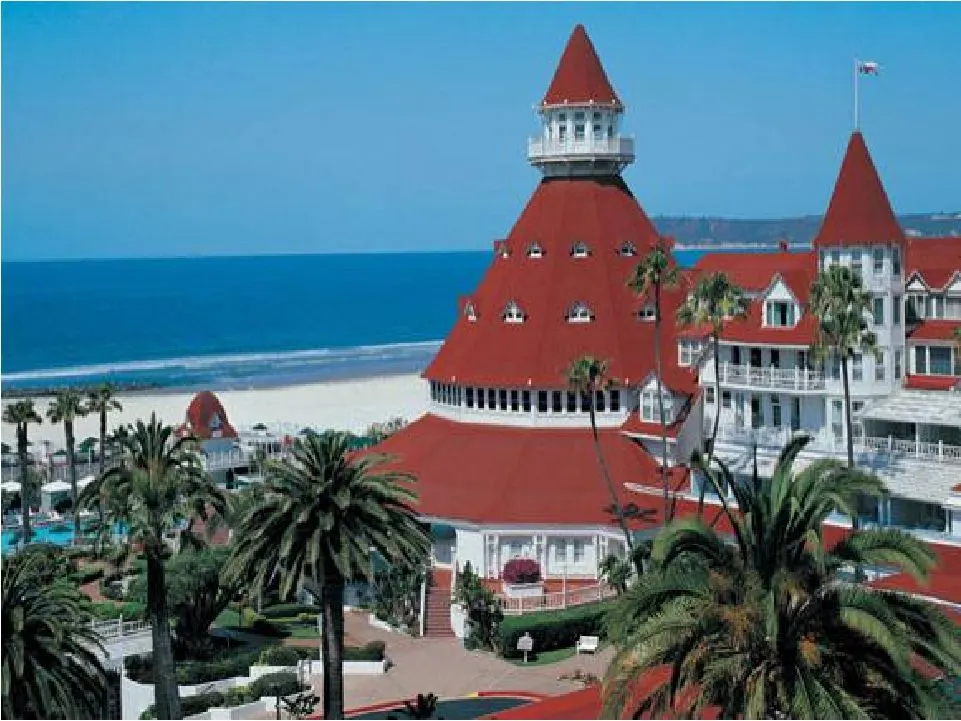
Slide 10: Hotel del Coronado
Hotel del Coronado
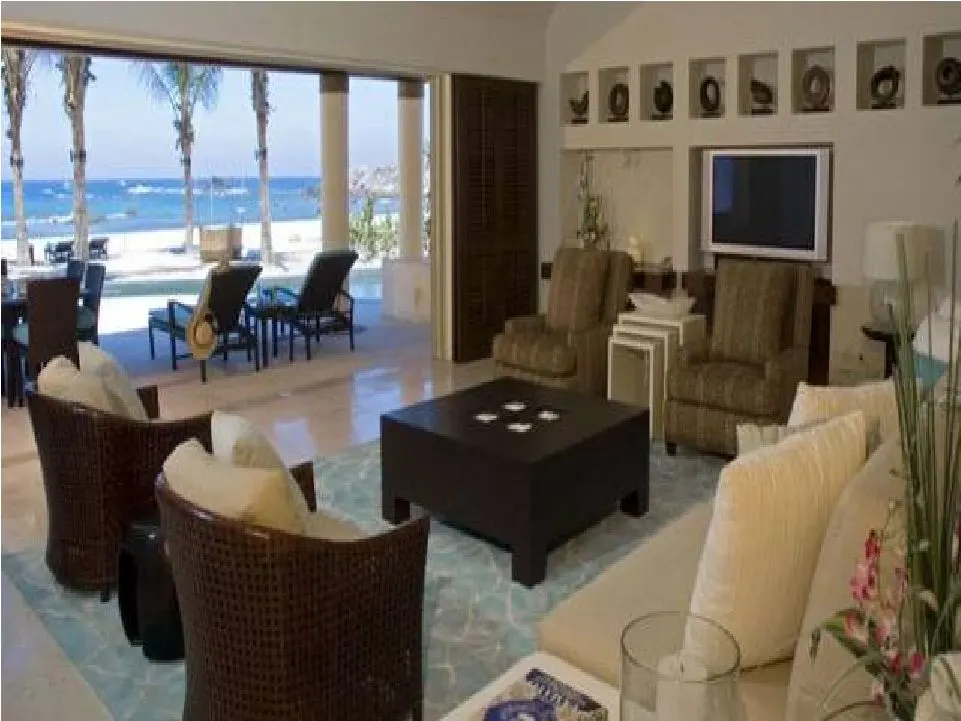
Slide 11: Four Seasons Punta Mita
Four Seasons Punta Mita
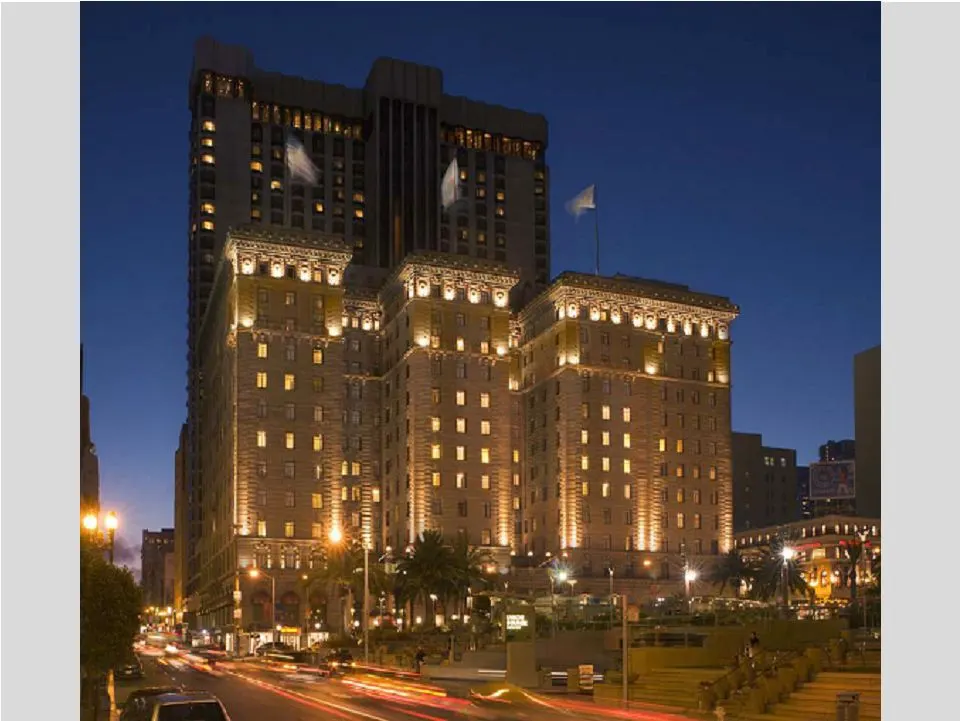
Slide 12: Westin St. Francis
Westin St. Francis
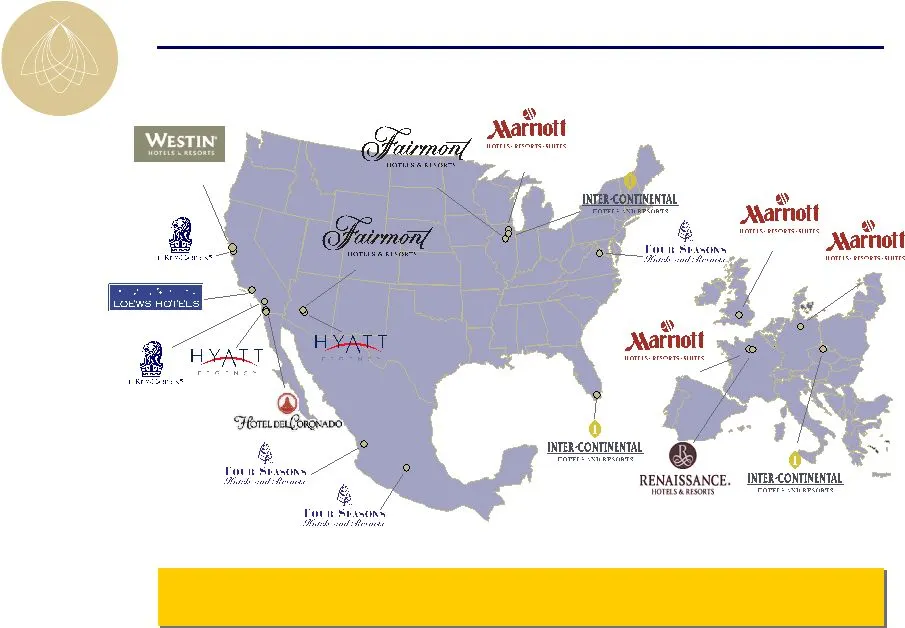
Slide 13: Portfolio Overview
Paris, France Hamburg, Germany Prague, Czech Republic Chicago Mexico City Punta Mita Resort Phoenix at Civic Plaza Lincolnshire Resort Miami Half Moon Bay Mexico City Punta Mita Resort Miami Half Moon Bay Mexico City Punta Mita Resort Chicago Miami Santa Monica Beach Hotel Half Moon Bay La Jolla Was
Slide 14: Operations
Food and beverage systems Labor management systems Management contract compliance Aggressive asset management oversight Operations
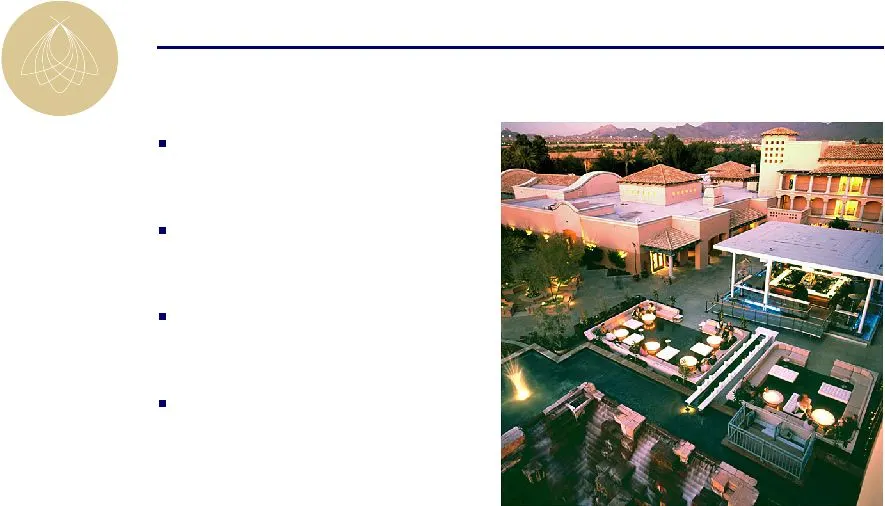
Slide 15: Master Planning Drives Reinvestment Strategy
Market research Develop master plan Identify discrete projects Execute in context of cycles Redevelopment Master Planning Drives Reinvestment Strategy
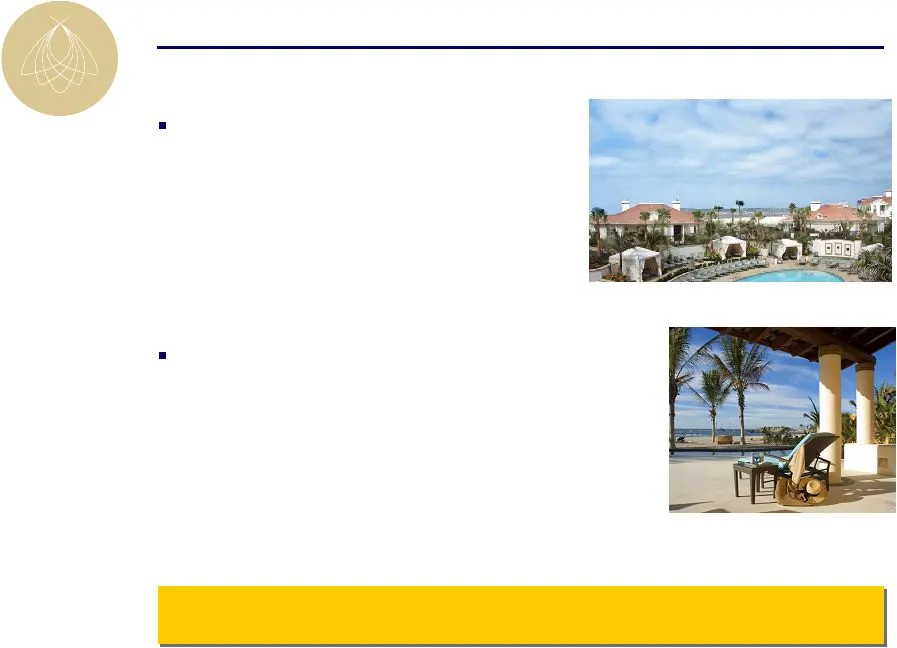
Slide 16: Collateral Opportunities
Collateral Opportunities Hotel del Coronado – Beach Club – Condominium hotel units – Retail Four Seasons Punta Mita – Expansion land (La Solana, H5) – Fractional and whole ownership residential – Retail, spa and food and beverage upgrades It’s Not Just About the Rooms!

Slide 17: Agenda
Company Overview First Quarter Results and Outlook Agenda
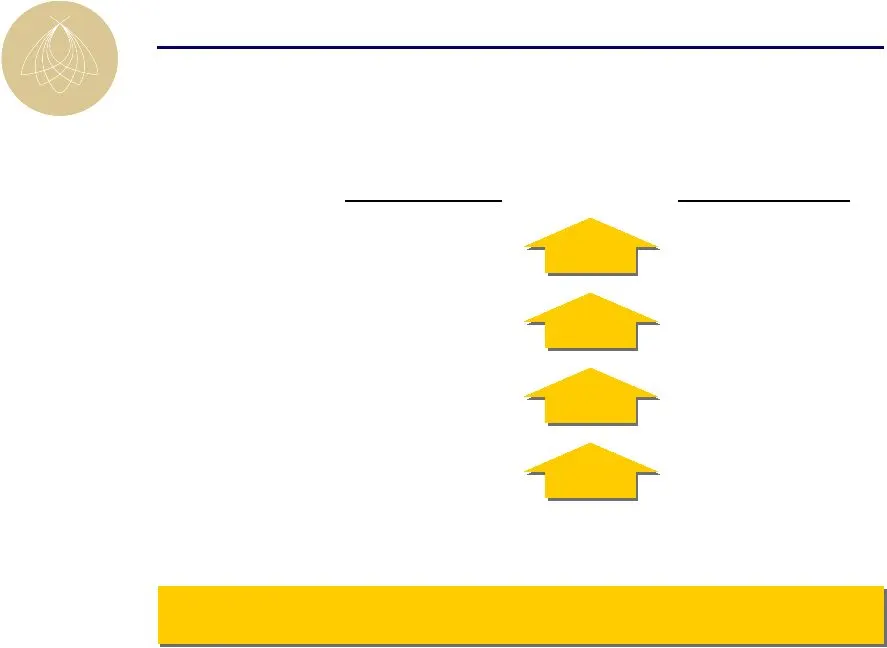
Slide 18: Q1 2008 Performance
Q1 2008 Performance North American Portfolio – Excluding Fairmont Chicago Q1 2007 Q1 2008 Total RevPAR $356.84 2.5% $365.91 RevPAR $191.41 3.1% $197.38 GOP Margin 37.5% 30 bps 37.8% FFO / Share $0.29 6.9% $0.31 Contingency Plans Saved 90 bps in Q1 EBITDA Margins

Slide 19: First Quarter Highlights and Trends
First Quarter Highlights and Trends Four month RevPAR increase of 5.5% Moderate slowing in demand – Diminishing lag between GDP and lodging demand – 87% of group business on the books – Modest weakness in weekend transient business
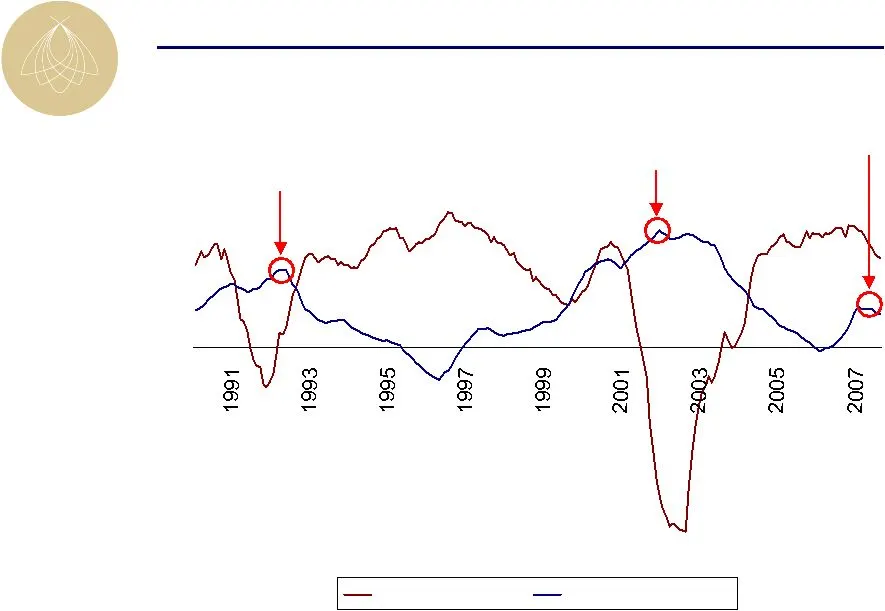
Slide 20: Historical RevPAR Growth
-20 -15 -10 -5 RevPAR % Chg Supply % Change Historical RevPAR Growth Luxury 7.4% 11.3% 0.9%
Slide 21: 2008 Strategies
Key 2008 Strategies Revenue management Property level cost management Corporate level cost management Preserve corporate liquidity – Defer capital expenditures – Execute select asset sales
Slide 22: Dave Hogin, Vice President, Asset Management
Dave Hogin Vice President, Asset Management

Slide 23: Agenda
Company Overview First Quarter Results and Outlook Overview of Chicago Market Agenda
Slide 24: Chicago Lodging Market
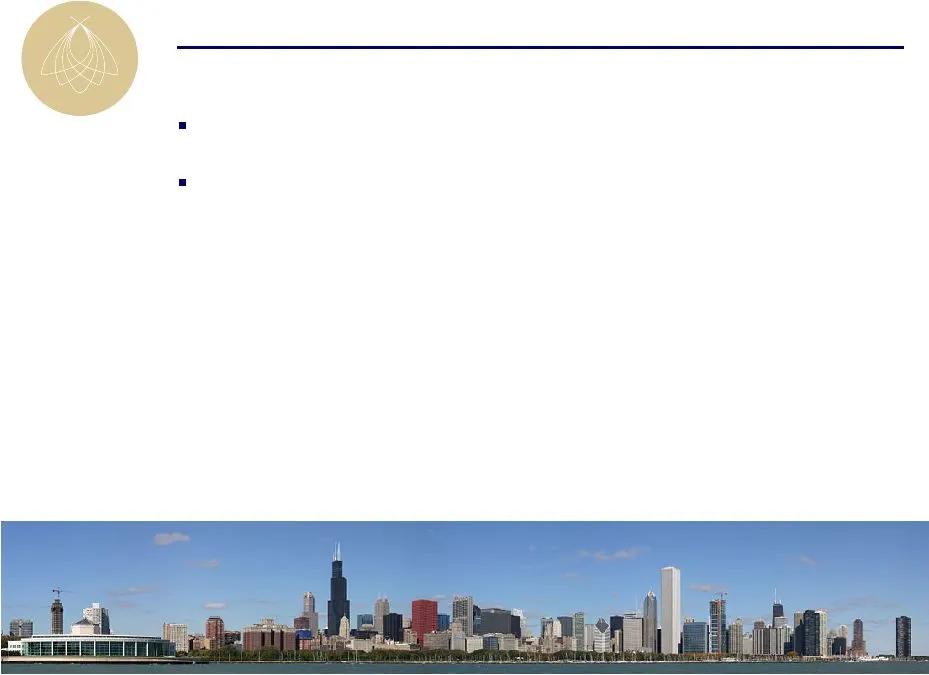
Chicago Lodging Market Third largest convention city in the U.S. McCormick Place convention facility is largest in the U.S. – Recently completed $850 million, 470,000 square foot expansion – 3 million visitors annually – 2.7 million square feet of exhibit halls – 700,000 square feet of meeting room
Slide 25: Limited Competitive Supply Growth
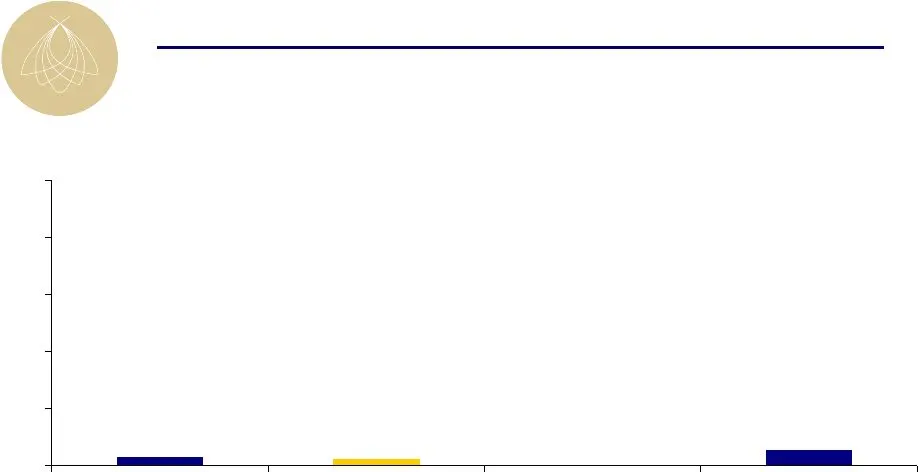
Limited Competitive Supply Growth Trump – 286 rooms Aqua – 213 rooms JW Marriott – 550 rooms Fairmont Chicago Competitive Set 0.3% 0.2% 0.0% 0.5% 0.0% 2.0% 4.0% 6.0% 8.0% 10.0% 2008 2009 2010 2011
Slide 26: Agenda
Company Overview First Quarter Results and Outlook Overview of Chicago Market Fairmont Chicago / Aqua Master Plan Agenda

Slide 27: Fairmont Chicago Overview
Fairmont Chicago Overview Acquired in September 2005 $154.7 million purchase price; $224,000 per key 692 guestrooms; 62,000 square feet of meeting space Fairmont is positioned as the luxury meetings hotel $45 million renovation to be completed in May 2008 EBITDA increase of 22% since acquisition

Slide 28: Prime Location
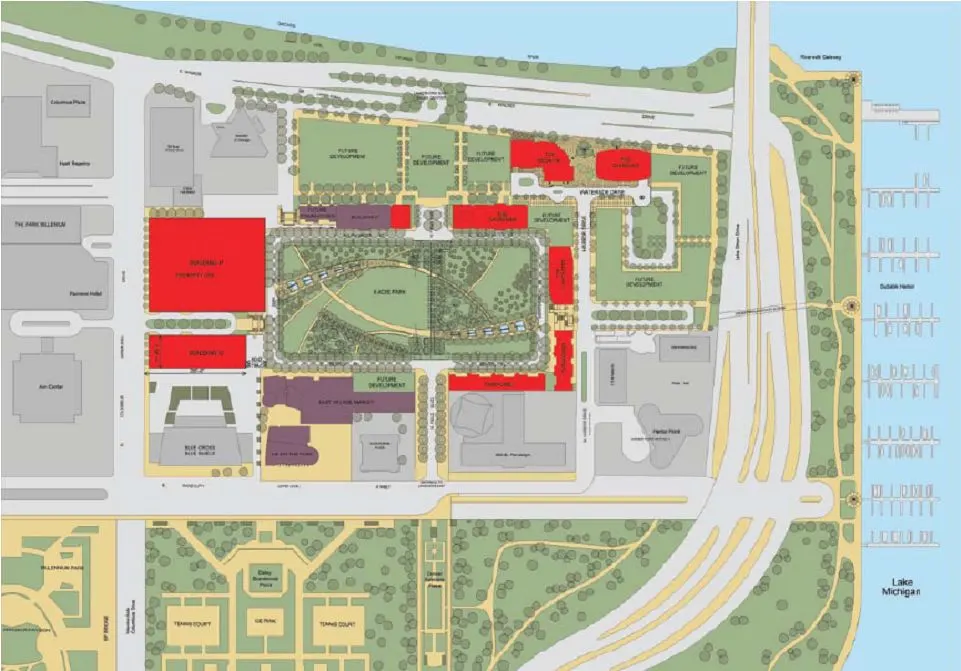
Prime Location Activity continues to move south on Michigan Ave. 24.5-acre Millennium Park completed July 2004 – Considered the largest roof garden in the world – Formerly a railroad yard 28-acre Lakeshore East Development – 4,950 residences – 2.2 million SF of commercial space – 770,000 SF of retai
Slide 29: SS Rory ‘Bo.
SS Rory ‘Bo. ce | os 900 c9e00000 °° 8 00 2-6-5 0? ; a | i ot aa I i i i b ys

Slide 30: Master Plan Overview
Master Plan Overview Position the hotel as the premier high-end group hotel in Chicago Update into a more contemporary-luxury theme Improve food and beverage operations Redevelop underutilized and empty space Increase suite / room mix
Slide 31: Master Plan Overview
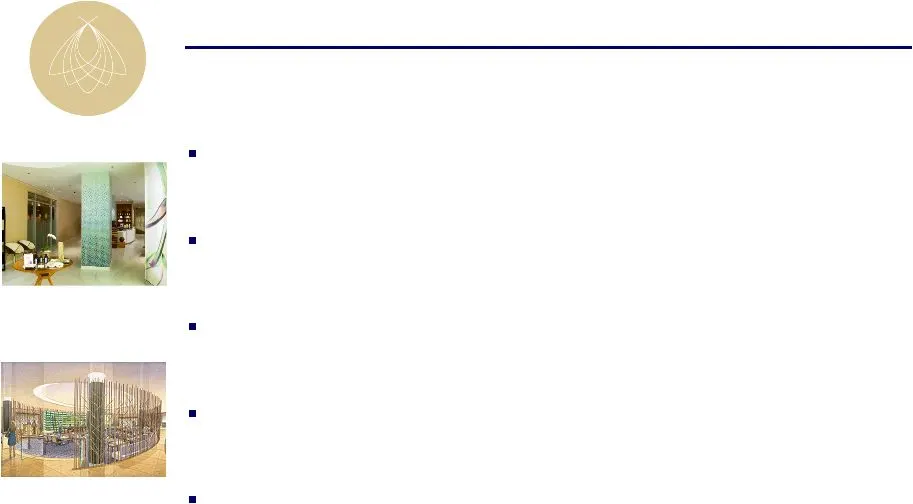
Master Plan Overview Fairmont Gold lounge MySpa; luxury spa and fitness center Complete renovation of guestrooms Reposition lobby and reception area ENO wine tasting room within lobby MySpa Lobby Renovation
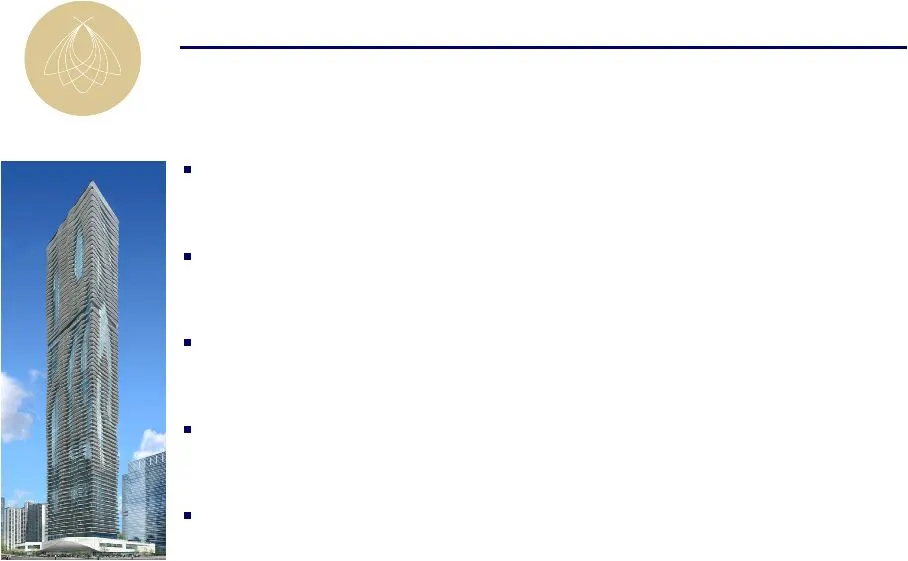
Slide 32: Aqua Building Expansion
Aqua Building Expansion Contracted to buy 15 floors of adjacent “Aqua” tower 213 guestrooms, mostly suites which average 680 SF 27,500 SF of meeting space including 17,000 SF glazed ballroom Early 2010 projected opening date Connected to Fairmont via underground pedway Aqua Building Rendering
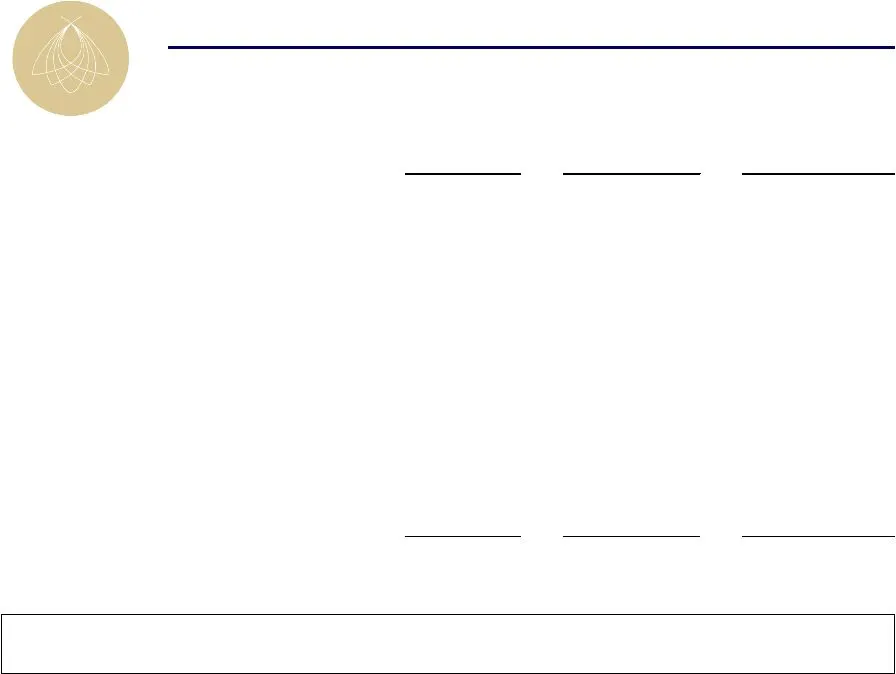
Slide 33: Competitive Set
Competitive Set Rooms Meeting Space Meeting Space / Room Hyatt Regency 2,019 228,000 SF 113 SF Sheraton 1,209 225,000 SF 186 SF Hilton 1,544 234,000 SF 152 SF The Palmer House 1,640 139,900 SF 85 SF Westin River North 28,000 SF 69 SF Renaissance Marriott 34,870 SF 63 SF The Drake 30,000 SF 56 SF Wes

Slide 34: Combined Fairmont Operations
Combined Fairmont Operations Connected and integrated with existing Fairmont hotel Increased suite mix up to 25% Increased ratio of meeting space per key up to 100 square feet Fairmont Aqua Total Standard Guestroom Fairmont Gold Room Suite Presidential / Grand Suite Total Rooms Total Meeting Space 6

Slide 35: Agenda
Company Overview First Quarter Results and Outlook Overview of Chicago Market Fairmont Chicago / Aqua Master Plan Q&A Agenda

Slide 36: Strategic Hotels & Resorts
STRATEGIC Hotels 5 Resorts
Source: SEC EDGAR · 8-K filed May 14, 2008
More decks from Strategic Hotels and Resorts Inc
 Investor Presentation (June 2015)43 slides · Jun 1, 2015
 Investor Presentation (February 2015)43 slides · Feb 24, 2015
 Investor Presentation (January 2015)44 slides · Jan 26, 2015
 Investor Presentation (November 2014)50 slides · Nov 5, 2014
 Investor Presentation (October 2014)50 slides · Oct 3, 2014
 Investor Day (September 2014)67 slides · Sep 22, 2014