Nymex — Citigroup Financial Services Conference 2007
24 slides from Nymex's conference presentation, Jan 31, 2007
Slide 1: Citigroup Financial Services Conference January 31, 2007
Citigroup Financial Services Conference January 31, 2007 Exhibit 99.1
Slide 2: Forward-looking statements Safe Harbor Statement
1 Forward-looking statements Safe Harbor Statement Statements contained in this Presentation that are not based on current or historical fact are forward-looking in nature. Such forward-looking statements are based on current plans, estimates and expectations and are made pursuant to the Private Sec
Slide 3: NYMEX Presenters
2 NYMEX Presenters James Newsome, Ph.D. Kenneth Shifrin Director, President and Chief Executive Officer Chief Financial Officer

Slide 4: Business overview
3 Business overview James E. Newsome President and Chief Executive Officer, Director
Slide 5: Record Financial Performance in 2006
4 Record Financial Performance in 2006 Operating Revenues up 49% Net Earnings increased 118%, with diluted EPS reaching $1.90 Average Daily Volume rose to 1.2 million contracts, up 40% Pre-tax Margin expanded to 60% from 41%
Slide 6: 2006 milestones
5 2006 milestones Agreement with CME and migration to the CME Globex® electronic trading platform Enhanced corporate governance structure Side-by-side trading COMEX agreement Continued global focus Initial Public Offering
Slide 7: Key highlights
6 Key highlights A leading exchange in the fast growing energy and metals markets Hybrid, side-by-side platform with access to industry leading technology Strong growth with significant operating leverage and margins Robust product set with continued innovation and global focus Well capitalized whol
Slide 8: LS | [F]
LS | [F] SeNYMEX ka

Slide 9: SeNYMEX
SeNYMEX

Slide 10: SeNYMEX
SeNYMEX

Slide 11: Global benchmark contracts
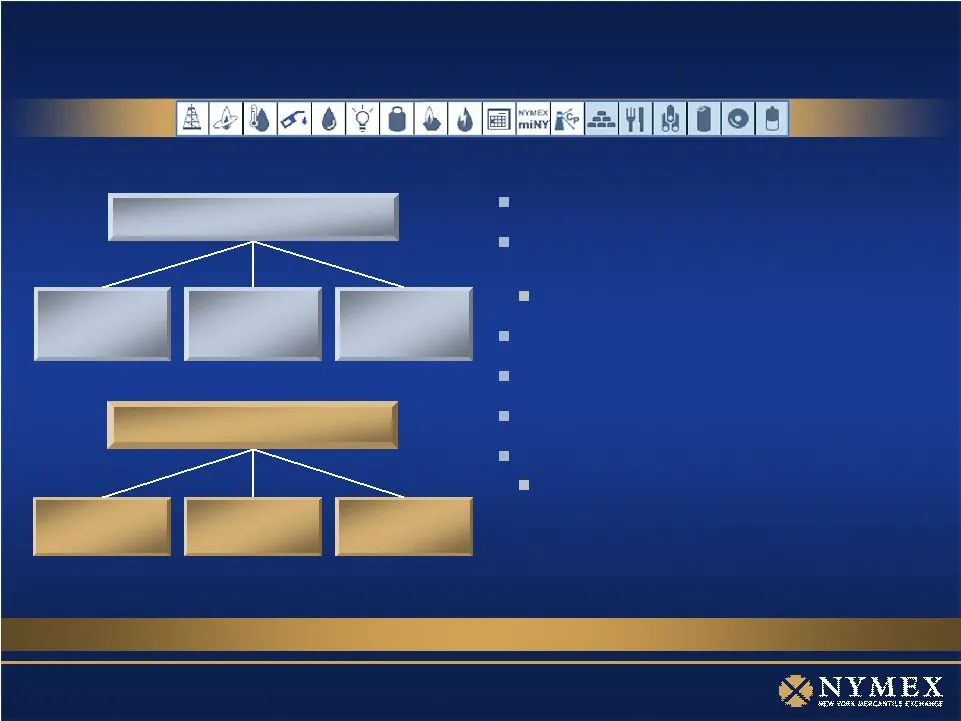
7 Global benchmark contracts Energy Metals Light sweet crude Henry Hub natural gas NY heating oil NY harbor gasoline Gold Silver High grade copper
Slide 12: The leading and most established physical commodity-based futures exchange
8 135 years of operations 1.2 million average daily volume as of December 31, 2006 +40% versus 2005 Strong start to 2007 Market dominance in open interest Physical delivery 7 benchmark contracts in energy and metals Benchmark settlement prices The leading and most established physical commodity-base
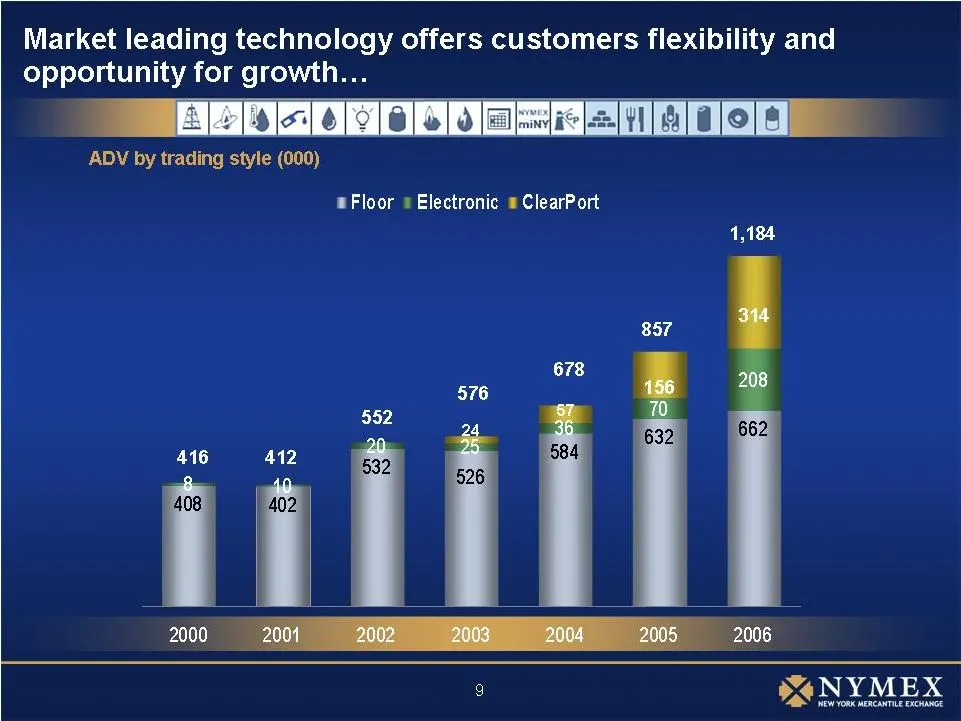
Slide 13: Market leading technology offers customers flexibility and opportunity for growth
Market leading technology offers customers flexibility and opportunity for growth... ADV by trading style (000) mFloor «Electronic = ClearPort 1,184 857 678 : 576 552 me : 632 662 4160412 2 M: 4 526 | 408 I) 402 2000 2006 : NYMEX
Slide 14: Industry growth drivers
10 Leading position in fast-growing energy and metals markets Acceptance as credit risk management tools Desire to hedge market exposure, portfolio diversification Electronic access growth Underlying price volatility New market participants Industry growth drivers
Slide 15: NYMEX ClearPort Clearing
11 NYMEX ClearPort ® Clearing High margin business Flexibility for new product introductions Leverages financial strength of clearinghouse Internally-developed contracts for the off-exchange market Off-exchange, bilaterally negotiated futures and options contracts
Slide 16: Options have been a significant driver of growth
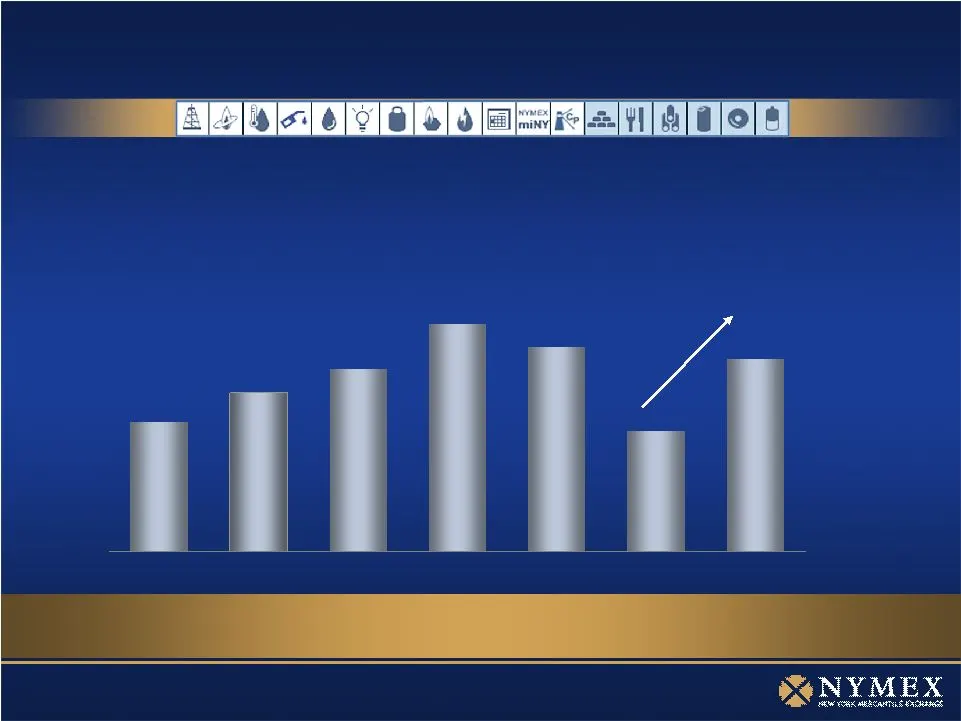
12 Options have been a significant driver of growth NYMEX pioneered options on energy and precious metals futures contracts, and has the deepest liquidity in these options contracts ¹ September 2006 Q4 '05 Q1 '06 Q2 '06 Q3 '06 Q4 '06 FY 2005 FY 2006 YoY growth 61% Option average daily volume (000)
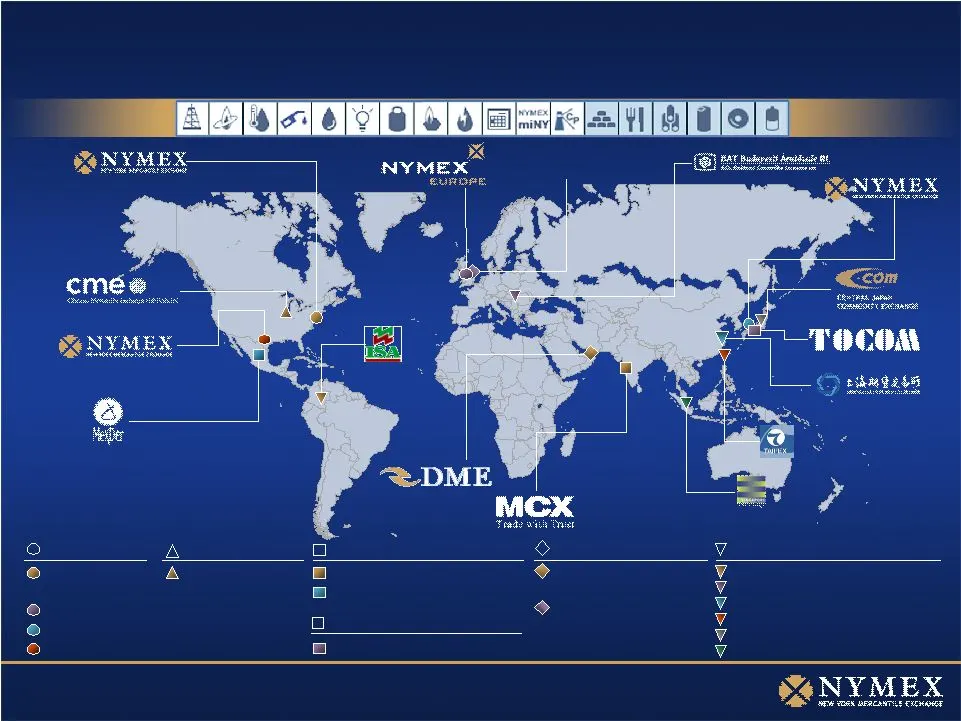
Slide 17: Global reach through international alliances and joint ventures
13 Global reach and penetration through international alliances and joint ventures Russian Energy Futures, Ltd. NYMEX NYC (headquarters) NYMEX London CME Globex contract Dubai Mercantile Exchange (with Tatweer Dubai LLC) Russian Energy Futures (with Expertica Limited) Multicommodity Exchange of Indi
Slide 18: Innovation in new product introductions
14 Innovation in new product introductions Innovation is key to NYMEX’s success Over 100 new products introduced in 2006 : 3-2-1 Plus Energy Index Futures Contract Focus on metals and international products : 6 new soft commodity futures contracts on NYMEX ClearPort® New New
Slide 19: Market data business
15 Market data business High Margins Low Incremental Costs Scalability

Slide 20: Financial highlights
16 Financial highlights Kenneth Shifrin Chief Financial Officer
Slide 21: Strong 2006 Fourth Quarter Results
17 Strong 2006 Fourth Quarter Results Increase of 40% to a record $124.8 million Increase of 41% to $104.8 million Increase of 43% to $16.4 million Decrease of 16% to $38.5 million Increase of 105% to $42.3 million 64% vs. 44% $0.48 $0.46 Total operating revenue: Clearing & Transaction fees: Market
Slide 22: Record 2006 Full Year Results
18 Record 2006 Full Year Results Increase of 49% to a record $497.2 million Increase of 51% to $419.7 million Increase of 43% to $63.6 million Decrease of 2% to $174.4 million Increase of 118% to $154.8 million 60% vs. 41% $1.90 Total operating revenue: Clearing & Transaction fees: Market data fees:
Slide 23: 2006 Balance Sheet Highlights
19 2006 Balance Sheet Highlights $504 million which includes the proceeds of $348 million from the IPO in November 2006 $486 million $11 million Goodwill and Indefinite Life Intangible Asset includes the acquisition of COMEX electronic trading rights valued at $281 million Cash and Marketable Securi
Slide 24: NYMEX
NYMEX Heinen HONE
Source: SEC EDGAR · 8-K filed Jan 31, 2007
More decks from Nymex Holdings Inc
 Nymex Holdings — Merger or Acquisition (July 2008)14 slides · Jul 30, 2008
 Proxy Contest (June 2008)9 slides · Jun 19, 2008
 Fox Pitt Kelton Conference 200826 slides · May 21, 2008
 Nymex Holdings — Merger or Acquisition (March 2008)16 slides · Mar 17, 2008
 Merger or Acquisition (October 2006)12 slides · Oct 26, 2006
 Shareholder Meeting (September 2005)19 slides · Sep 29, 2005