Guaranty Bancorp — Sandler O'Neill + Partners West Coast Financial Services Conference 2015
25 slides from Guaranty Bancorp's conference presentation, Mar 10, 2015
Slide 1: Sandler O'Neill West Coast Financial Services Conference
G GUARANTY BANCORP” Sandler O'Neill + Partners West Coast Financial Services Conference Phoenix, AZ March 11, 2015
Slide 2: Forward Looking Statements
Forward Looking Statements a This presentation contains forward-looking statements, which are included in acoordance with the “safe harbor provisions ofthe Private Secures Litigation Reform Act of 1995. In some cases, you can identfy forward-looking statements by terminology such as" may, “will” “sh
Slide 3: About Us - Guaranty Bancorp
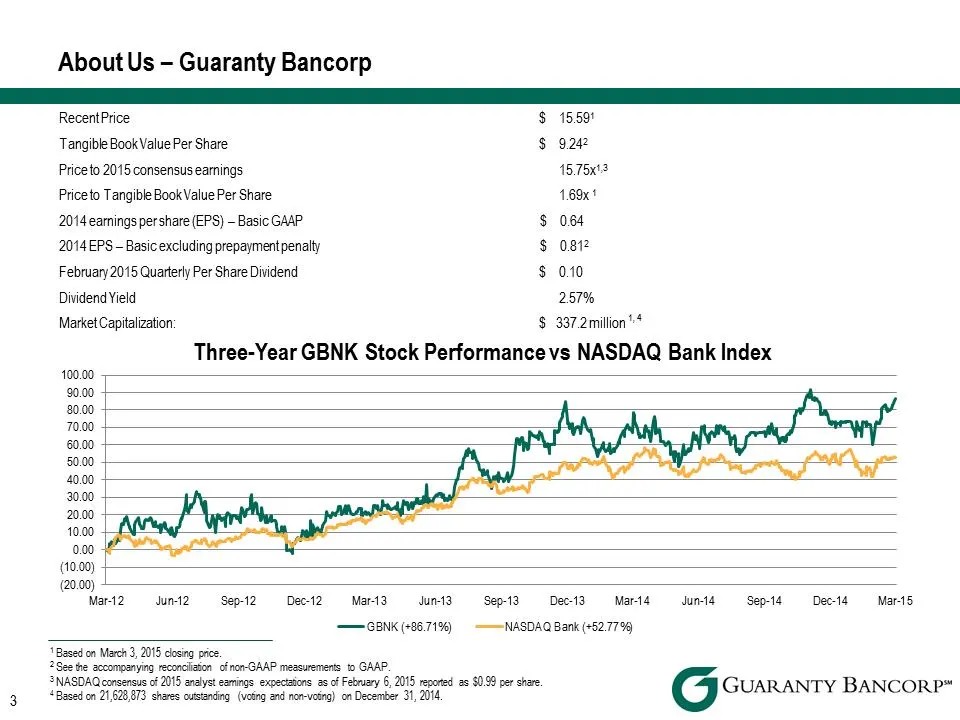
About Us - Guaranty Bancorp a RecentPrice $ 1559 Tangible Book Value Per Share $ 924 Priceto 2015 consensus earings 15 T75x'2 Priceto Tangible Book Value Per Share 1.69x' 2014 earings pershare (EPS) - Basic GAAP $ 064 2014 EPS — Basic excluding prepaymentpenalty $ 081 February 2015 Quarterly Per Sha
Slide 4: About Us - Guaranty Bancorp
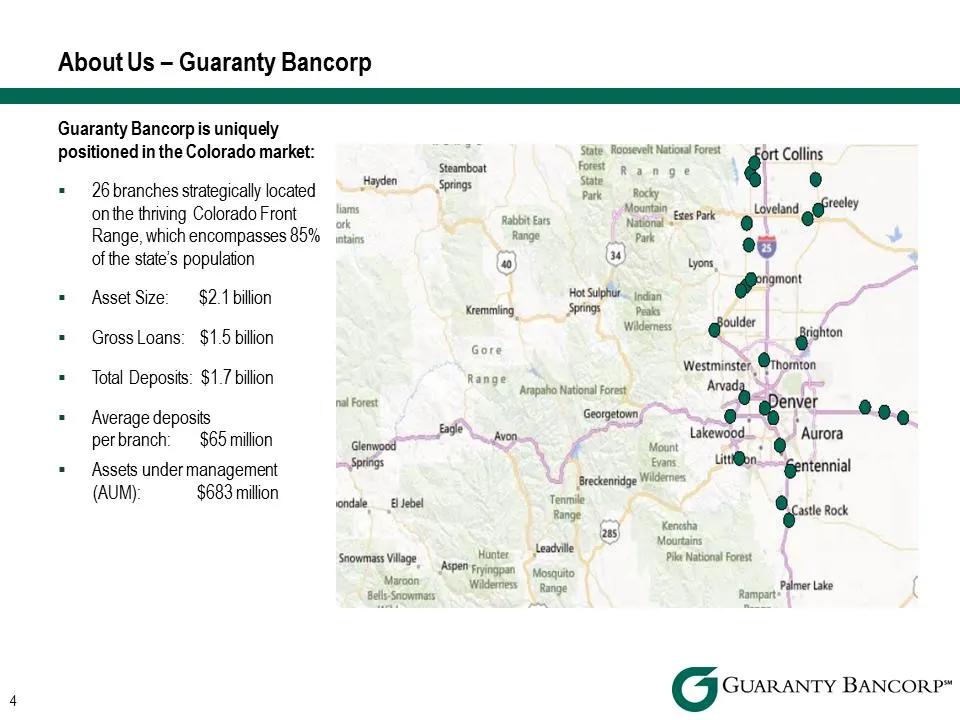
About Us - Guaranty Bancorp Guaranty Bancorp is uniquely positioned in the Colorado market: = — 26 branches strategically located a onthe thriving Colorado Front ine Range, which encompasses 85% stain: of the state's population = Asset Size: $2.1 billion = GrossLoans: $1.5 billion = Total Deposits:
Slide 5: Investment Considerations
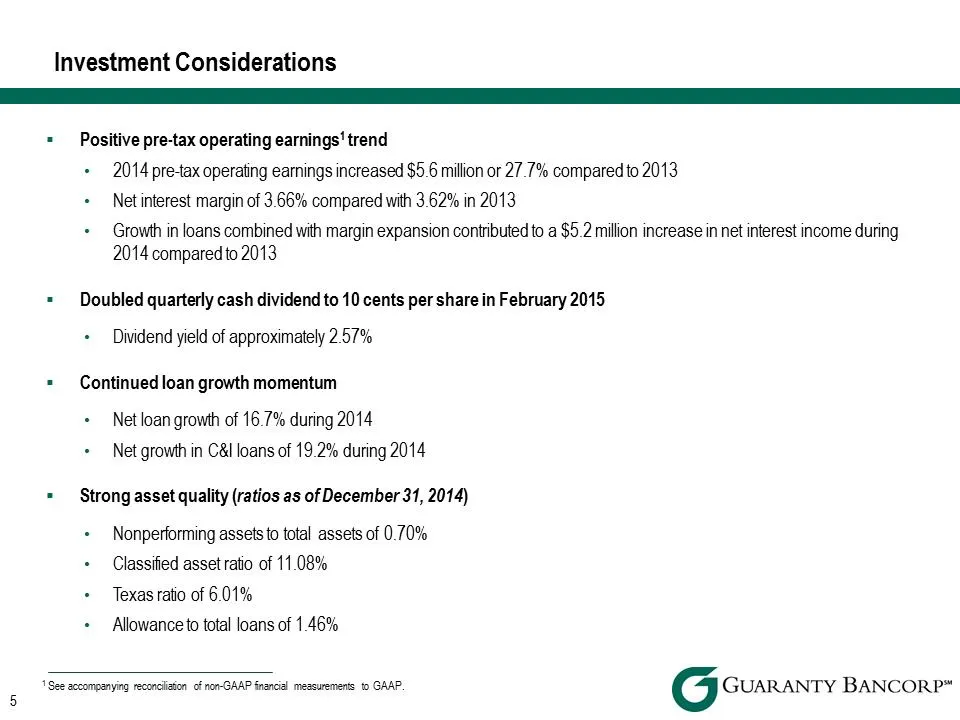
Investment Considerations a = Positive pre-tax operating earnings’ trend 2014 pre-tax operating earnings increased $5.6 million or 27.7% compared to 2013 Net interest margin of 3.66% compared with 3.62% in 2013 Growth in loans combined with margin expansion contributed to a $5.2 million increase in
Slide 6: Investment Considerations
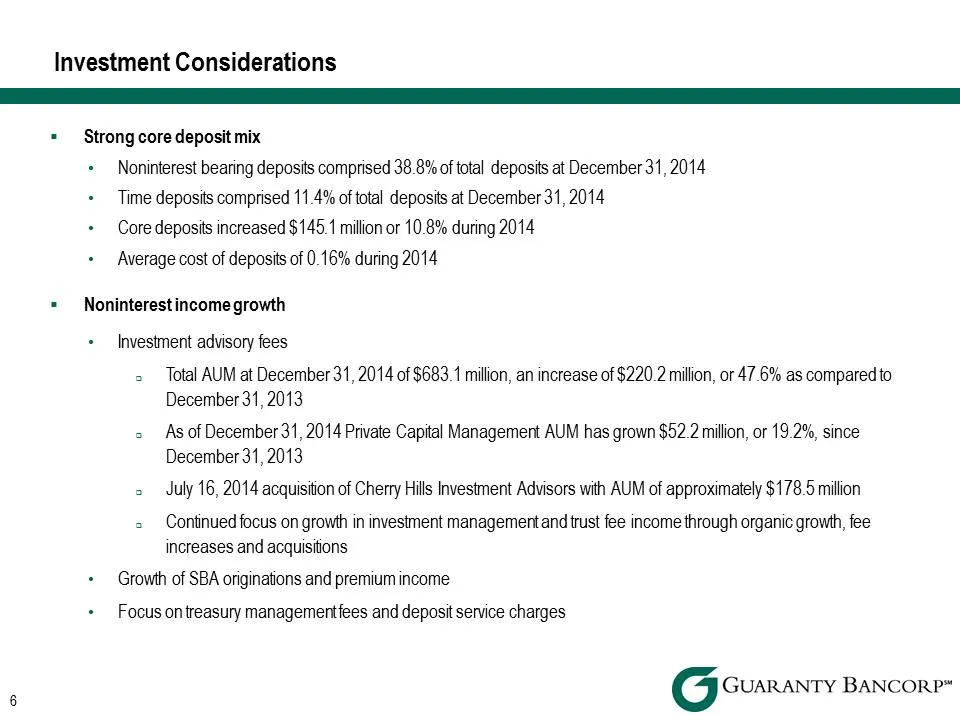
Investment Considerations a = — Strong core deposit mix Noninterest bearing deposits comprised 38.8% of total deposits at December 31, 2014 Time deposits comprised 11.4% of total deposits at December 31, 2014 Core deposits increased $145.1 million or 10.8% during 2014 Average cost of deposits of 0.1
Slide 7: Investment Considerations
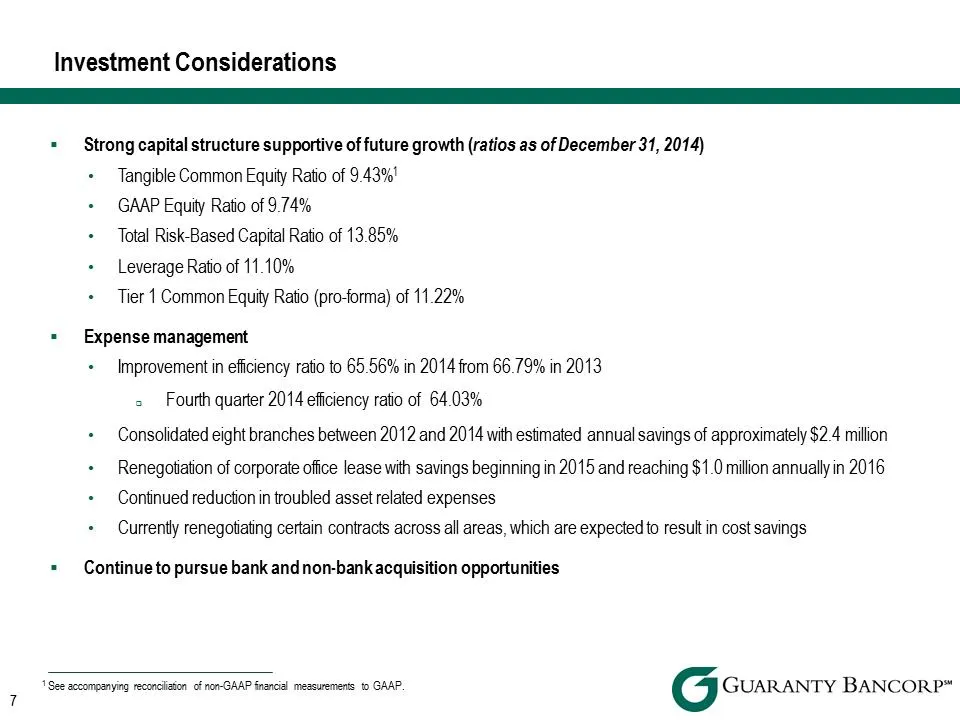
Investment Considerations a = — Strong capital structure supportive of future growth (ratios as of December 31, 2014) Tangible Common Equity Ratio of 9.43%! GAAP Equity Ratio of 9.74% Total Risk-Based Capital Ratio of 13.85% Leverage Ratio of 11.10% Tier 1 Common Equity Ratio (pro-forma) of 11.22% =
Slide 8: Net Interest Income
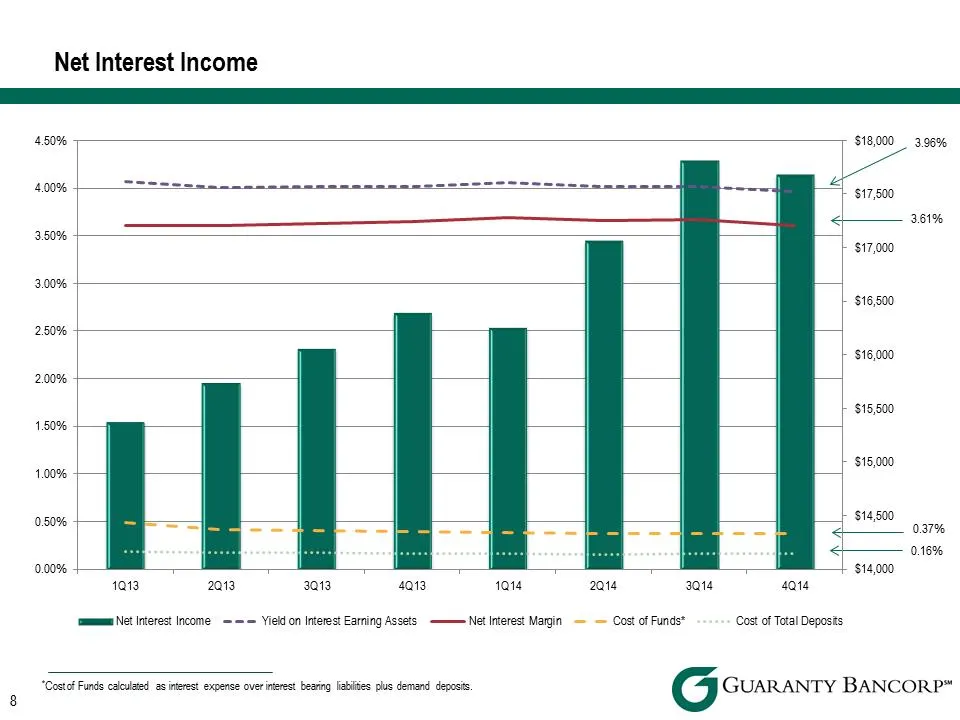
Net Interest Income 450% $18,000 3.96% asuetosrers., 4 400% $17,500 <__ 361% 3.50% $17,000 3.00% $16,500 2.50% $16,000 2.00% $15,500 150% $15,000 1.00% $14,500 0.50% == — — =< = =e 4 om < 0.16% 0.00% $14,000 1013 2a1a 3013 4a1a 1014 zat sata sata ‘mms Net Inirest Income === Yield on Interest Earning
Slide 9: Core Noninterest Income
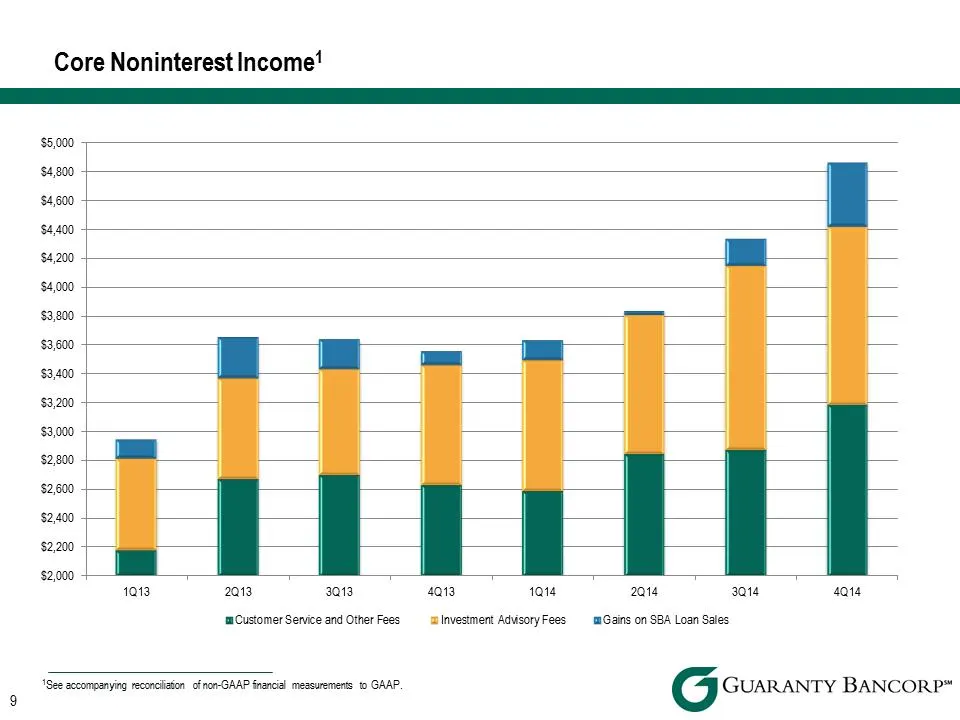
Core Noninterest Income’ $5,000 $4,800 $4,600 $4,400 $4,200 $4,000 $3,800 $3,600 $3,400 $3,200 $3,000 $2,800 $2,600 $2,400 $2,200 $2,000 2013 3013 4013 3014 414 1013 1014 2014 Customer Semvice and Other Fees si lnvesiment AdvisoryFees Gains on SBA Loan Sales ‘See accompanying reconciaion ofnor GAAP
Slide 10: Loan Composition
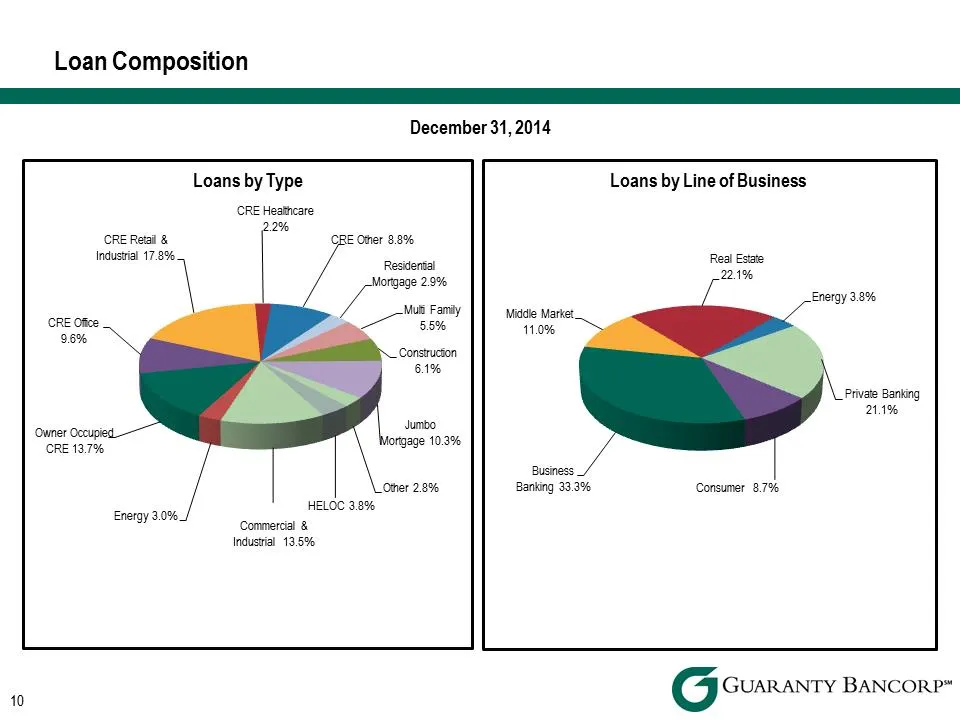
Loan Composition December 31, 2014 Loans by Type ORE Heatncare 2% OBE Otter 8.9% Residental Morigage 2.9% HELOC 2.8% Commercial & Industrial 13.5% Loans by Line of Business Energy 38% Middle Market, 11.0% Business: Banking 33.3% Consumer 8.7% 10 G GUARANTY BANCORP”
Slide 11: Loan Growth
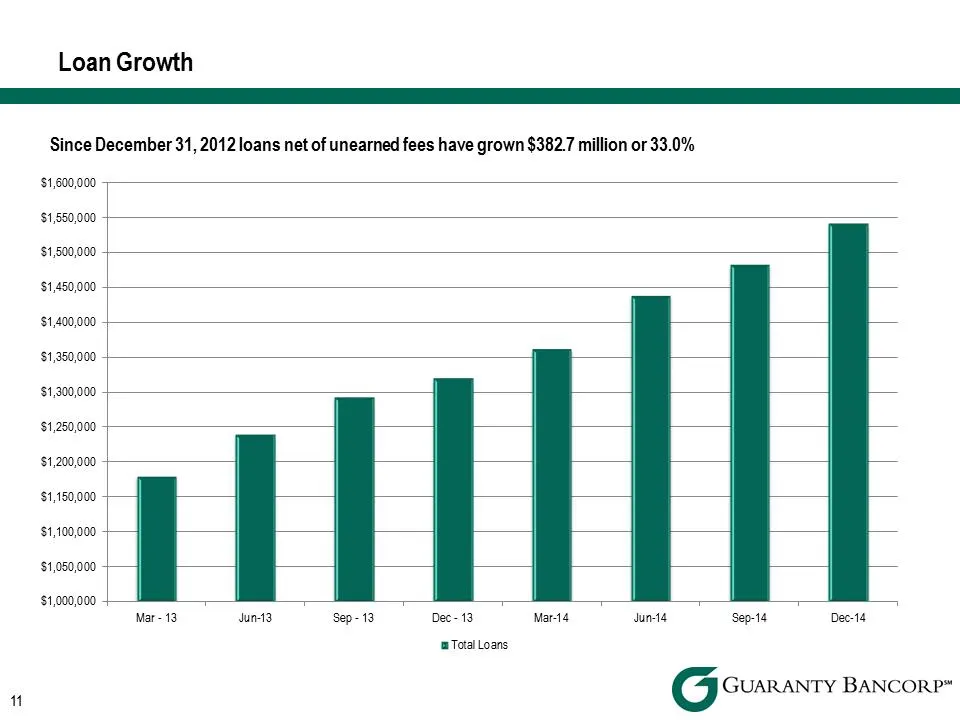
Loan Growth 1 Since December 31, 2012 loans net of unearned fees have grown $382.7 million or 33.0% $1,600,000 $1,850,000 $1,500,000 $1,450,000 $1,400,000 $1,350,000 $1,300,000 $1,250,000 $1,200,000 $1,180,000 $1,100,000 $1,050,000 $1,000,000 Mar- 13 Junt3 Dec- 13 Total Loans Marsa sunt Dec-14 igi G
Slide 12: Deposit Composition
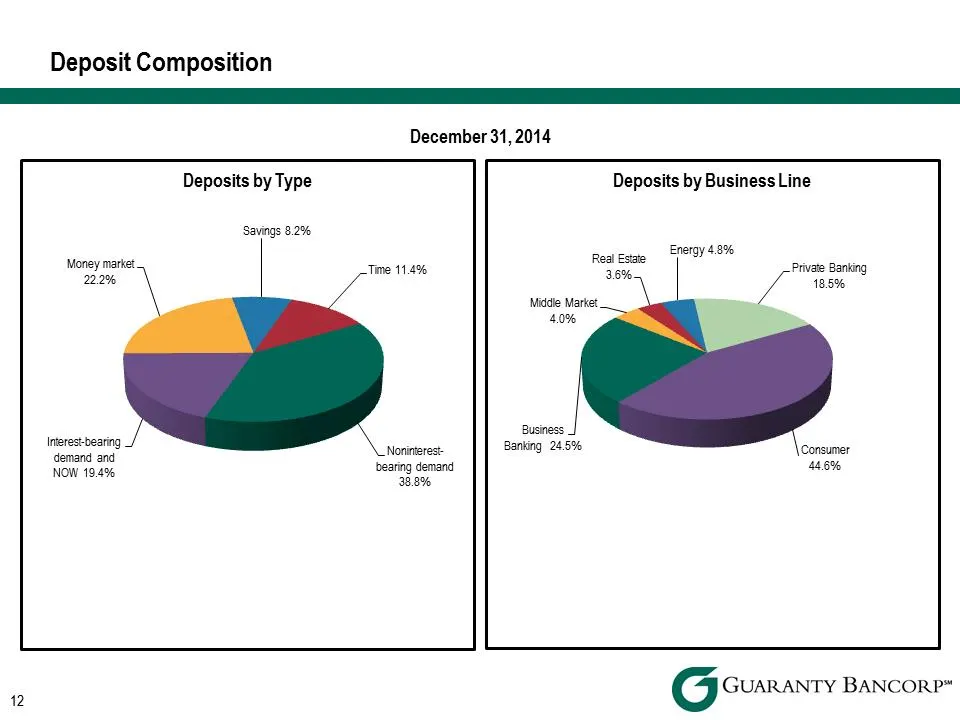
Deposit Composition a December 31, 2014 Deposits by Type Deposits by Business Line Savings 8.2% Money mart Tee 114% 22% Interest bearing Banking 245% ‘dong said Noninierest- 9 NONI IK bearing demand 38.8% 5 G GUARANTY BANCORP”
Slide 13: Deposit Levels
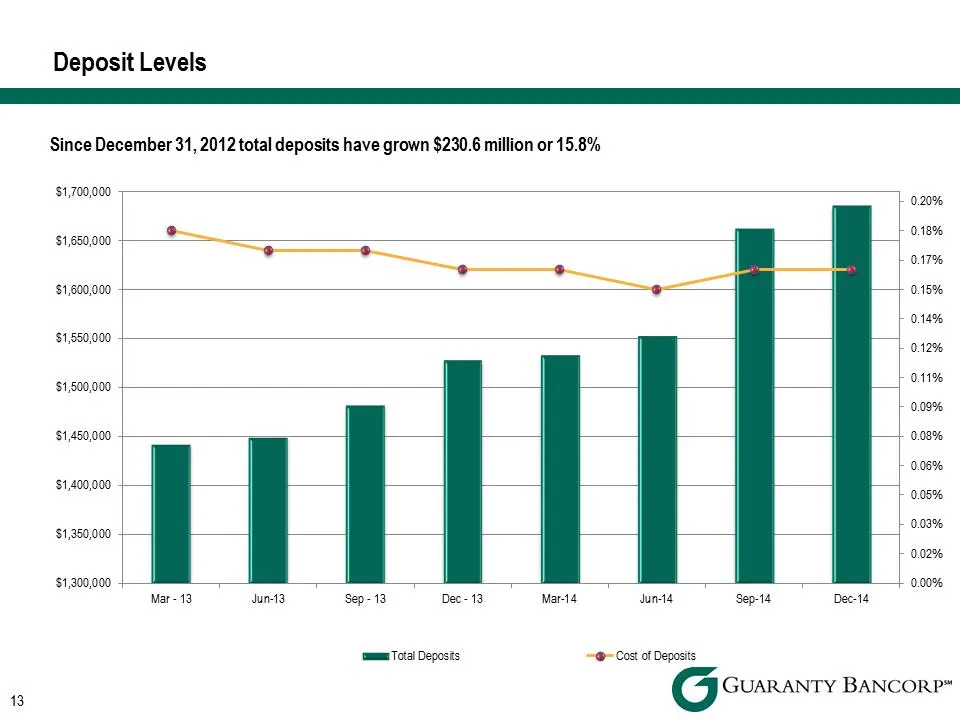
Deposit Levels Since December 31, 2012 total deposits have grown $230.6 million or 15.8% $1,700,000 aap 0.18% $1,660,000 0.47% $1,600,000 0.18% 0.18% $1,860,000 0.412% $1,500,000 ote 0.09% $1,450,000 0.08% 0.06% $1,400,000 0.05% 0.03% $1,360,000 0.02% $1,300,000 0.00% Mar 13 Junt3 Sep-13 Dec 13 Mari
Slide 14: Pre-tax Operating Earnings
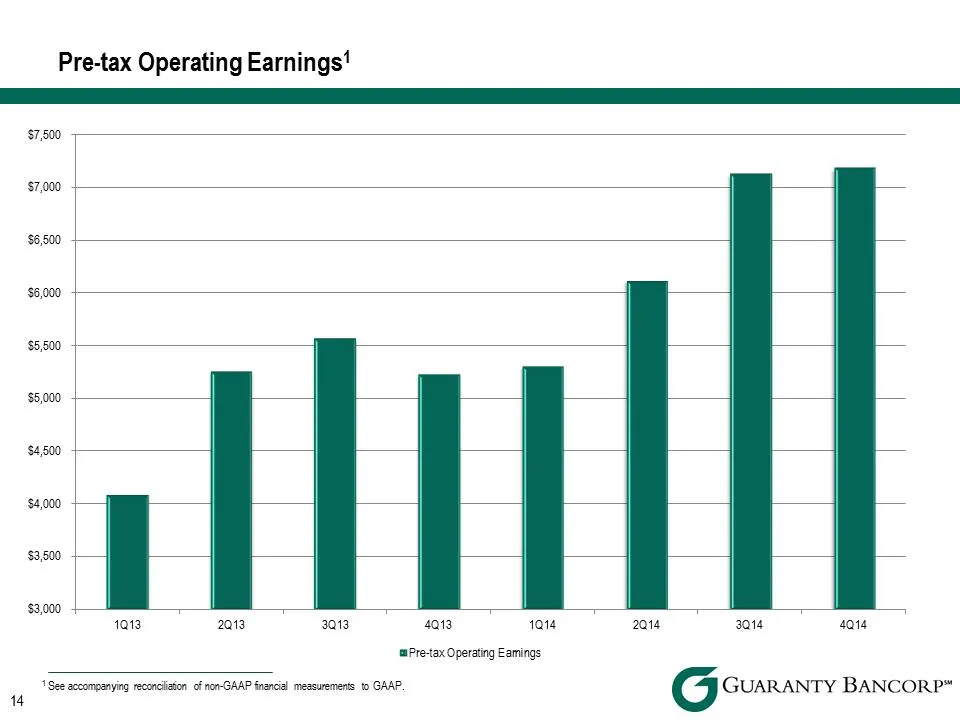
Pre-tax Operating Earnings’ 4 $7,500 $7,000 $6,500 $6,000 $5,500 $5,000 $4,500 $4,000 $3,500 $3,000 1013 2013 3013 4013 mPre-tax Operating Eamings 1014 * See accompanying recorcliaion of non-GAAP nancial messuremenis to GAAP. 2014 3014 414 G GUARANTY BANCORP”
Slide 15: Quarterly Financial Statement Summary
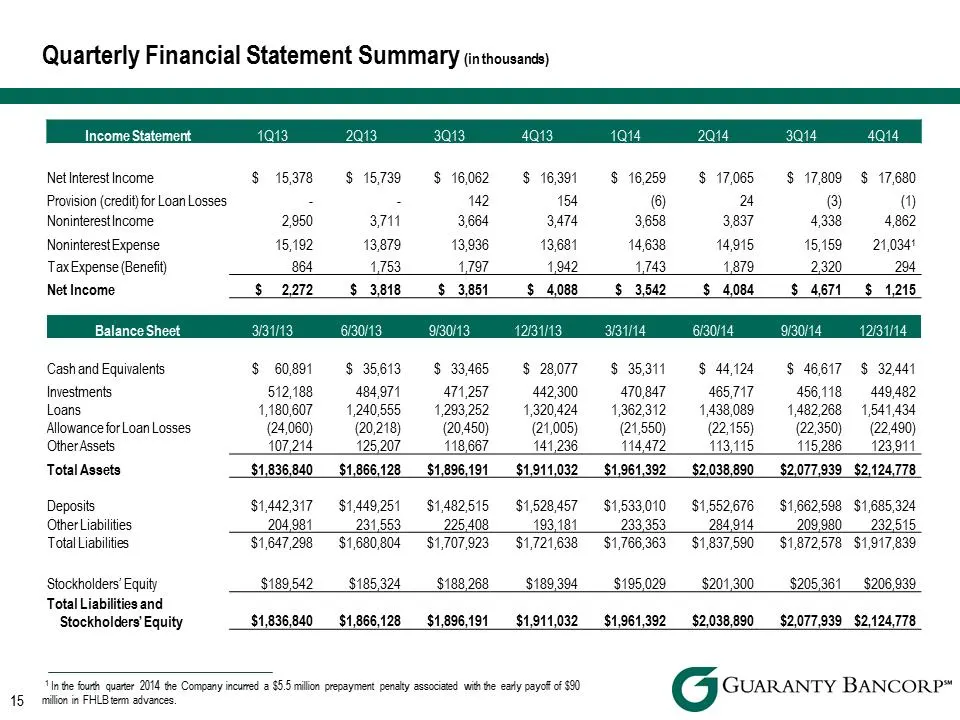
Quarterly Financial Statement Summary (inthousencs) Income Statement, Net Interest Income $ 15378 $ 15739 $ 16062 $ 16301 $ 16259 $ 17065 $ 17809 $ 17,680 Provision (credit for Loan Losses Z 2 142 154 ) a (3) () Noninterestincome 2,950 3711 3,664 3474 3,658 3837 4338 4,862 NoninterestExpense 15,192
Slide 16: Colorado Market
16 Colorado Market G GUARANTY BANCORP*
Slide 17: Market Data
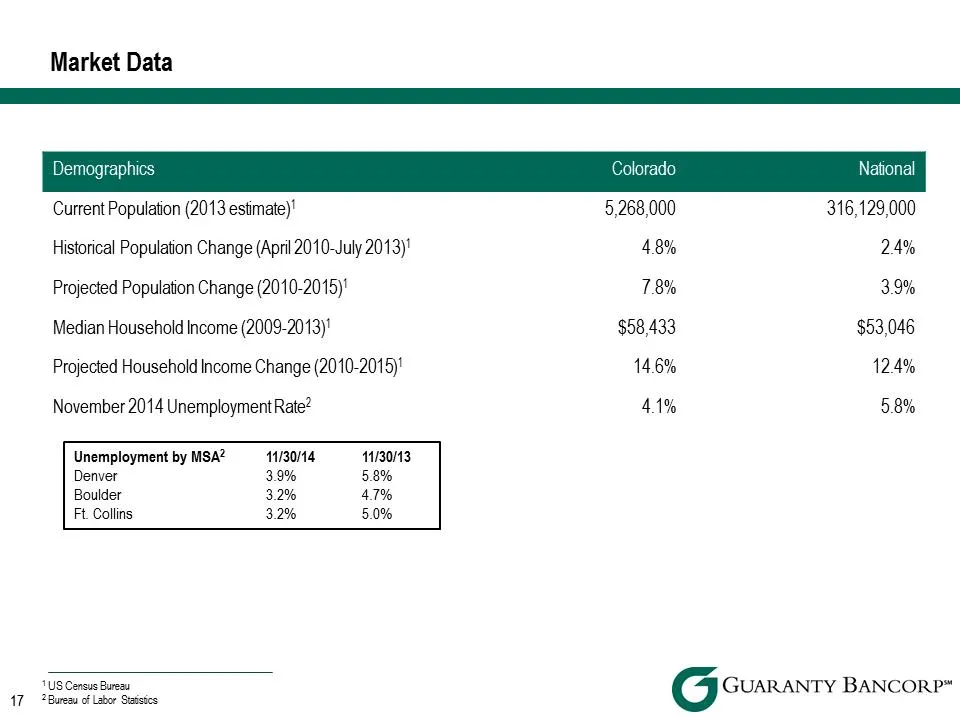
Market Data Current Population (2013 estimate)’ 5,268,000 316,129,000 Historical Population Change (April 2010-July 2013)! 4.8% 24% Projected Population Change (2010-2015)! 78% 3.9% Median Household Income (2009-2013)' $58,433 $53,046 Projected Household Income Change (2010-2015)' 14.6% 12.4% Novemb
Slide 18: Market Data - Business Climate
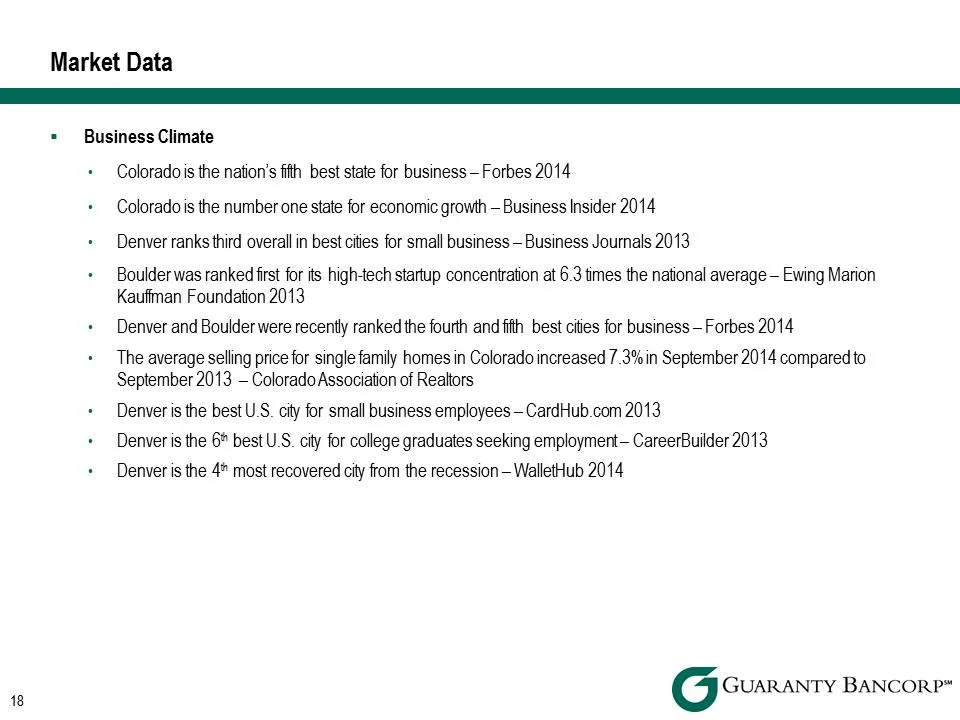
Market Data a = Business Climate + Coloradois the nation’s fith best state for business - Forbes 2014 + Colorado is the number one state for economic growth — Business Insider 2014 + Denver ranks third overall in best cities for small business — Business Journals 2013 + Boulderwas ranked first for i
Slide 19: Market Data - Growth
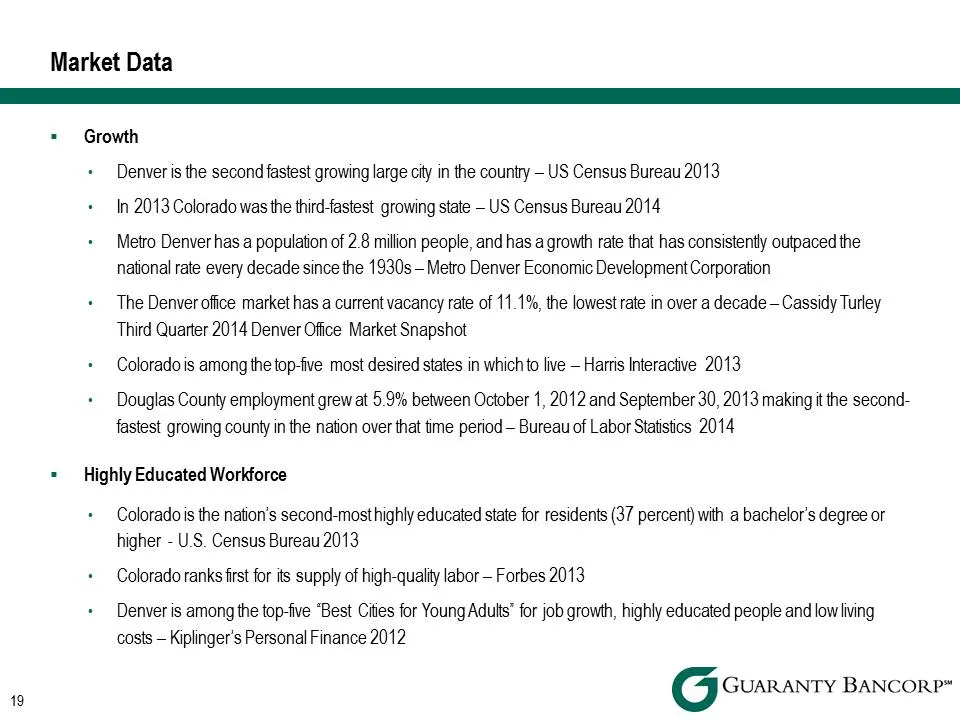
Market Data 19 Growth + Denver is the second fastest growing large city in the country - US Census Bureau 2013 + — In 2013 Colorado was the third-fastest growing state - US Census Bureau 2014 + Metro Denver has a population of 2.8 million people, and has a growth rate that has consistently outpaced
Slide 20: Market Data - Largest Metro Denver Employers
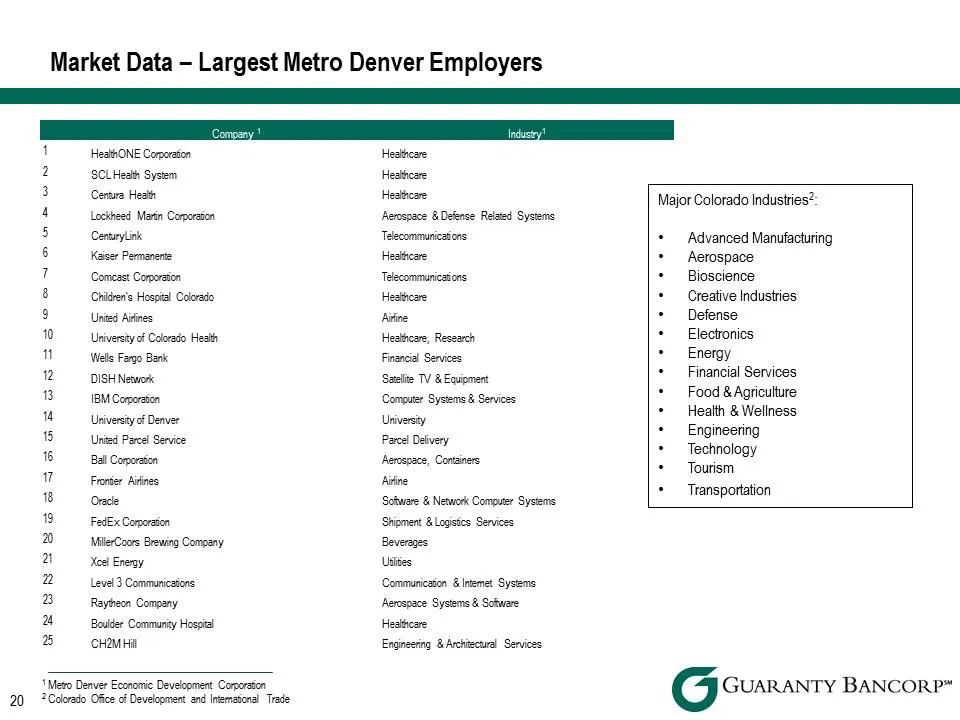
Market Data - Largest Metro Denver Employers 1 HeathONE Corporation Heatincare 2 ‘SCLHeath System Heatincare 3 Corea Heath Heather Major Colorado Industies?. 4 Lockheed Marin Corporation ‘Aerospace & Defense Related Systems 5 Ceneryink Teeconmaricaons * Advanced Manat 6 Kaiser Permanente Heatincare
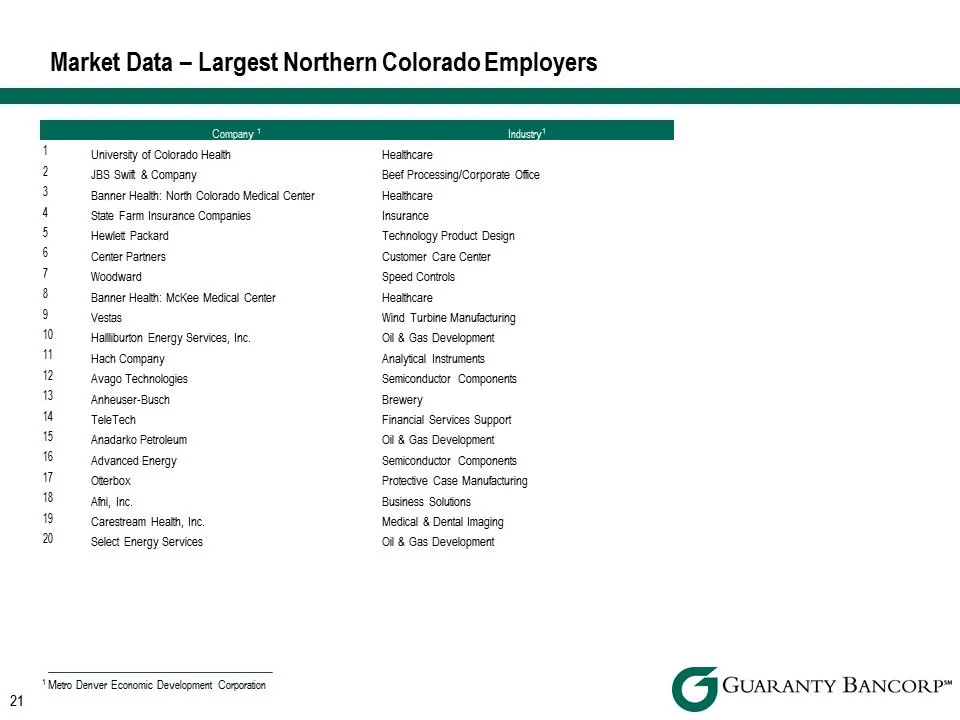
Slide 21: Market Data - Largest Northern Colorado Employers
Market Data - Largest Northern Colorado Employers 1 Universty of Colorado Heath Heatheare 2 gs swt & company Beet Processng|Corporste ce 3 Banner Health: North Colorado Medical Center Heathcare_ 4 sate Farm insurance Companies Insurance 5 Hewat Pactars Teenology Product Design 6 ‘Center Partners Cus
Slide 22: Reconciliation of Non-GAAP Financial Measures
2 Reconciliation of Non-GAAP Financial Measures G GUARANTY BANCORP*
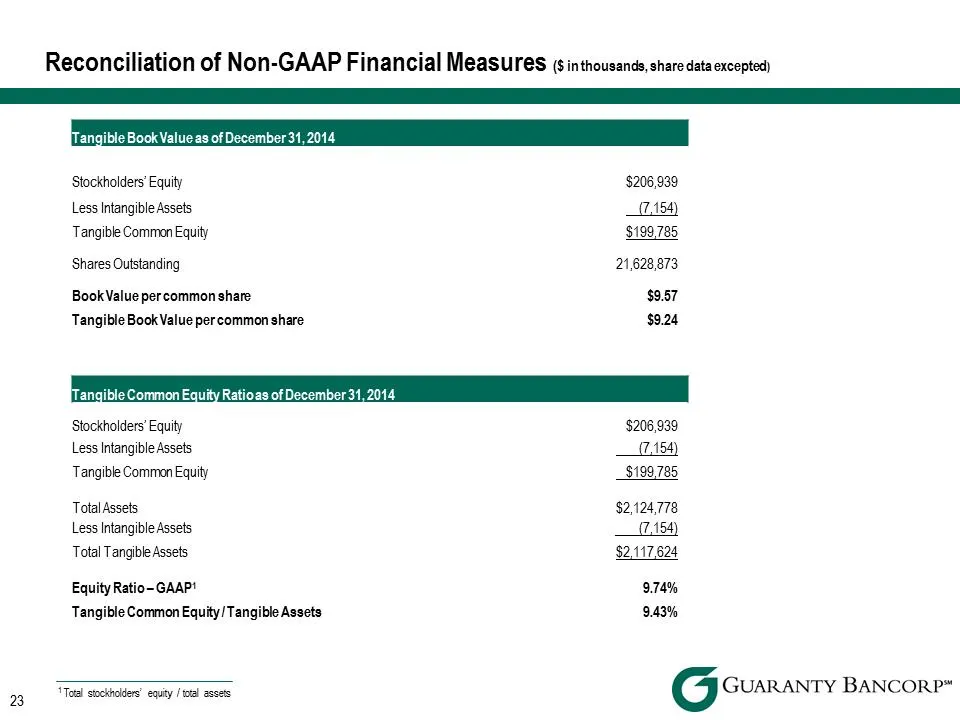
Slide 23: Reconciliation of Non-GAAP Financial Measures
Reconciliation of Non-GAAP Financial Measures (5 inthousands, share data excepted) ee HTangible Book Value as of December 31,2014 Stockholders’ Equity $206,939 Less Intangible Assets (7.154) Tangible Common Equity $199,785 Shares Outstanding 21,628,873 Book Value percommon share $957 Tangible Book V
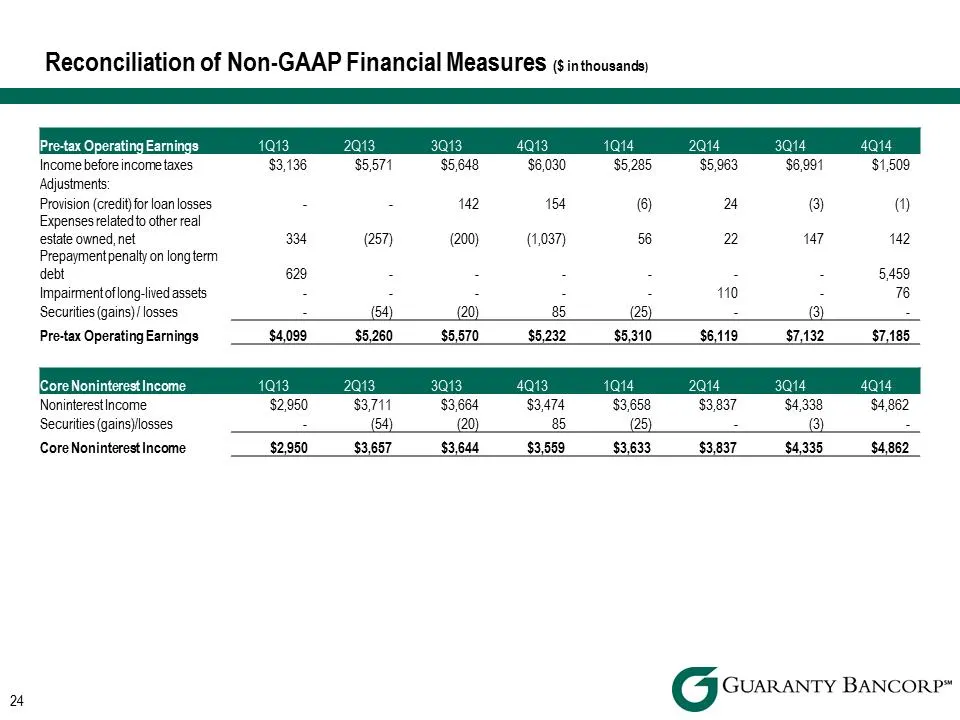
Slide 24: Reconciliation of Non-GAAP Financial Measures
24 Reconciliation of Non-GAAP Financial Measures ( inthousancs) Income before incometaxes $3,136 $5571 36,030 $5,285 $5,963 $6,991 $1,509 Adjustments: Provision (credit) for loan losses = < 142 184 © 24 ) () Expenses elatedio other real estate owned, net 344 (257) (200) (1,037) 56 2 a7 142 Prepaymen
Slide 25: Reconciliation of Non-GAAP Financial Measures
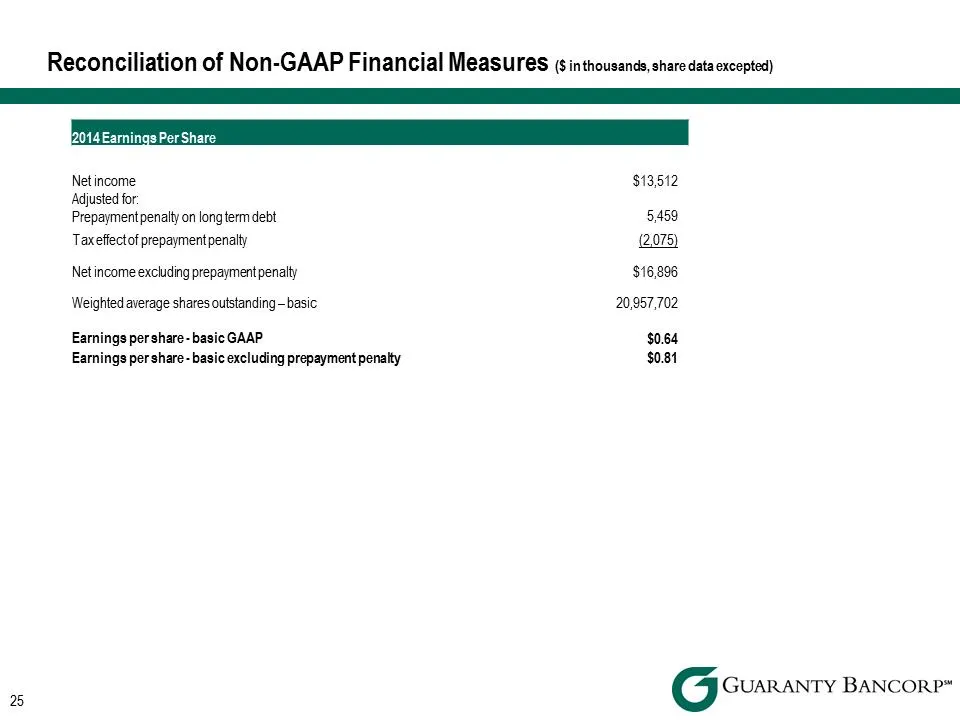
Reconciliation of Non-GAAP Financial Measures (5 inthousands, share data excepted) ee 12014 Earnings Per Share Net income $13,512 Adjusted for: Prepaymentpenalty on longterm debt 5459 Taxeffectof prepayment penalty (2075) Net income excluding prepayment penalty $16,896 Weighted average shares outsta
Source: SEC EDGAR · 8-K filed Mar 10, 2015
More decks from Guaranty Bancorp
 Merger or Acquisition (May 2018)19 slides · May 23, 2018
 Merger or Acquisition (July 2017)8 slides · Jul 19, 2017
 D.A. Davidson 19th Annual Financial Services Conference 201722 slides · May 9, 2017
 FIG Partners 8th Annual West Coast Bank CEO Forum 201727 slides · Jan 31, 2017
 2016 FBR 23rd Annual Investor Conference27 slides · Nov 28, 2016
 2016 KBW Community Bank Investor Conference26 slides · Aug 1, 2016