Diversicare Healthcare Services Inc
Diversicare Healthcare Services — Advocat — Investor Day (December 2010)
66 slides from Diversicare Healthcare Services's investor day presentation, Dec 7, 2010
Slide 1: Annual Investor Day December 7, 2010
Annual Investor Day December 7, 2010
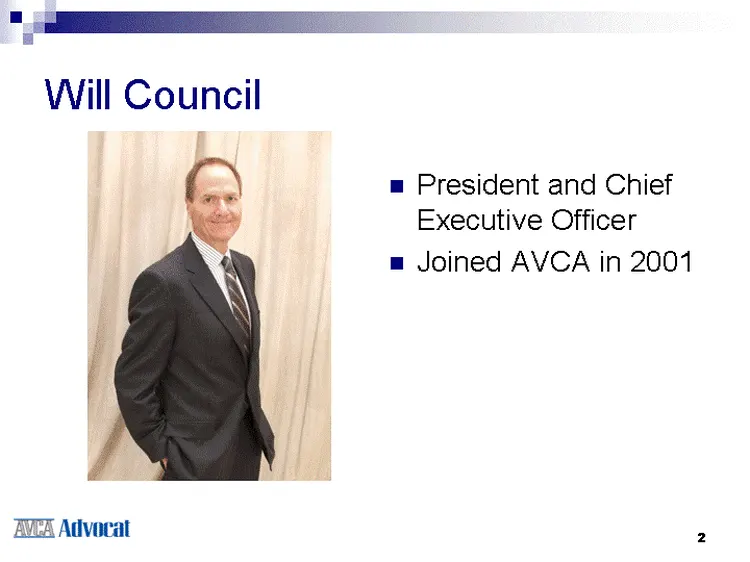
Slide 2: Will Council, President and Chief Executive Officer
Will Council President and Chief Executive Officer Joined AVCA in 2001 Joined AVCA in 2001 Joined AVCA in 2001 Joined AVCA in 2001 2
Slide 3: Kelly Gill, Chief Operating Officer
Kelly Gill Chief Operating Officer Joined AVCA in March 2010 20+ years in LTC Sr. VP, Sub Acute Care - Beverly Enterprises Division Executive, 168 Facilities Division President, Rehabilitation Services - Living Centers of America Executive VP Ancillary Services Division - Skilled Healthcare Hallmark
Slide 4: David Houghton, Chief Information Officer
David Houghton Chief Information Officer Joined AVCA in May 2010 20+ years of healthcare, technology and consulting: Nashville Strategic CIO Services Lead, North Highland Company HCA Vanderbilt Gaylord Entertainment Contract CIO, Bridgestone Industrial Products Healthcare Strategy, Ops/Enterprise Sy
Slide 5: Glynn Riddle, Chief Financial Officer
Glynn Riddle Chief Financial Officer Joined AVCA in 2002 Executive Vice President Chief Financial Officer Secretary Over 19 Years as Senior Financial Officer for Public Companies Certified Public Accountant 5
Slide 6: Board of Directors
Board of Directors Wallace E. Olson, Chairman of the Board William C. O'Neil Richard M. Brame Robert Z. Hensley Chad A. McCurdy 6
Slide 7: Profile
Profile Advocat is a leading provider of long term care services to nursing home patients, primarily in the Southeast and Southwest in a blend of urban, suburban and rural areas. Pure play in skilled nursing sector 46 Facilities in 8 states 117 average licensed beds per facility 7
Slide 8: Advocat Mission Statement
Advocat Mission Statement Committed to Compassion Striving for Excellence Serving Responsibly We aim to be the facility of choice in every community we serve. 8
Slide 9: Market Data
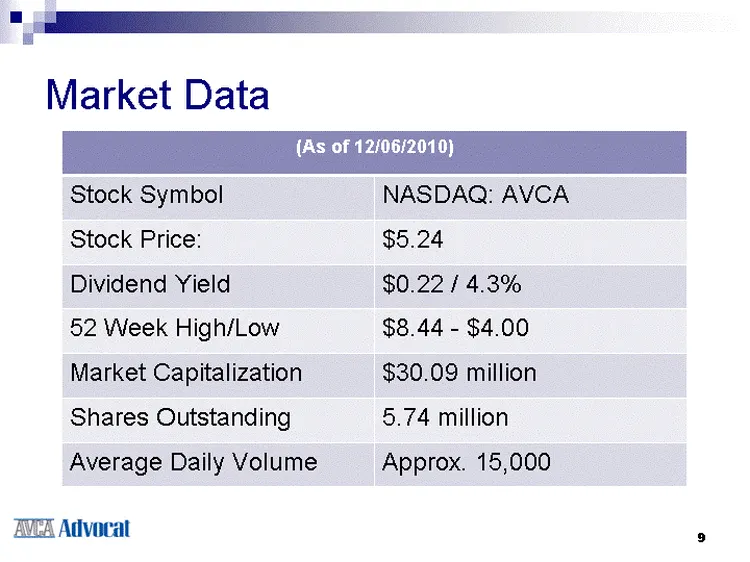
Market Data (As of 12/06/2010) (As of 12/06/2010) Stock Symbol NASDAQ: AVCA Stock Price: $5.24 Dividend Yield $0.22 / 4.3% 52 Week High/Low $8.44 - $4.00 Market Capitalization $30.09 million Shares Outstanding 5.74 million Average Daily Volume Approx. 15,000 9
Slide 10: Key Fundamental: Funds Provided by Operations
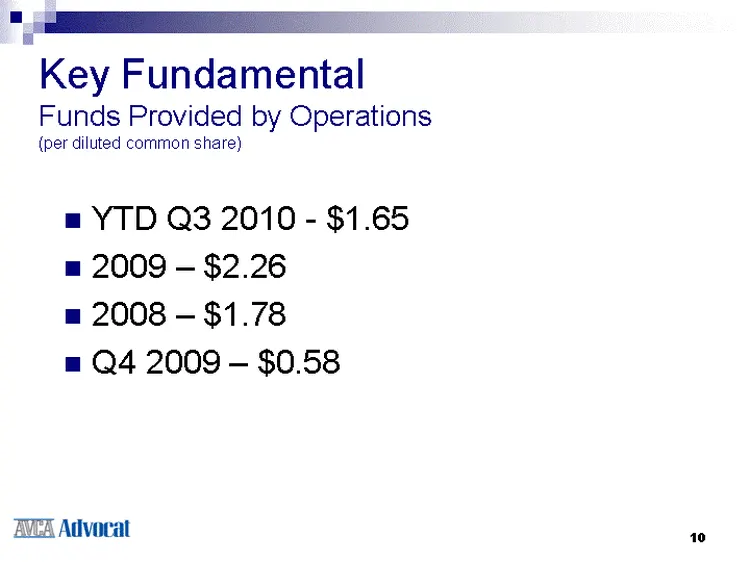
Key Fundamental Funds Provided by Operations (per diluted common share) YTD Q3 2010 - $1.65 2009 - $2.26 2008 - $1.78 Q4 2009 - $0.58 10
Slide 11: Historical Drivers for Cash Flow Success
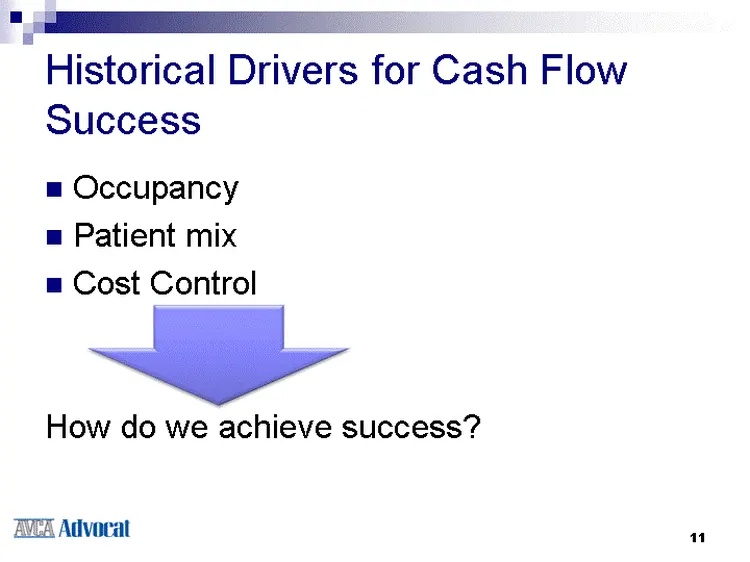
Historical Drivers for Cash Flow Success Occupancy Patient mix Cost Control How do we achieve success? 11
Slide 12: Transforming Advocat
Transforming Advocat More importantly, how do we transform Advocat? 12
Slide 13: Strategic Planning
Strategic Planning Management Board of Directors Evaluated: Current business Other markets and opportunities 13
Slide 14: Strategic Operations Development Plan
Strategic Operations Development Plan Initiatives - improve: Occupancy Skilled mix (census and rates) Significant enhancements: Sub-Acute care delivery system Sales and Marketing infrastructure Electronic Documentation of clinical care 14
Slide 15: What are the opportunities?
What are the opportunities? Occupancy Skilled Mix Managed Care 15
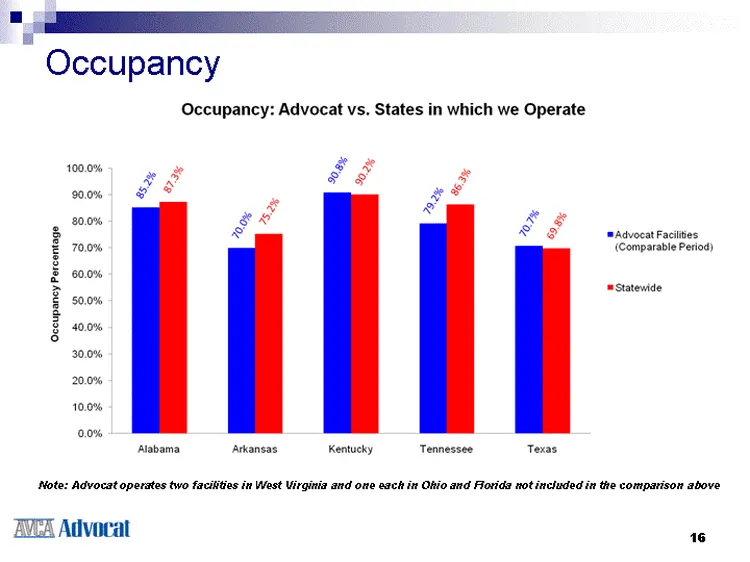
Slide 16: Occupancy
Occupancy Note: Advocat operates two facilities in West Virginia and one each in Ohio and Florida not included in the comparison above 16
Slide 17: Patient Mix
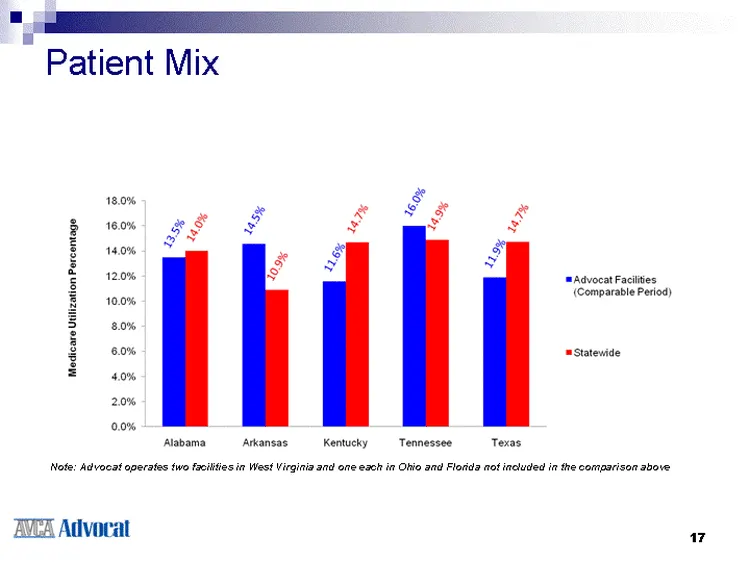
Patient Mix Note: Advocat operates two facilities in West Virginia and one each in Ohio and Florida not included in the comparison above 17
Slide 18: Managed care average daily census
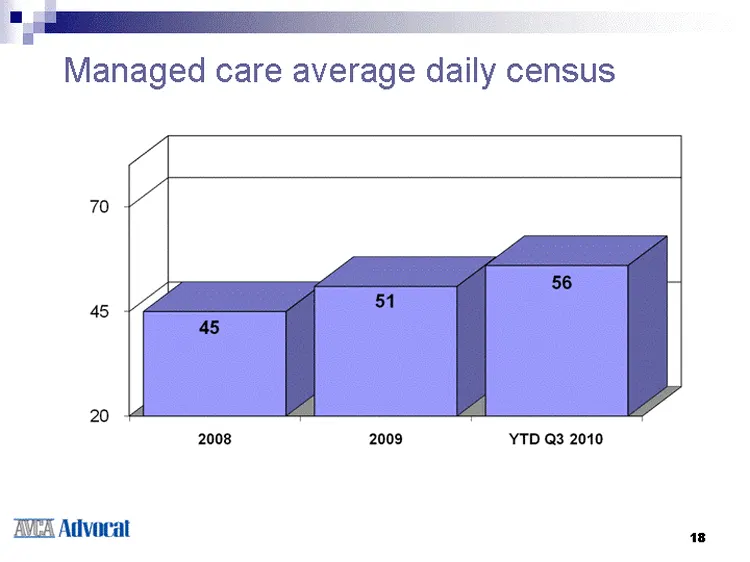
Managed care average daily census 18
Slide 19: Kelly Gill, Chief Operating Officer
Kelly Gill Chief Operating Officer 19
Slide 20: Key Operational Performance Improvement Initiatives
Key Operational Performance Improvement Initiatives Expanded Clinical Care Delivery Capability Nursing Rehabilitation Expanded Marketing and Sales Infrastructure 20
Slide 21: Post acute care offers opportunities for growth beyond the traditional nursing home
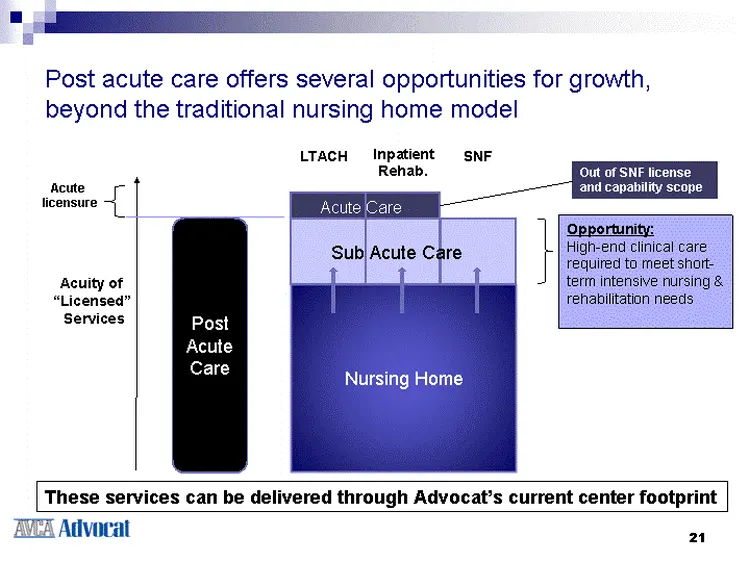
Post acute care offers several opportunities for growth, beyond the traditional nursing home model 21 Acuity of "Licensed" Services LTACH Nursing Home Inpatient Rehab. SNF Post Acute Care Opportunity: High-end clinical care required to meet short- term intensive nursing & rehabilitation needs Out of
Slide 22: Skilled Care Development Initiatives
Skilled Care Development Initiatives 24 Hour RN Coverage Sub Acute Clinical Care Capability Specialized Clinical Care Drives Favorable Reimbursement Marketing Advantage 22
Slide 23: Marketing Infrastructure Development
Marketing Infrastructure Development Facility-Based Sales Representatives Business Development Managed Care Physician Relationships Clinical Program Development Customized for Physician Needs 23
Slide 24: Operations Improvement Conclusion
Operations Improvement Conclusion Goal - #1 Referral Destination in Each Market Improvements: Clinical Care Expansion Sales Components Business Development Advocat Well Positioned for Continued Success 24
Slide 25: David Houghton, Chief Information Officer
David Houghton Chief Information Officer 25
Slide 26: Electronic Medical Record (EMR)
Electronic Medical Record (EMR) American Healthtech (AHT) Product Leading Software Vendor in Industry Advocat's core clinical application SmartCharting is EMR Product Integrated into core application 26
Slide 27: EMR Components
EMR Components Activities of Daily Living (ADL) Tracking Nursing Notes and Assessment Medication and Treatment Administration 27
Slide 28: Accelerated Deployment
Accelerated Deployment Two Deployment Models: ADL Only Full EMR (all 3 components) 28
Slide 29: 2010 Deployments
2010 Deployments Conducted Pilots in 3 Facilities: 2 in Texas - ADL Capture Only 1 in Arkansas - Full EMR Pilots proved Deployment Schedule and Resource Plan As of 2010 Year End; 21 Facilities on EMR Eight (8) Arkansas Facilities - Full EMR Thirteen (13) Texas Facilities ADL Capture Only 29
Slide 30: 2011 Deployment Schedule
2011 Deployment Schedule By year end, all Facilities deployed with Full EMR. 4-6 Facilities Completed every Two Months. 30
Slide 31: Typical Facility Deployment Costs
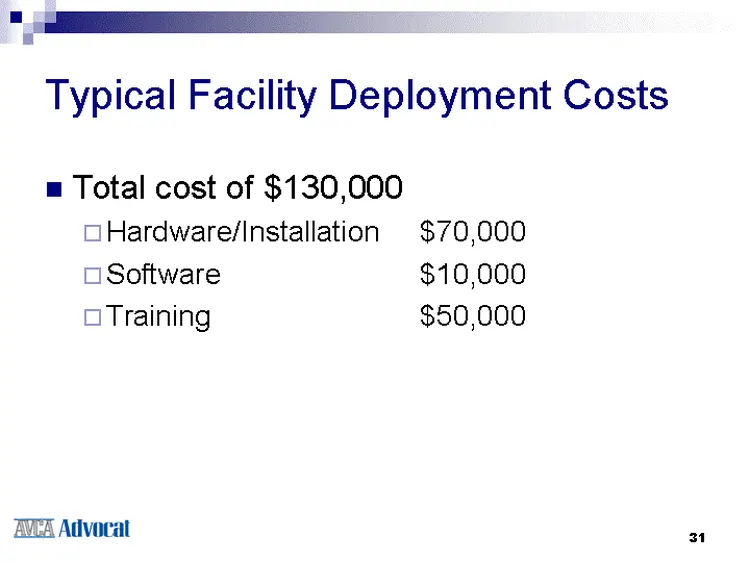
Typical Facility Deployment Costs Total cost of $130,000 Hardware/Installation $70,000 Software $10,000 Training $50,000 31
Slide 32: EMR Operational Benefits
EMR Operational Benefits Improves customer and employee satisfaction Easier/faster Documentation Resident Family Inquiry Response Improves facility regulatory compliance Consistency Surveyor Access Provides timely monitoring of care delivery Easier/More Broad Monitoring Faster Response and Control 3
Slide 33: Will Council, Chief Executive Officer
Will Council Chief Executive Officer 33
Slide 34: Strategic Plan Summary
Strategic Plan Summary Sub-acute care delivery Sales and Marketing Electronic Medical Records 34
Slide 35: Initiative Expectations
Initiative Expectations Investment in 2010 and 2011 Improvement in occupancy and skilled mix Improvement in patient acuity, rates 35
Slide 36: Timing of Strategic Plan
Timing of Strategic Plan Investment Result Full Deployment 36
Slide 37: What else is Advocat doing?
What else is Advocat doing? Rose Terrace - new facility Facility renovations Development Activities 37
Slide 38: Rose Terrace - Rendering
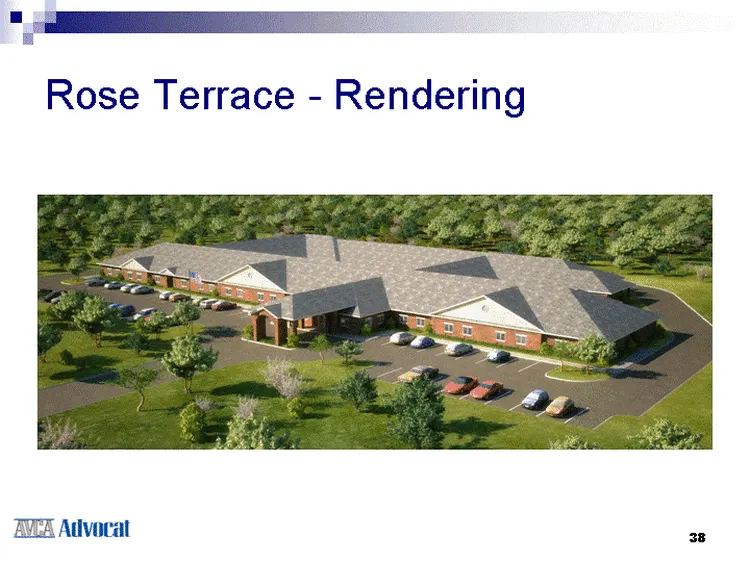
Rose Terrace - Rendering Rose Terrace - Rendering 38
Slide 39: Rose Terrace, Culloden, WV - Under Construction
Rose Terrace, Culloden, WV - - Under Construction - 90 Bed Facility Bedroom community of Huntington West Virginia Huntington-Charleston Corridor Expected to open in the fourth quarter of 2011 39
Slide 40: Huntington-Charleston Corridor
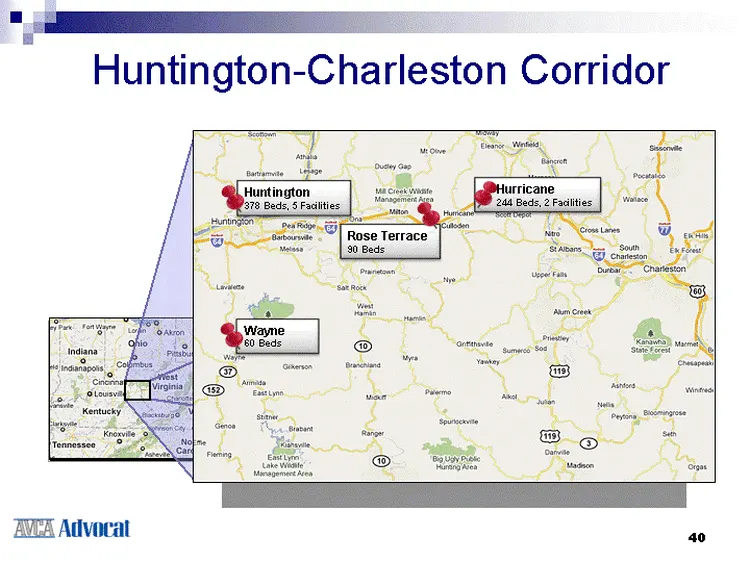
Huntington-Charleston Corridor Huntington 378 Beds, 5 Facilities Wayne 60 Beds Rose Terrace 90 Beds Hurricane 244 Beds, 2 Facilities 40
Slide 41: Rose Terrace
Rose Terrace Lease with purchase option Company supervised construction $7.2 million facility Construction - approximately 12 months 41
Slide 42: Rose Terrace 2011 Impact
Rose Terrace 2011 Impact Positive cash flow Breakeven Current West Virginia average Daily Rates Medicare - $343 Medicaid - $186 42
Slide 43: Facility Renovations - Ongoing Program
Facility Renovations - Ongoing Program Continues Historical ROI Projects underway by year-end 43
Slide 44: Other Development
Other Development Facility acquisition and development 44
Slide 45: Investor Focused Web Site
Investor Focused Web Site www.advocatinc.com 45
Slide 46: Conclusion / Questions
1 Conclusion = Questions Advorat 46
Slide 47: Forward-Looking Statements
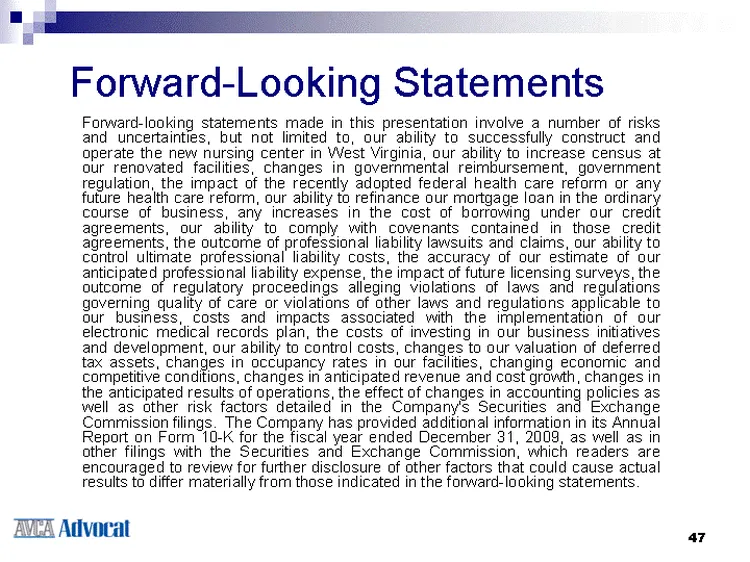
Forward-Looking Statements Forward-looking statements made in this presentation involve a number of risks and uncertainties, but not limited to, our ability to successfully construct and operate the new nursing center in West Virginia, our ability to increase census at our renovated facilities, chan
Slide 48: Appendix
ANCA Advorat Appendix
Slide 49: Performance Historical Data
Performance Historical Data 49
Slide 50: Third Quarter Highlights
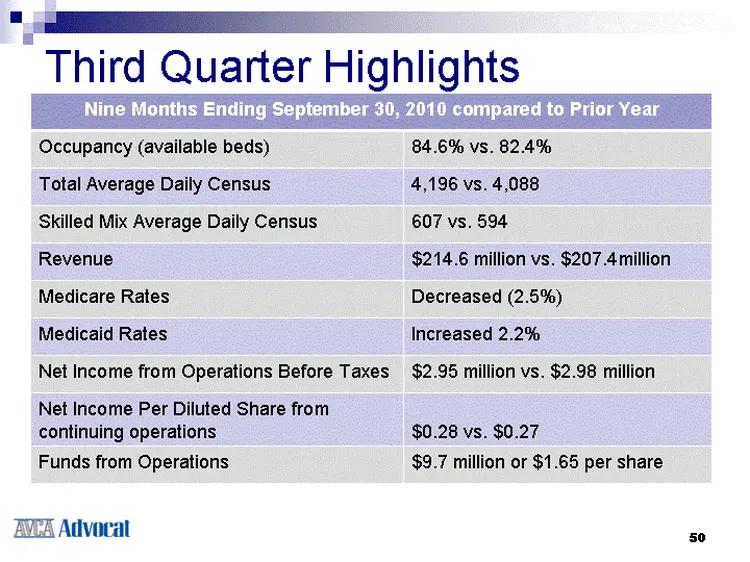
Third Quarter Highlights Nine Months Ending September 30, 2010 compared to Prior Year Nine Months Ending September 30, 2010 compared to Prior Year Occupancy (available beds) 84.6% vs. 82.4% Total Average Daily Census 4,196 vs. 4,088 Skilled Mix Average Daily Census 607 vs. 594 Revenue $214.6 million
Slide 51: Funds Provided By Operations
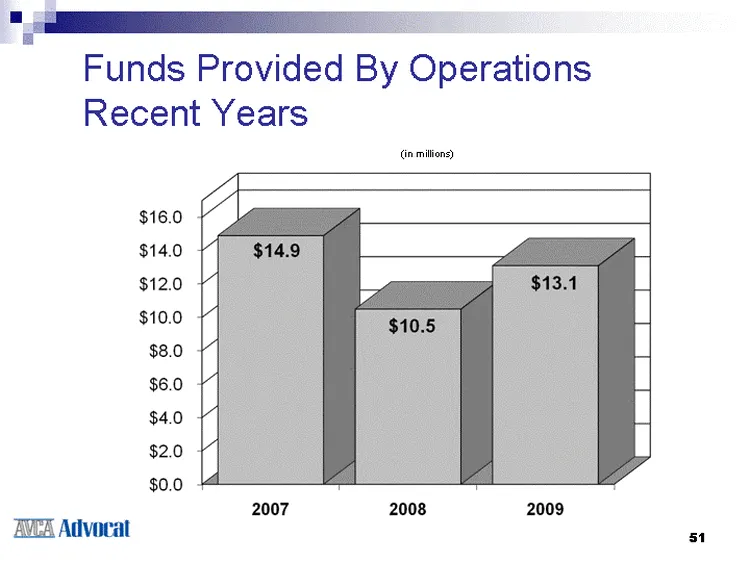
Funds Provided By Operations Recent Years (in millions) 51
Slide 52: Occupancy Rates - available beds
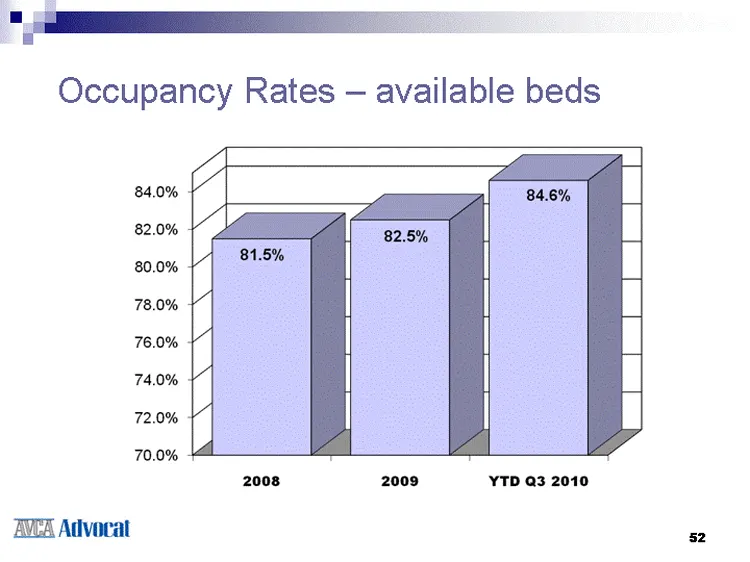
Occupancy Rates - available beds 52
Slide 53: Medicare Census
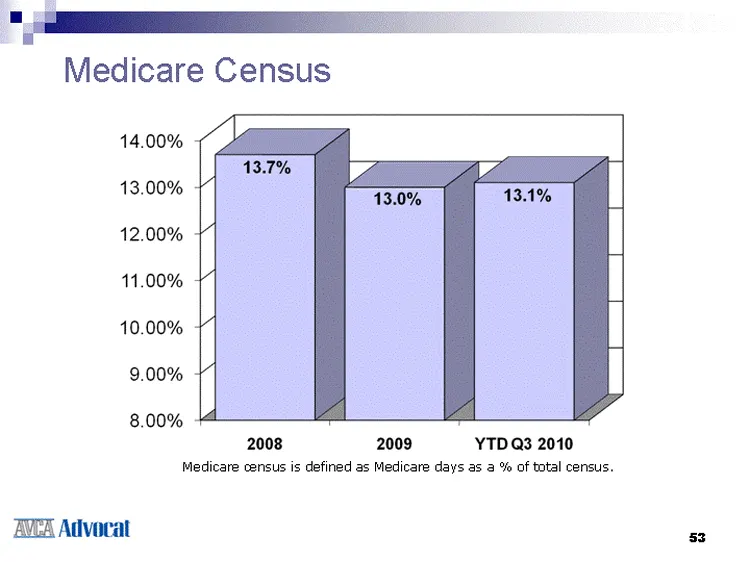
Medicare Census Medicare census is defined as Medicare days as a % of total census. 53
Slide 54: Comparative Financial Ratios
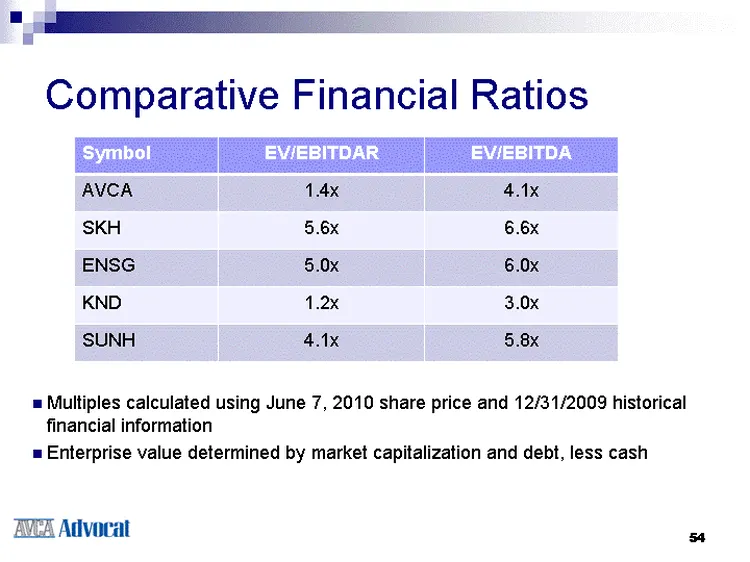
Comparative Financial Ratios Symbol EV/EBITDAR EV/EBITDA AVCA 1.4x 4.1x SKH 5.6x 6.6x ENSG 5.0x 6.0x KND 1.2x 3.0x SUNH 4.1x 5.8x Multiples calculated using June 7, 2010 share price and 12/31/2009 historical financial information Enterprise value determined by market capitalization and debt, less ca
Slide 55: Revenue Growth 2006-2009
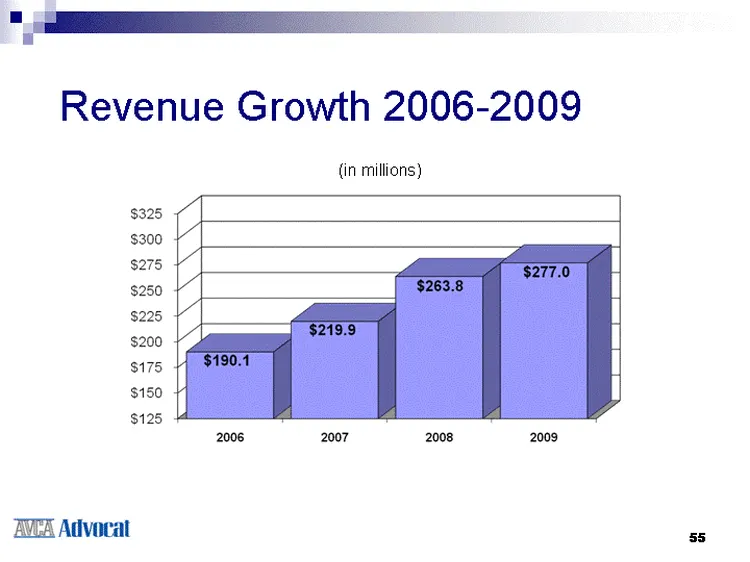
Revenue Growth 2006-2009 (in millions) 55
Slide 56: Funds provided by operations reconciliation
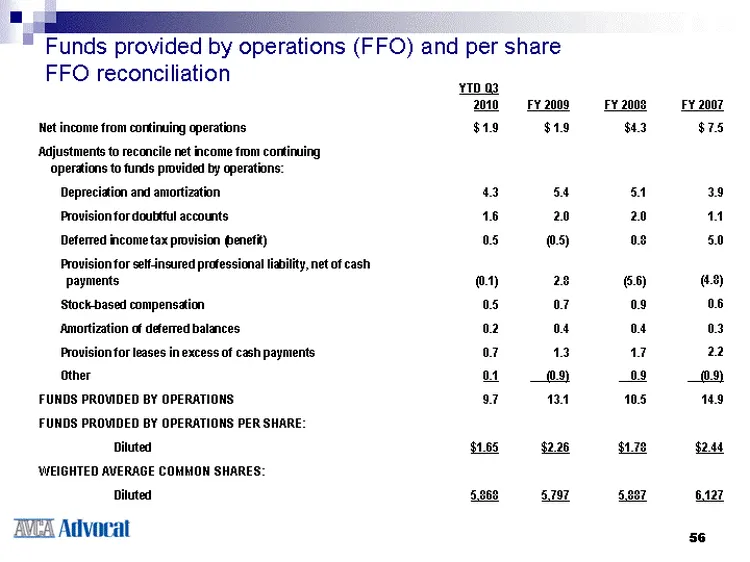
Funds provided by operations (FFO) and per share FFO reconciliation YTD Q3 2010 FY 2009 FY 2008 FY 2007 Net income from continuing operations $ 1.9 $ 1.9 $4.3 $ 7.5 Adjustments to reconcile net income from continuing operations to funds provided by operations: Depreciation and amortization 4.3 5.4 5
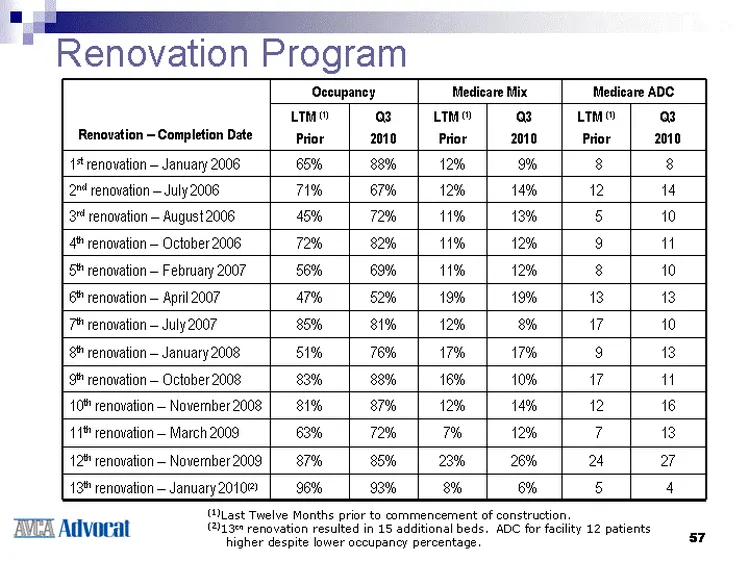
Slide 57: Renovation Program
Renovation Program Renovation - Completion Date Occupancy Occupancy Medicare Mix Medicare Mix Medicare ADC Medicare ADC Renovation - Completion Date LTM (1) Prior Q3 2010 LTM (1) Prior Q3 2010 LTM (1) Prior Q3 2010 1st renovation - January 2006 65% 88% 12% 9% 8 8 2nd renovation - July 2006 71% 67% 1
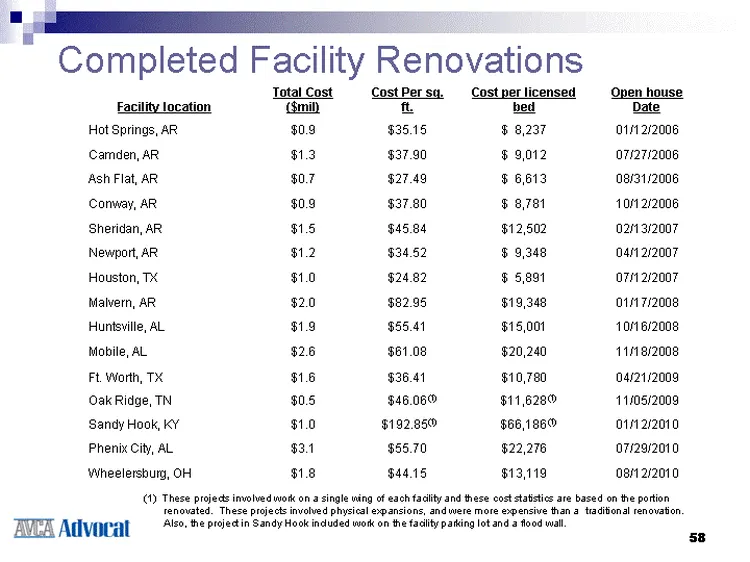
Slide 58: Completed Facility Renovations
Completed Facility Renovations Facility location Total Cost ($mil) Cost Per sq. ft. Cost per licensed bed Open house Date Hot Springs, AR $0.9 $35.15 $ 8,237 01/12/2006 Camden, AR $1.3 $37.90 $ 9,012 07/27/2006 Ash Flat, AR $0.7 $27.49 $ 6,613 08/31/2006 Conway, AR $0.9 $37.80 $ 8,781 10/12/2006 She
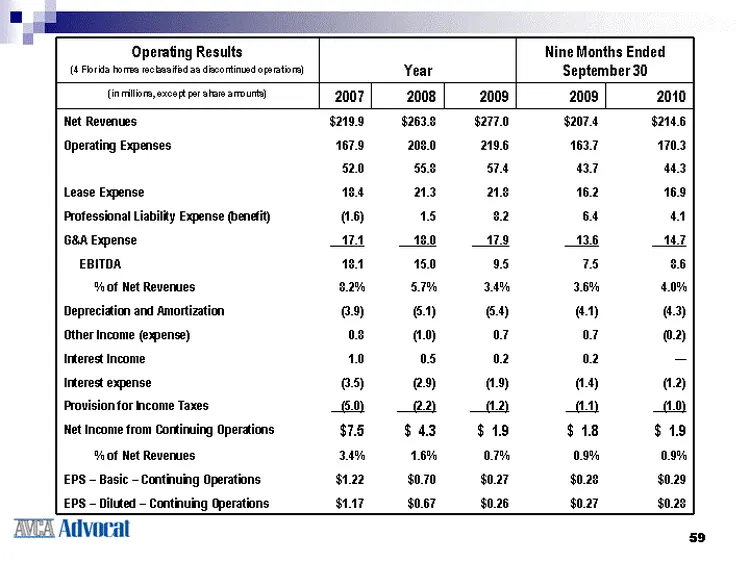
Slide 59: Operating Results
Operating Results (4 Florida homes reclassified as discontinued operations) Year Year Year Nine Months Ended September 30 Nine Months Ended September 30 (in millions, except per share amounts) 2007 2008 2009 2009 2010 Net Revenues $219.9 $263.8 $277.0 $207.4 $214.6 Operating Expenses 167.9 208.0 219
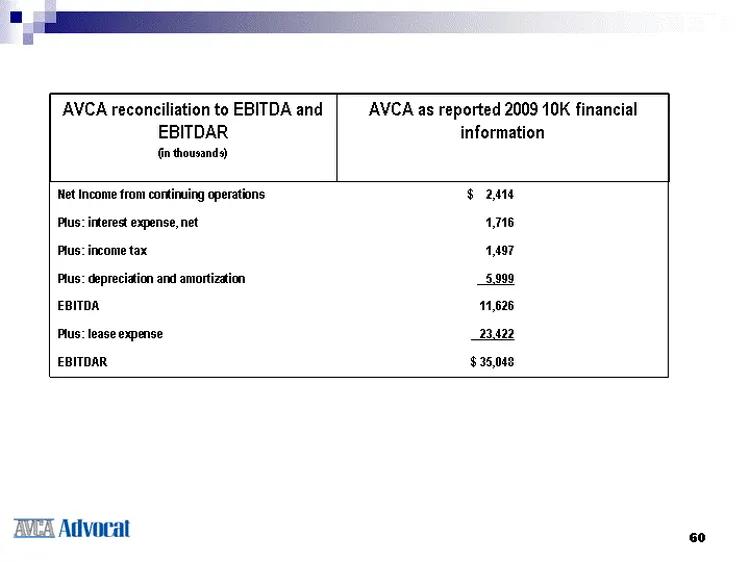
Slide 60: AVCA reconciliation to EBITDA and EBITDAR
AVCA reconciliation to EBITDA and EBITDAR (in thousands) AVCA as reported 2009 10K financial information AVCA as reported 2009 10K financial information Net Income from continuing operations $ 2,414 Plus: interest expense, net 1,716 Plus: income tax 1,497 Plus: depreciation and amortization 5,999 EB
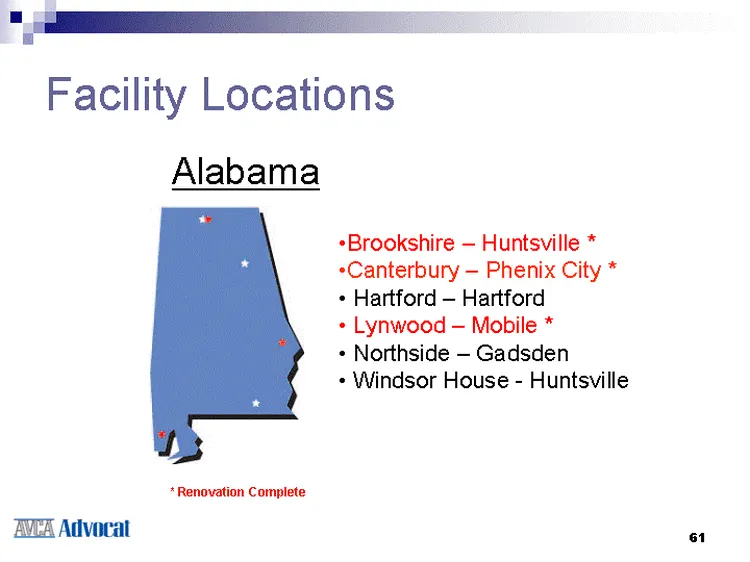
Slide 61: Facility Locations - Alabama
Facility Locations Alabama Brookshire - Huntsville * Canterbury - Phenix City * Hartford - Hartford Lynwood - Mobile * Northside - Gadsden Windsor House - Huntsville * Renovation Complete 61
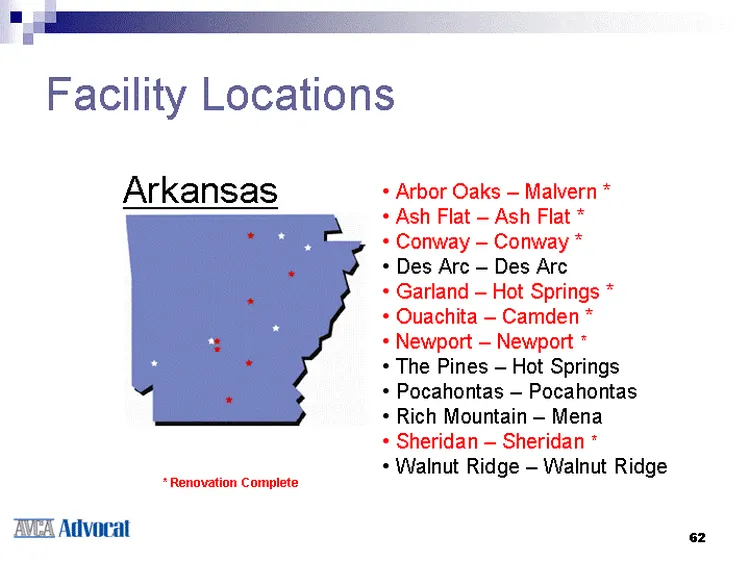
Slide 62: Facility Locations - Arkansas
Facility Locations Arkansas Arbor Oaks - Malvern * Ash Flat - Ash Flat * Conway - Conway * Des Arc - Des Arc Garland - Hot Springs * Ouachita - Camden * Newport - Newport * The Pines - Hot Springs Pocahontas - Pocahontas Rich Mountain - Mena Sheridan - Sheridan * Walnut Ridge - Walnut Ridge * Renova
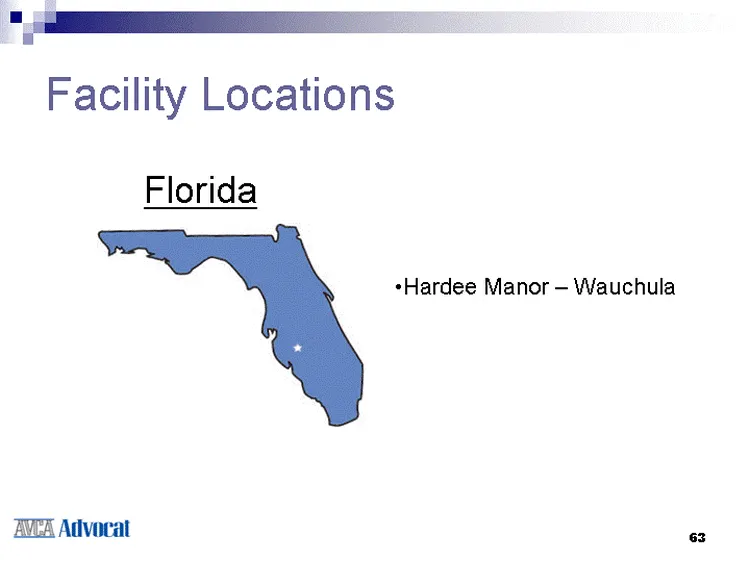
Slide 63: Facility Locations - Florida
Facility Locations Florida Hardee Manor - Wauchula 63
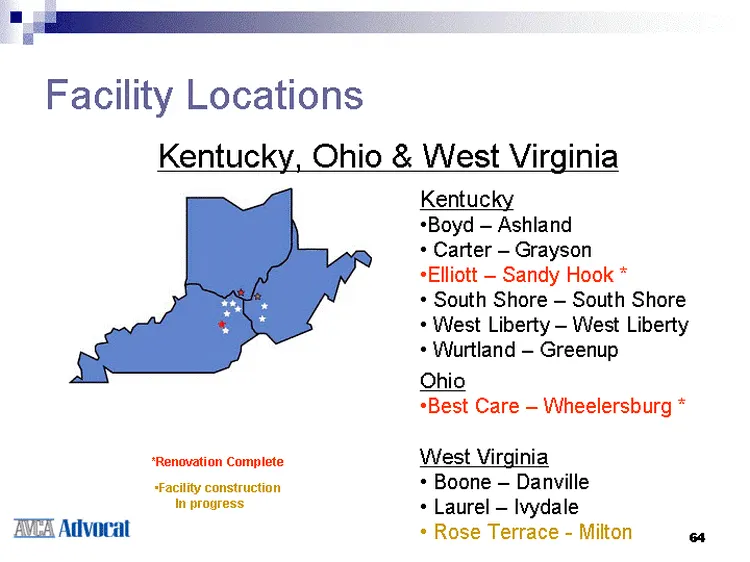
Slide 64: Facility Locations - Kentucky, Ohio & West Virginia
64 Facility Locations Kentucky, Ohio & West Virginia Kentucky Boyd - Ashland Carter - Grayson Elliott - Sandy Hook * South Shore - South Shore West Liberty - West Liberty Wurtland - Greenup Ohio Best Care - Wheelersburg * West Virginia Boone - Danville Laurel - Ivydale Rose Terrace - Milton Facility
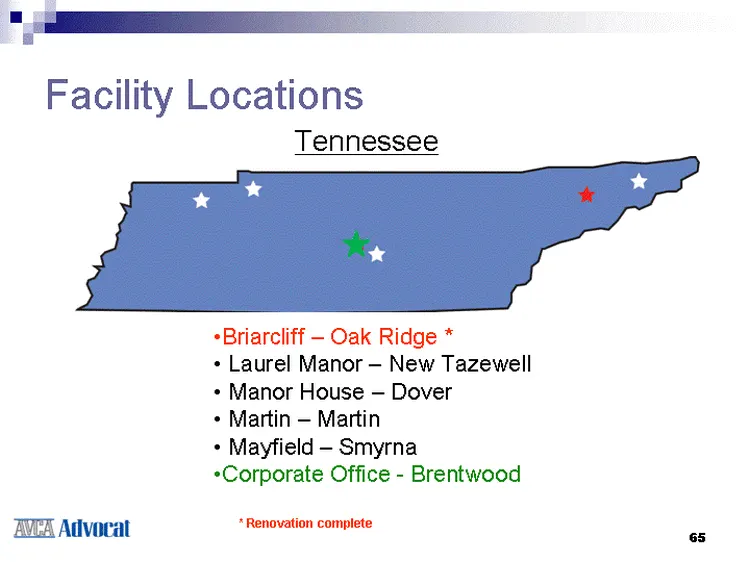
Slide 65: Facility Locations - Tennessee
Facility Locations Tennessee Briarcliff - Oak Ridge * Laurel Manor - New Tazewell Manor House - Dover Martin - Martin Mayfield - Smyrna Corporate Office - Brentwood * Renovation complete 65
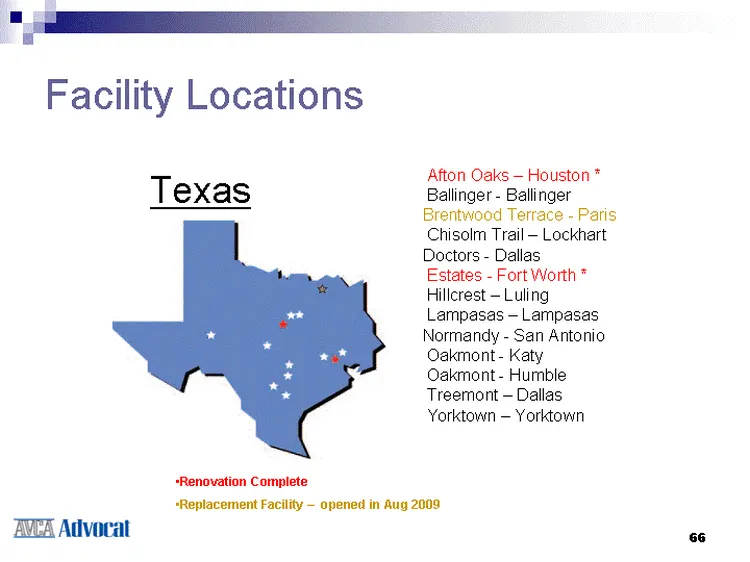
Slide 66: Facility Locations - Texas
66 Facility Locations Texas Afton Oaks - Houston * Ballinger - Ballinger Brentwood Terrace - Paris Chisolm Trail - Lockhart Doctors - Dallas Estates - Fort Worth * Hillcrest - Luling Lampasas - Lampasas Normandy - San Antonio Oakmont - Katy Oakmont - Humble Treemont - Dallas Yorktown - Yorktown Reno
Source: SEC EDGAR · 8-K filed Dec 7, 2010
More decks from Diversicare Healthcare Services Inc
 Q2 2021 Earnings Presentation31 slides · Aug 10, 2021
 Q1 2021 Earnings Presentation31 slides · May 11, 2021
 Q4 2020 Earnings Presentation31 slides · Mar 11, 2021
 Q3 2019 Earnings Presentation5 slides · Oct 31, 2019
 Q2 2018 Earnings Presentation35 slides · Aug 2, 2018
 Q1 2018 Earnings Presentation35 slides · May 3, 2018