Alliance Holdings GP L.P — RBC Capital Markets MLP Conference 2007
32 slides from Alliance Holdings GP L.P's conference presentation, Nov 15, 2007

Slide 1: Alliance Resource Partners / Alliance Holdings GP - RBC MLP Conference
1 Exhibit 99.2 Alliance Resource Partners, L.P. Alliance Resource Partners, L.P. Alliance Holdings GP, L.P. Alliance Holdings GP, L.P. RBC Capital Markets RBC Capital Markets MLP Conference MLP Conference November 15, 2007 November 15, 2007

Slide 2: Forward-Looking Statements
2 This presentation contains forward-looking statements and information that are based on the beliefs of Alliance Resource Partners, L.P. and Alliance Holdings GP, L.P. (the “Partnerships”) and those of their respective general partners (the “General Partners”), as well as assumptions made by and in

Slide 3: Table of Contents
3 Overview Outlook for Coal Outlook for Alliance Financial Summary and Historical Results Investing in Alliance Table of Contents Table of Contents I. I. Overview II. II. Outlook for Coal III. III. Outlook for Alliance IV. IV. Financial Summary and Historical Results V. V. Investing in Alliance

Slide 4: A\ Avance resource A Aan
A\ Avance resource A Aan PARTNERS. LI MA 1000s cee

Slide 5: About Alliance
5 Diversified producer and marketer of steam coal to major U.S. utilities and industrial users Focused on consistent growth through internal development of existing reserve base and disciplined acquisitions Operations and reserves in the Illinois Basin, Central Appalachian and Northern Appalachian m

Slide 6: II. Outlook for Coal
6 II. Outlook for Coal II. Outlook for Coal

Slide 7: Coal is the Cornerstone for America's Energy Future
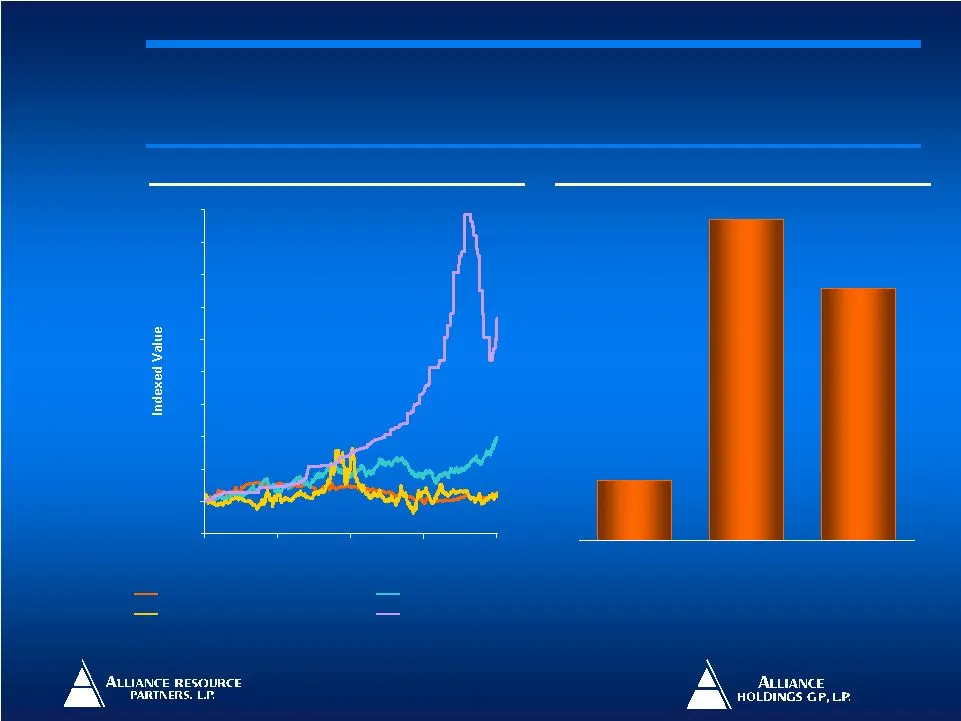
7 Coal is a vital source of secure, affordable domestic energy The U.S. has a 200+ year supply of coal Coal comprises approximately 95% of U.S. energy reserves Approximately 50% of U.S. electric power generation is coal fired Oil, natural gas and uranium prices are at or near record levels On an as-
Slide 8: Coal is the Most Stable and Cost Effective Source of Energy
8 $1.54 $8.21 $6.44 Coal Natural Gas Petroleum Source: Energy Information Administration and Factset Central Appalachian Coal - NYMEX Crude Oil, Light - NYMEX Natural Gas-Henry Hub MB-Uranium 0 100 200 300 400 500 600 700 800 900 1,000 Jan-2004 Dec-2004 Dec-2005 Nov-2006 Nov-2007 Weekly from 01-Jan-
Slide 9: Analysis of Coal Fired Power Generation Growth
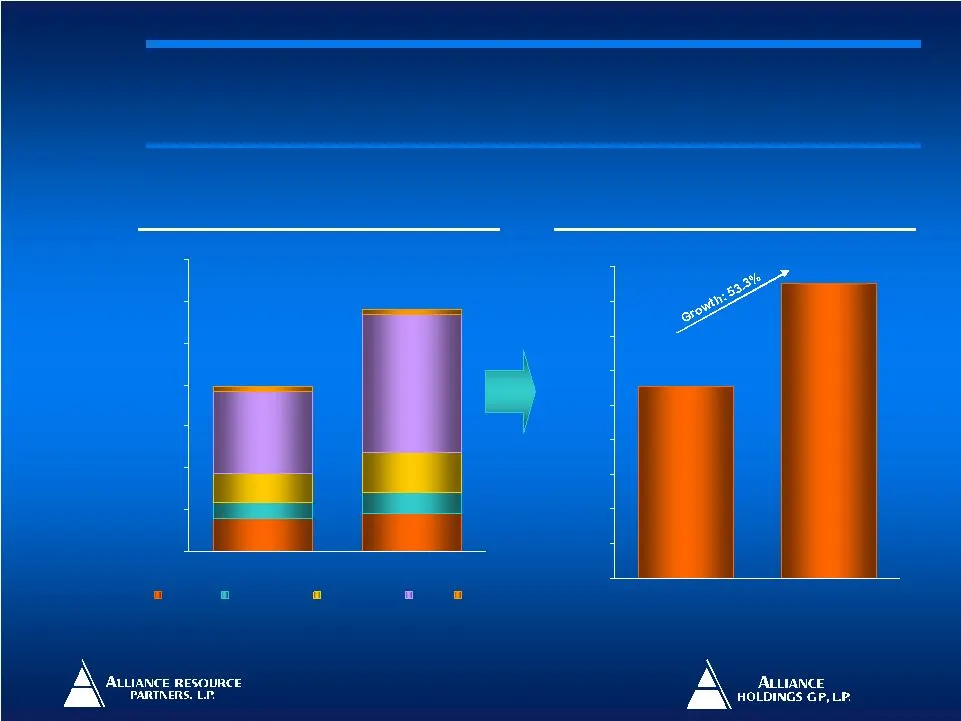
9 Source: Energy Information Administration 789 896 370 522 715 942 3,330 1,979 107 122 0 1,000 2,000 3,000 4,000 5,000 6,000 7,000 2004 2030 Nuclear Renewables Natural Gas Coal Oil 3,975 5,797 1,705 1,112 0 200 400 600 800 1,000 1,200 1,400 1,600 1,800 2004 2030 Analysis of Coal Fired Power Generat

Slide 10: Key Long-Term Drivers in Coal Market
10 The long-term outlook for the US coal market is positive due to a variety of emerging macro trends Projected utility, industrial and steel growth, coupled with new coal initiatives such as coal gasification and CTL, will increase demand for coal In addition, the rising cost of alternative fuels,
Slide 11: US coal production and market dynamics
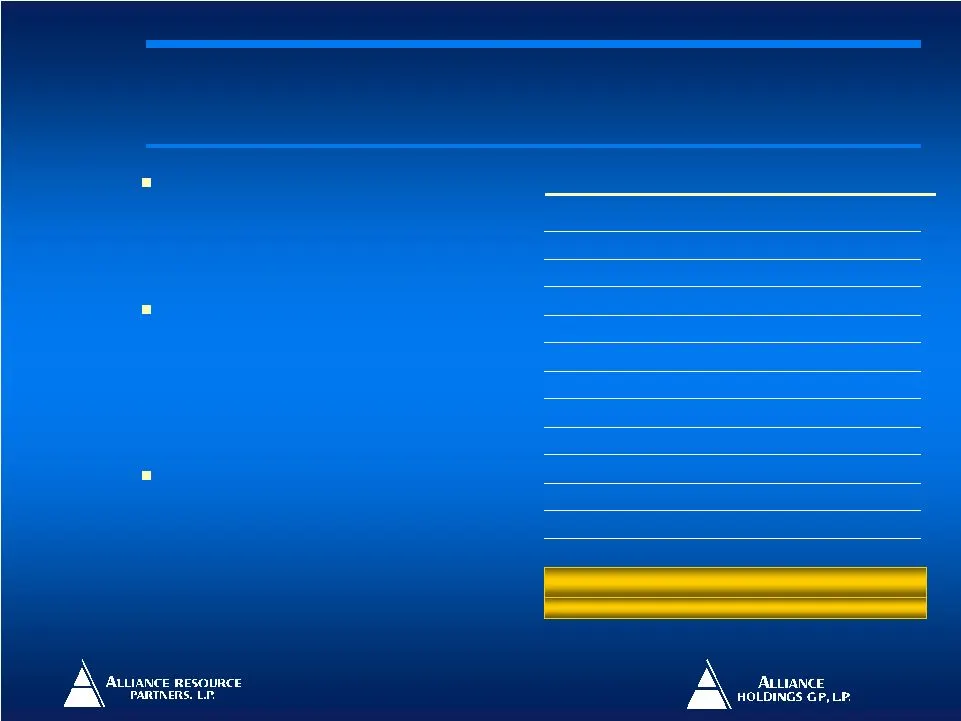
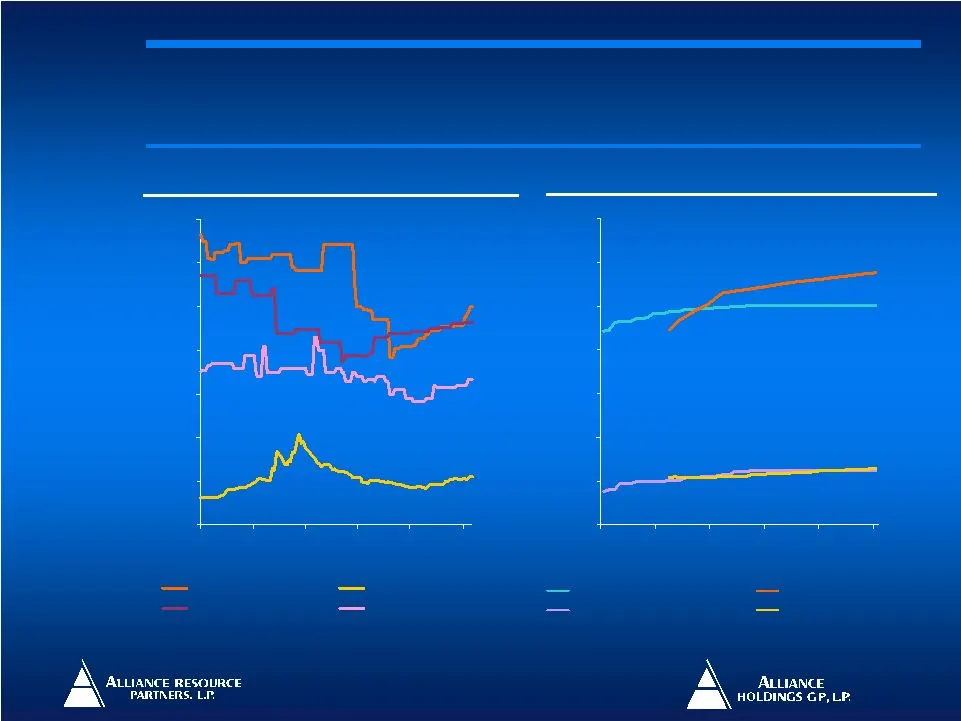
11 Total year-to-date US coal production is down 2% versus 2006 owing to a variety of factors Voluntary shut-ins at high cost mines, particularly in the Central Appalachian region Mine-specific issues such as geological and production problems The spot market continues to show improvement and has re
Slide 12: Historical and Spot Coal Prices
12 Source: Energy Information Administration $0.00 $10.00 $20.00 $30.00 $40.00 $50.00 $60.00 $70.00 Jan-05 Jul-05 Feb-06 Aug-06 Mar-07 Sep-07 Weekly from 01-Jan-2005 to 02-Nov-2007 Central Appalachia Powder River Northern Appalachia Illinois Basin Central Appalachia - 29-Sept-06 Central Appalachia -

Slide 13: III. Outlook for Alliance
13 III. Outlook for Alliance III. Outlook for Alliance
Slide 14: Alliance Snapshot
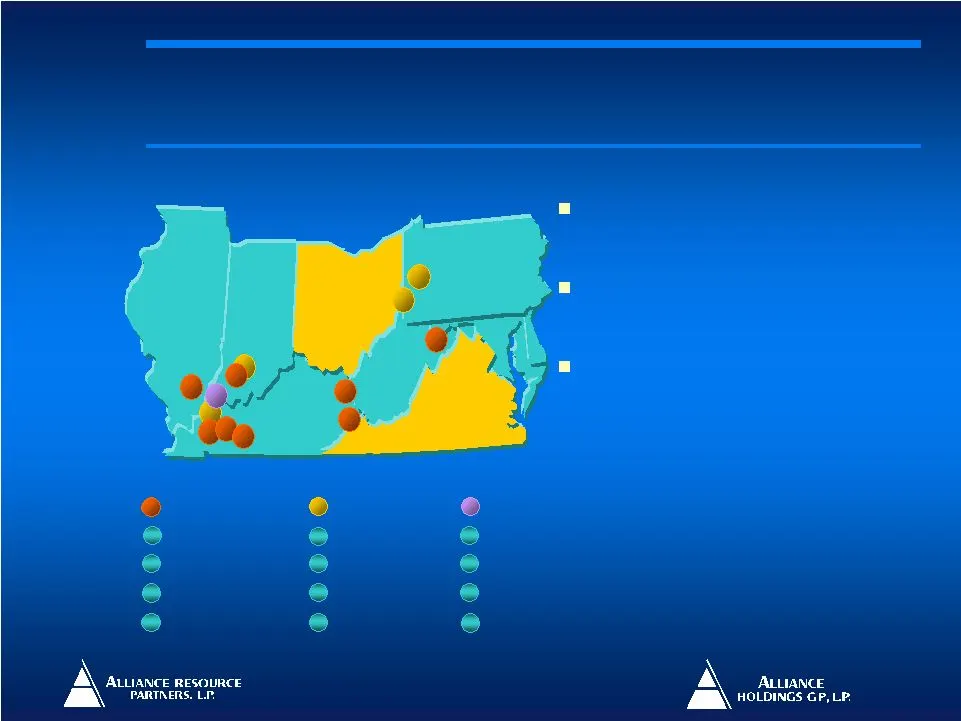
14 Alliance operates eight underground mining complexes in all major eastern coal producing regions Diversified reserve position in the Illinois Basin, Central Appalachia and Northern Appalachia regions Four significant organic development projects identified in the growing Illinois Basin and Northe
Slide 15: Operations Summary
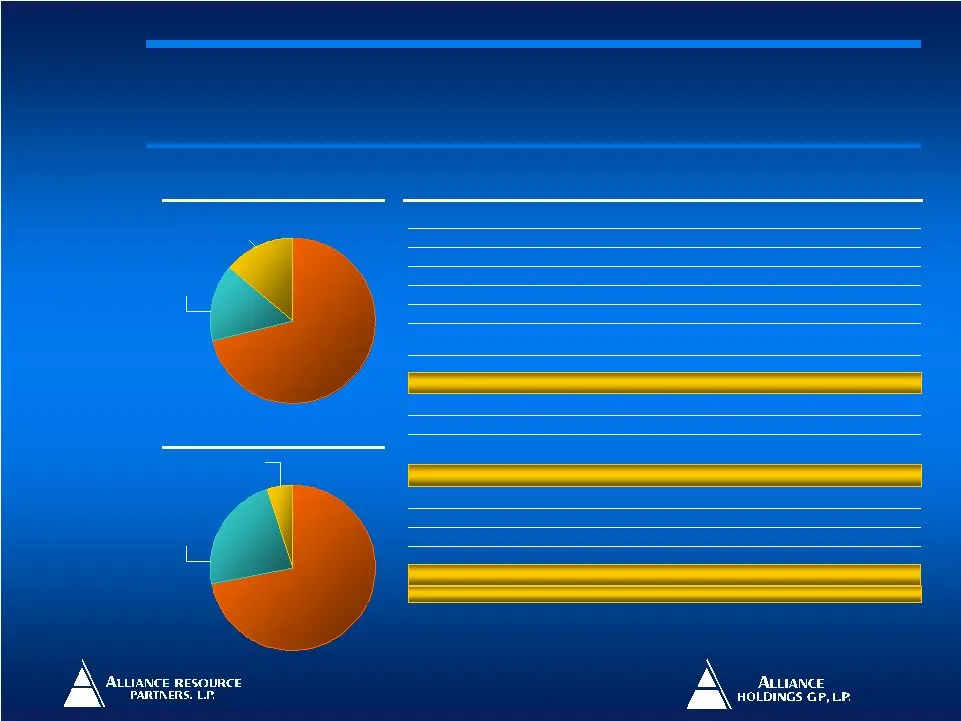
15 Central Appalachia 5% Northern Appalachia 23% Illinois Basin 72% Northern Appalachia 14% Central Appalachia 15% Illinois Basin 71% Allegheny Energy 56.7 – Penn Ridge – 70.5 – Tunnel Ridge Virginia Electric Power 36.3 3.3 Mettiki / Mettiki WV Progress; NRG; East KY Power 20.7 1.9 MC Mining Progres

Slide 16: Alliance's Long Term Growth Strategy
16 Capitalize on the expected strong demand growth in scrubber quality coal Continue to be a disciplined producer, bring on projects only with sufficient sales commitments Continuous operational optimization Pursue opportunistic bolt-on acquisitions Alliance’s Long Term Growth Strategy Alliance’s Lo
Slide 17: Organic growth projects
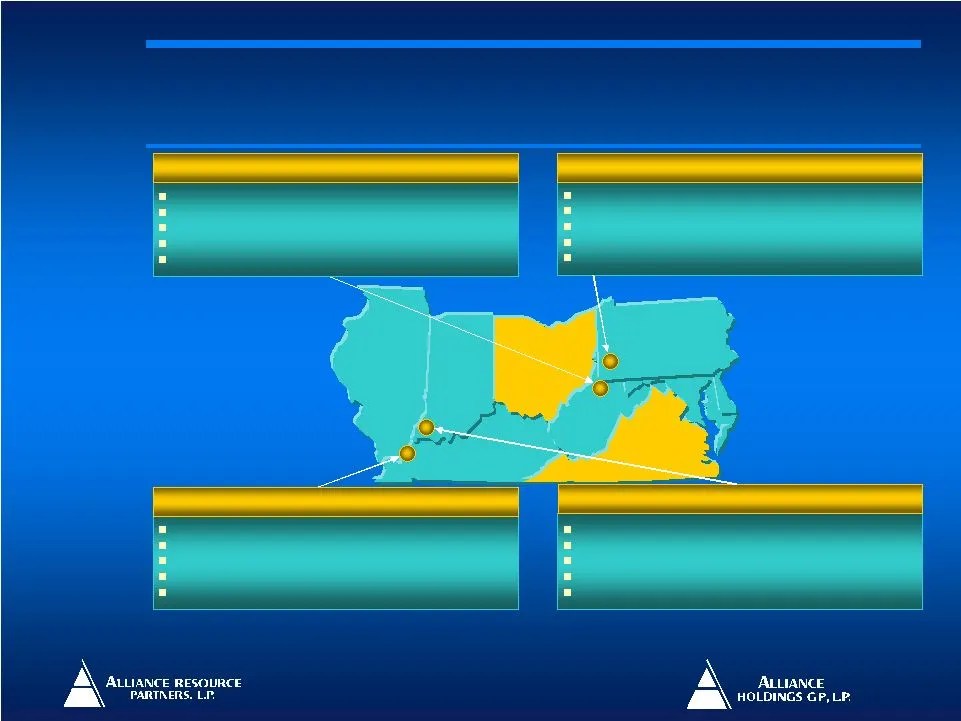
17 Permitting in progress Estimated capital cost ~ $195 – $210 million Estimated reserves ~ 70 million tons high sulfur coal Production capacity ~ 6 million tons/year Initial production in 2009 – 2010 Initiating permitting process Estimated capital cost ~ $165 – $175 million Estimated reserves ~ 57
Slide 18: Focus on Safety
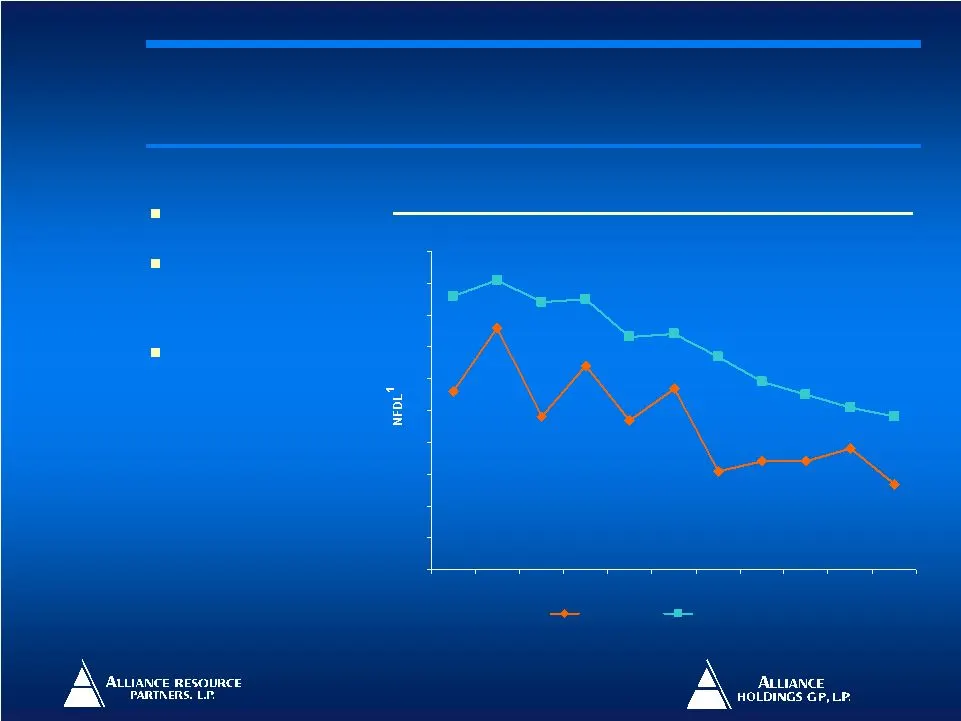
18 Safety is our #1 core value Alliance’s safety performance has been consistently better than its industry peer group Innovative use of technology to improve safety at all operations State-of-the-art Leaky Feeder mine communication systems Fiber optic based mine monitoring systems Proprietary Miner
Slide 19: Well Positioned in Scrubber Markets
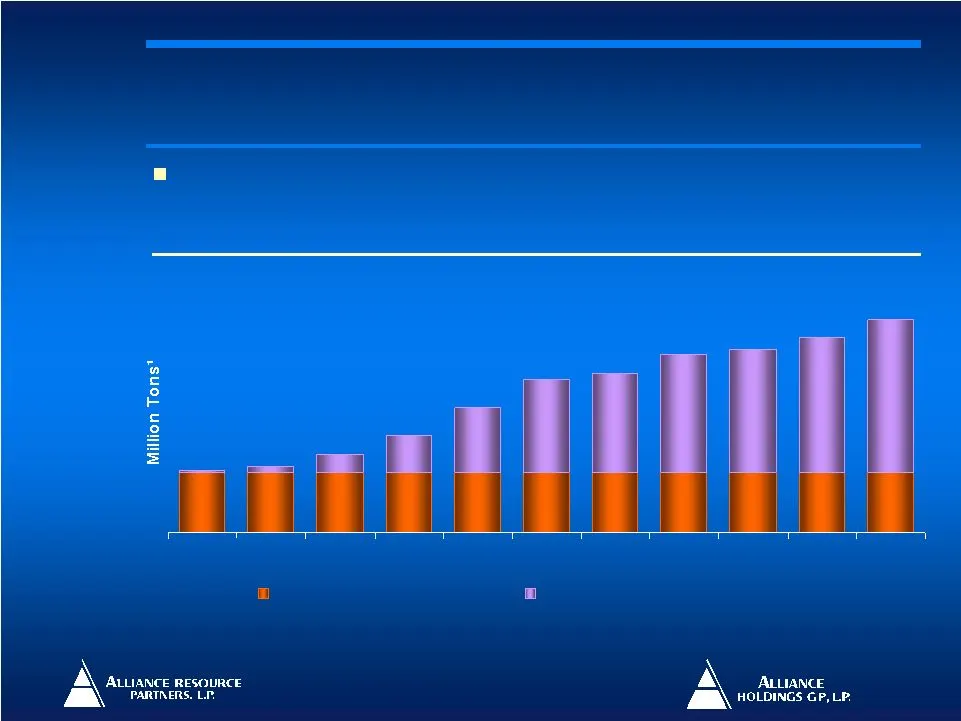
19 Future growth potential for scrubber market bodes well for Alliance’s high sulfur operations Source: The McIlvaine Company 1 Assumption used to convert gigawatts of capacity to million tons of coal: 9,600 Btu/Kwhr plant heat rate, 75% plant capacity factor, 12,500 Btu coal. 122 122 122 122 122 12
Slide 20: Well Positioned in Scrubber Markets
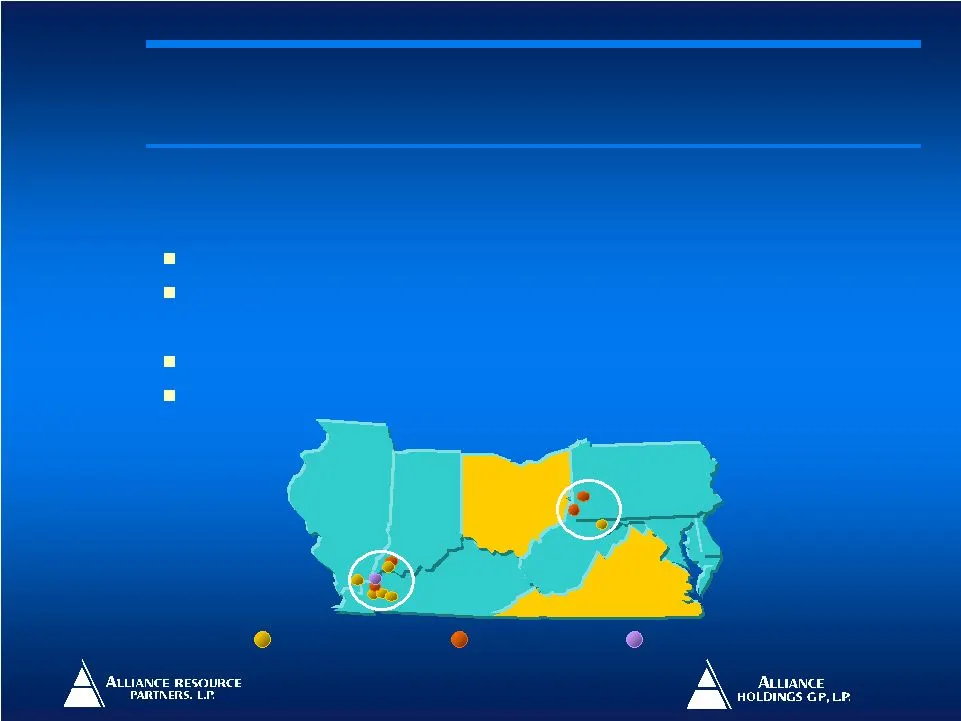
20 Indiana Ohio Maryland Virginia West Virginia Kentucky Approximately 676 million tons is “Scrubber” Quality Coal Illinois Basin: Second largest producer in the basin Currently accounts for ~74% of total Alliance coal production Northern Appalachian: Strong reserve base of ~164 million tons of high

Slide 21: IV. Financial Summary and Historical Results
21 IV. Financial Summary and IV. Financial Summary and Historical Results Historical Results
Slide 22: Consistent Track Record of Growth At Alliance
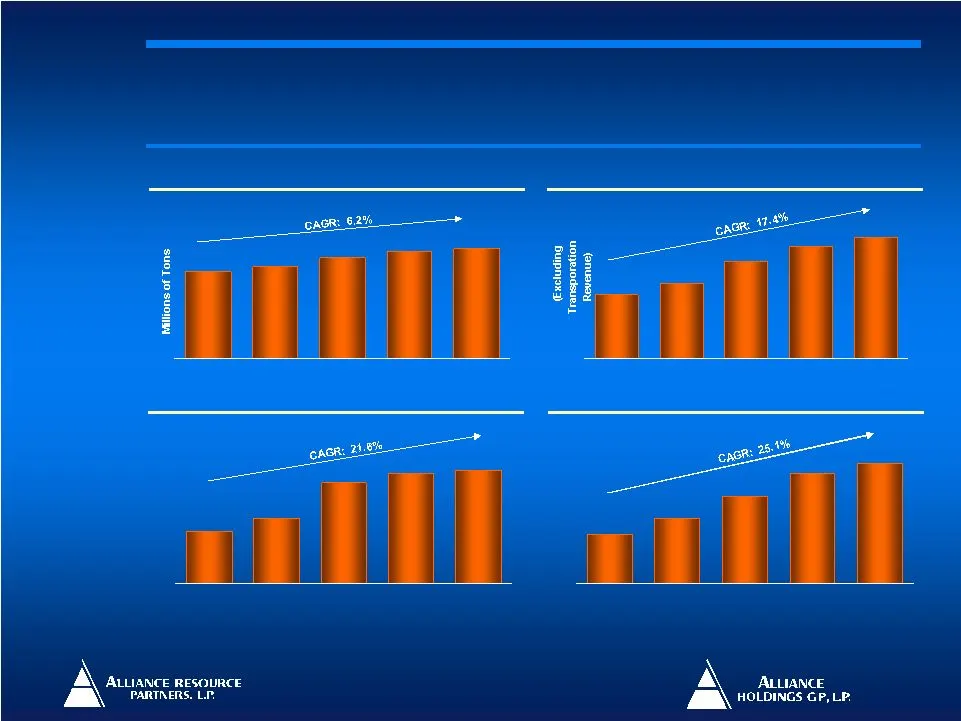
22 Note: EBITDA is a non-GAAP measure defined as income before net interest expense, income taxes and depreciation, depletion and amortization. See reconciliation slide of EBITDA to Net Income 1 Based on the midpoint of management guidance. $110.3 $145.1 $193.6 $245.0 $270.0 2003 2004 2005 2006 2007
Slide 23: Efficient Operator
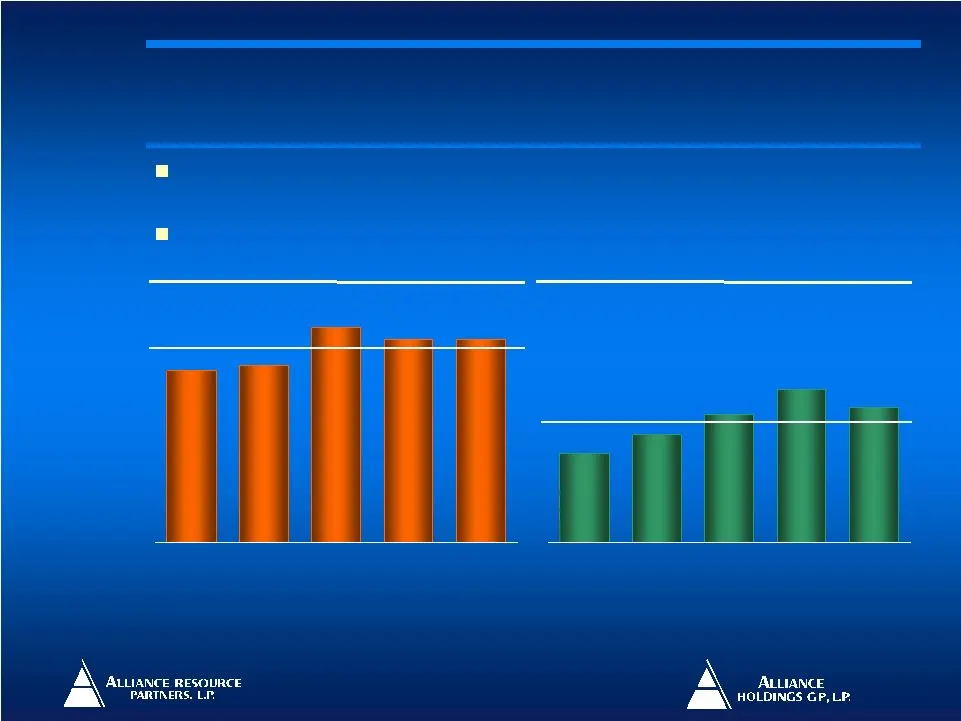
23 17.2% 19.4% 16.2% 13.7% 11.3% 2003 2004 2005 2006 2007YTD 21.9% 22.6% 27.4% 25.9% 25.9% 2003 2004 2005 2006 2007YTD Alliance is a low-cost, efficient coal operator, delivering sector-leading EBITDA margins 5 Year Average: Alliance: 24.7% vs. Peers: 15.6% Source: Public filings Note: EBITDA margin
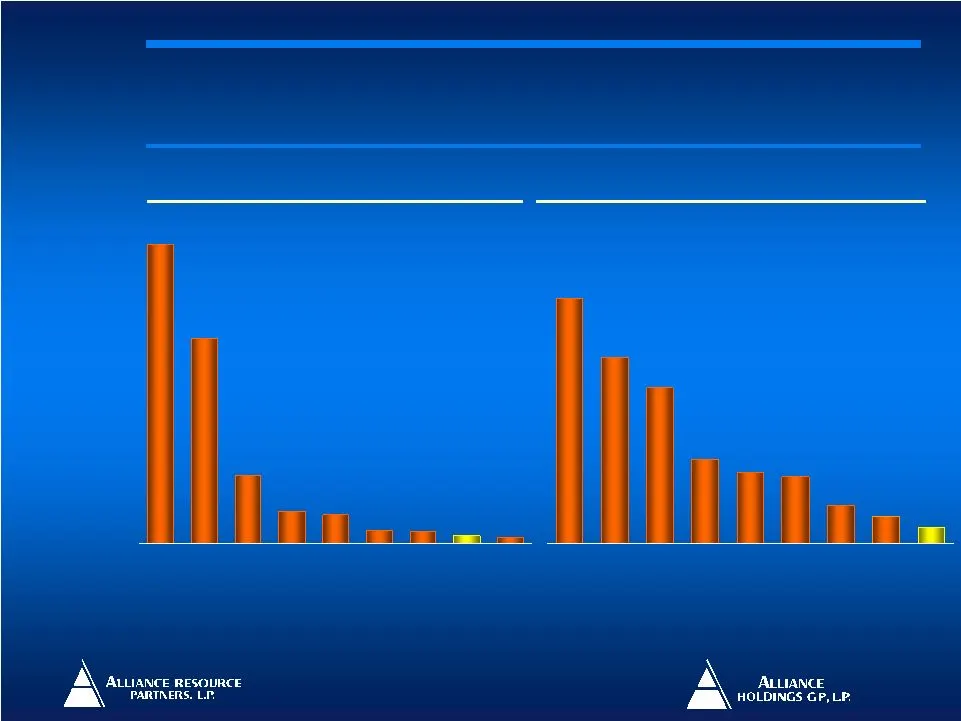
Slide 24: Overview of Coal Sector Legacy Liabilities
24 53.7% 40.7% 18.2% 15.6% 5.8% 3.6% 8.4% 34.1% 14.6% $3,191 $2,190 $341 $304 $84 $67 $132 $733 $136 Source: Latest Company Filings 1 Includes market cap of Alliance Resource and Alliance Holdings, adjusted for Alliance Holdings’ ownership in Alliance Resource. Peer A Peer B Peer C Peer E Peer F All

Slide 25: V. Investing in Alliance
25 V. Investing in Alliance V. Investing in Alliance
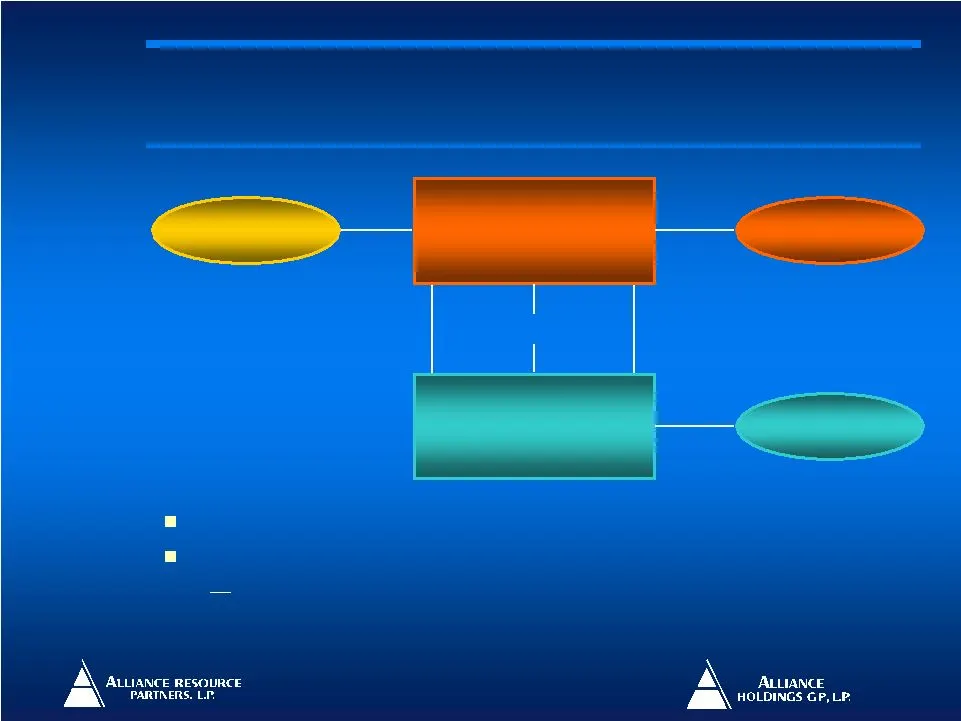
Slide 26: Two Ways to Invest in Alliance Partnerships
26 56.9% L.P. Interest 42.1% L.P. Interest 1.98% General Partner Interest 2 Alliance Holdings GP, L.P. (NASDAQ: AHGP) 59.9 million units outstanding Alliance Resource Partners, L.P. (NASDAQ: ARLP ) 36.6 million units outstanding Public Unitholders Management / Others ¹ 80.0% L.P. Interest Public Uni
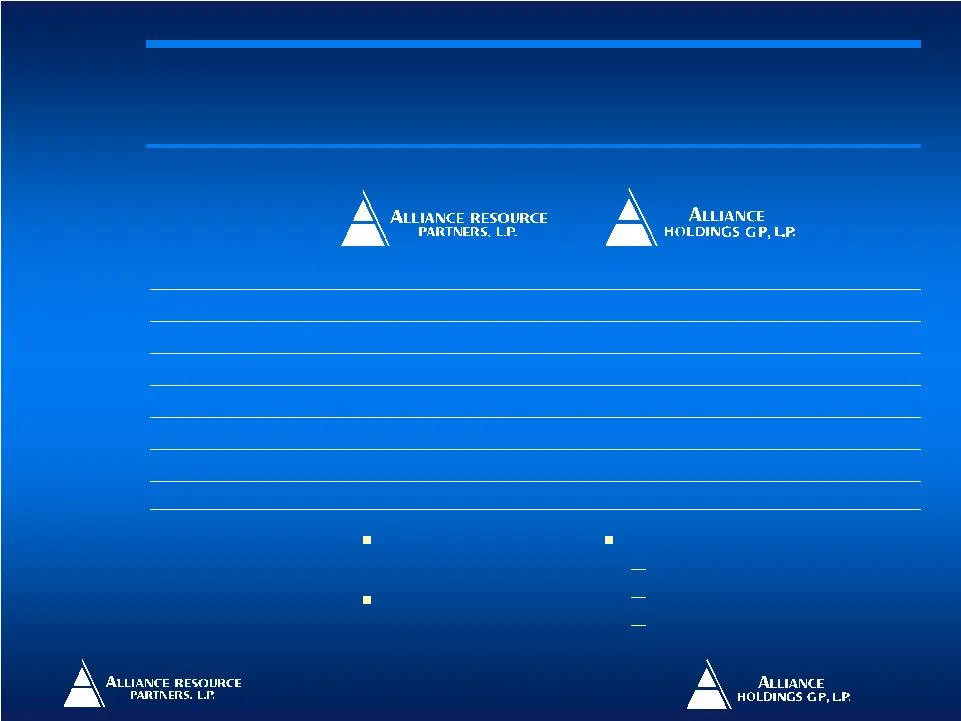
Slide 27: Alliance Partnership Profiles
27 8.2% 29.8% $1,639mm $1,487mm 1.74x $2.24 $40.67 $24.35 $1,458mm 0.0% $1,458mm $1.06 0.0% 1.01x Ownership Interests in Alliance Resource 1.98% G.P. Interest 100% of Incentive Distribution Rights 15.5 mm Alliance Resource common units 4th largest eastern coal producer operating 8 underground mining
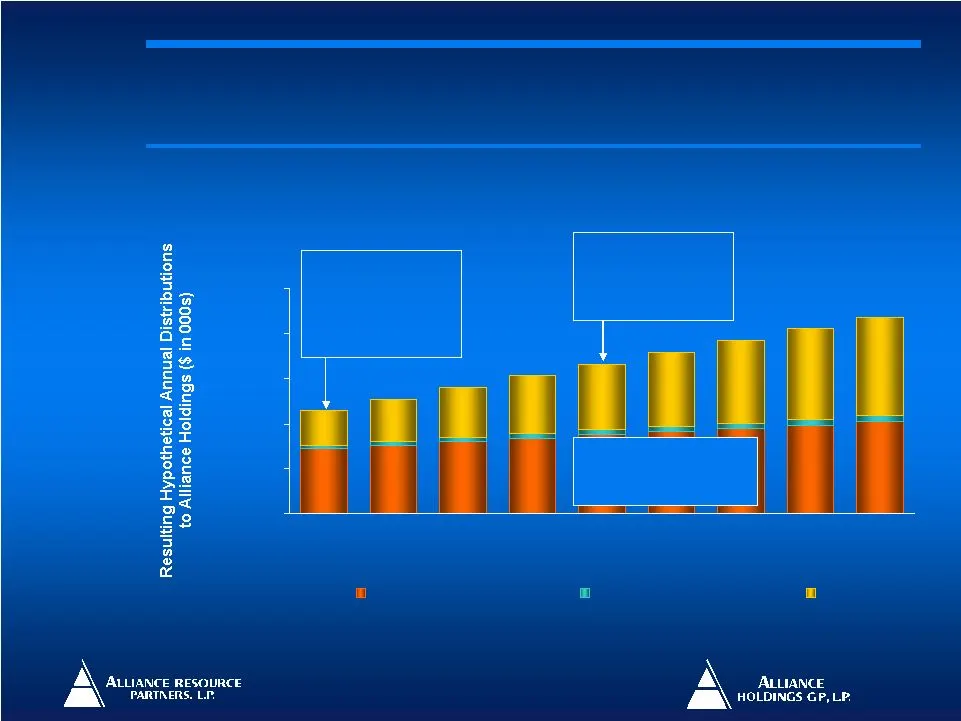
Slide 28: Alliance Holdings Leverage to Alliance Resource Distribution Growth
28 Incentive distribution rights provide Alliance Holdings unitholders with significant financial leverage to Alliance Resource distribution growth Note: This graph shows the impact to Alliance Holdings as a result of Alliance Resource raising or lowering its quarterly distribution from the current
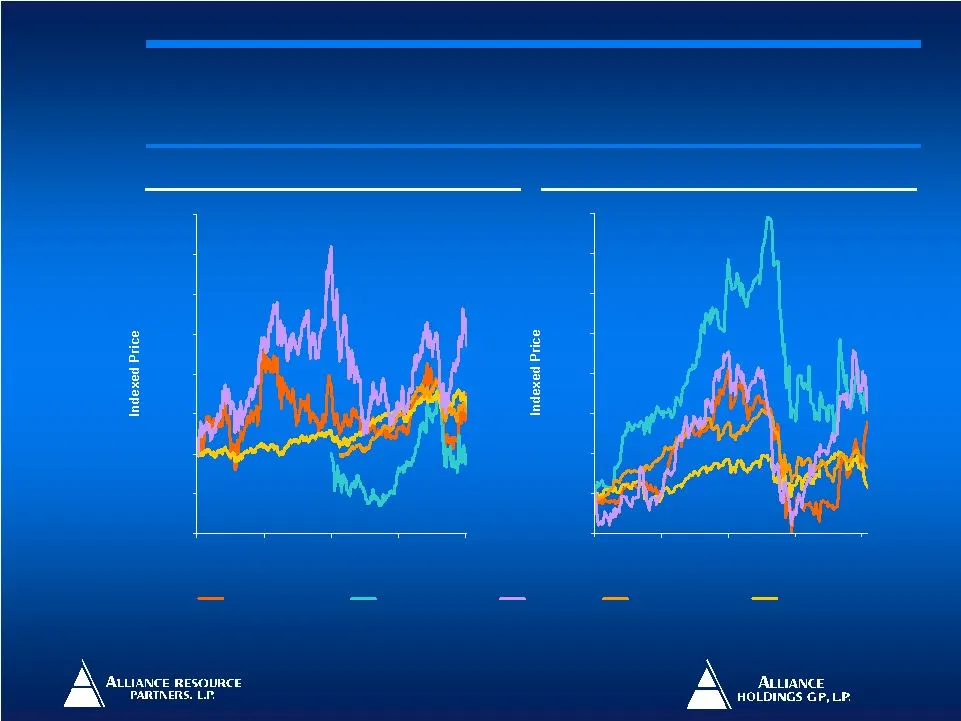
Slide 29: Share Price Performance Versus Peers
29 Source: Factset Note: Coal Peers include: Alpha, Arch, Consol, Foundation, International Coal, James River, Massey, Natural Resource Partners, Peabody and Penn Virginia. Alliance Resource Alliance Holdings Coal Peers Alerian MLP Index S&P 500 Index 90% 100% 110% 120% 130% 140% 150% 160% 170% Jan-

Slide 30: A\ Avance resource A Aan
A\ Avance resource A Aan PARTNERS. LI MA 1000s cee
Slide 31: EBITDA reconciliation
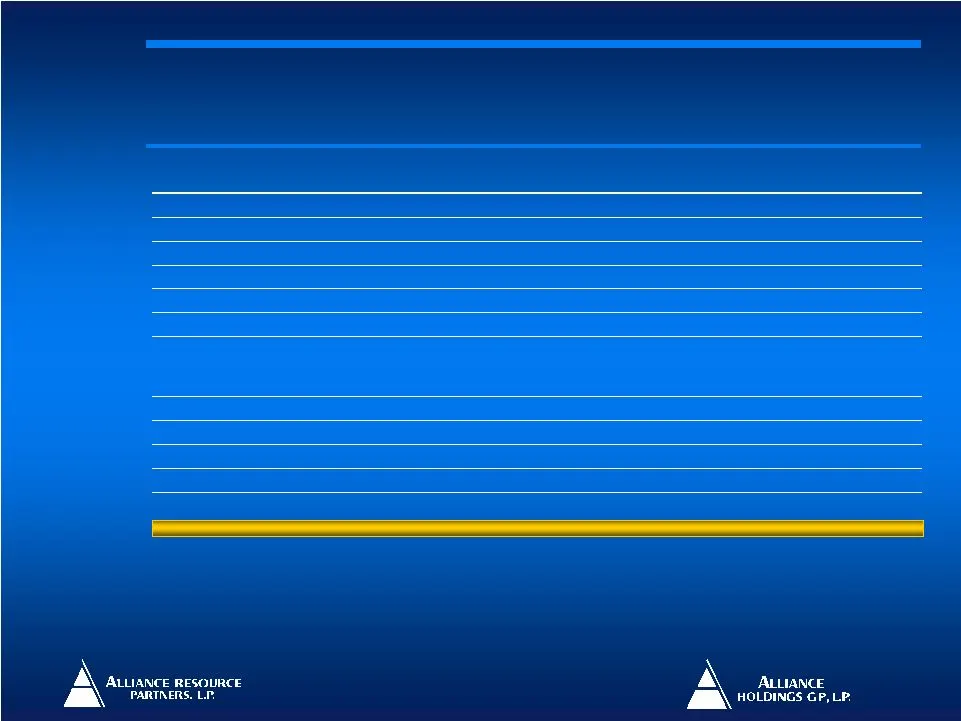
31 (200) 161 – – – Minority Interest Income – 112 – – – Cumulative Effect of Accounting Change (2,400) (2,443) (2,682) (2,641) (2,577) Income Taxes (10,600) (9,175) (11,816) (14,963) (15,981) Interest Expense (87,200) (66,489) (55,637) (53,664) (52,495) Depreciation, Depletion and Amortization $260,

Slide 32: Alliance Resource Partners / Alliance Holdings GP
32 Alliance Resource Partners, L.P. Alliance Resource Partners, L.P. Alliance Holdings GP, L.P. Alliance Holdings GP, L.P. RBC Capital Markets RBC Capital Markets MLP Conference MLP Conference November 15, 2007 November 15, 2007
Source: SEC EDGAR · 8-K filed Nov 15, 2007
More decks from Alliance Holdings GP L.P
 MLP Investor Conference 201237 slides · May 23, 2012
 Merger or Acquisition (September 2011)7 slides · Sep 22, 2011
 Raymond James Coal Investor Conference (December 2008)17 slides · Dec 4, 2008
 MLP Investor Conference 200837 slides · May 21, 2008
 RBC Capital Markets Second Annual MLP Conference 200633 slides · Nov 17, 2006
 Argus Research Vision 2007 Conference33 slides · Nov 13, 2006