Columbia Property Trust — Investor Presentation (November 2015)
38 slides from Columbia Property Trust's investor presentation, Nov 17, 2015
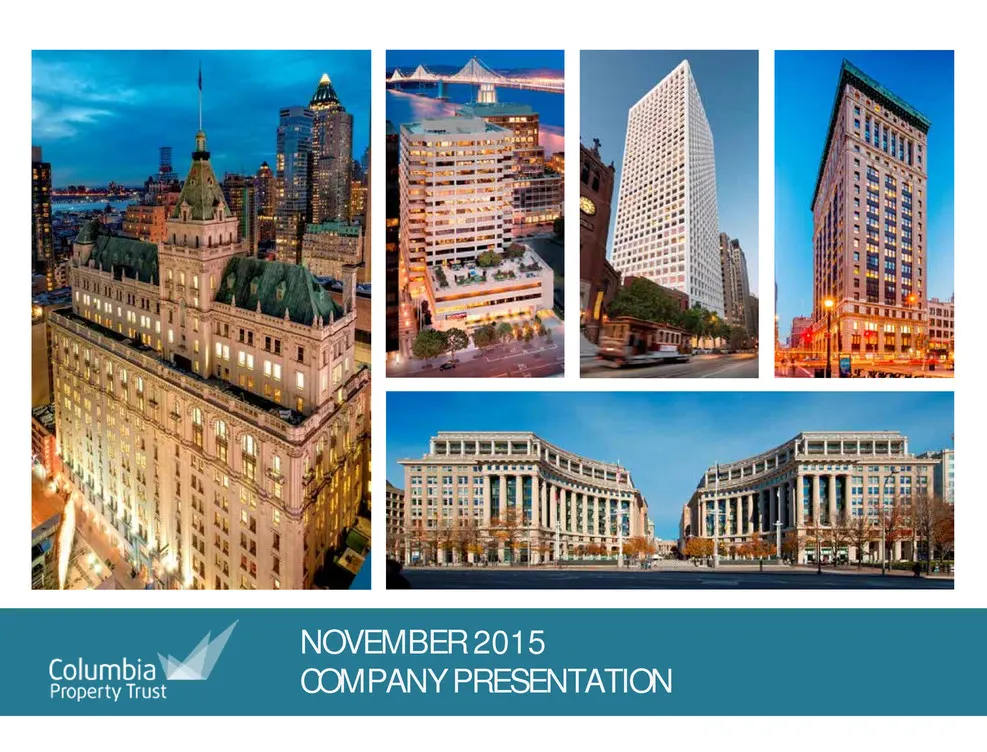
Slide 1: Company Presentation November 2015
1 NOVEMBER 2015 COMPANY PRESENTATION
Slide 2: Forward-Looking Statements
2 FORWARD-LOOKING STATEMENTS Certain statements contained in this presentation other than historical facts may be considered forward-looking statements. Such statements include, in particular, statements about our plans, strategies, and prospects, and are subject to certain risks and uncertainties,
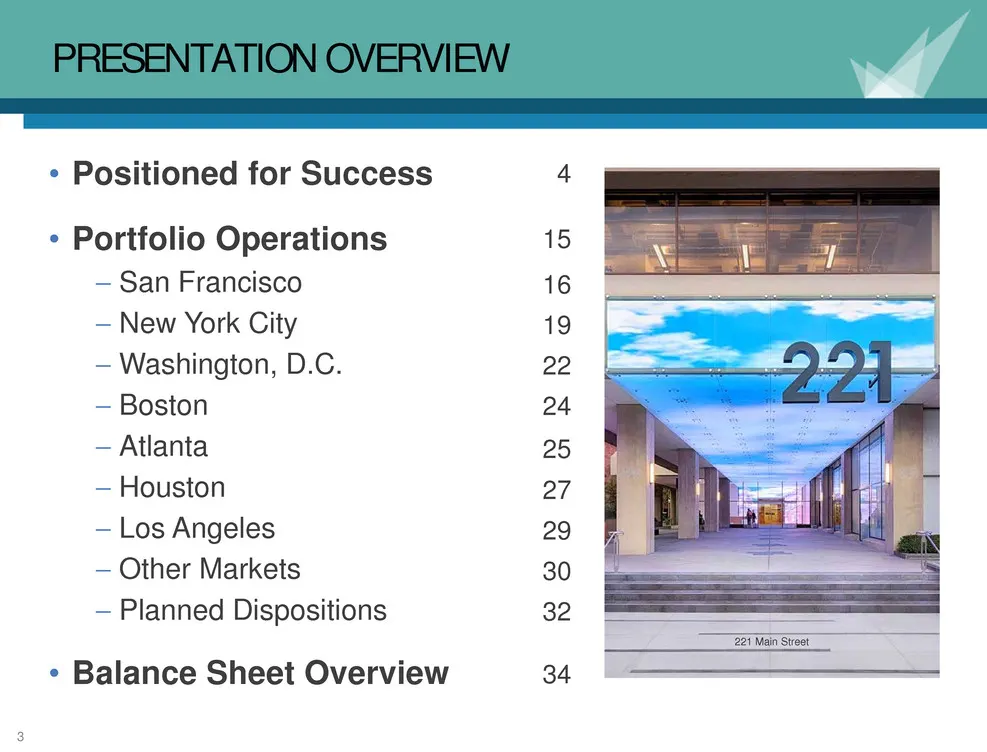
Slide 3: Presentation Overview
3 PRESENTATION OVERVIEW 221 Main Street • Positioned for Success • Portfolio Operations - San Francisco - New York City - Washington, D.C. - Boston - Atlanta - Houston - Los Angeles - Other Markets - Planned Dispositions • Balance Sheet Overview 4 15 16 19 22 24 25 27 29 30 32 34

Slide 4: Positioned for Success
4 POSITIONED FOR SUCCESS View of 333 Market Street, San Francisco
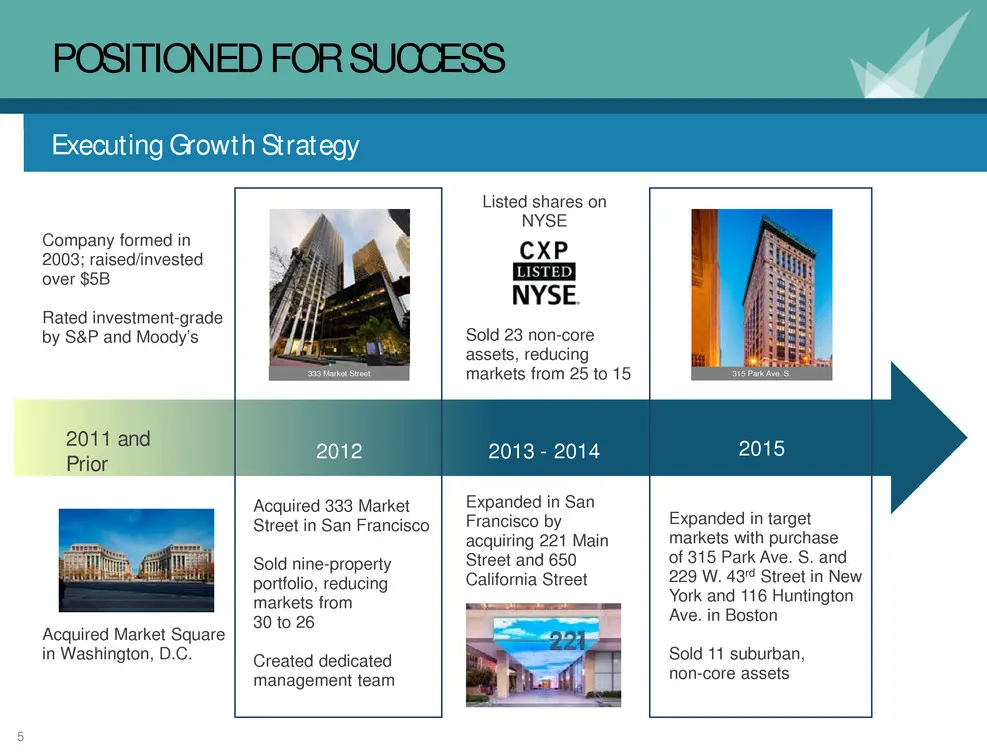
Slide 5: Positioned for Success: Executing Growth Strategy
5 POSITIONED FOR SUCCESS Company formed in 2003; raised/invested over $5B Rated investment-grade by S&P and Moody’s Acquired Market Square in Washington, D.C. 2011 and Prior Listed shares on NYSE Expanded in San Francisco by acquiring 221 Main Street and 650 California Street Sold 23 non-core assets
Slide 6: Regional Management Platform and Leadership Team
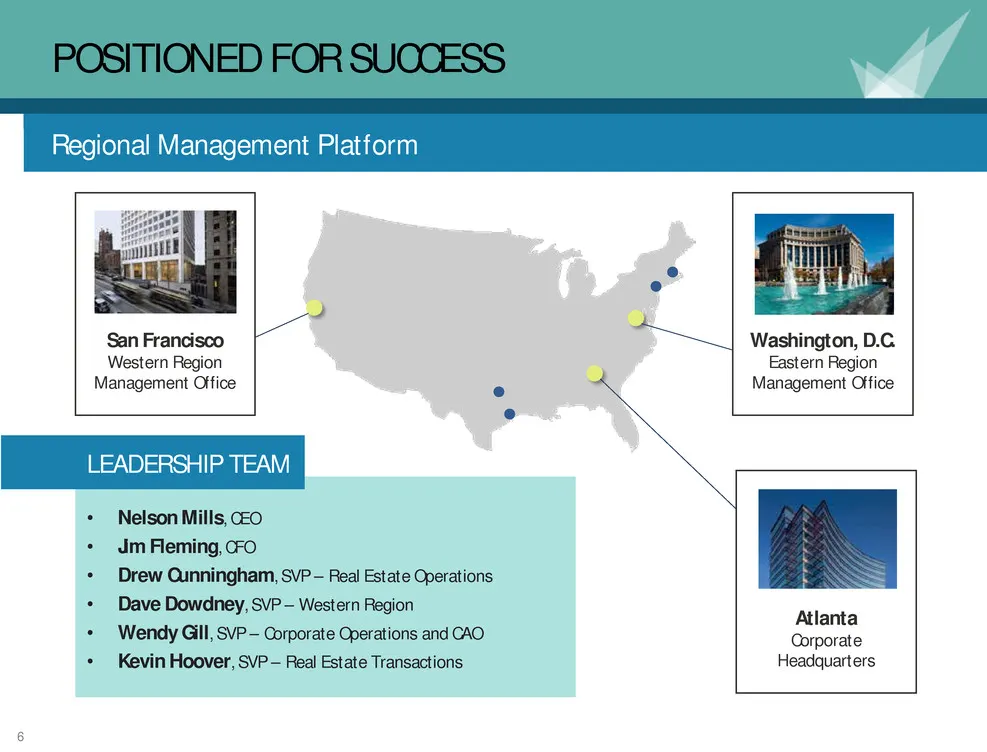
6 POSITIONED FOR SUCCESS San Francisco Western Region Management Office Washington, D.C. Eastern Region Management Office Atlanta Corporate Headquarters LEADERSHIP TEAM • Nelson Mills, CEO • Jim Fleming, CFO • Drew Cunningham, SVP – Real Estate Operations • Dave Dowdney, SVP – Western Region • Wendy
Slide 7: Competitive Market Exposure
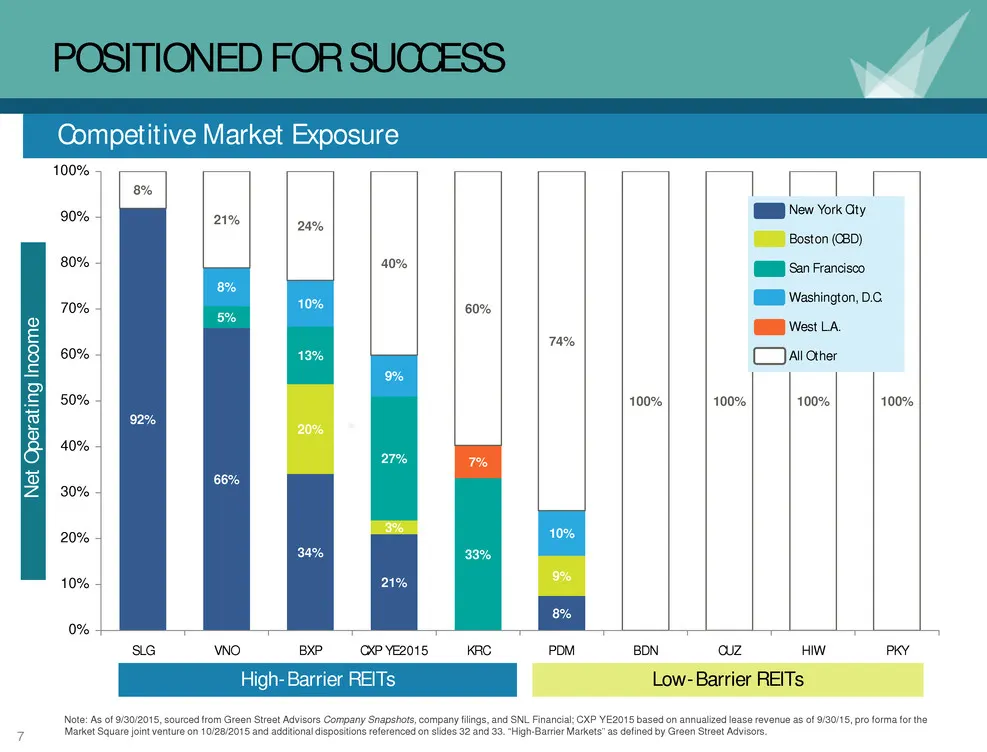
7 POSITIONED FOR SUCCESS 92% 66% 34% 21% 8% 20% 3% 9% 5% 13% 27% 33% 8% 10% 9% 10% 7% 8% 21% 24% 40% 60% 74% 100% 100% 100% 100% 0% 10% 20% 30% 40% 50% 60% 70% 80% 90% 100% SLG VNO BXP CXP YE2015 KRC PDM BDN CUZ HIW PKY New York City Boston (CBD) San Francisco Washington, D.C. West L.A. All Other No
Slide 8: Net Rent Per Square Foot
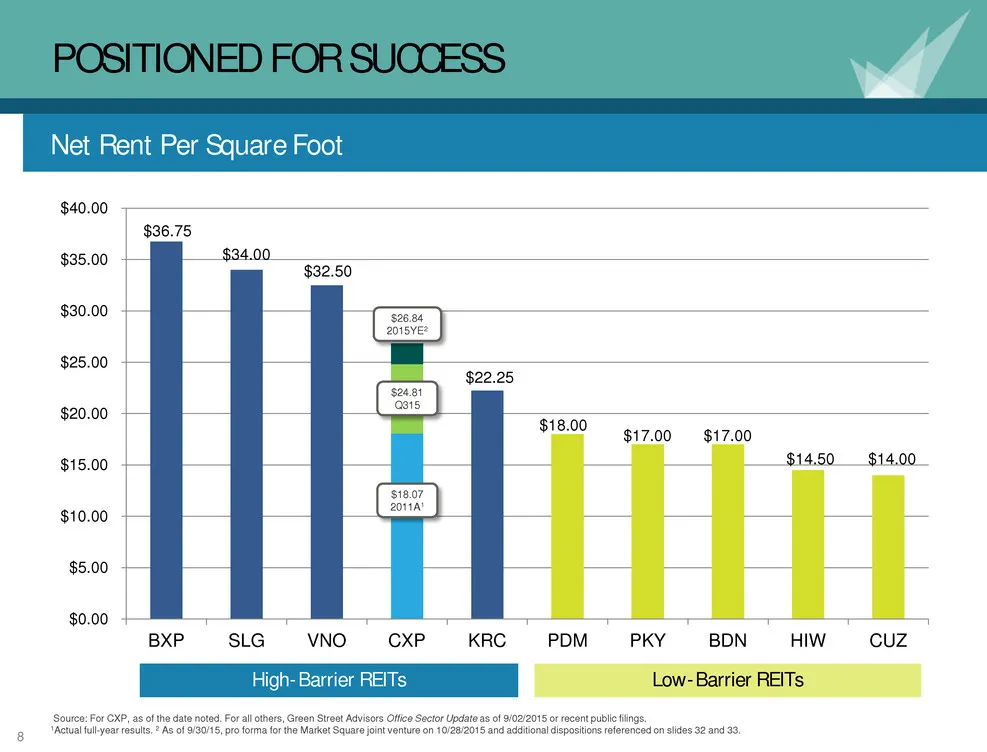
8 $36.75 $34.00 $32.50 $22.25 $18.00 $17.00 $17.00 $14.50 $14.00 $0.00 $5.00 $10.00 $15.00 $20.00 $25.00 $30.00 $35.00 $40.00 BXP SLG VNO CXP KRC PDM PKY BDN HIW CUZ POSITIONED FOR SUCCESS High-Barrier REITs Low-Barrier REITs Net Rent Per Square Foot Source: For CXP, as of the date noted. For all ot
Slide 9: Target Portfolio Profile
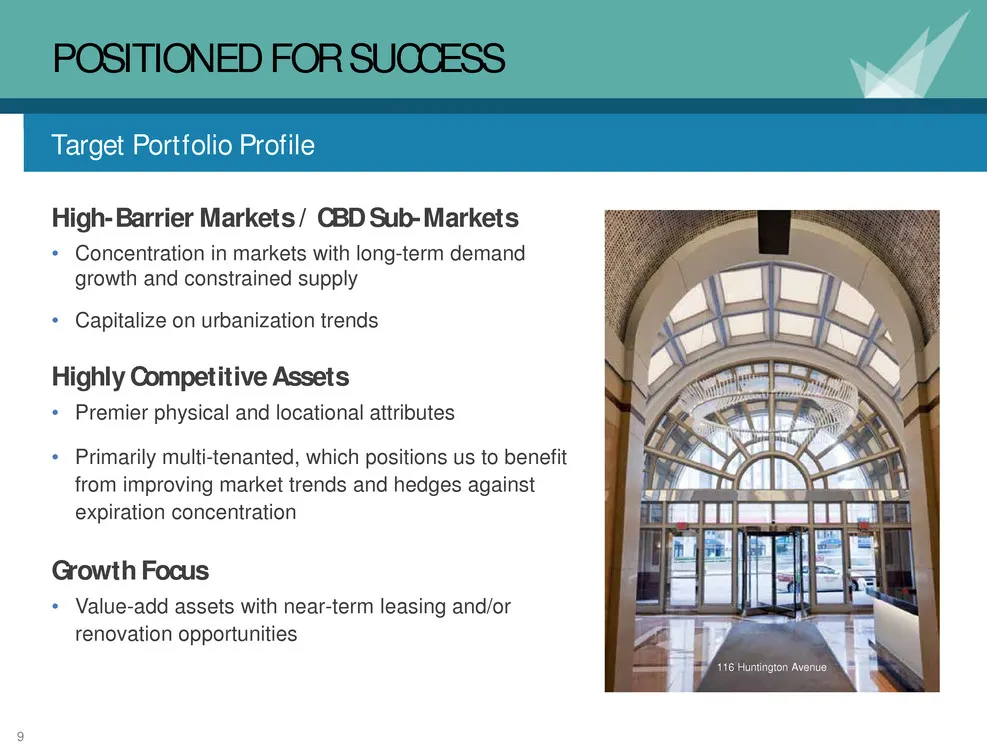
9 POSITIONED FOR SUCCESS High-Barrier Markets / CBD Sub-Markets • Concentration in markets with long-term demand growth and constrained supply • Capitalize on urbanization trends Highly Competitive Assets • Premier physical and locational attributes • Primarily multi-tenanted, which positions us to
Slide 10: Portfolio Profile
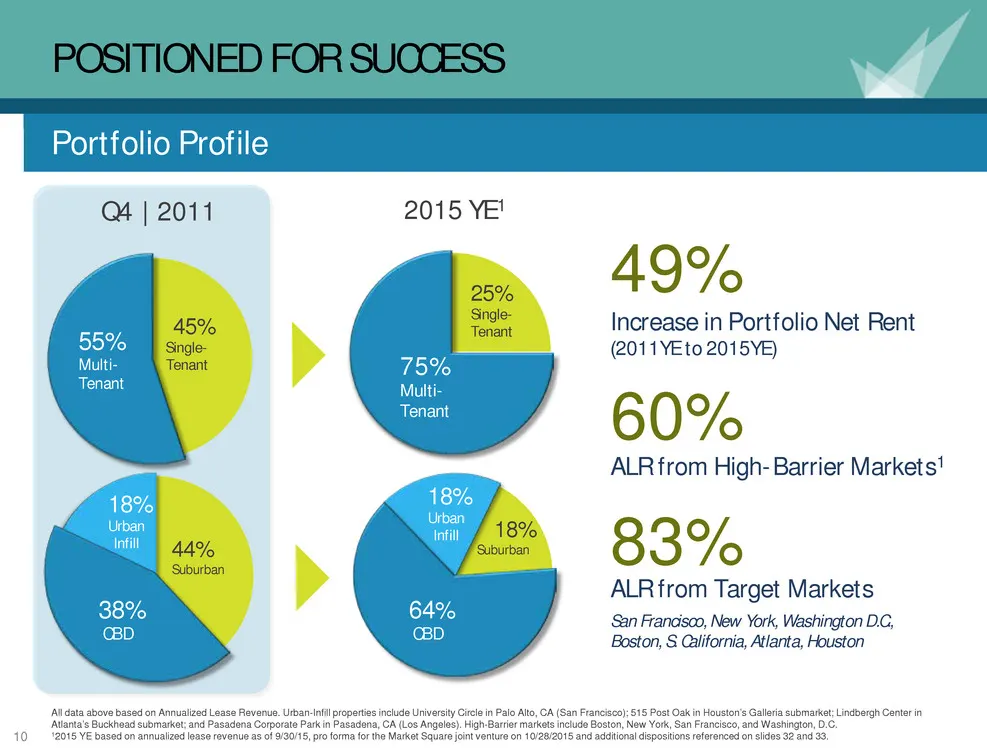
10 POSITIONED FOR SUCCESS Portfolio Profile All data above based on Annualized Lease Revenue. Urban-Infill properties include University Circle in Palo Alto, CA (San Francisco); 515 Post Oak in Houston’s Galleria submarket; Lindbergh Center in Atlanta’s Buckhead submarket; and Pasadena Corporate Par
Slide 11: Dispositions Accomplished
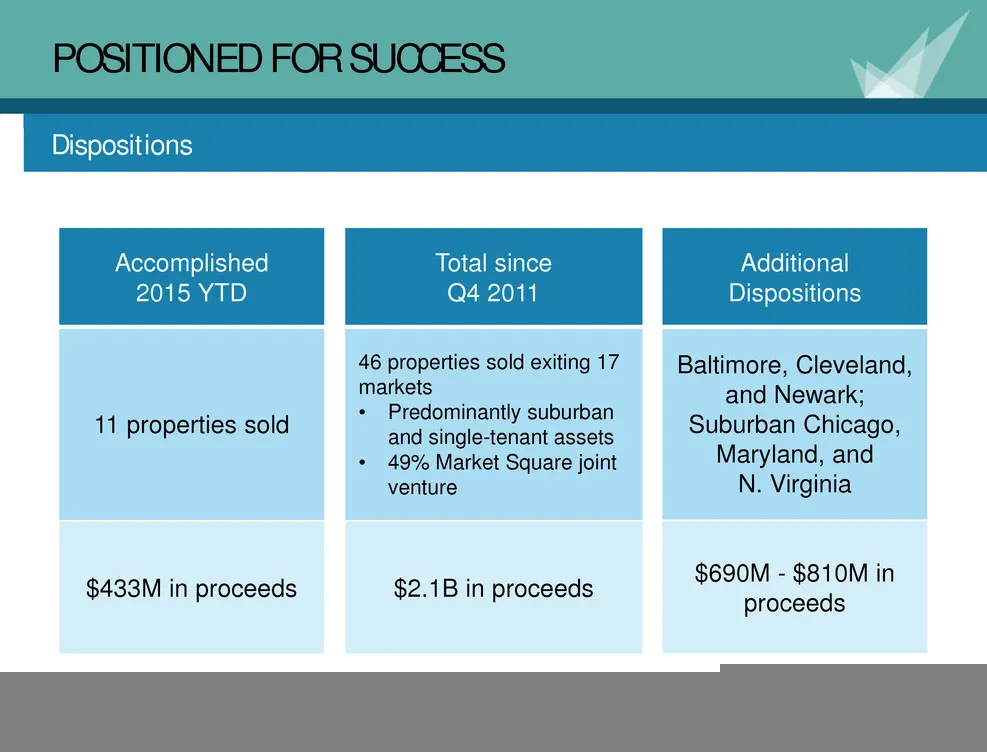
11 POSITIONED FOR SUCCESS Dispositions Accomplished 2015 YTD 11 properties sold $433M in proceeds Total since Q4 2011 46 properties sold exiting 17 markets • Predominantly suburban and single-tenant assets • 49% Market Square joint venture $2.1B in proceeds Additional Dispositions Baltimore, Clevela
Slide 12: Acquisitions Accomplished
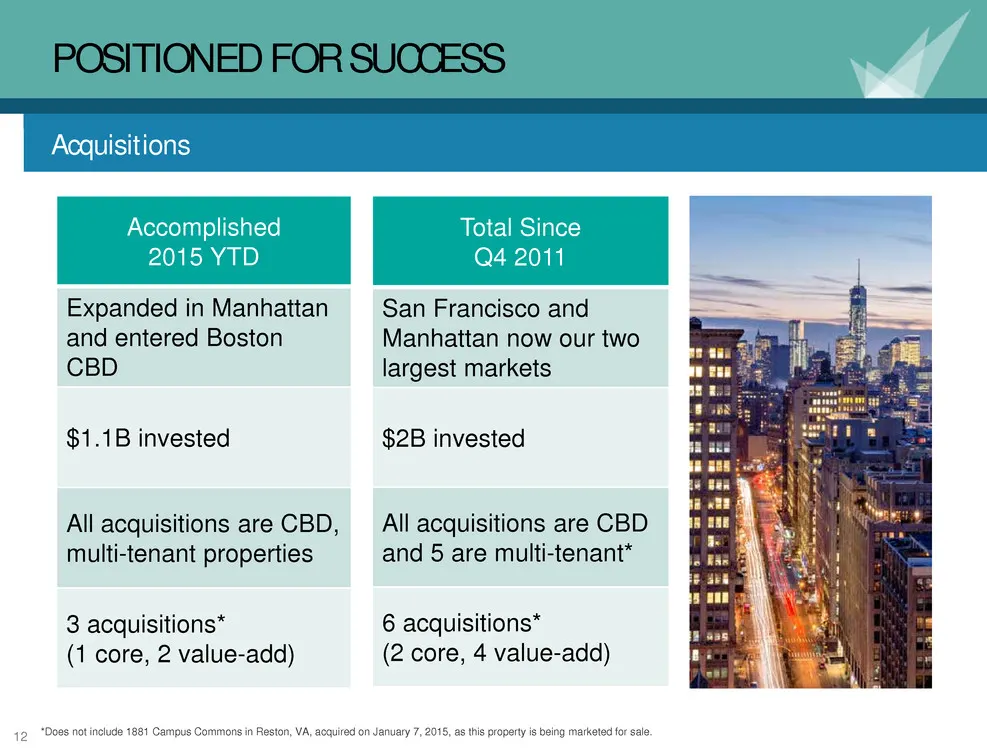
12 POSITIONED FOR SUCCESS Acquisitions Accomplished 2015 YTD Expanded in Manhattan and entered Boston CBD $1.1B invested All acquisitions are CBD, multi-tenant properties 3 acquisitions* (1 core, 2 value-add) *Does not include 1881 Campus Commons in Reston, VA, acquired on January 7, 2015, as this p
Slide 13: Total ALR Expiring by Year
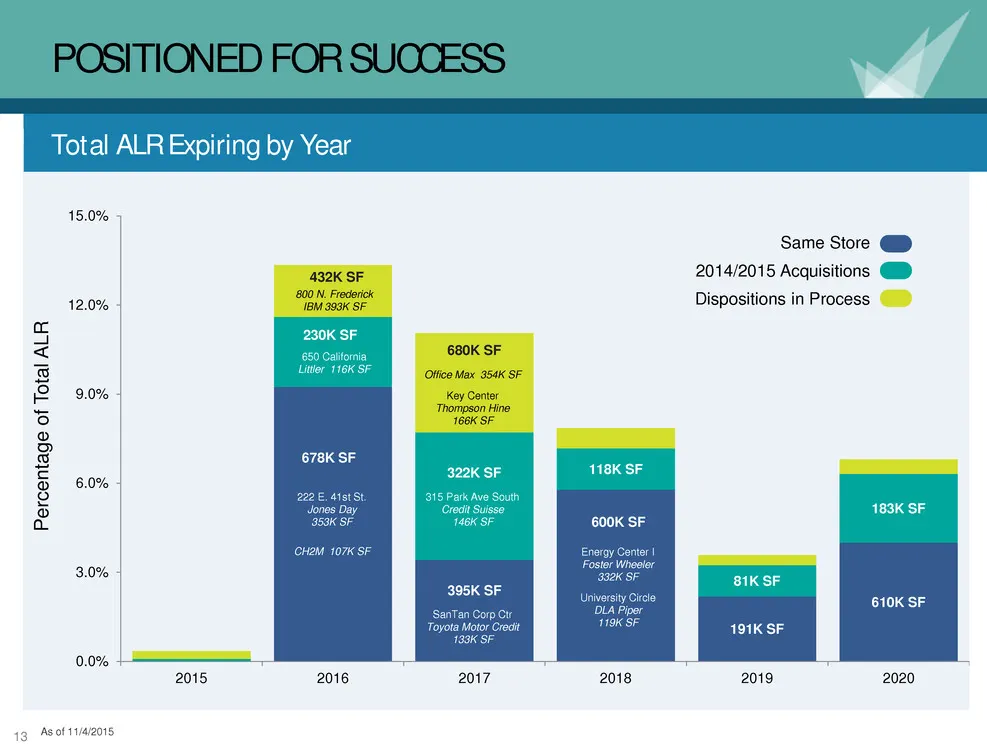
13 678K SF 395K SF 600K SF 191K SF 610K SF 230K SF 322K SF 118K SF 81K SF 183K SF 432K SF 680K SF 0.0% 3.0% 6.0% 9.0% 12.0% 15.0% 2015 2016 2017 2018 2019 2020 SanTan Corp Ctr Toyota Motor Credit 133K SF 222 E. 41st St. Jones Day 353K SF CH2M 107K SF Energy Center I Foster Wheeler 332K SF University
Slide 14: Near-Term Objectives
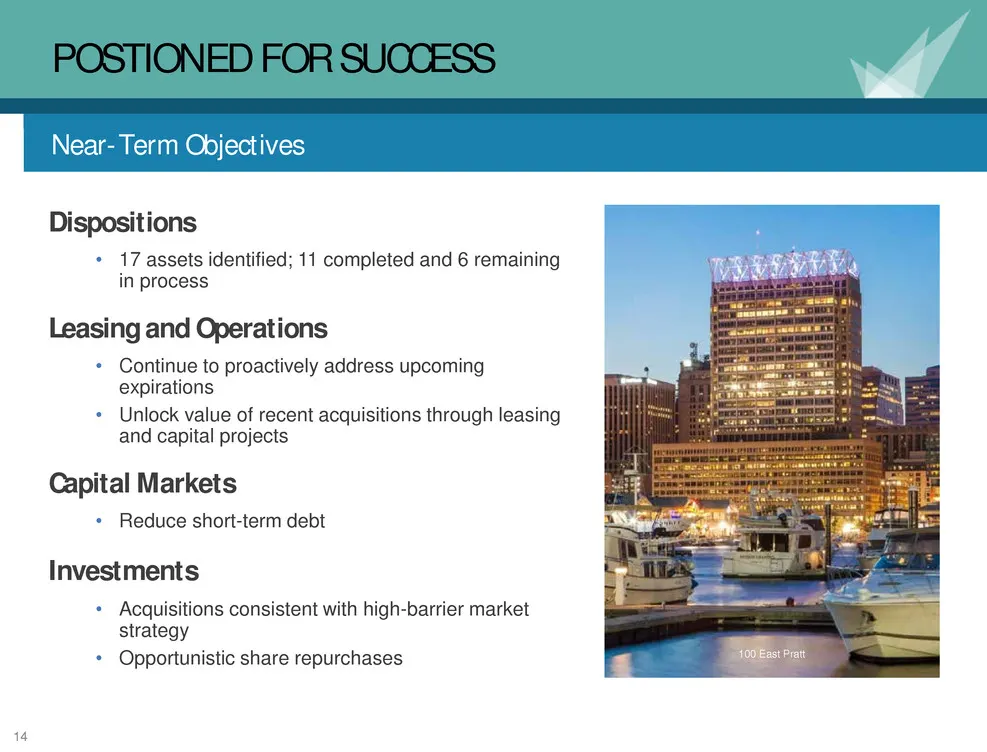
14 POSTIONED FOR SUCCESS Dispositions • 17 assets identified; 11 completed and 6 remaining in process Leasing and Operations • Continue to proactively address upcoming expirations • Unlock value of recent acquisitions through leasing and capital projects Capital Markets • Reduce short-term debt Inve
Slide 15: Portfolio Operations
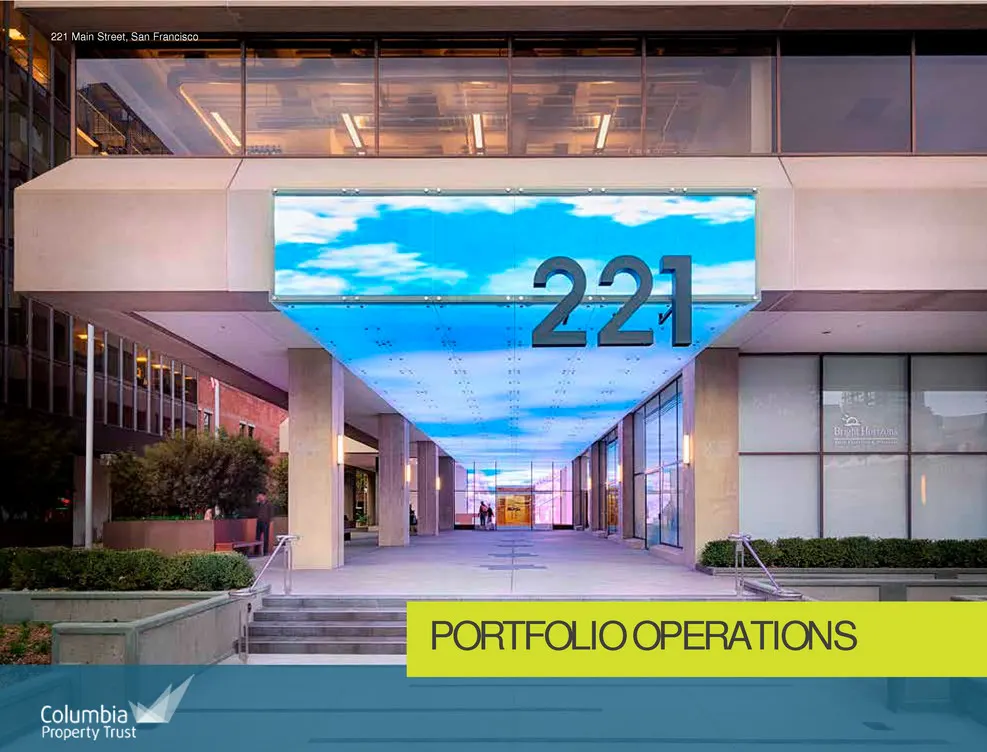
15 PORTFOLIO OPERATIONS 221 Main Street, San Francisco
Slide 16: San Francisco Market Portfolio Overview
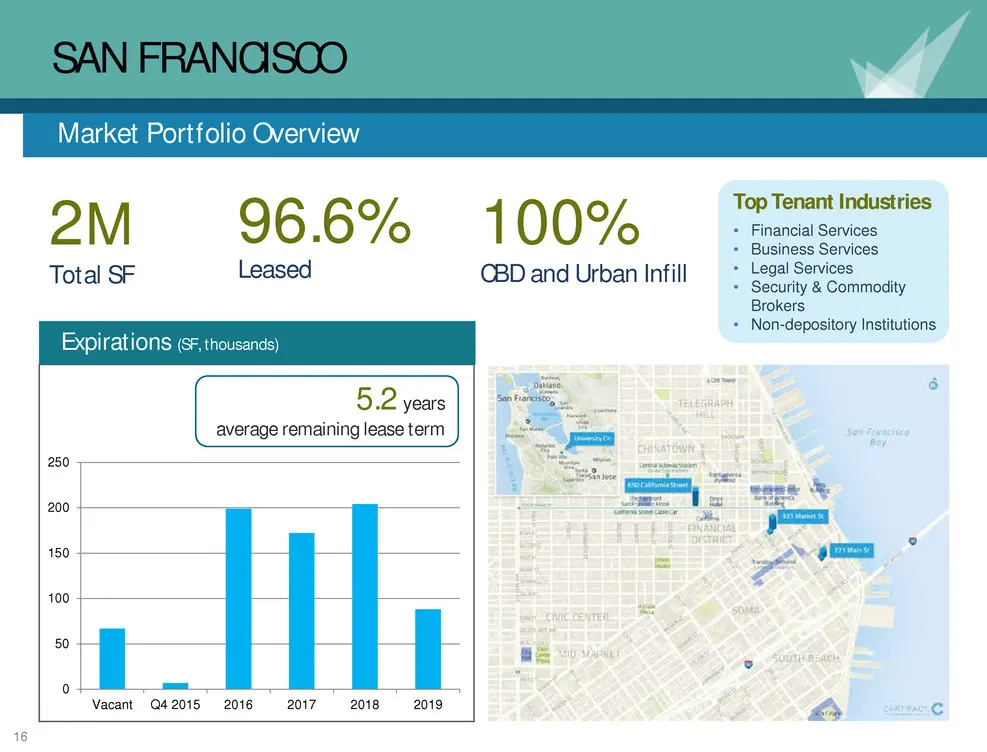
16 SAN FRANCISCO Market Portfolio Overview 2 M Total SF 96.6% Leased 0 50 100 150 200 250 Vacant Q4 2015 2016 2017 2018 2019 100% CBD and Urban Infill Expirations (SF, thousands) 5.2 years average remaining lease term Top Tenant Industries • Financial Services • Business Services • Legal Services •
Slide 17: San Francisco: 650 California Street and 221 Main Street
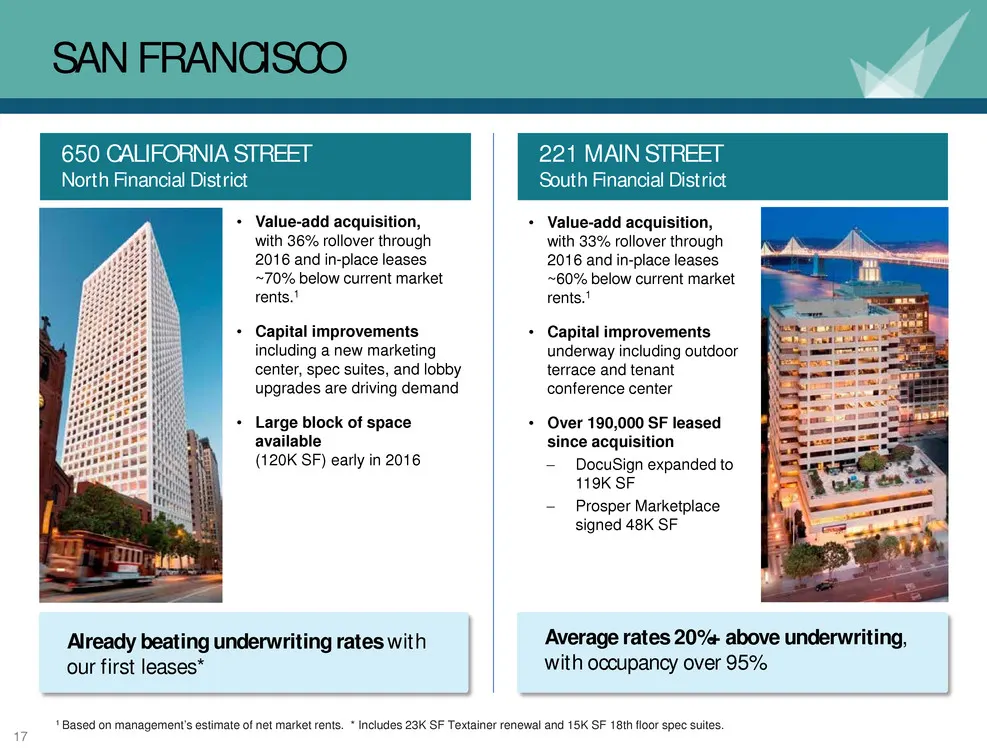
17 SAN FRANCISCO • Value-add acquisition, with 36% rollover through 2016 and in-place leases ~70% below current market rents.1 • Capital improvements including a new marketing center, spec suites, and lobby upgrades are driving demand • Large block of space available (120K SF) early in 2016 650 CALI
Slide 18: San Francisco: University Circle and 333 Market Street
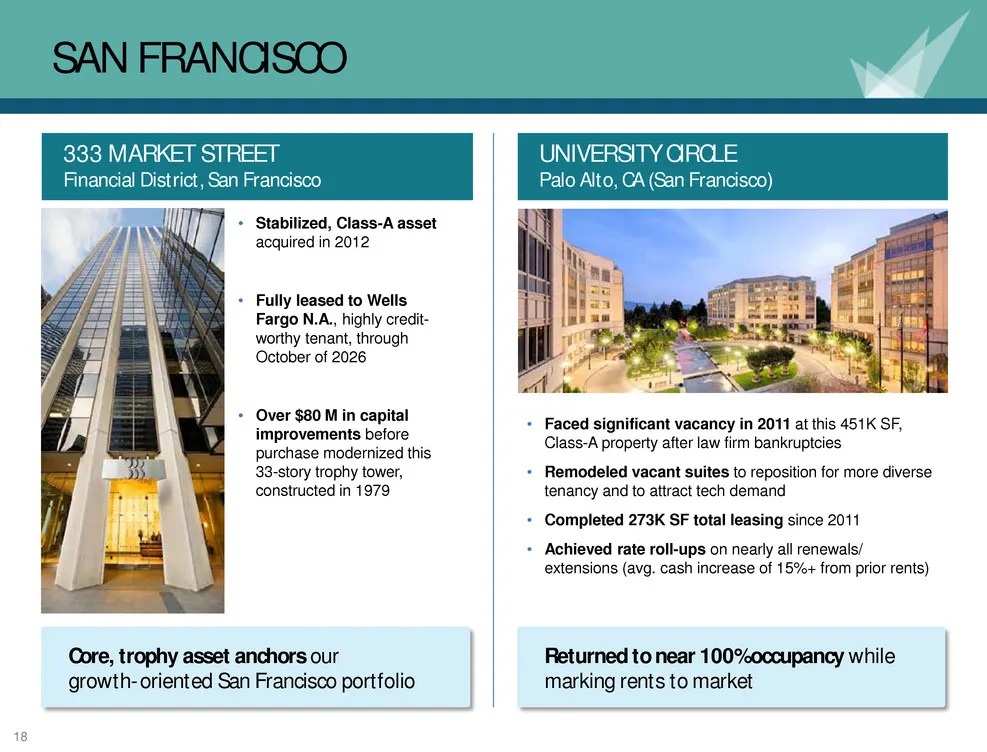
18 SAN FRANCISCO UNIVERSITY CIRCLE Palo Alto, CA (San Francisco) Returned to near 100% occupancy while marking rents to market • Faced significant vacancy in 2011 at this 451K SF, Class-A property after law firm bankruptcies • Remodeled vacant suites to reposition for more diverse tenancy and to att
Slide 19: New York City Market Portfolio Overview
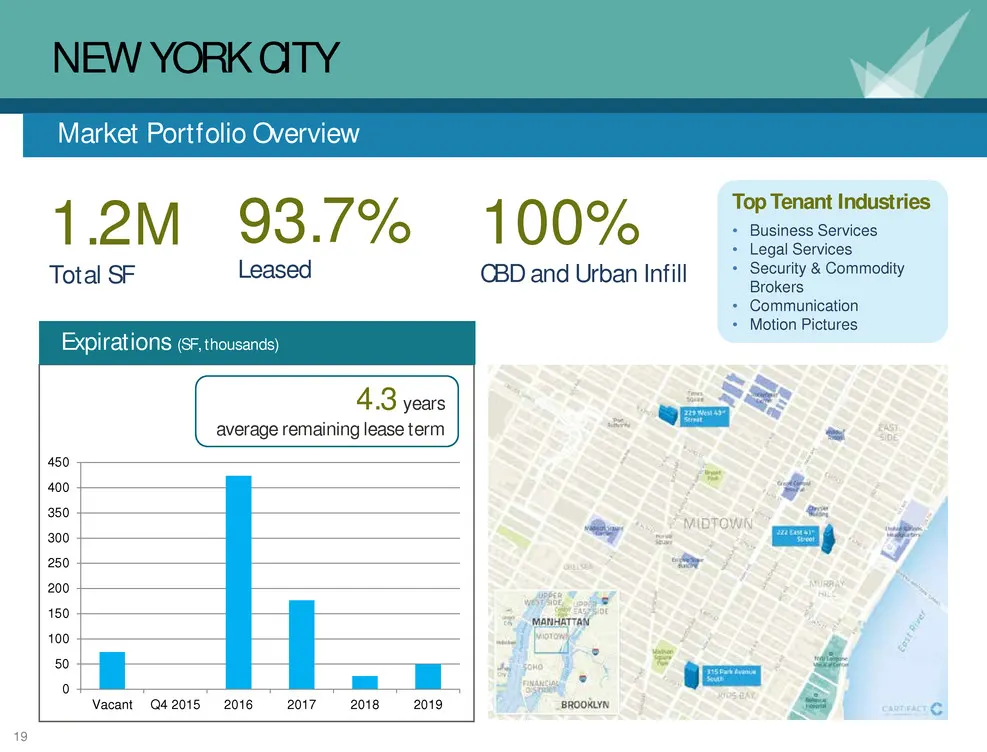
19 NEW YORK CITY Market Portfolio Overview 1.2 M Total SF 93.7% Leased 0 50 100 150 200 250 300 350 400 450 Vacant Q4 2015 2016 2017 2018 2019 100% CBD and Urban Infill Expirations (SF, thousands) 4.3 years average remaining lease term Top Tenant Industries • Business Services • Legal Services • Sec
Slide 20: New York City: 315 Park Avenue South and 229 W. 43rd Street
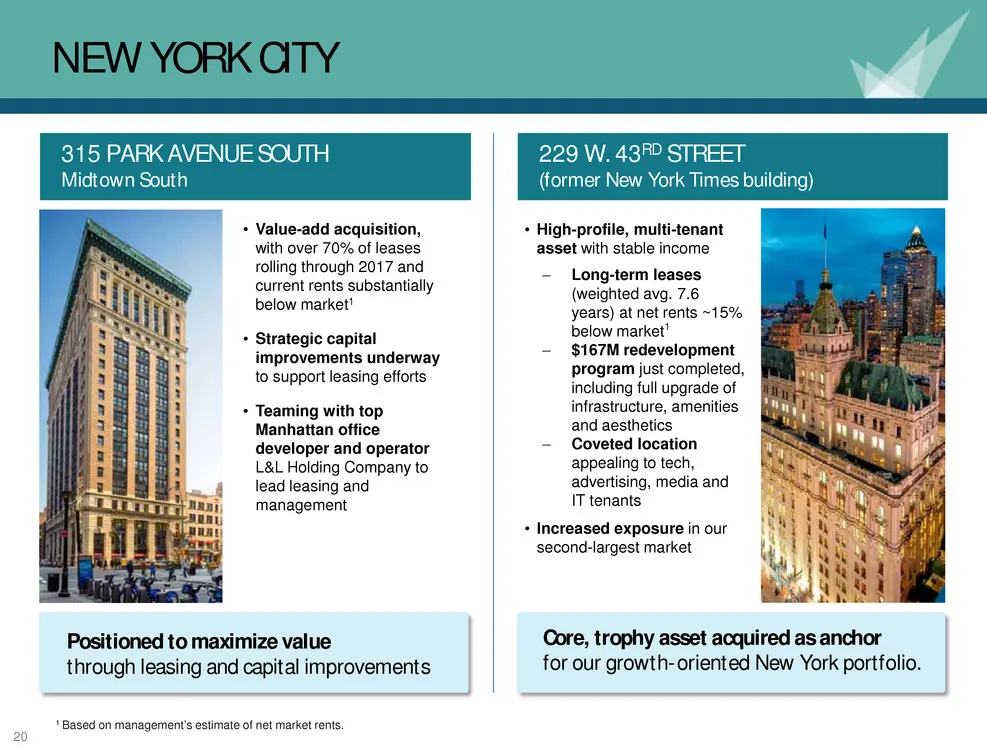
20 NEW YORK CITY Core, trophy asset acquired as anchor for our growth-oriented New York portfolio 1 Based on management’s estimate of net market rents. 315 PARK AVENUE SOUTH Midtown South Positioned to maximize value through leasing and capital improvements • Value-add acquisition, with over 70% of
Slide 21: New York City: East 41st Street
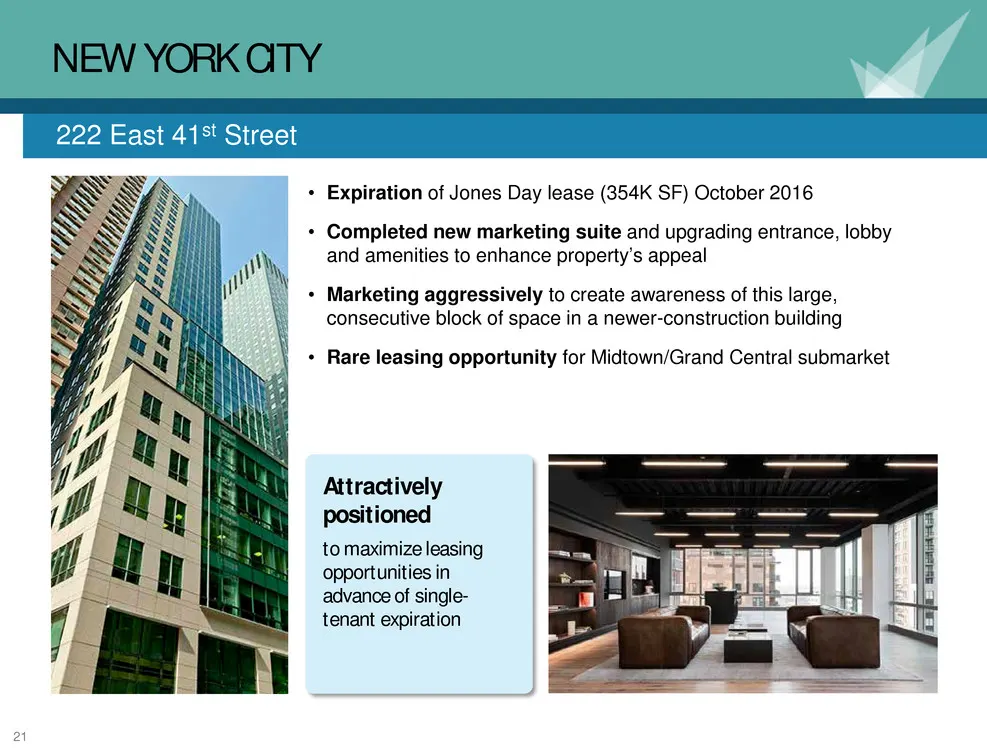
21 NEW YORK CITY 222 East 41st Street • Expiration of Jones Day lease (354K SF) October 2016 • Completed new marketing suite and upgrading entrance, lobby and amenities to enhance property’s appeal • Marketing aggressively to create awareness of this large, consecutive block of space in a newer-cons
Slide 22: Washington, D.C. Market Portfolio Overview
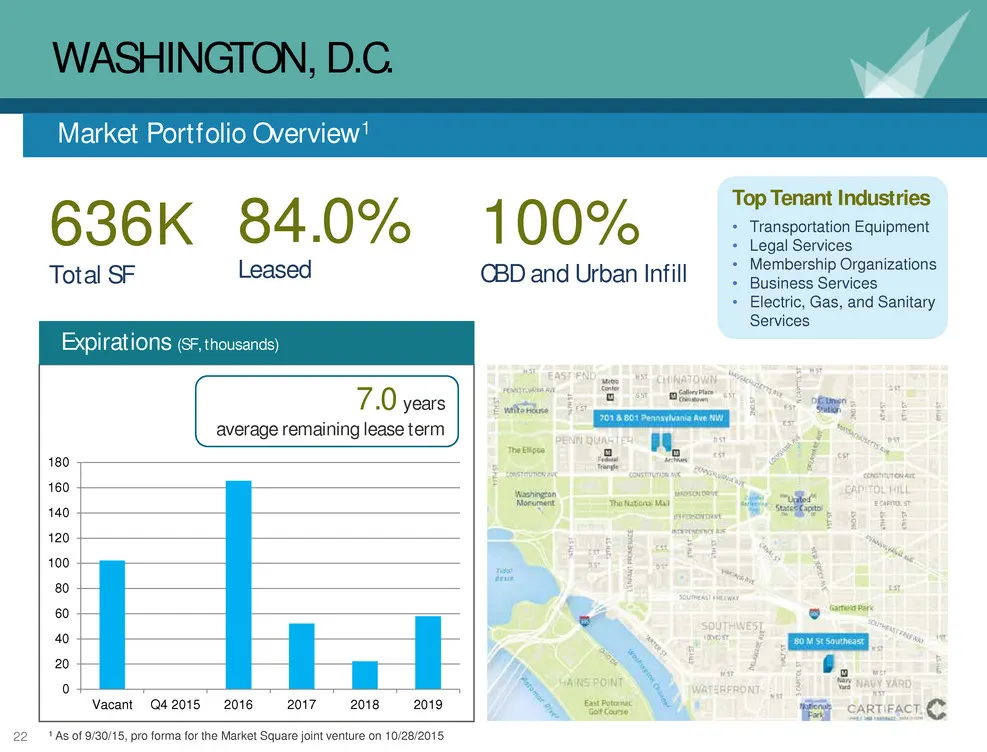
22 WASHINGTON, D.C. Market Portfolio Overview1 636 K Total SF 84.0% Leased 0 20 40 60 80 100 120 140 160 180 Vacant Q4 2015 2016 2017 2018 2019 100% CBD and Urban Infill Expirations (SF, thousands) 7.0 years average remaining lease term Top Tenant Industries • Transportation Equipment • Legal Servic
Slide 23: Washington, D.C.: M Street and Market Square
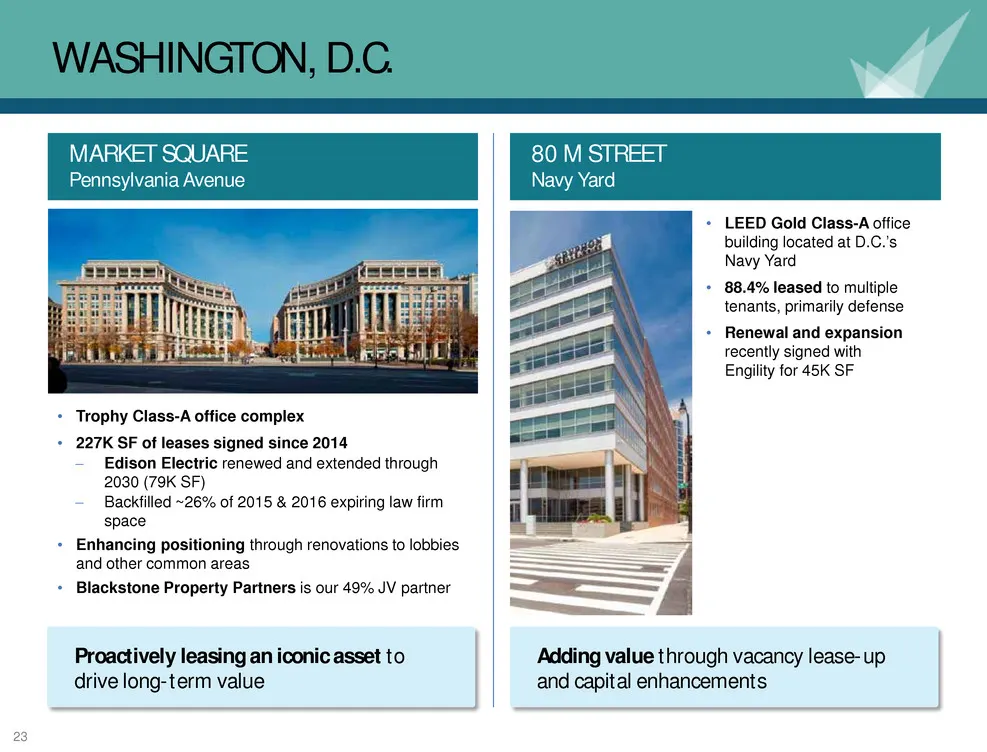
23 WASHINGTON, D.C. 80 M STREET Navy Yard Adding value through vacancy lease-up and capital enhancements • LEED Gold Class-A office building located at D.C.’s Navy Yard • 88.4% leased to multiple tenants, primarily defense • Renewal and expansion recently signed with Engility for 45K SF MARKET SQUAR
Slide 24: Boston: Huntington Avenue
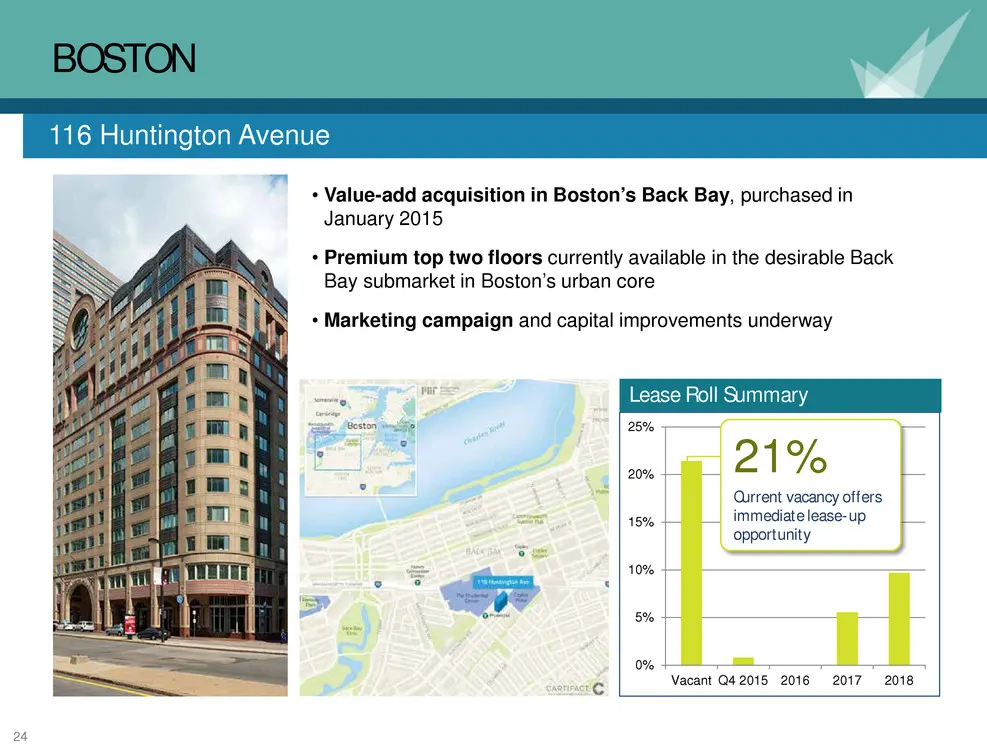
24 BOSTON 116 Huntington Avenue Lease Roll Summary 0% 5% 10% 15% 20% 25% Vacant Q4 2015 2016 2017 2018 21% Current vacancy offers immediate lease-up opportunity • Value-add acquisition in Boston’s Back Bay, purchased in January 2015 • Premium top two floors currently available in the desirable Back
Slide 25: Atlanta Market Portfolio Overview
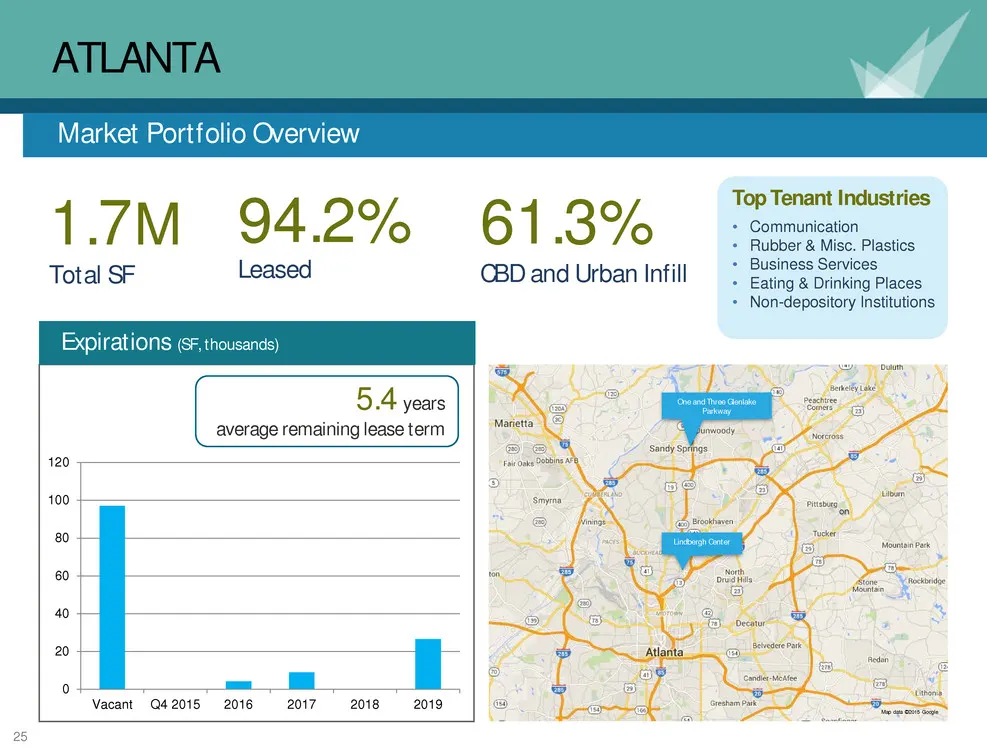
25 ATLANTA Market Portfolio Overview 1.7 M Total SF 94.2% Leased 0 20 40 60 80 100 120 Vacant Q4 2015 2016 2017 2018 2019 61.3% CBD and Urban Infill Expirations (SF, thousands) 5.4 years average remaining lease term Map data ©2015 Google on Lindbergh Center One and Three Glenlake Parkway Top Tenant
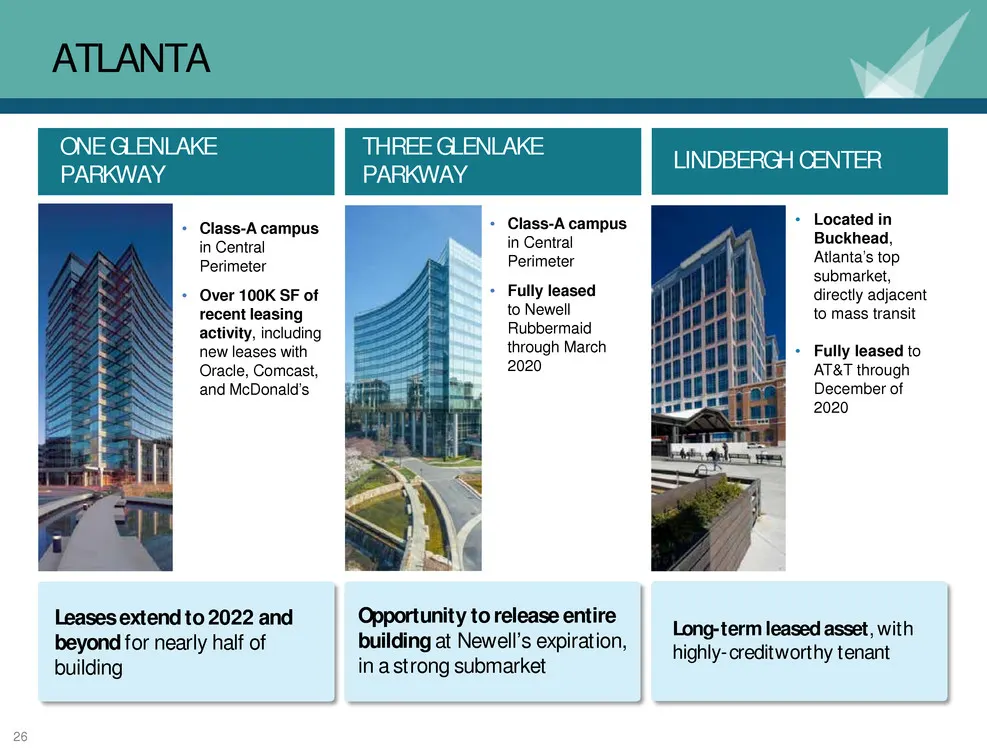
Slide 26: Atlanta: Lindbergh Center and Glenlake Parkway
26 ATLANTA LINDBERGH CENTER • Located in Buckhead, Atlanta’s top submarket, directly adjacent to mass transit • Fully leased to AT&T through December of 2020 Long-term leased asset, with highly-creditworthy tenant • Class-A campus in Central Perimeter • Over 100K SF of recent leasing activity, inclu
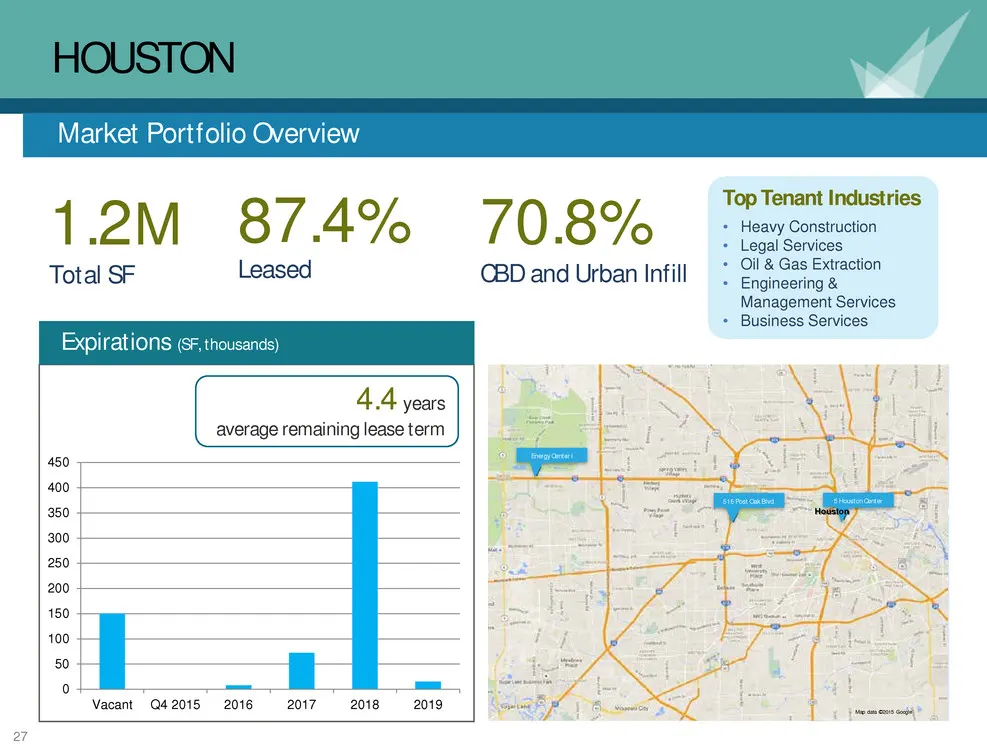
Slide 27: Houston Market Portfolio Overview
27 HOUSTON Market Portfolio Overview 1.2 M Total SF 87.4% Leased 0 50 100 150 200 250 300 350 400 450 Vacant Q4 2015 2016 2017 2018 2019 70.8% CBD and Urban Infill Expirations (SF, thousands) 4.4 years average remaining lease term Map data ©2015 Google 5 Houston Center Houston Energy Center I 515 Po
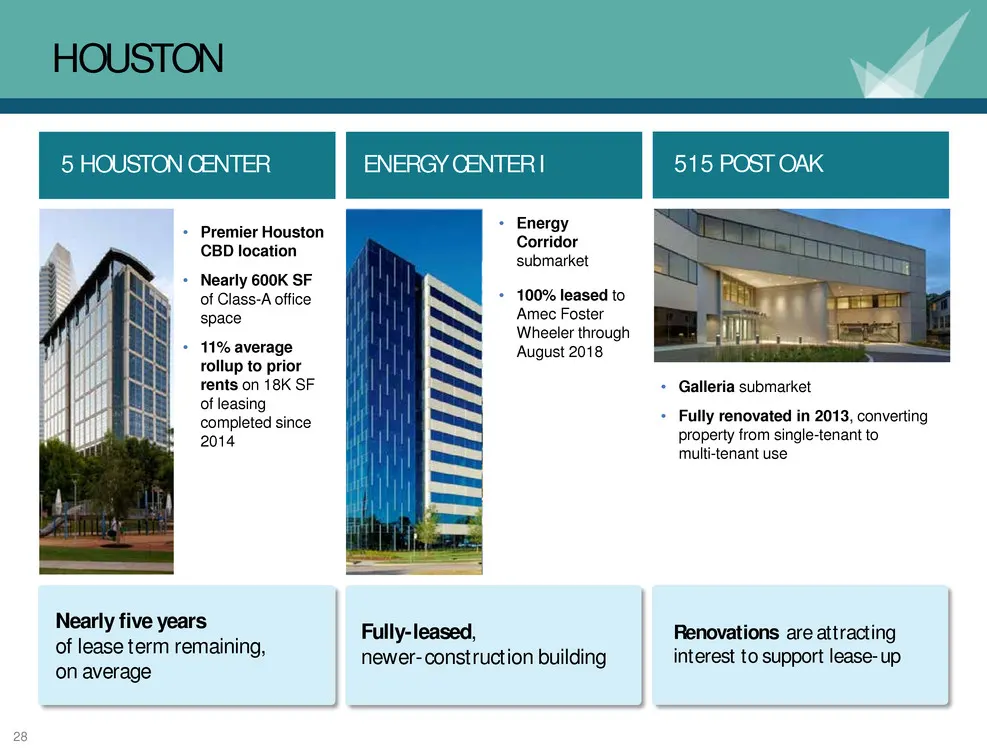
Slide 28: Houston: Houston Center, 515 Post Oak, Energy Center I
28 HOUSTON • Premier Houston CBD location • Nearly 600K SF of Class-A office space • 11% average rollup to prior rents on 18K SF of leasing completed since 2014 5 HOUSTON CENTER Nearly five years of lease term remaining, on average 515 POST OAK Renovations are attracting interest to support lease-up
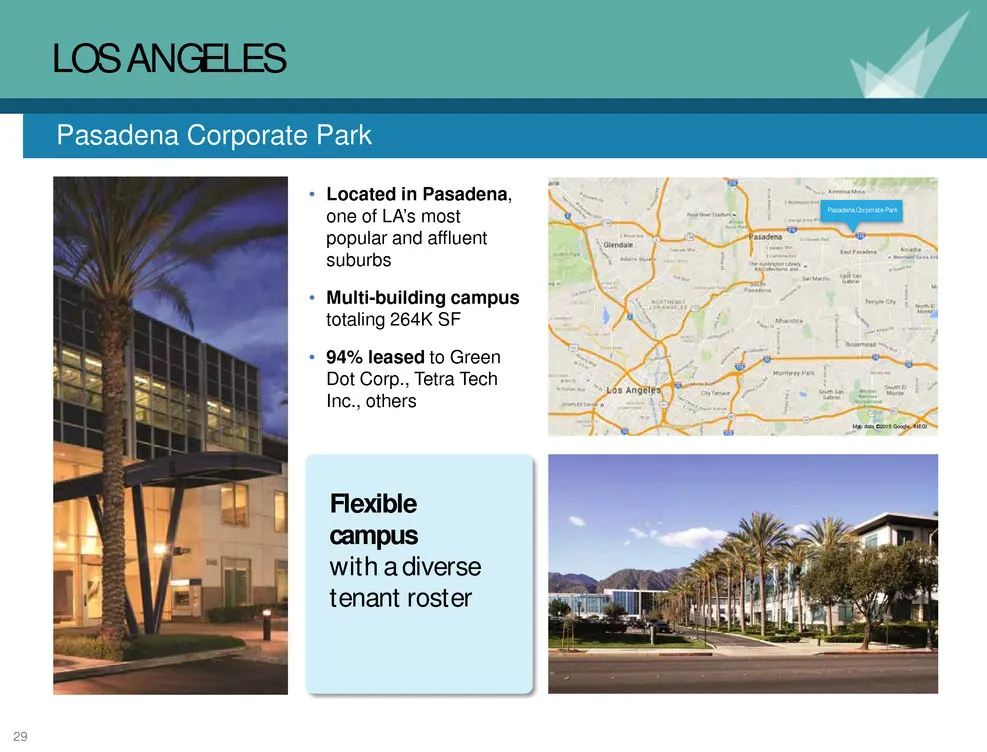
Slide 29: Los Angeles: Pasadena Corporate Park
29 LOS ANGELES Pasadena Corporate Park Flexible campus with a diverse tenant roster Pasadena Corporate Park Map data ©2015 Google, INEGI • Located in Pasadena, one of LA’s most popular and affluent suburbs • Multi-building campus totaling 264K SF • 94% leased to Green Dot Corp., Tetra Tech Inc., oth
Slide 30: Other Markets Combined Overview
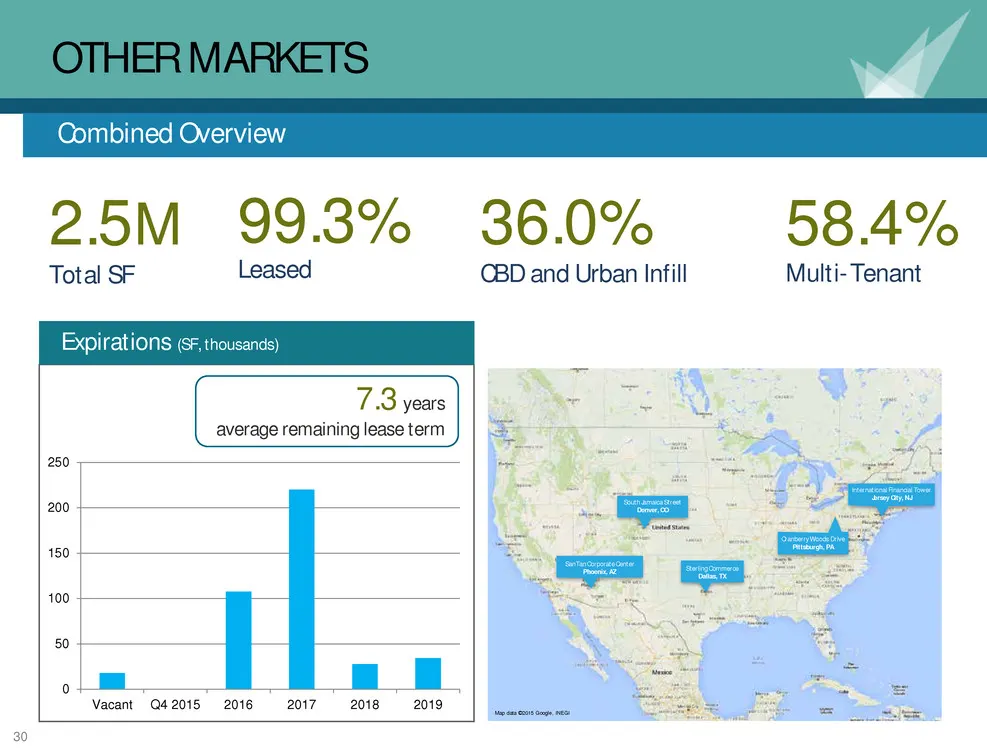
30 OTHER MARKETS Combined Overview 2.5 M Total SF 99.3% Leased 0 50 100 150 200 250 Vacant Q4 2015 2016 2017 2018 2019 58.4% Multi-Tenant 36.0% CBD and Urban Infill Expirations (SF, thousands) 7.3 years average remaining lease term Map data ©2015 Google, INEGI International Financial Tower Jersey Ci
Slide 31: Other Markets
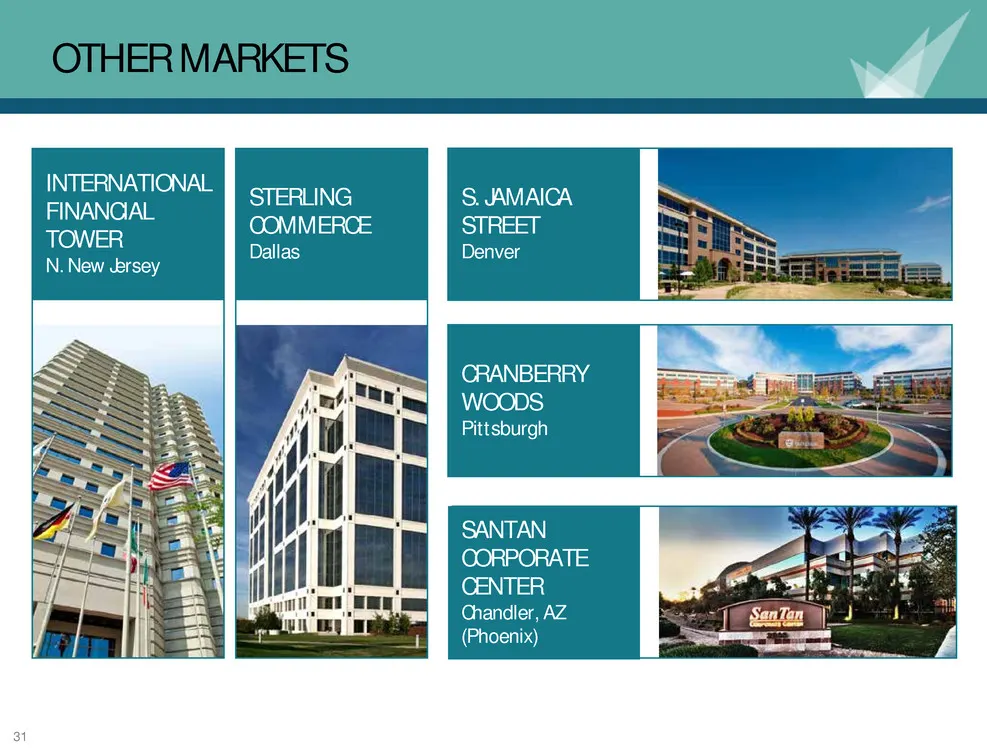
31 OTHER MARKETS INTERNATIONAL FINANCIAL TOWER N. New Jersey STERLING COMMERCE Dallas S. JAMAICA STREET Denver CRANBERRY WOODS Pittsburgh SANTAN CORPORATE CENTER Chandler, AZ (Phoenix)
Slide 32: Planned Dispositions Combined Overview
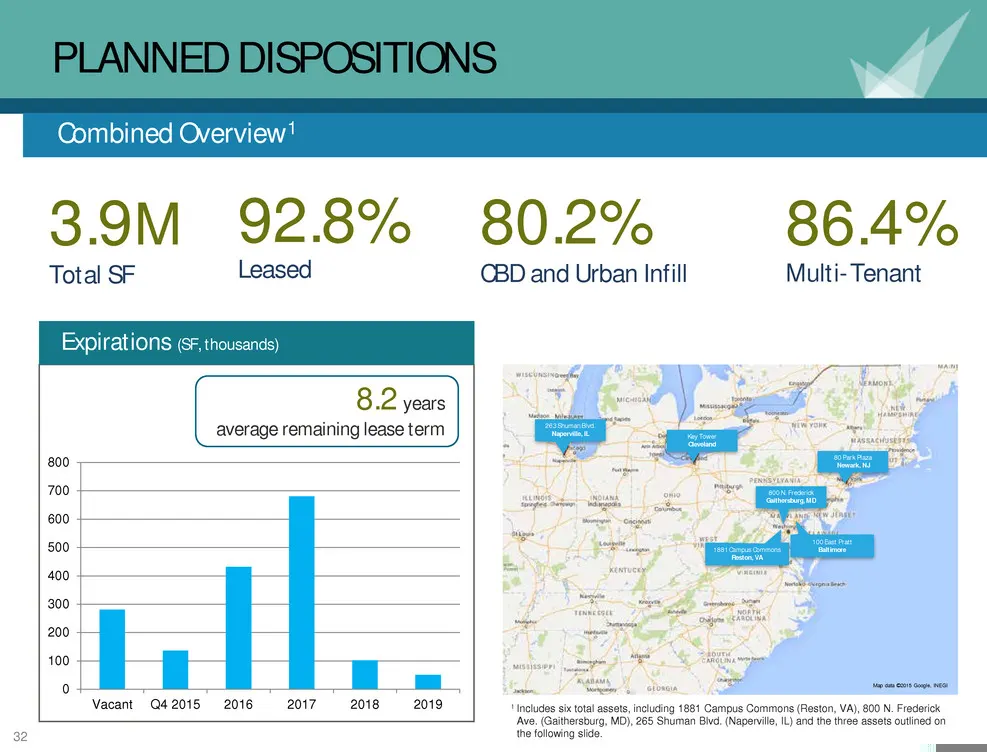
32 PLANNED DISPOSITIONS Combined Overview1 3.9 M Total SF 92.8% Leased 0 100 200 300 400 500 600 700 800 Vacant Q4 2015 2016 2017 2018 2019 86.4% Multi-Tenant 80.2% CBD and Urban Infill Expirations (SF, thousands) 8.2 years average remaining lease term 1 Includes six total assets, including 1881 Cam
Slide 33: Planned Dispositions
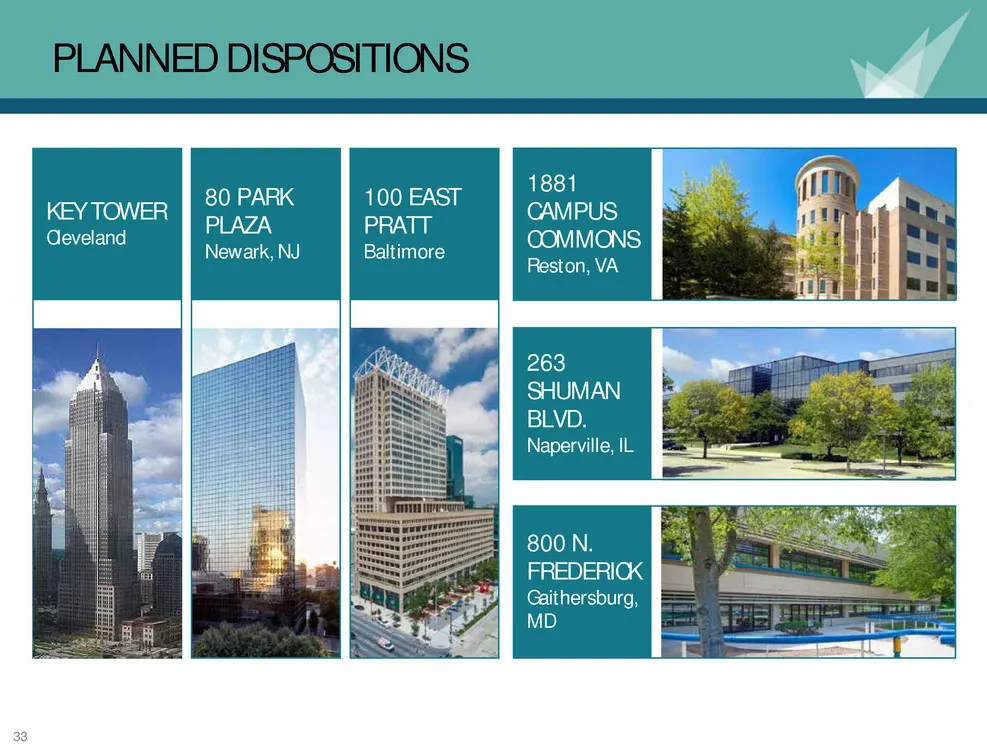
33 PLANNED DISPOSITIONS 1881 CAMPUS COMMONS Reston, VA KEY TOWER Cleveland 263 SHUMAN BLVD. Naperville, IL 800 N. FREDERICK Gaithersburg, MD 80 PARK PLAZA Newark, NJ 100 EAST PRATT Baltimore
Slide 34: Balance Sheet Overview
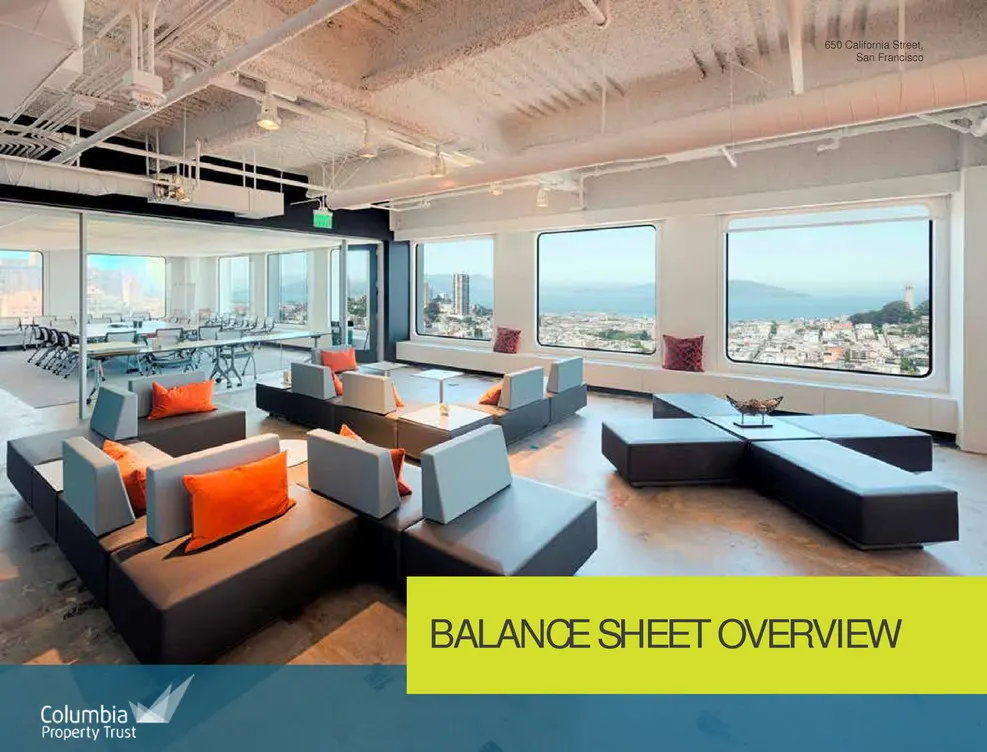
34 650 California Street, San Francisco BALANCE SHEET OVERVIEW
Slide 35: Near Term Sources & Uses
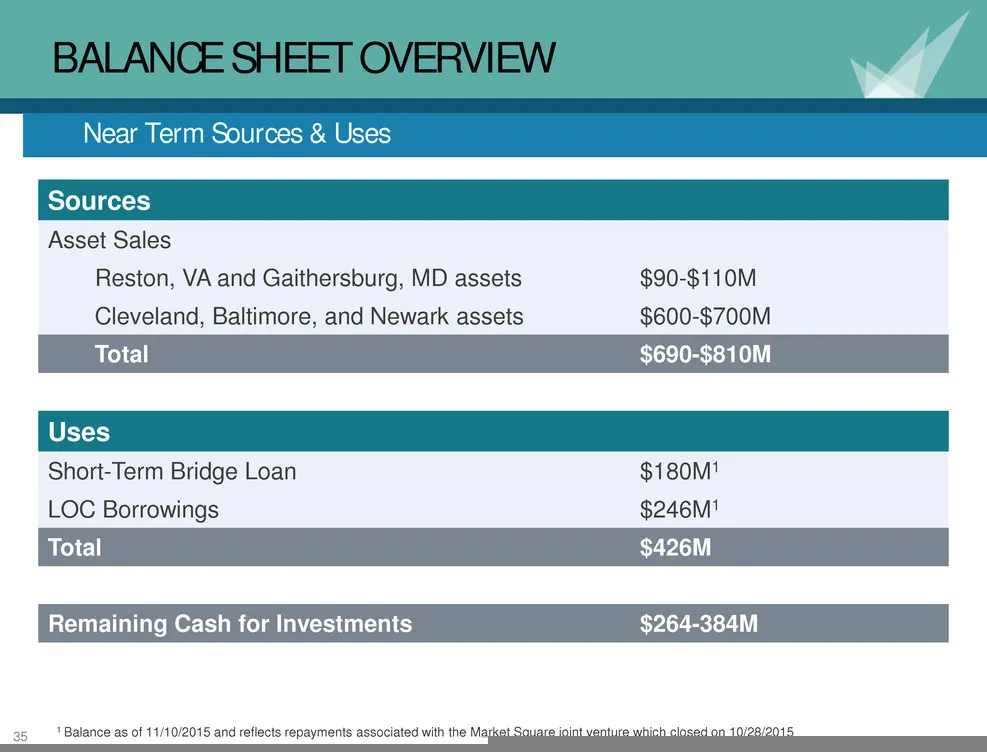
35 BALANCE SHEET OVERVIEW Sources Asset Sales Reston, VA and Gaithersburg, MD assets $90-$110M Cleveland, Baltimore, and Newark assets $600-$700M Total $690-$810M Uses Short-Term Bridge Loan $180M1 LOC Borrowings $246M1 Total $426M Remaining Cash for Investments $264-384M 1 Balance as of 11/10/2015
Slide 36: Conservative Leverage and Diversified Debt Capital Sources
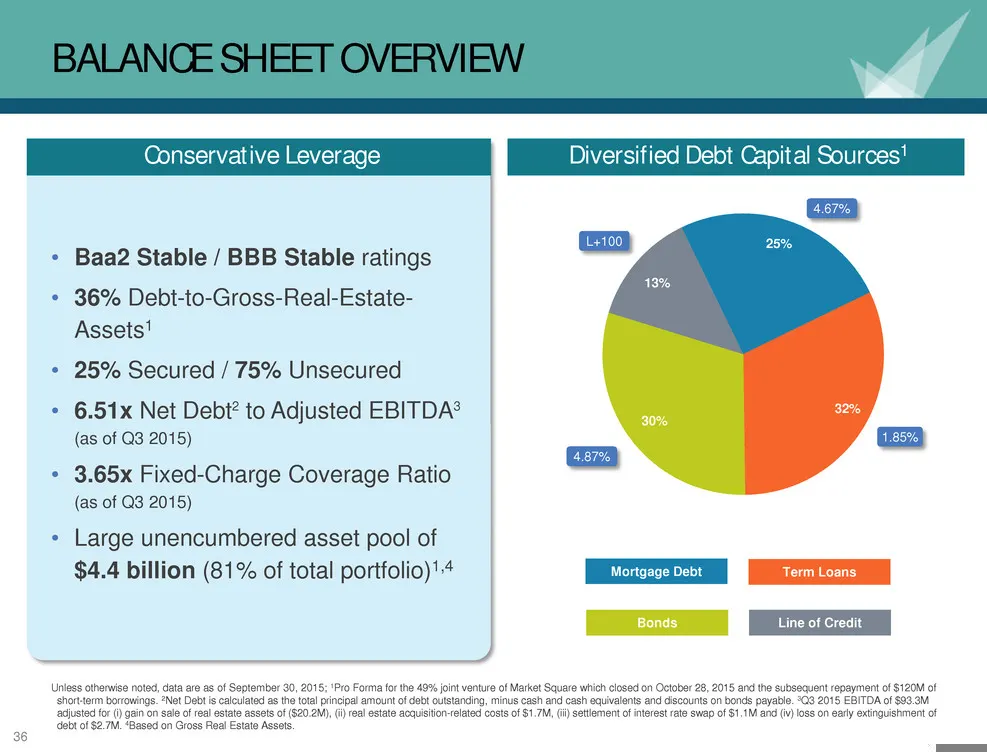
36 BALANCE SHEET OVERVIEW • Baa2 Stable / BBB Stable ratings • 36% Debt-to-Gross-Real-Estate- Assets1 • 25% Secured / 75% Unsecured • 6.51x Net Debt2 to Adjusted EBITDA3 (as of Q3 2015) • 3.65x Fixed-Charge Coverage Ratio (as of Q3 2015) • Large unencumbered asset pool of $4.4 billion (81% of total
Slide 37: Debt Maturities
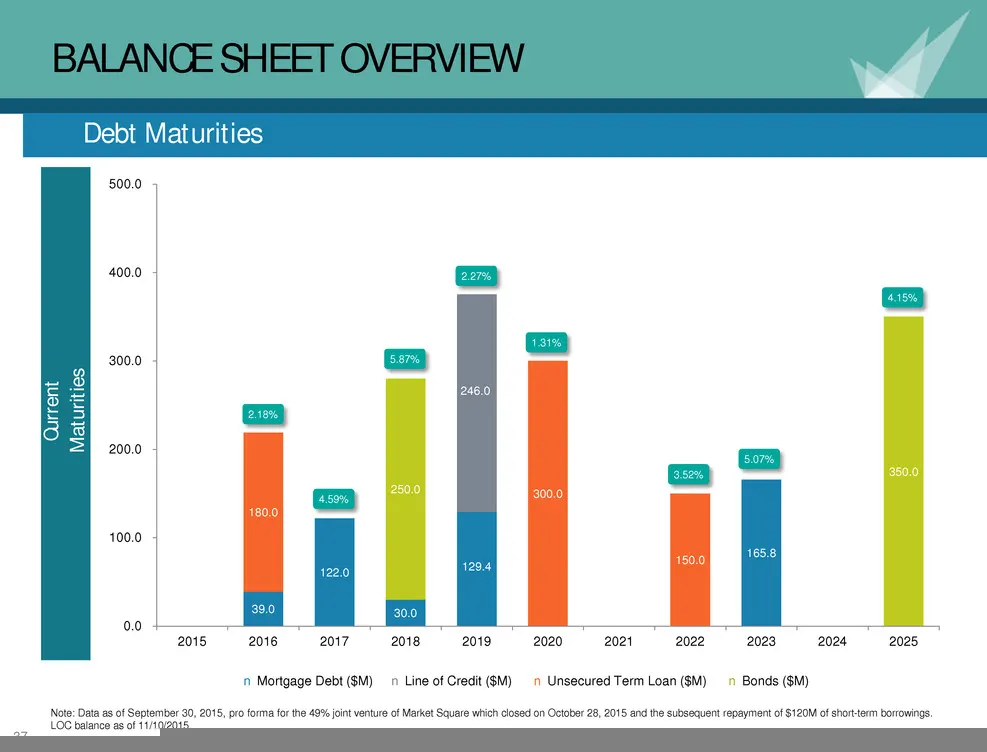
37 BALANCE SHEET OVERVIEW 39.0 122.0 30.0 129.4 165.8 246.0 180.0 300.0 150.0 250.0 350.0 0.0 100.0 200.0 300.0 400.0 500.0 2015 2016 2017 2018 2019 2020 2021 2022 2023 2024 2025 Cu rr en t M at ur iti es n Mortgage Debt ($M) n Line of Credit ($M) n Unsecured Term Loan ($M) n Bonds ($M) Note: Data a
Slide 38: For More Information
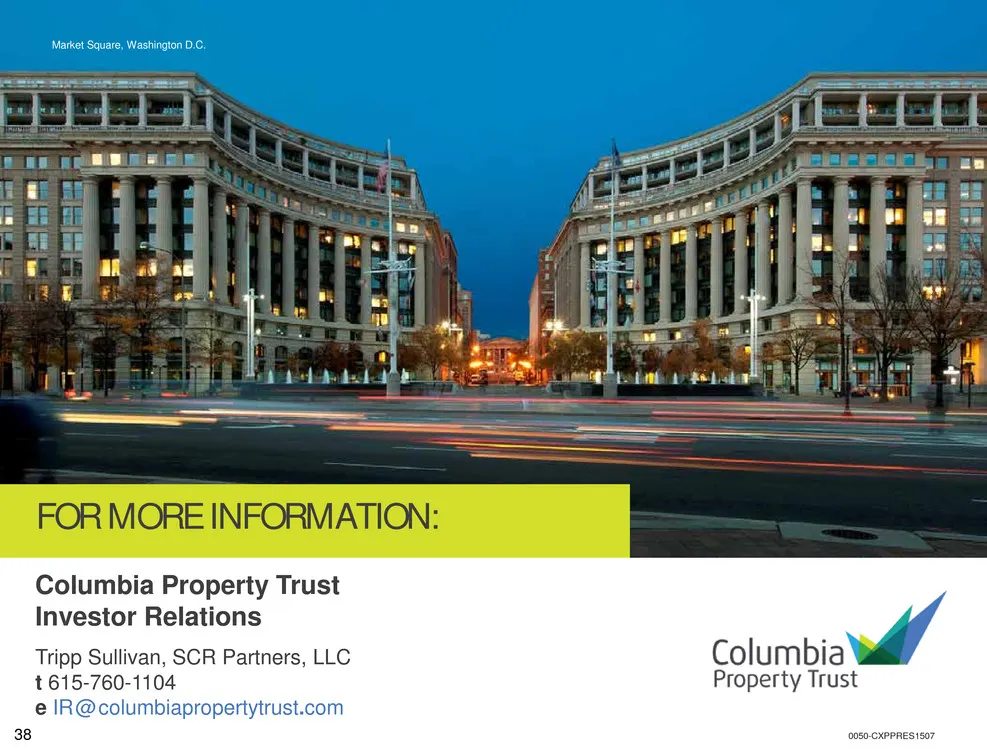
38 FOR MORE INFORMATION: Columbia Property Trust Investor Relations Tripp Sullivan, SCR Partners, LLC t 615-760-1104 e IR @ columbiapropertytrust.com 0050-CXPPRES1507 Market Square, Washington D.C.
Source: SEC EDGAR · 8-K filed Nov 17, 2015
More decks from Columbia Property Trust Inc
 Investor Presentation (November 2020)33 slides · Nov 17, 2020
 Investor Presentation (August 2020)34 slides · Aug 31, 2020
 Investor Presentation (June 2020)34 slides · Jun 1, 2020
 Investor Presentation (February 2020)29 slides · Feb 26, 2020
 Corporate Update (December 2019)12 slides · Dec 3, 2019
 Investor Presentation (November 2019)28 slides · Nov 12, 2019