Bob Evans Farms — Merger or Acquisition (January 2017)
26 slides from Bob Evans Farms's merger presentation, Jan 25, 2017
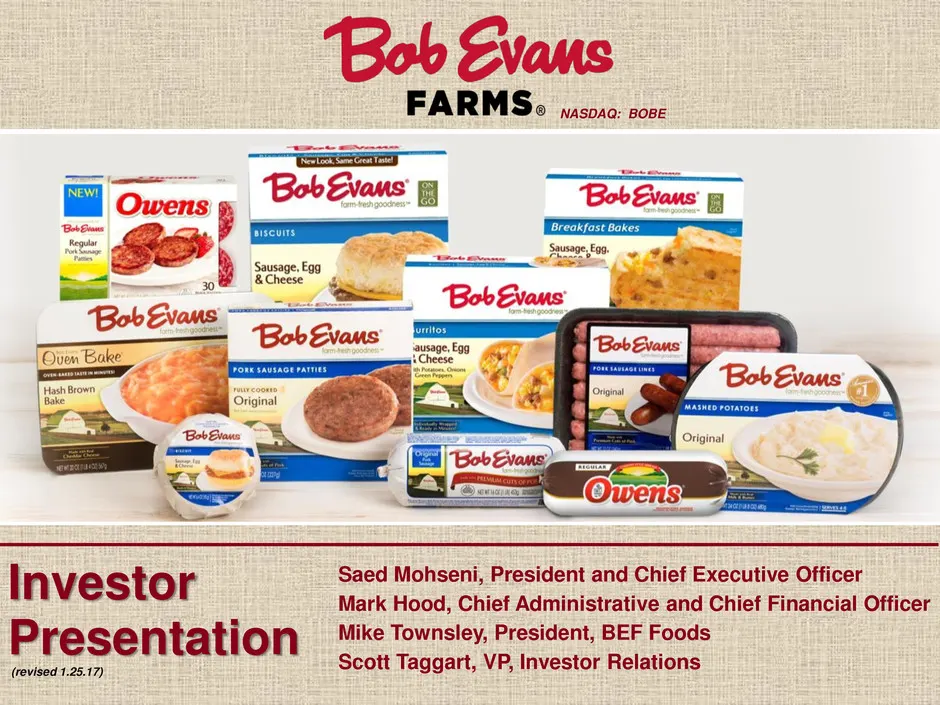
Slide 1: Bob Evans Farms Investor Presentation
Bob Evans FA RMS @ NASDAQ: BOBE Investor Saed Mohseni, President and Chief Executive Officer Mark Hood, Chief Administrative and Chief Financial Officer Prese ntati on Mike Townsley, President, BEF Foods (revised 1.25.17) Scott Taggart, VP, Investor Relations
Slide 2: Safe Harbor Statement
SAFE HARBOR STATEMENT Certain statements in this presentation that are not historical facts are forward-looking statements. Forward- looking statements involve various important assumptions, risks and uncertainties. Actual results may differ materially from those predicted by the forward-looking sta
Slide 3: Non-GAAP Financial Measures
Non-GAAP Financial Measures We have Included inthis presentation a forecast of adjusted EBITDA for future periods. This forward-tooking financial measure is not presented US. unting Principles (U.S. GAAP). Our m-GAAP measures are used by analysts, investors and other compare o formance of © other co
Slide 4: Strategic Transformation Discussion
FARMS. January 25, 2017 Bob Evans Farms, Inc. Strategic Transformation Discussion
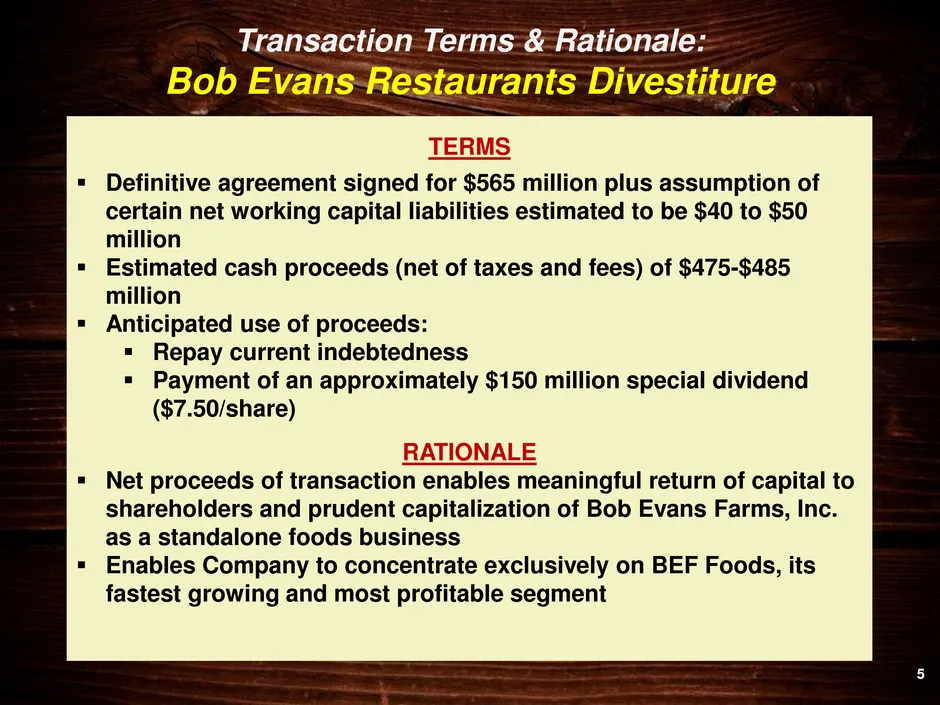
Slide 5: Transaction Terms & Rationale: Bob Evans Restaurants Divestiture
Transaction Terms-& Rationale: Bob (2 vans Restaurants Divestiture Definitive agreement signed for $565 million plus assumption of certain net working capital liabilities estimated to be $40 to $50 million Estimated cash proceeds (net of taxes and fees) of $475-$485 million of p = Repay ent indebted
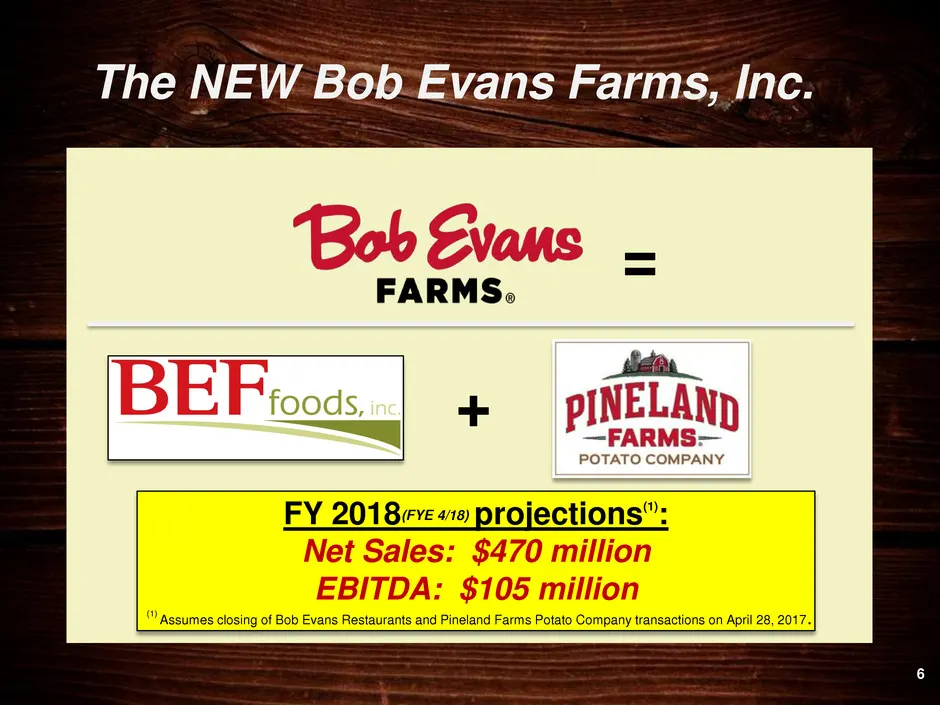
Slide 6: The New Bob Evans Farms, Inc. FY 2018 projections
The NE Ww Bob Evans Farms, Inc. POTATO COMPANY FY 20180 «9 projections”:
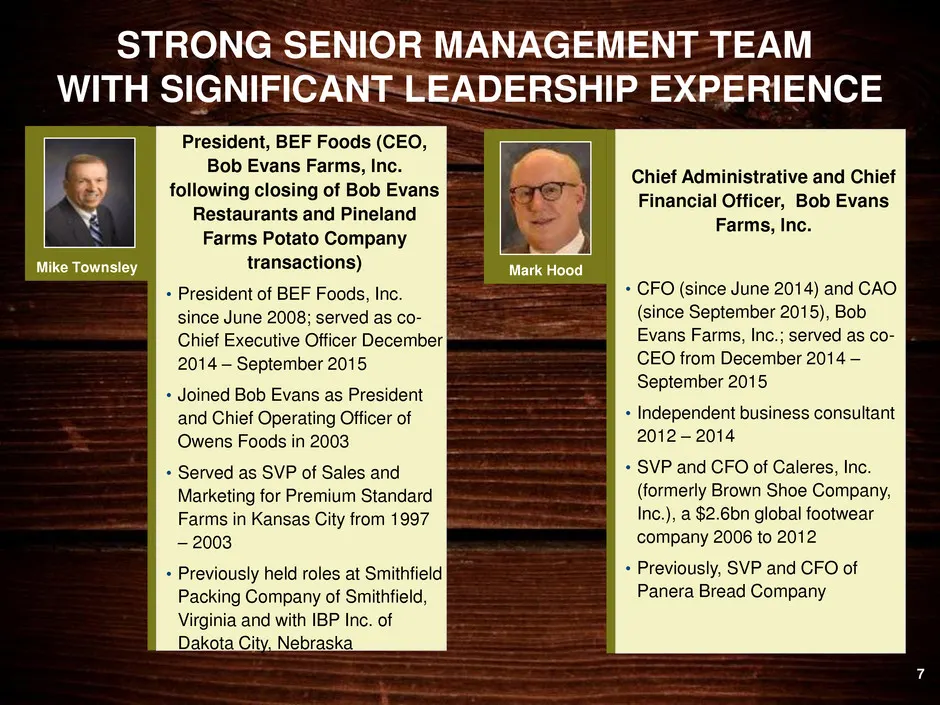
Slide 7: Strong Senior Management Team with Significant Leadership Experience
STRONG SENIOR MANAGEMENT TEAM WITH SIGNIFICANT-LEADERSHIP EXPERIENCE present BEF Foods (CEO, Bob Mike Townsley transactions) + President of BEF Foods, Inc. since June 2008; served as co- Chief Executive Officer December 2014 — September 2015 + Joined Bob Evans as President and Chief Operating Office
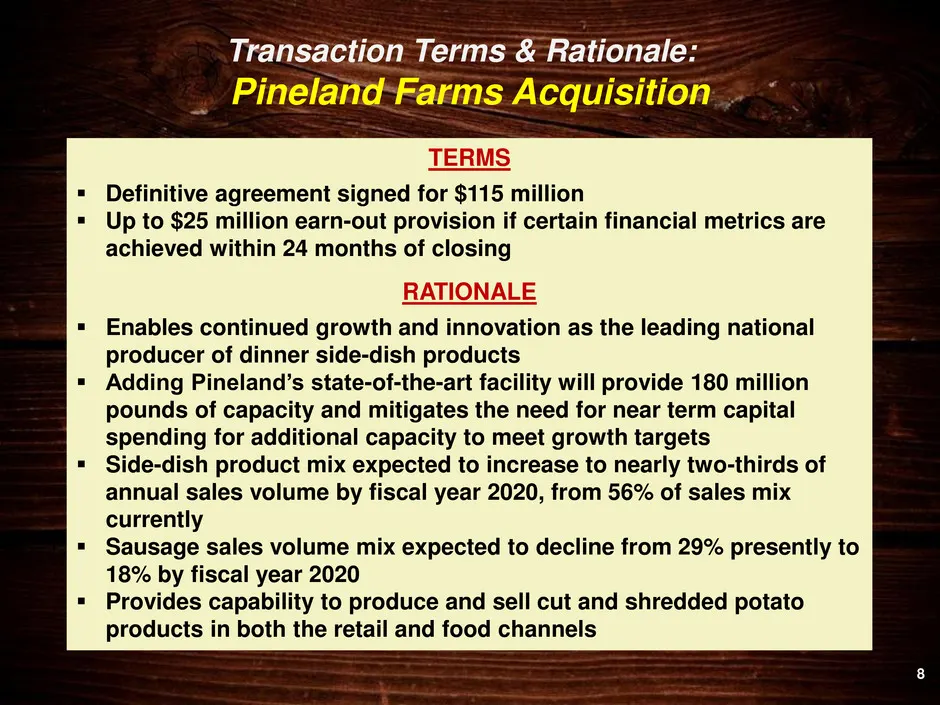
Slide 8: Transaction Terms & Rationale: Pineland Farms Acquisition
Transaction Terms & Rationale: _. Pinelarid-Farms Acquisition Definitive agreement signed for $115 million Up to $25 million earn-out provision if certain financial metrics are achieved within 24 months of closing Enables continued growth and innovation as the leading national producer of dinner sid
Slide 9: The New BOBE: Financial Structure
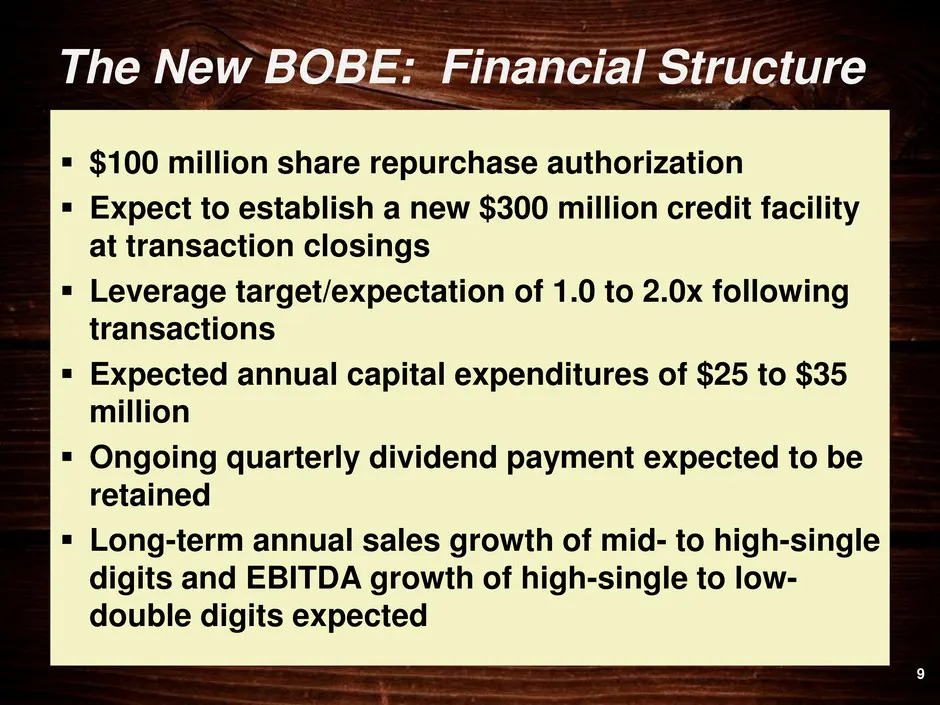
The New BOBE:. Financial Structure $100 million share repurchase authorization Expect to establish a new $300 million credit facility at transaction closings Leverage target/expectation of 1.0 to 2.0x following transactions Expected annual capital expenditures of $25 to $35 million Ongoing quarterly
Slide 10: Four Key Lines of Business
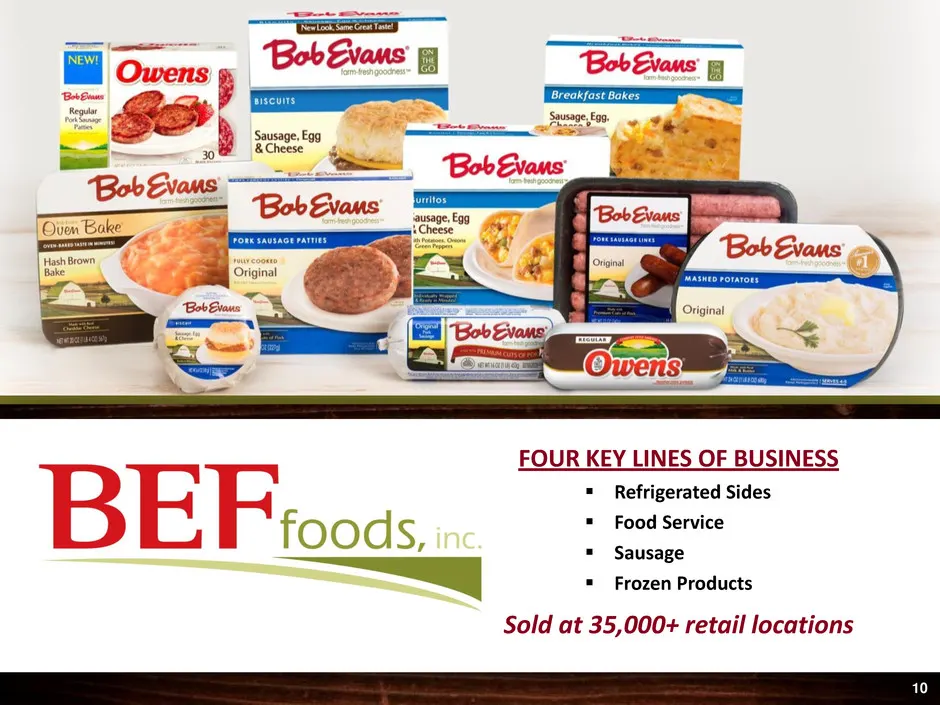
Sausage, Eog Cheese FOUR KEY LINES OF BUSINESS = Refrigerated Sides fo O d S, = Food Service = Sausage = Frozen Products Sold at 35,000+ retail locations
Slide 11: BEF Foods: Side-Dish Growth Drives Sales and Margin Improvement
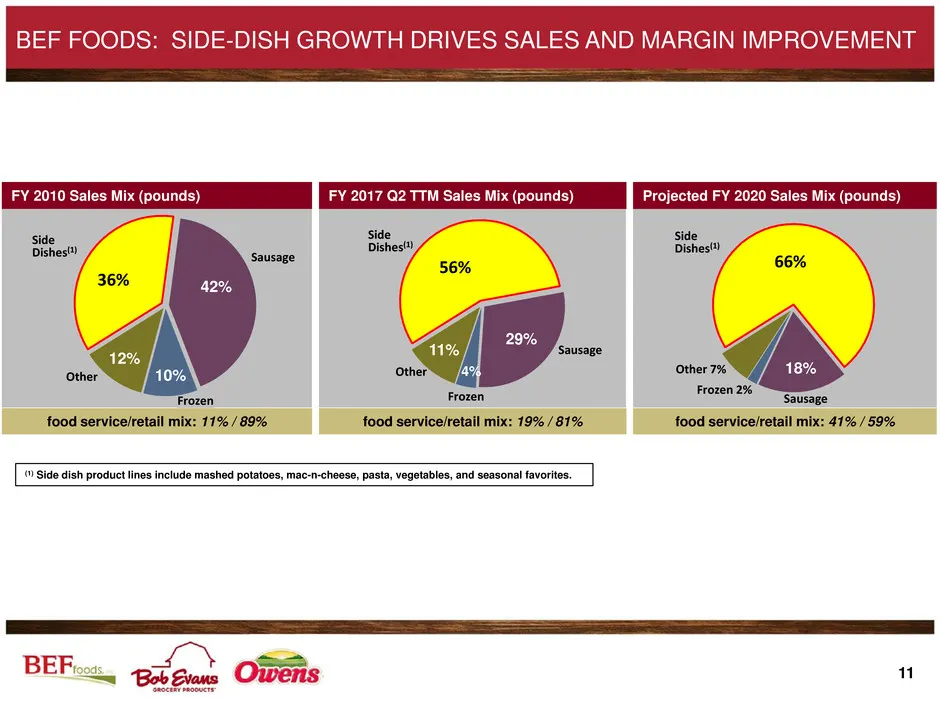
BEF FOODS: SIDE-DISH GROWTH DRIVES SALES AND MARGIN IMPROVEMENT FY 2010 Sales Mix (pounds) FY 2017 Q2 TTM Sales Mix (pounds) Projected FY 2020 Sales Mix (pounds) Side side Side Dishest eee Dishes! Dishest ee Sausage Other Other Other 7% 18% ey Frozen2% aase food service/retail mix: 11% /89% food ser
Slide 12: Distinctive and highly complementary foods businesses
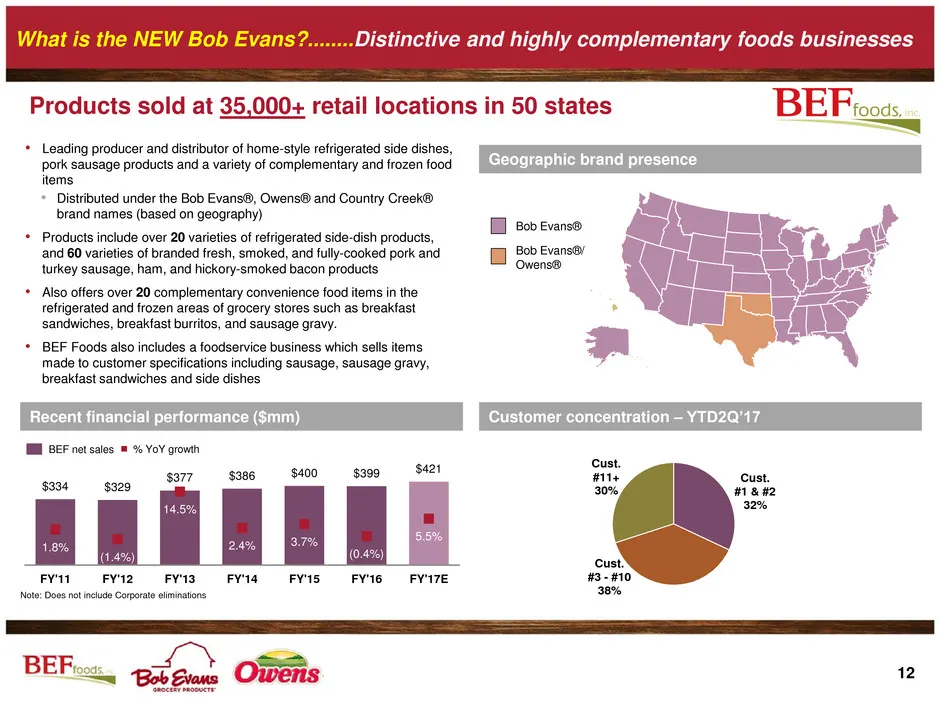
Distinctive and highly complementary foods businesses . tor y items Bob Evans®, brand names (based on geography) . 20 varieties of refri ide-dish pi , d, turkey sausage, ham, and hickory-smoked bacon products sandwiches, breakfast burritos, and sausage gravy. + BEF breakfast sandwiches and side dish
Slide 13: BEF Foods' Historical Timeline
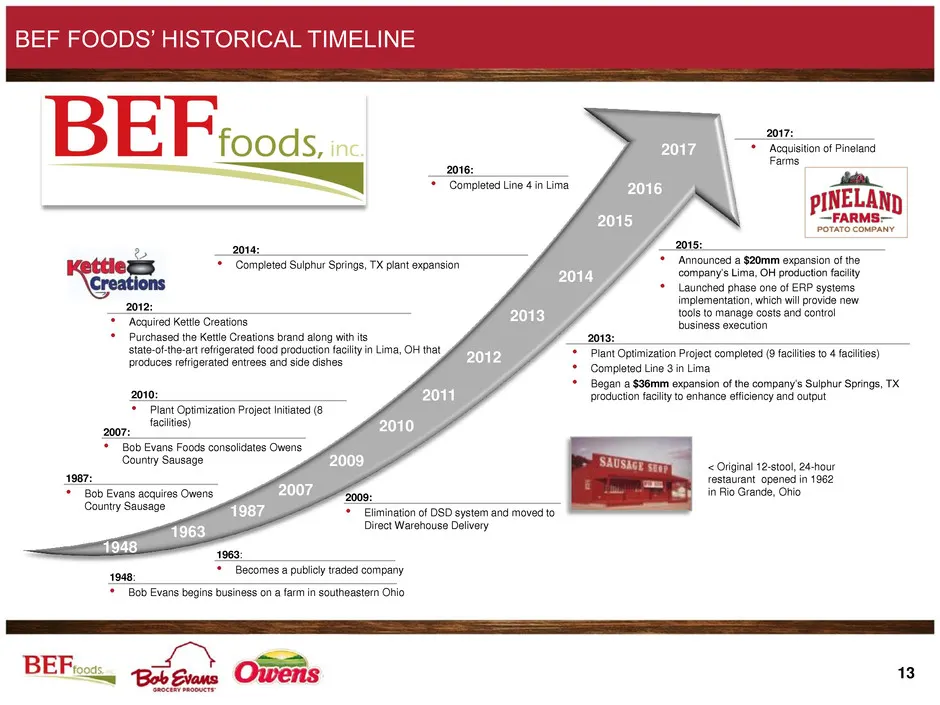
BEF FOODS’ HISTORICAL TIMELINE BE Fics inc ———— | 2017: + Acquisition of Pineland Fams 16: * Completed Line 4 in Lima 7 N ean 7 fnnooced a 2mm epanon abo companys ina, OH raglan iy + Launched phase AP systoms. implementation, vale wil prow new tools to manage costs and contol Kettle Cre business exe
Slide 14: Pineland Farms Potato Company
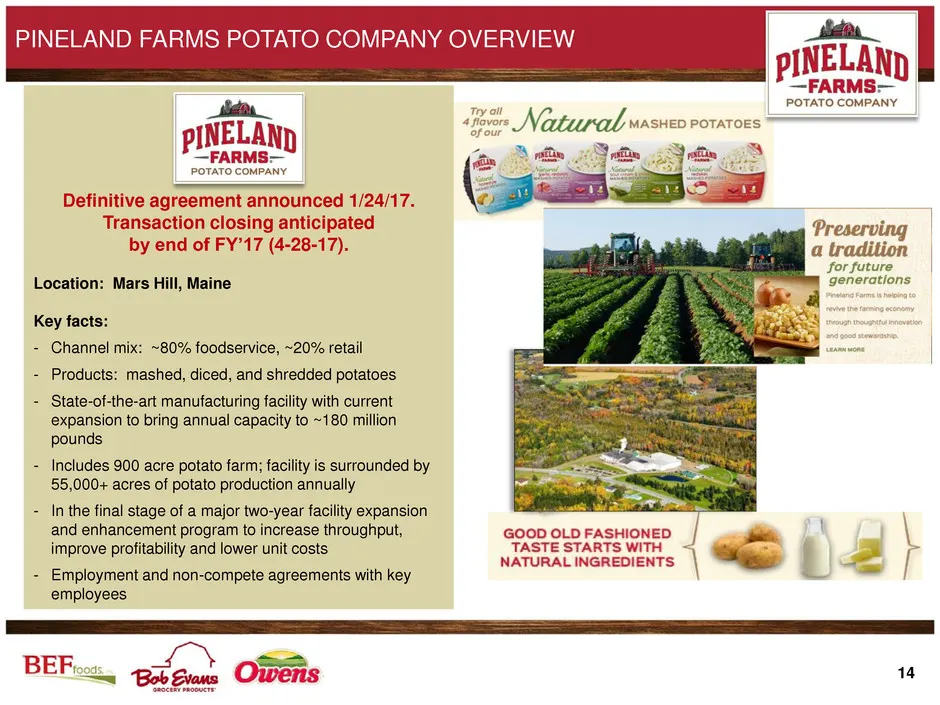
POTATO COMPANY Location: Mars Hill, Maine Key facts: Channel mix: ~80% foodservice, ~20% retail Products: mashed, diced, and shredded potatoes State-of-the-art manufacturing facility with current ‘expansion to bring annual capacity to ~180 million pounds Includes 900 acre potato farm; facility is su
Slide 15: Pineland's State-of-the-Art Potato Processing Facility
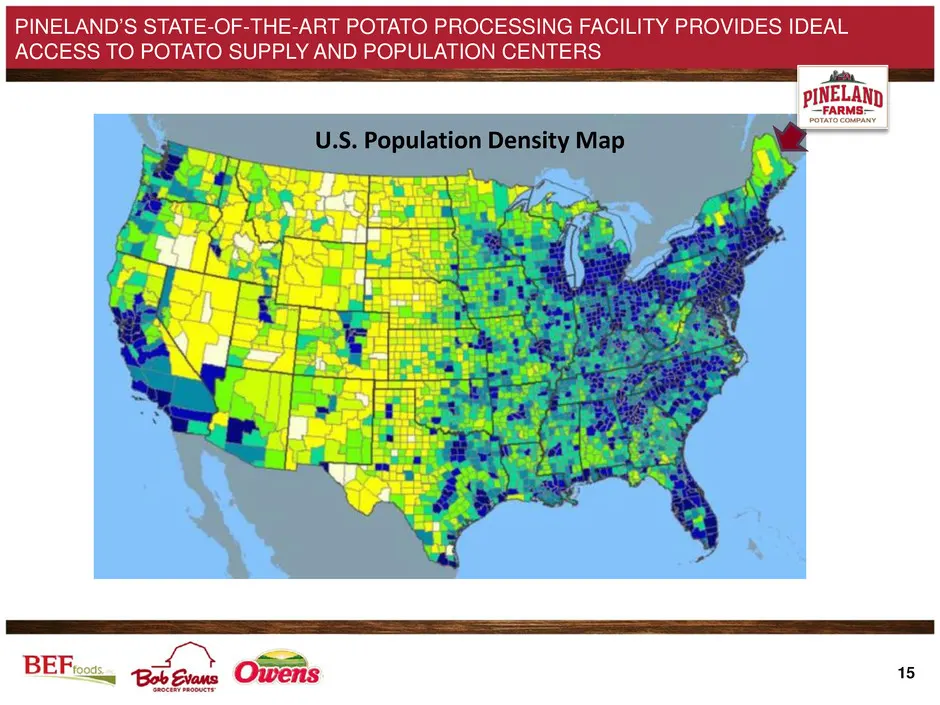
PINELAND’S STATE-OF-THE-ART POTATO PROCESSING FACI ACCESS TO POTATO SUPPLY AND POPULATION CENTERS
Slide 16: BEF Foods: Overview
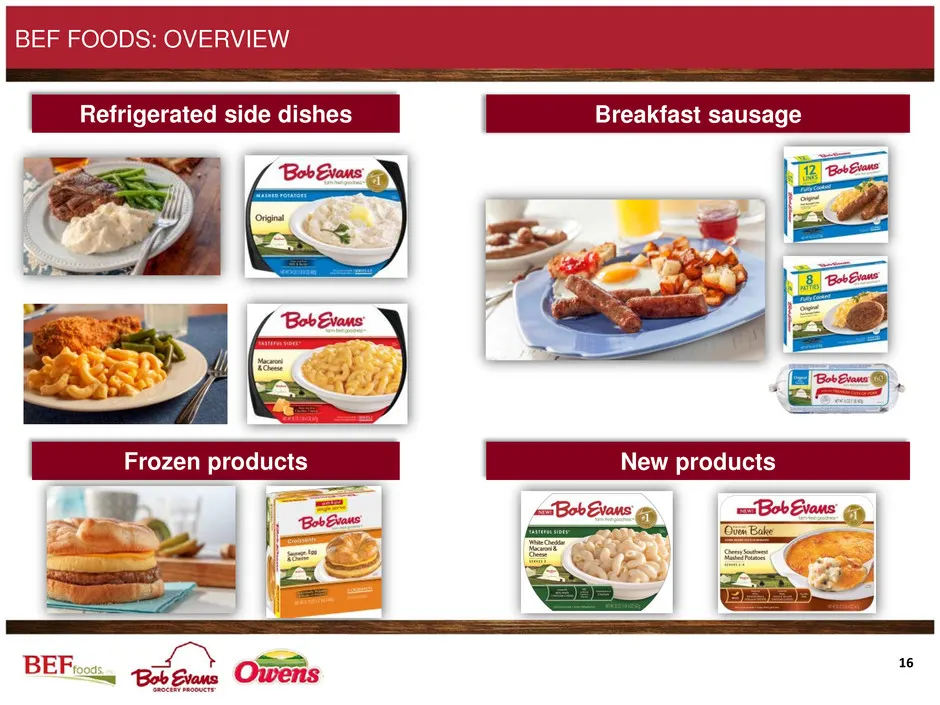
BEF FOODS: OVERVIEW Refrigerated side dishes Breakfast sausage =< Fi nem BobGiaus oN a New products BobGvaus
Slide 17: Leading Market Positions in Refrigerated Sides and Breakfast Sausage
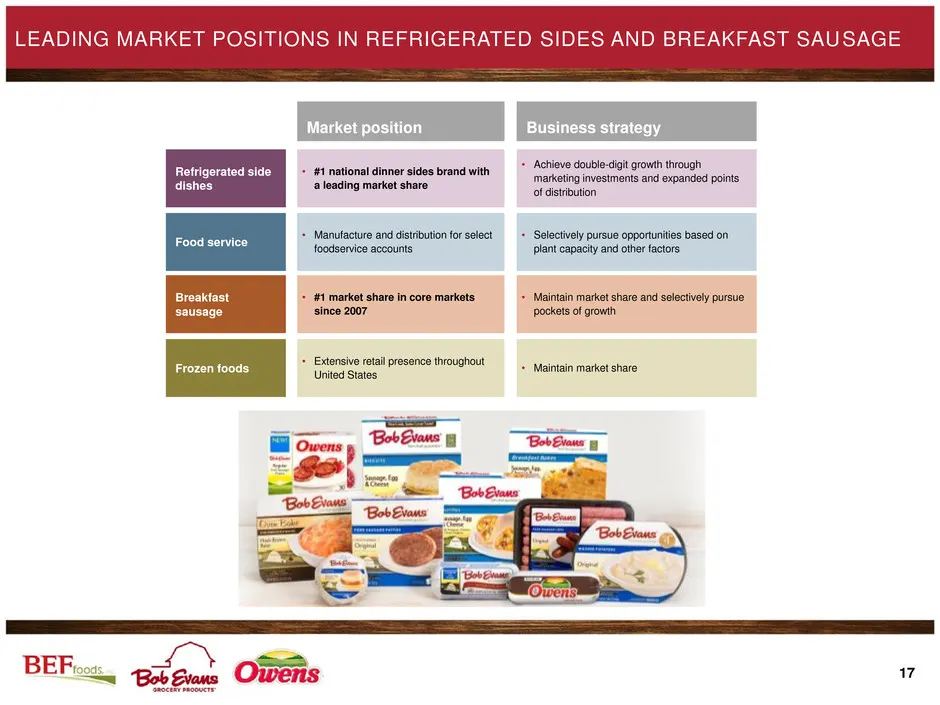
LEADING MARKET POSITIONS IN REFRIGERATED SIDES AND BREAKFAST S. Market position Business strategy + fetiove doube-siit growth through GEUPCEEE S| #1 national dinner sides brand with ‘Achieve doubo-dt aro *eavgmonsee aoe fae eed "+ Manufacture and istibtionforselect + Selectively pursue opportunites
Slide 18: Deep and Growing Penetration in Sides and Sausage Markets
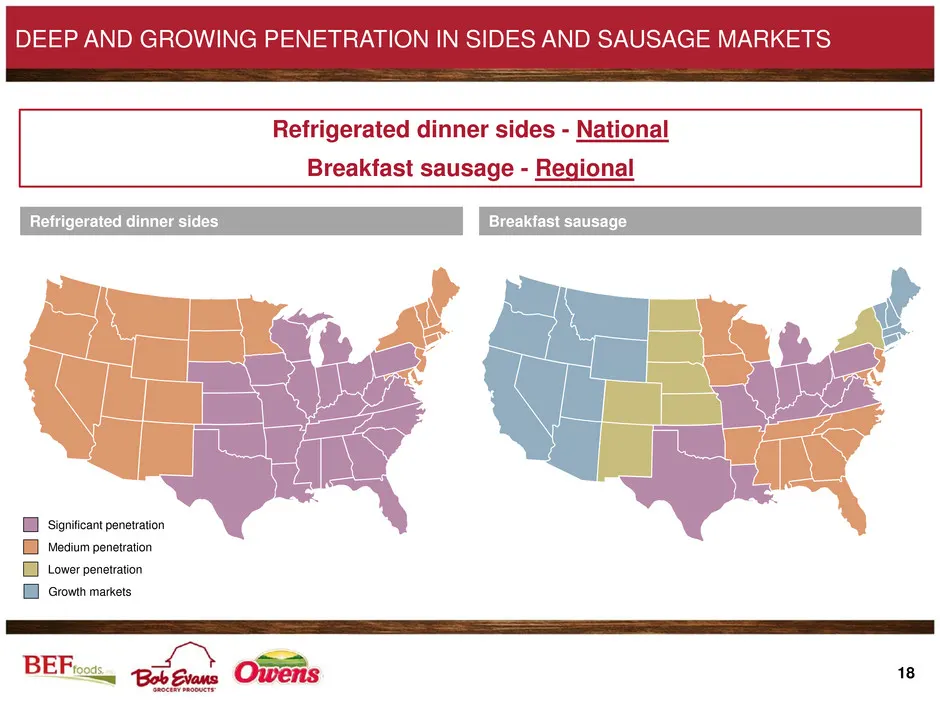
DEEP AND GROWING PENETRATION IN SIDES AND SAUSAGE MARKETS | Refrigerated dinner sides - National | Breakfast sausage - Regional BB signitcant penetration EB Medium penetration BB Lower penetration BB Grown markets
Slide 19: BEF Foods: Refrigerated Dinner Side-Dish Performance
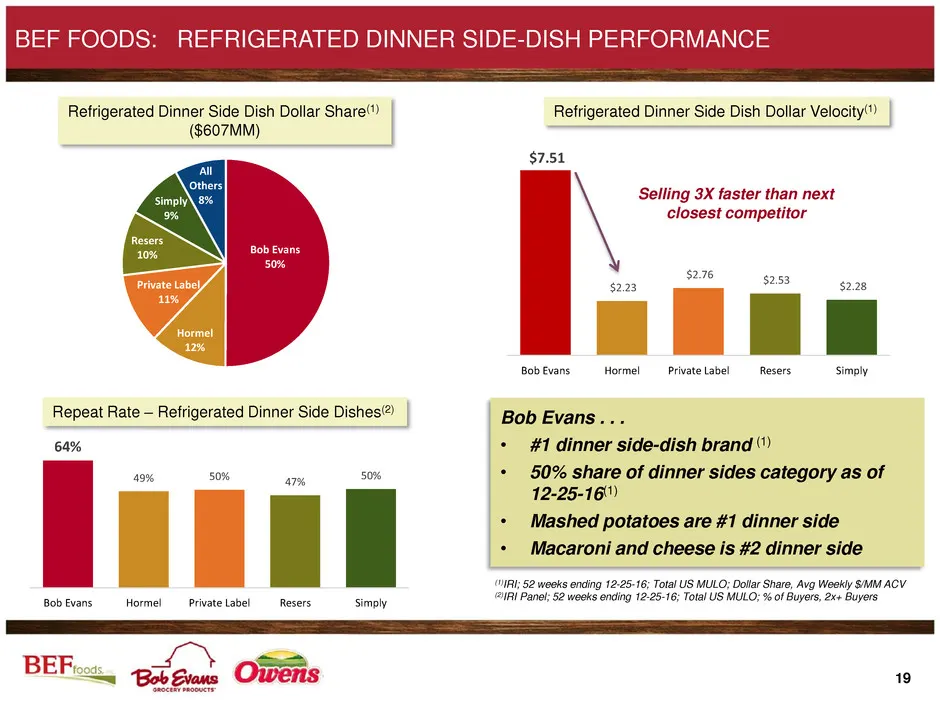
BEF FOODS: REFRIGERATED DINNER SIDE-DISH PERFORMANCE Refrigerated ears oo cr Dollar Share’) > Repeat Rate — Refrigerated Dinner Side Dishes) 64% BobEvans Hormel Private Label_—_—Resers. simply Refrigerated Dinner Side Dish Dollar Velocity") $7.51 — Selling 3X faster than next closest competitor $2.7
Slide 20: Executing Strategy to Further Develop National Side-Dish Brand
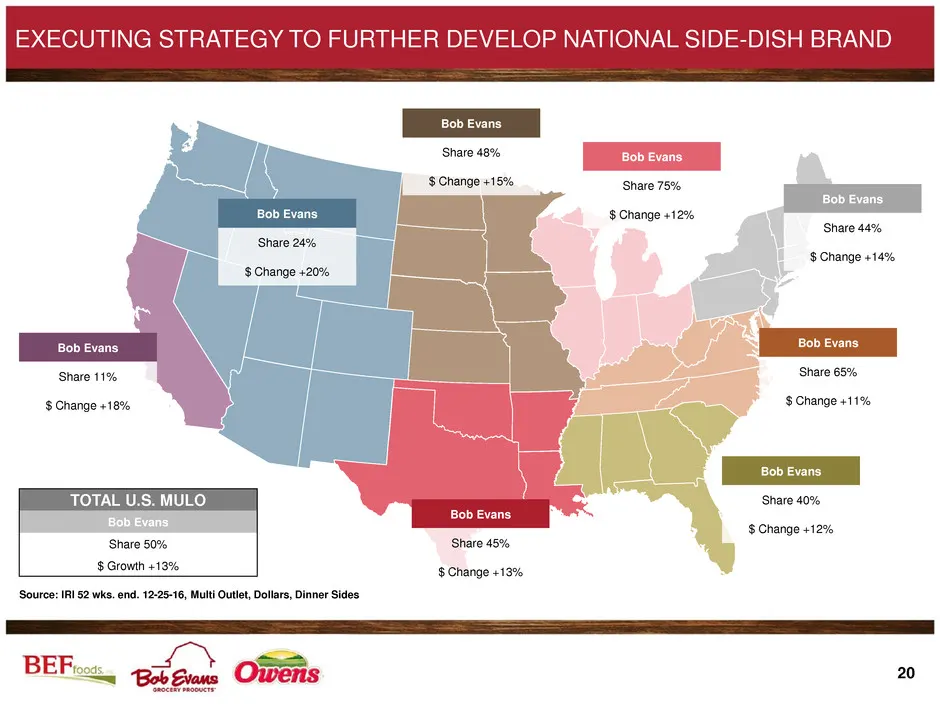
EXECUTING STRATEGY TO FURTHER DEVELOP NATIONAL SIDE-DISH BRAND Share 48% Bob Evans '$ Change +15% ‘Share 75% ‘Share 24% ‘$ Change +20% Bob Evans Share 11% '$ Change +18% TOTAL U.S. MULO Bob Evans ‘Share 50% Share 45% $ Growth +13% $Chinge +12% Source: IRI 52 wks. end. 12-25-16, Multi Outlet, Dollars
Slide 21: BEF Foods: Normalized EBITDA Margin Range
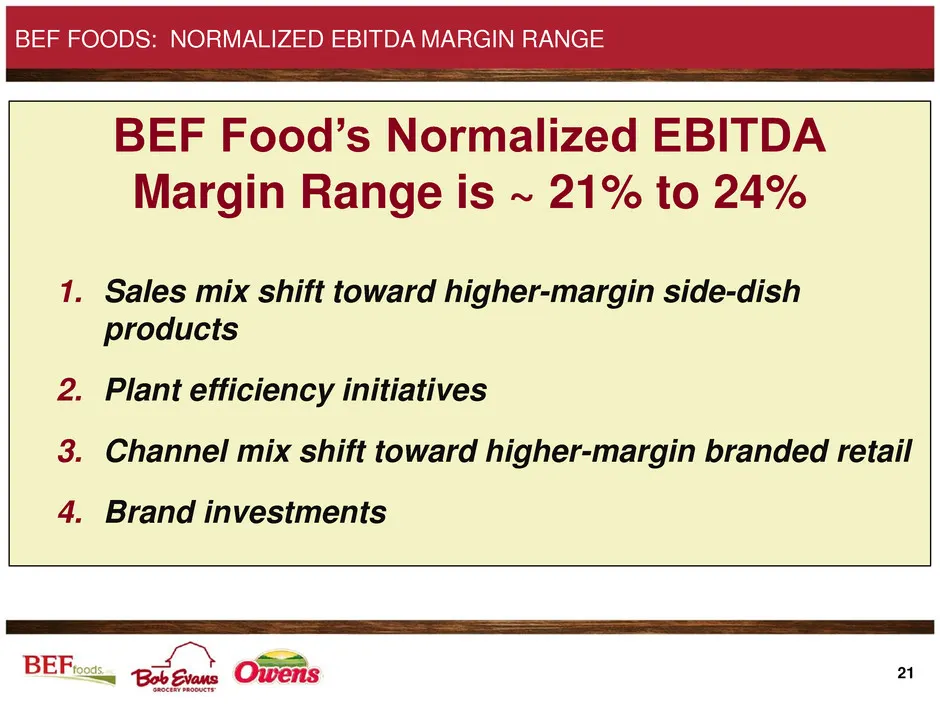
BEF FOODS: NORMALIZED EBITDA MARGIN RANGE BEF Food’s Normalized EBITDA Margin Range is ~ 21% to 24% 1. Sales mix shift toward higher-margin side-dish products 2. Plant efficiency initiatives 3. Channel mix shift toward higher-margin branded retail 4. Brand investments
Slide 22: Dividend History
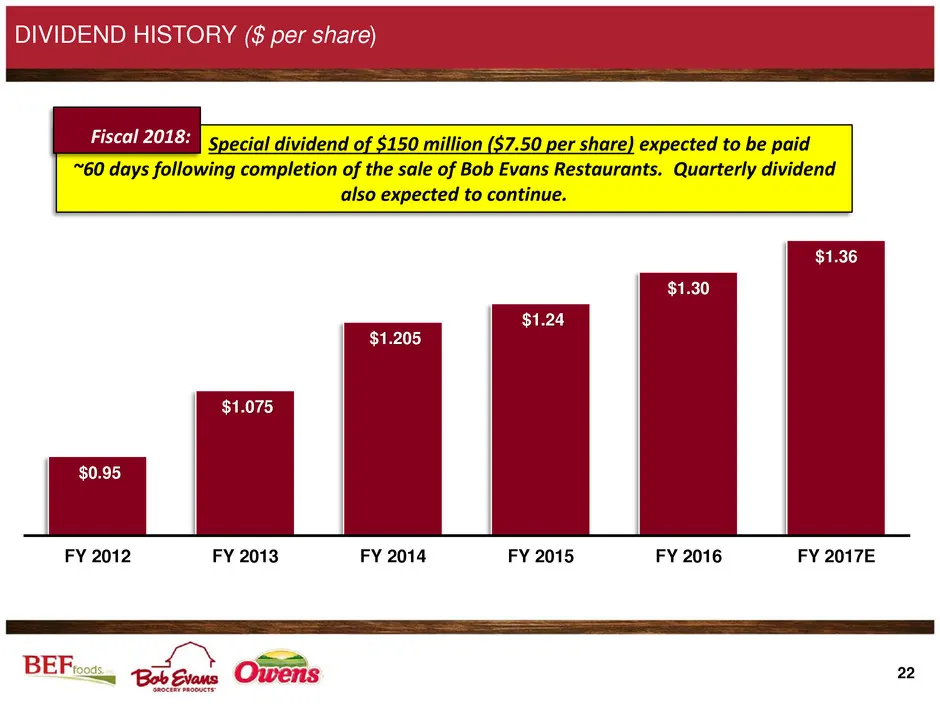
DIVIDEND HISTORY ($ per share) CULE special dividend of $150 million ($7.50 per share) expected to be paid ~60 days following completion of the sale of Bob Evans Restaurants. Quarterly dividend also expected to continue. FY 2012 FY 2013 FY 2014 FY 2015 FY 2016 FY 2017E BEF, Gis Owens 2
Slide 23: Why Invest in Bob Evans?
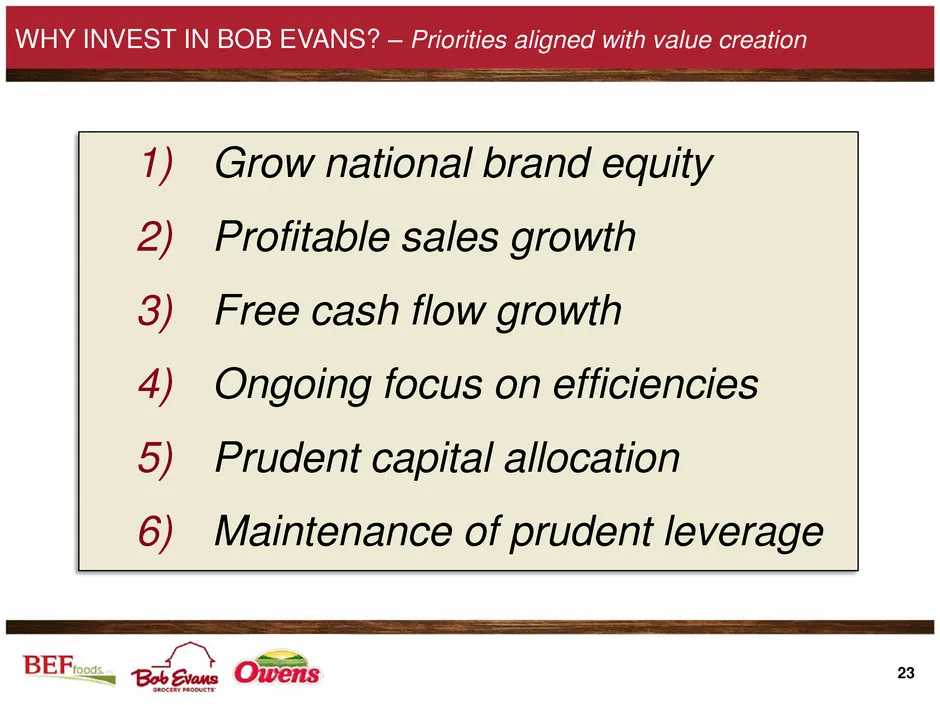
WHY INVEST IN BOB EVANS? — Priorities aligned with value creation 1) Grow national brand equity 2) Profitable sales growth 3) Free cash flow growth 4) Ongoing focus on efficiencies 5) Prudent capital allocation 6) Maintenance of prudent leverage
Slide 24: Appendix
. “Appendix _
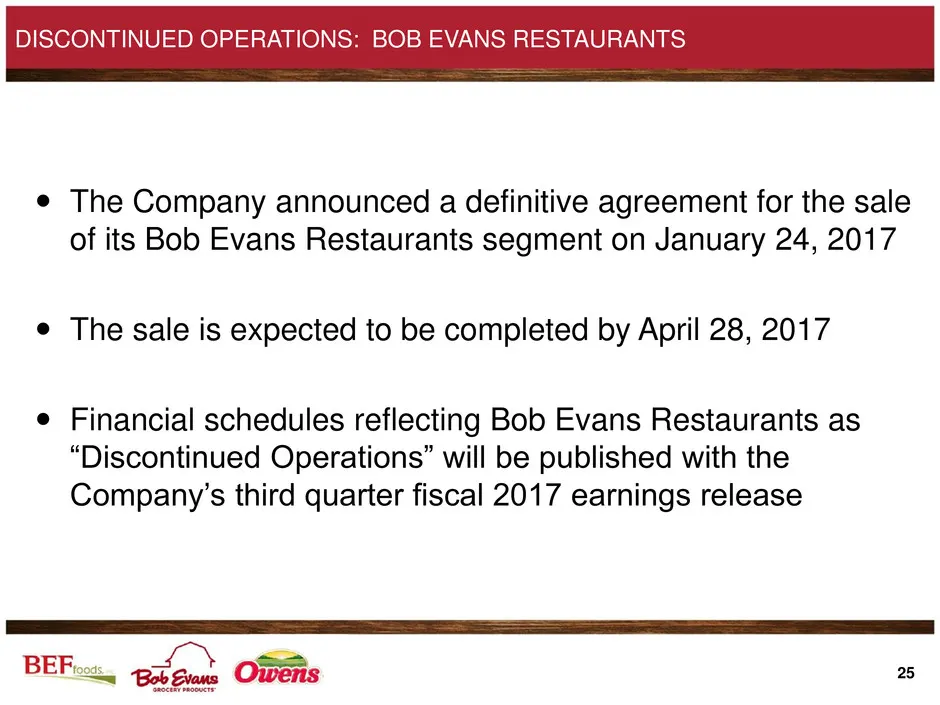
Slide 25: Discontinued Operations: Bob Evans Restaurants
DISCONTINUED OPERATIONS: BOB EVANS RESTAURANTS The Company announced a definitive agreement for the sale of its Bob Evans Restaurants segment on January 24, 2017 The sale is expected to be completed by April 28, 2017 Financial schedules reflecting Bob Evans Restaurants as “Discontinued Operations” w
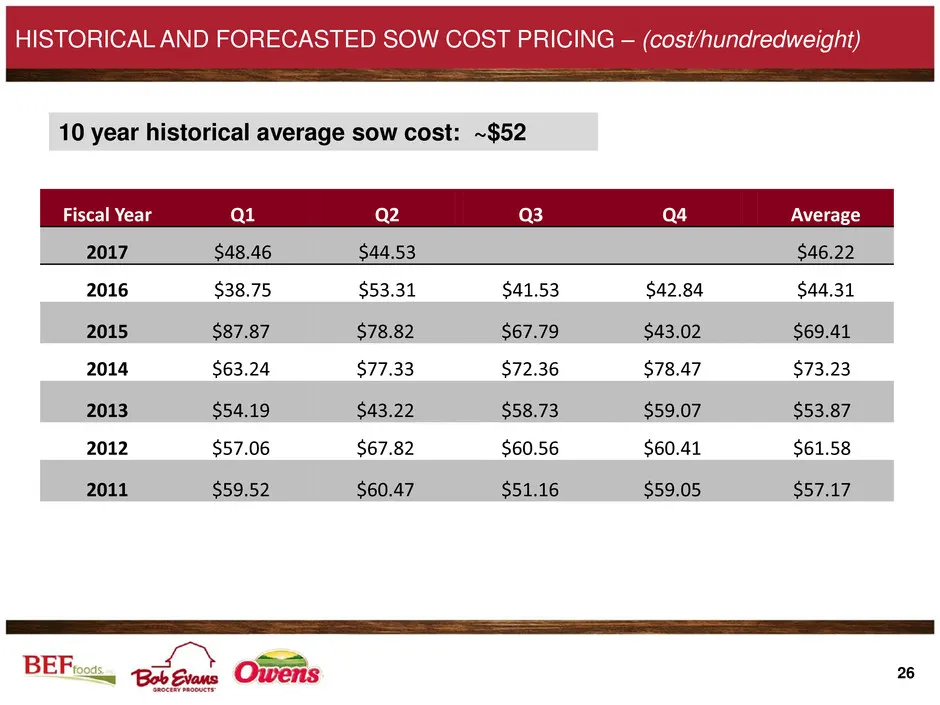
Slide 26: Historical and Forecasted Sow Cost Pricing
HISTORICAL AND FORECASTED SOW COST PRICING -— (cost/hundredweight) 10 year historical average sow cost: ~$52 Fiscal Year Ql Q2 Q3 Q4 Average 2017 $48.46 $44.53 $46.22 2016 $38.75 $53.31 $41.53 $42.84 $44.31 2015 $87.87 $78.82 $67.79 $43.02 $69.41 2014 $63.24 $77.33 $72.36 $78.47 $73.23 2013 $54.19 $
Source: SEC EDGAR · 8-K filed Jan 25, 2017
More decks from Bob Evans Farms Inc
 Merger or Acquisition (September 2017)18 slides · Sep 28, 2017
 Merger or Acquisition (September 2017)12 slides · Sep 19, 2017
 Merger or Acquisition (September 2017)17 slides · Sep 19, 2017
 Merger or Acquisition (September 2017)10 slides · Sep 19, 2017
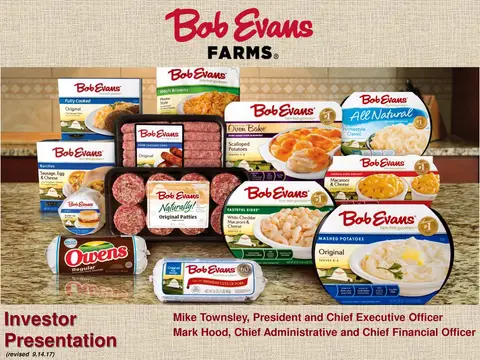 Investor Presentation (September 2017)32 slides · Sep 14, 2017
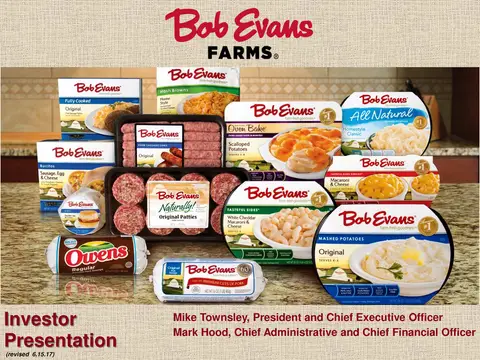 Investor Presentation (June 2017)30 slides · Jun 15, 2017