TPI Composites — Investor Day (February 2020)
84 slides from TPI Composites's investor day presentation, Feb 7, 2020
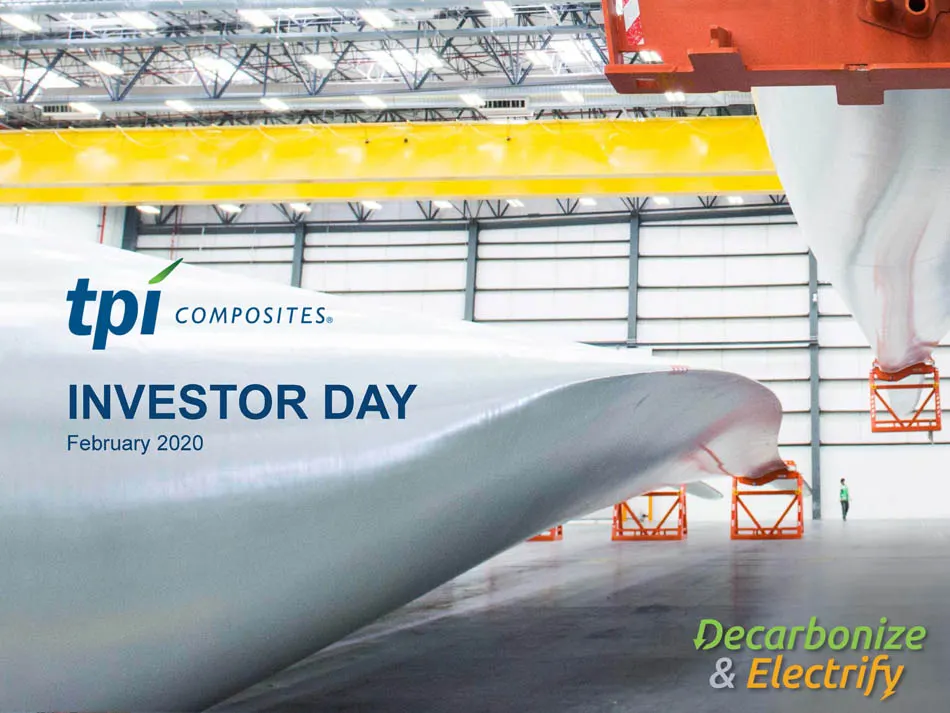
Slide 1: Investor Day February 2020
| February 7, 2020 INVESTOR DAY February 2020
Slide 2: Legal Disclaimer
| February 7, 2020 2 Legal Disclaimer This presentation contains forward - looking statements which are made pursuant to safe harbor provisions of the Private Securities Litigation Reform Act of 1995. These forward - looking statements include statements, among other things, concerning: our selected
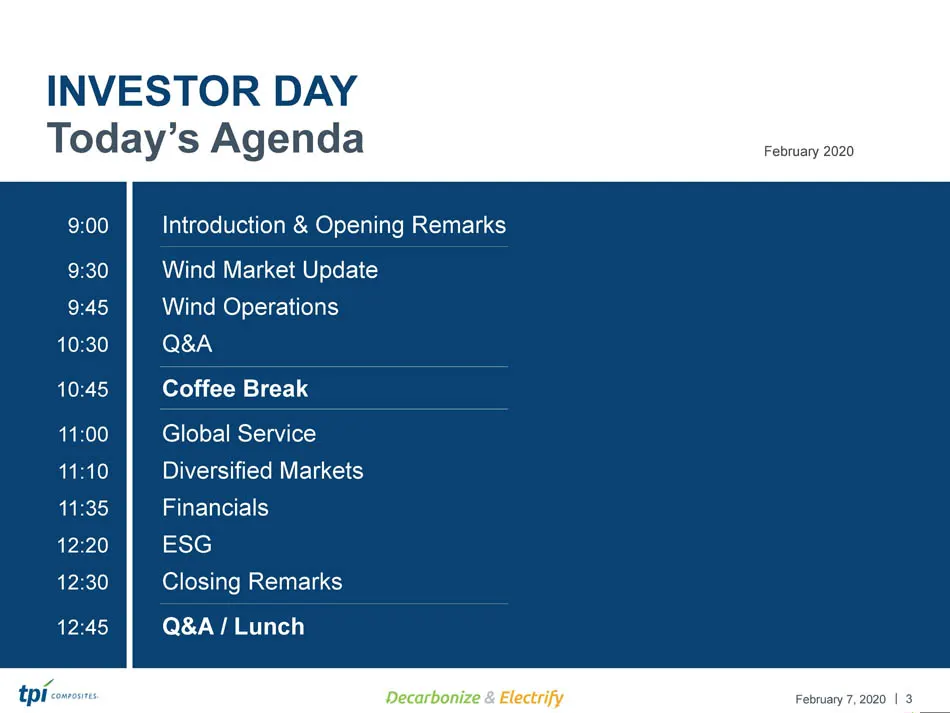
Slide 3: Today's Agenda
| February 7, 2020 Introduction & Opening Remarks Wind Market Update Wind Operations Q&A Coffee Break Global Service Diversified Markets Financials ESG Closing Remarks Q&A / Lunch Today’s Agenda 9:00 9:30 9:45 10:30 10:45 11:00 11:10 11:35 12:20 12:30 12:45 INVESTOR DAY February 2020 3
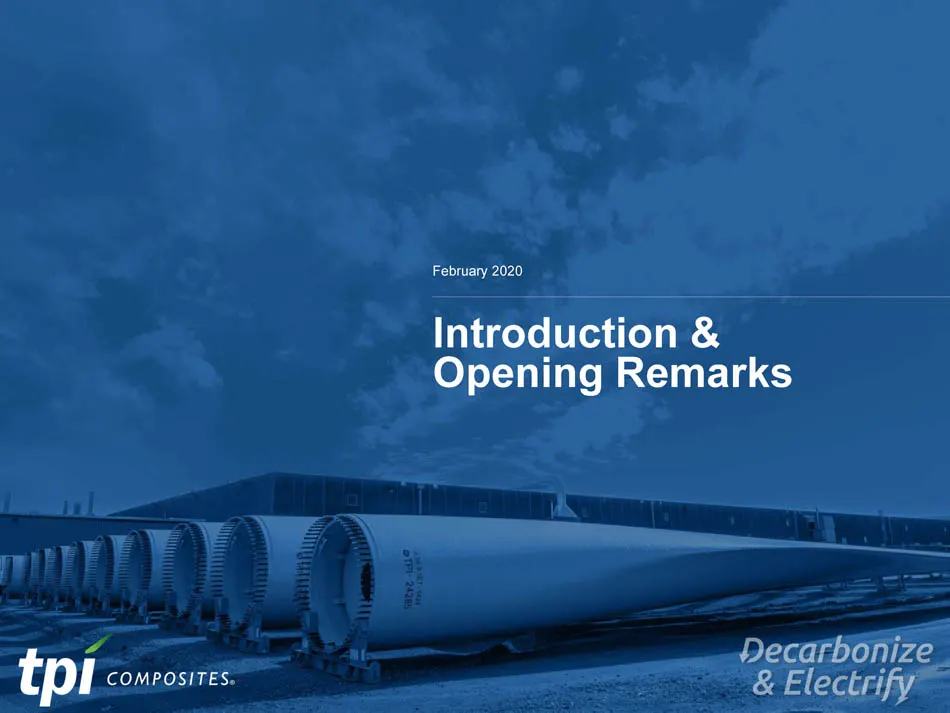
Slide 4: Introduction & Opening Remarks
| February 7, 2020 February 2020 Introduction & Opening Remarks
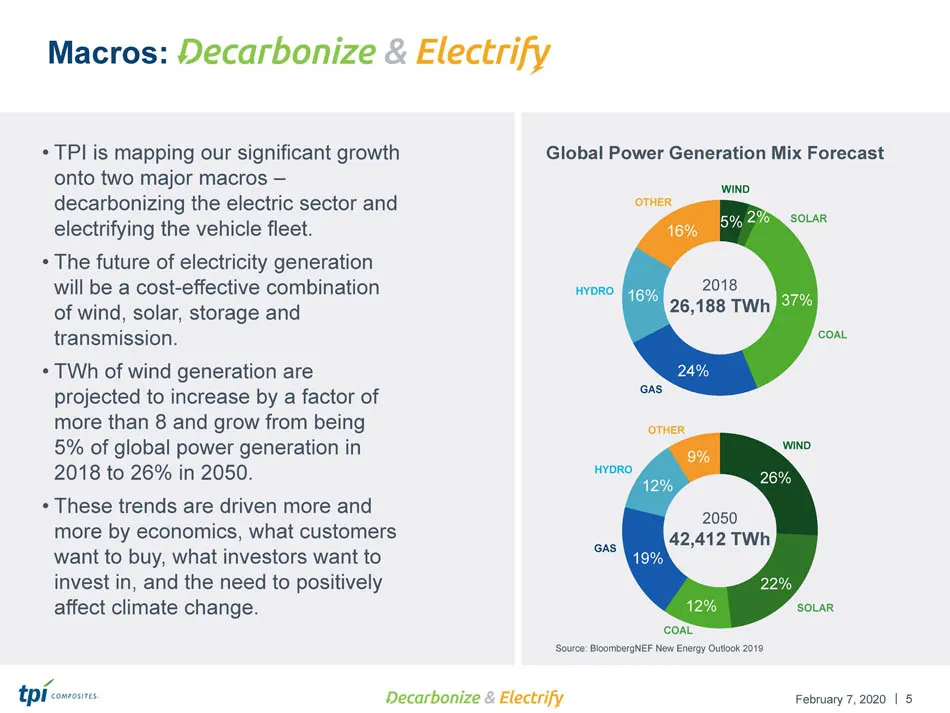
Slide 5: Macros: decarbonizing electricity and electrifying vehicles
| February 7, 2020 Macros: 5 Source: BloombergNEF New Energy Outlook 2019 • TPI is mapping our significant growth onto two major macros – decarbonizing the electric sector and electrifying the vehicle fleet. • The future of electricity generation will be a cost - effective combination of wind, solar
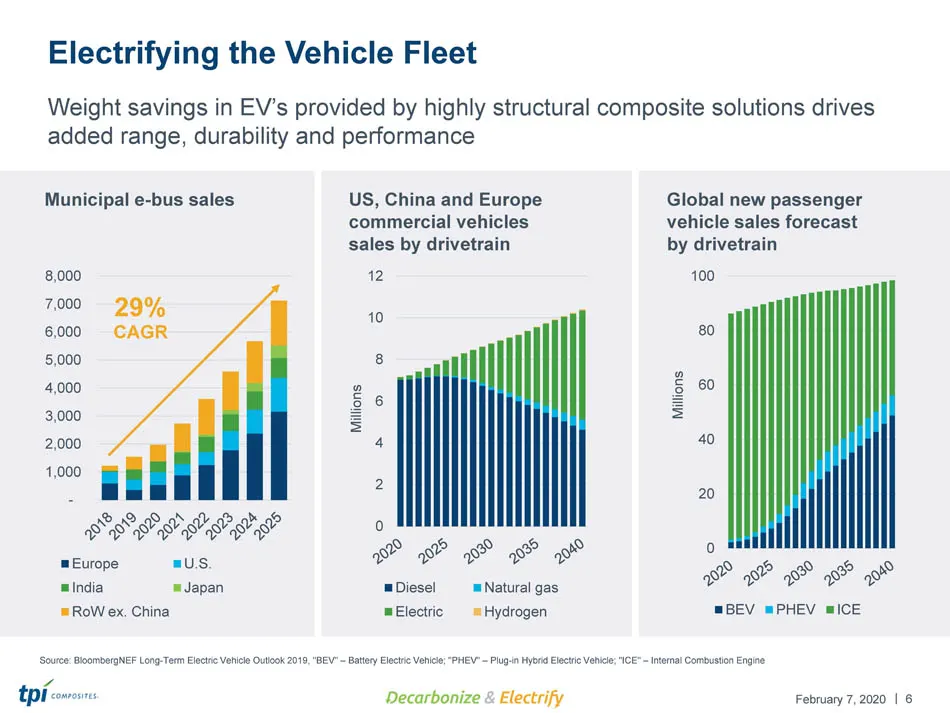
Slide 6: Electrifying the Vehicle Fleet
| February 7, 2020 Electrifying the Vehicle Fleet 6 Weight savings in EV’s provided by highly structural composite solutions drives added range, durability and performance 0 20 40 60 80 100 Millions BEV PHEV ICE Global new passenger vehicle sales forecast by drivetrain 0 2 4 6 8 10 12 Millions Diese
Slide 7: Investment Thesis
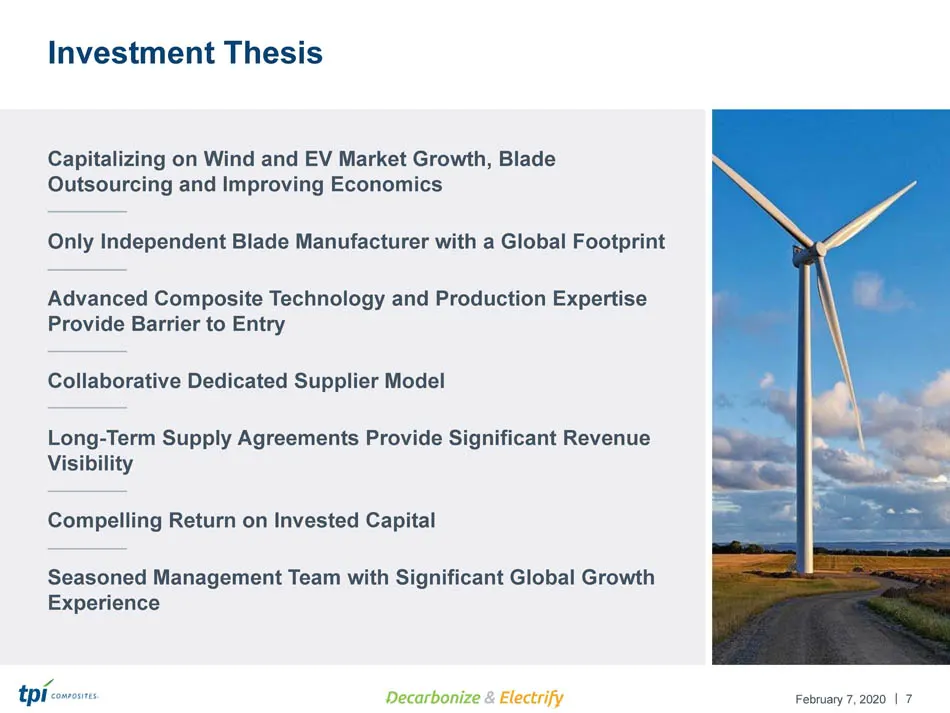
| February 7, 2020 7 Investment Thesis Capitalizing on Wind and EV Market Growth, Blade Outsourcing and Improving Economics Only Independent Blade Manufacturer with a Global Footprint Advanced Composite Technology and Production Expertise Provide Barrier to Entry Collaborative Dedicated Supplier Mod
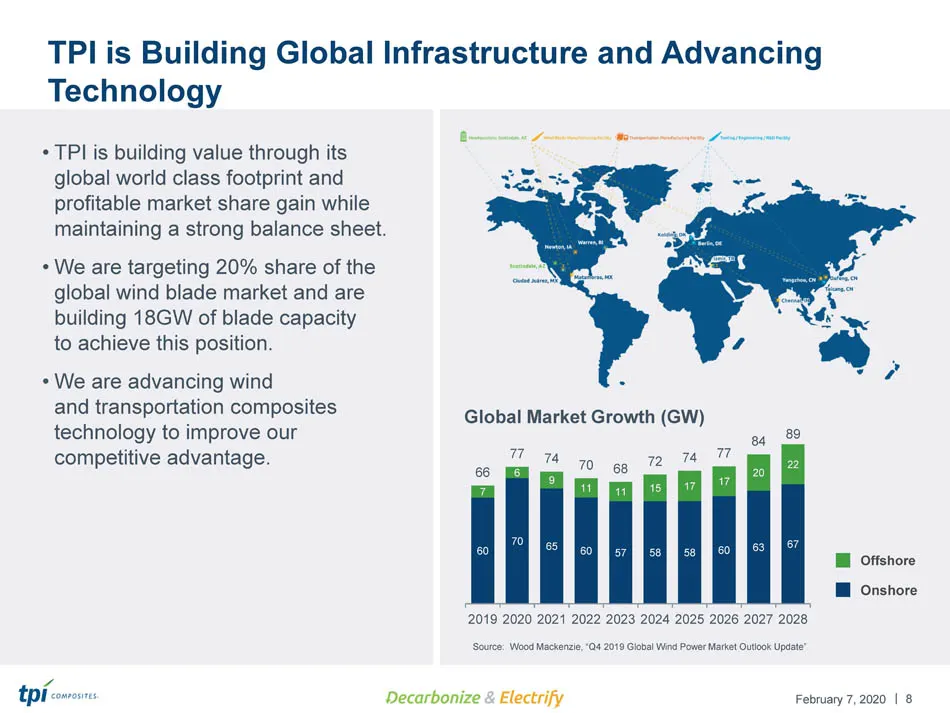
Slide 8: TPI is Building Global Infrastructure and Advancing Technology
| February 7, 2020 TPI is Building Global Infrastructure and Advancing Technology 8 • TPI is building value through its global world class footprint and profitable market share gain while maintaining a strong balance sheet. • We are targeting 20% share of the global wind blade market and are buildin
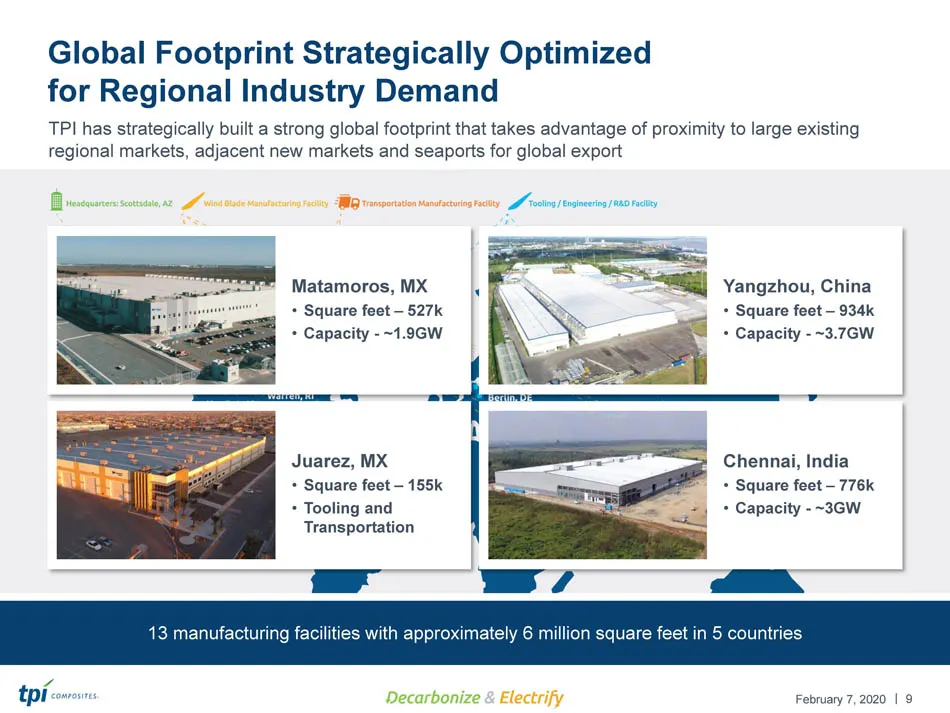
Slide 9: Global Footprint Strategically Optimized for Regional Industry Demand
| February 7, 2020 9 Global Footprint Strategically Optimized for Regional Industry Demand TPI has strategically built a strong global footprint that takes advantage of proximity to large existing regional markets, adjacent new markets and seaports for global export 13 manufacturing facilities with
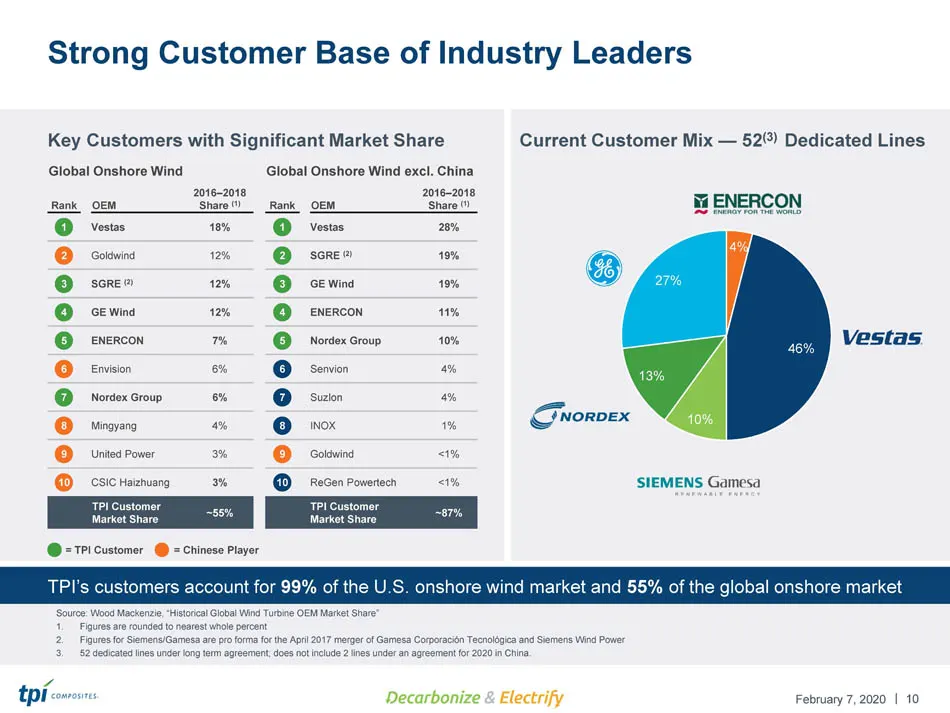
Slide 10: Strong Customer Base of Industry Leaders
| February 7, 2020 TPI’s customers account for 99% of the U.S. onshore wind market and 55% of the global onshore market 10 Strong Customer Base of Industry Leaders Current Customer Mix — 52 (3) Dedicated Lines 4% 46% 10% 13% 27% Key Customers with Significant Market Share = TPI Customer = Chinese Pl
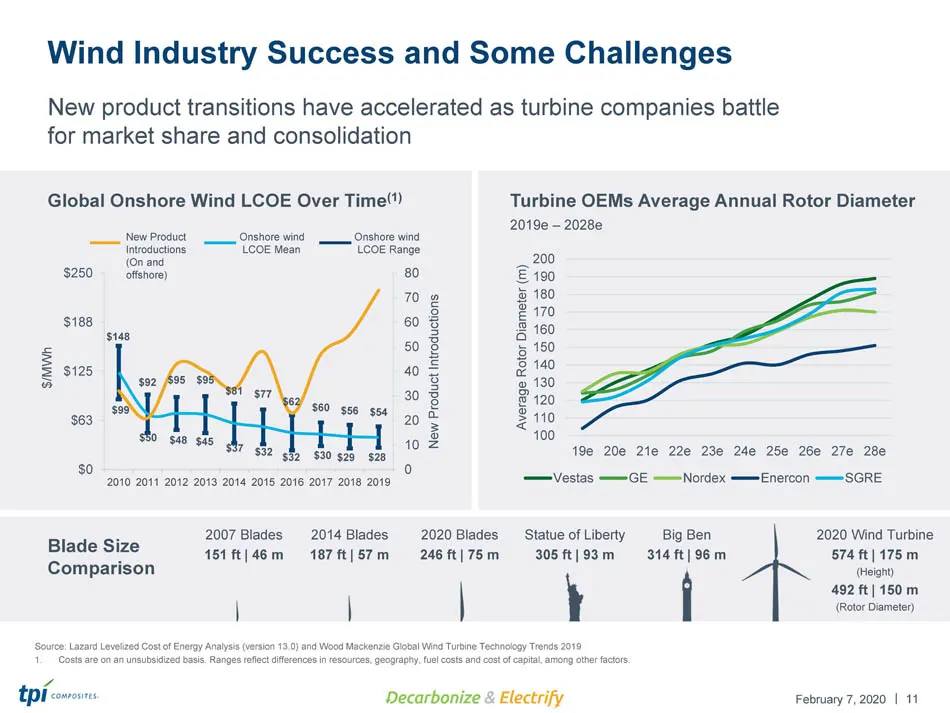
Slide 11: Wind Industry Success and Some Challenges
| February 7, 2020 11 Wind Industry Success and Some Challenges New product transitions have accelerated as turbine companies battle for market share and consolidation Source: Lazard Levelized Cost of Energy Analysis (version 13.0 ) and Wood Mackenzie Global Wind Turbine Technology Trends 2019 1. Co
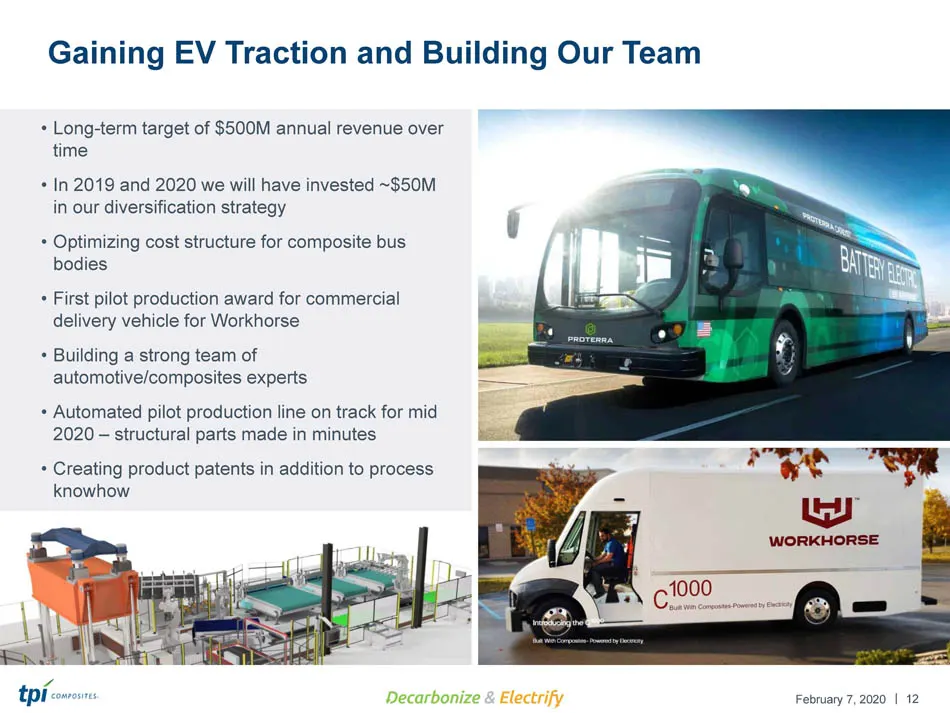
Slide 12: Gaining EV Traction and Building Our Team
| February 7, 2020 12 Gaining EV Traction and Building Our Team • Long - term target of $500M annual revenue over time • In 2019 and 2020 we will have invested ~$50M in our diversification strategy • Optimizing cost structure for composite bus bodies • First pilot production award for commercial del
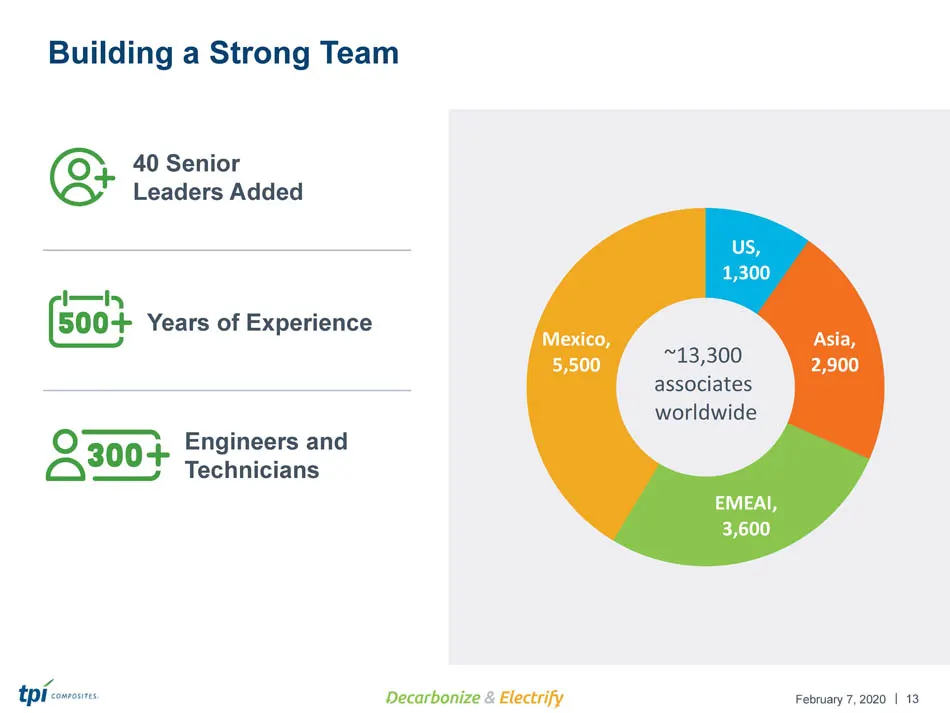
Slide 13: Building a Strong Team
| February 7, 2020 US , 1,300 Asia , 2,900 EMEAI , 3,600 Mexico , 5,500 ~13,300 associates worldwide Building a Strong Team 13 40 Senior Leaders Added Years of Experience Engineers and Technicians
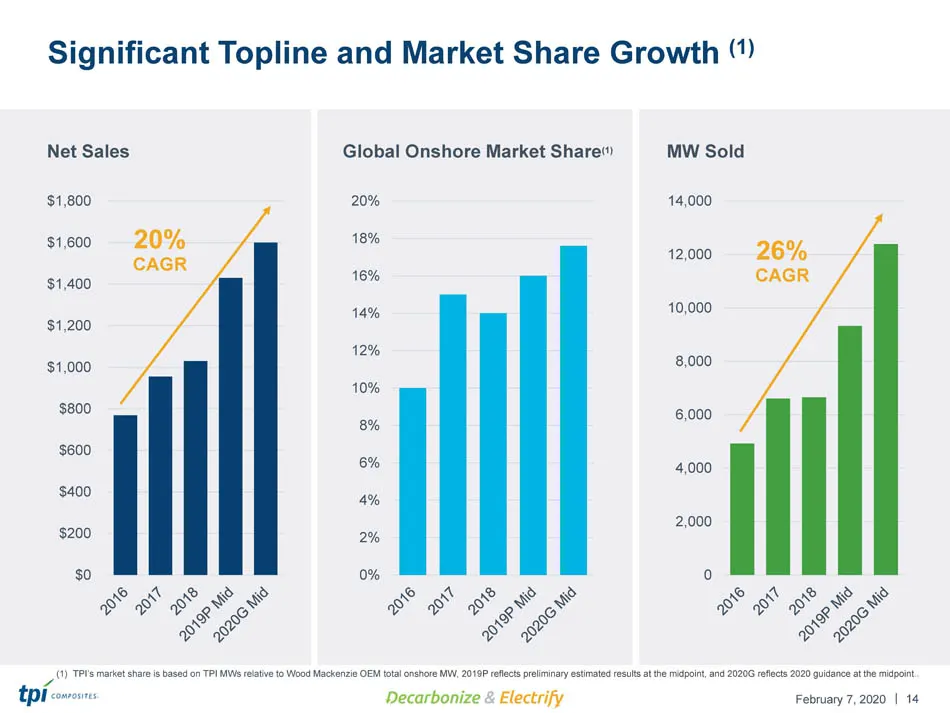
Slide 14: Significant Topline and Market Share Growth
| February 7, 2020 Significant Topline and Market Share Growth (1) 14 MW Sold Global Onshore Market Share (1) Net Sales $0 $200 $400 $600 $800 $1,000 $1,200 $1,400 $1,600 $1,800 0% 2% 4% 6% 8% 10% 12% 14% 16% 18% 20% 0 2,000 4,000 6,000 8,000 10,000 12,000 14,000 20% CAGR (1) TPI’s market share is b
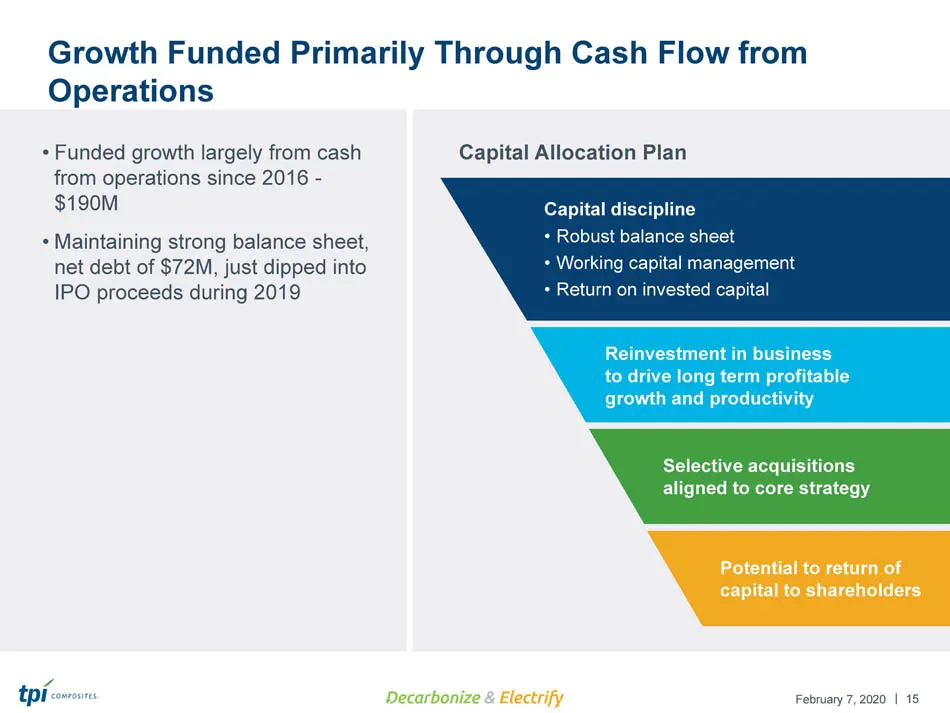
Slide 15: Growth Funded Primarily Through Cash Flow from Operations
| February 7, 2020 Growth Funded Primarily Through Cash Flow from Operations 15 • Funded growth largely from cash from operations since 2016 - $190M • Maintaining strong balance sheet, net debt of $72M, just dipped into IPO proceeds during 2019 Capital Allocation Plan Capital discipline • Robust bal
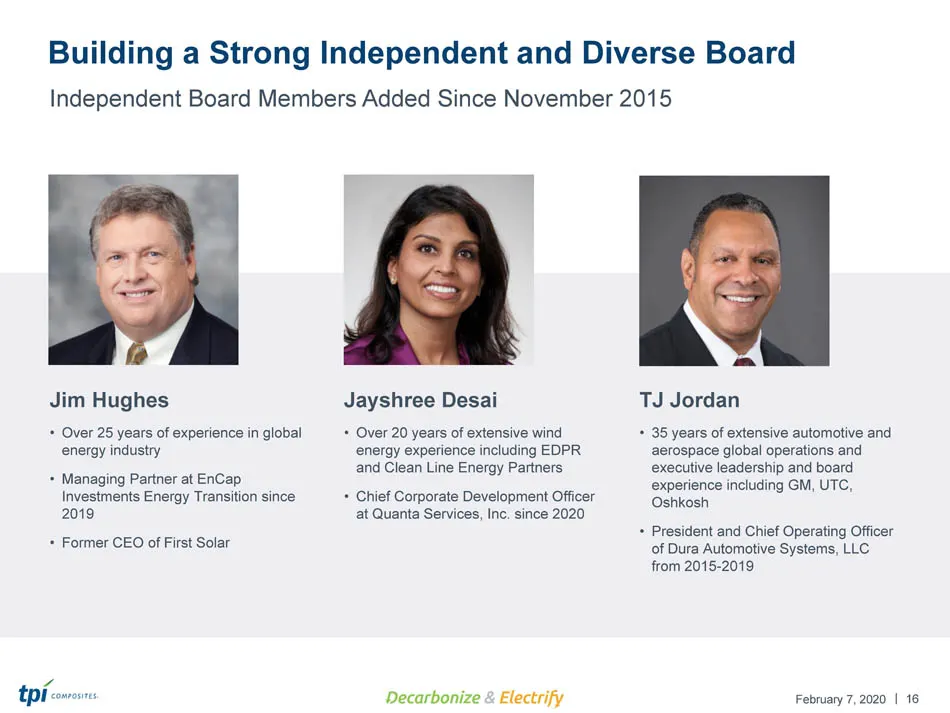
Slide 16: Building a Strong Independent and Diverse Board
| February 7, 2020 16 Building a Strong Independent and Diverse Board TJ Jordan • 35 years of extensive automotive and aerospace global operations and executive leadership and board experience including GM, UTC, Oshkosh • President and Chief Operating Officer of Dura Automotive Systems, LLC from 201
Slide 17: TPI Operating Imperatives
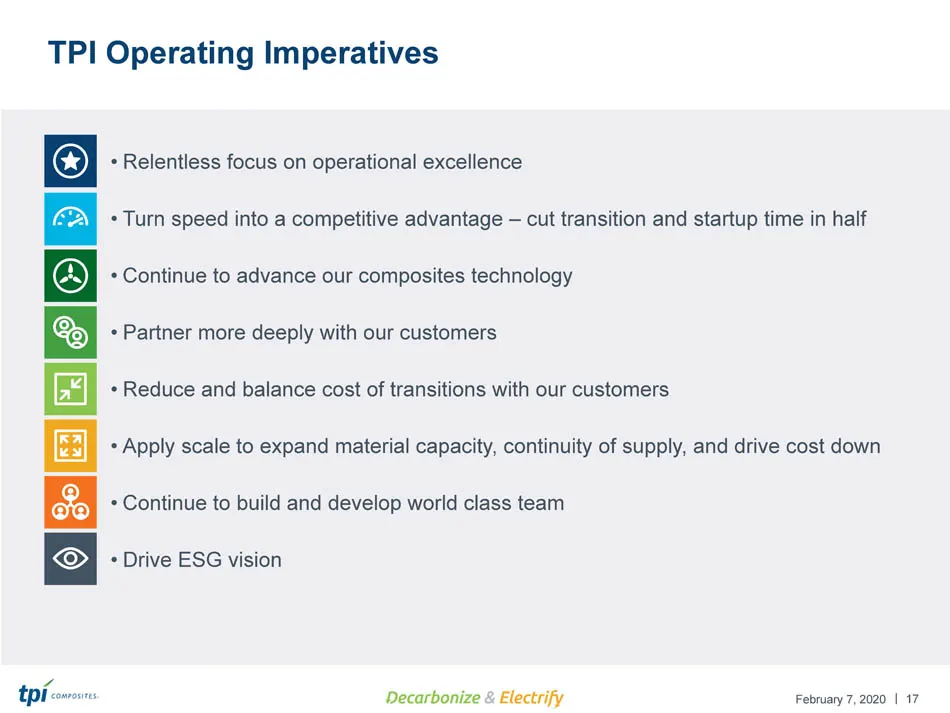
| February 7, 2020 17 TPI Operating Imperatives • Relentless focus on operational excellence • Turn speed into a competitive advantage – cut transition and startup time in half • Continue to advance our composites technology • Partner more deeply with our customers • Reduce and balance cost of trans
Slide 18: Key Biographies
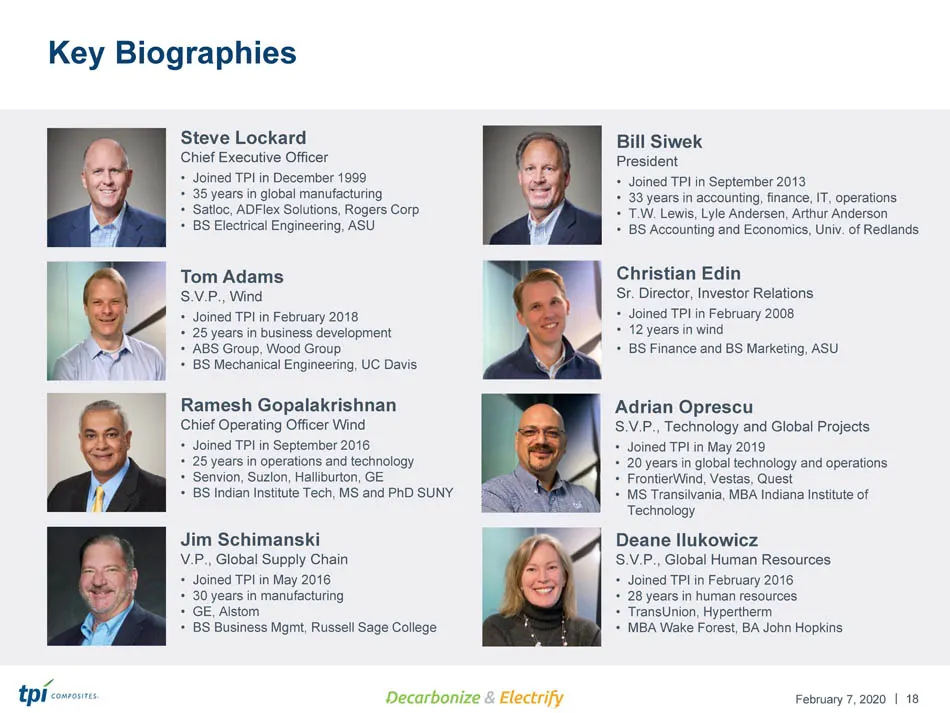
| February 7, 2020 Key Biographies 18 Christian Edin Sr. Director, Investor Relations • Joined TPI in February 2008 • 12 years in wind • BS Finance and BS Marketing, ASU Deane Ilukowicz S.V.P., Global Human Resources • Joined TPI in February 2016 • 28 years in human resources • TransUnion, Hyperther
Slide 19: Key Biographies
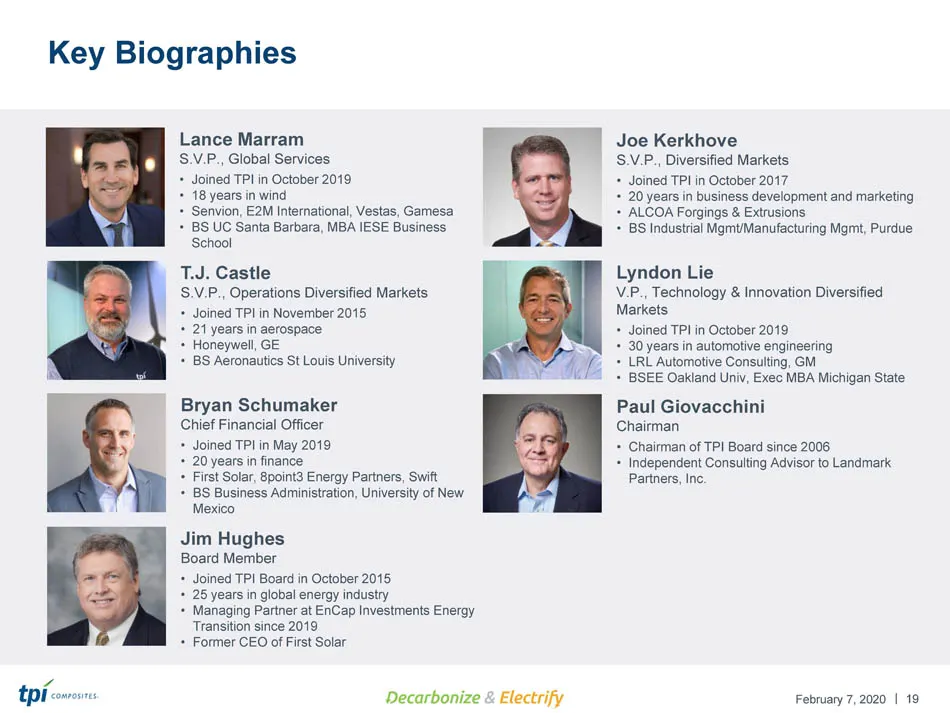
| February 7, 2020 Key Biographies 19 Paul Giovacchini Chairman • Chairman of TPI Board since 2006 • Independent Consulting Advisor to Landmark Partners, Inc. Lance Marram S.V.P., Global Services • Joined TPI in October 2019 • 18 years in wind • Senvion, E2M International, Vestas, Gamesa • BS UC San
Slide 20: Wind Market Update
| February 7, 2020 February 2020 Wind Market Update
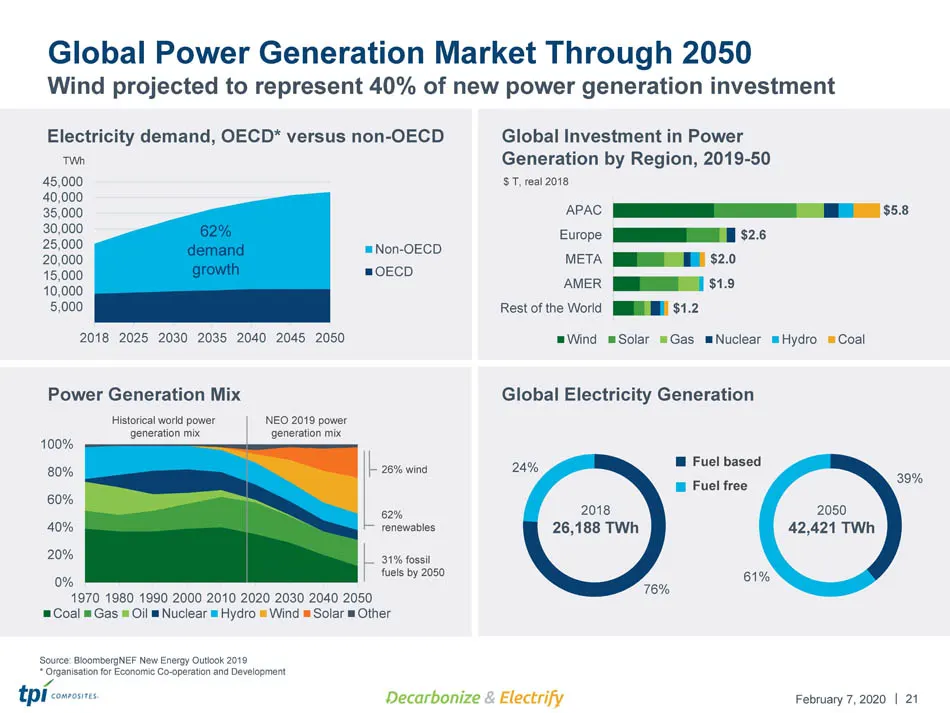
Slide 21: Global Power Generation Market Through 2050
| February 7, 2020 21 Global Power Generation Market Through 2050 Wind projected to represent 40% of new power generation investment Source: BloombergNEF New Energy Outlook 2019 * Organisation for Economic Co - operation and Development 76% 24% 39% 61% Global Electricity Generation 2018 26,188 TWh 2
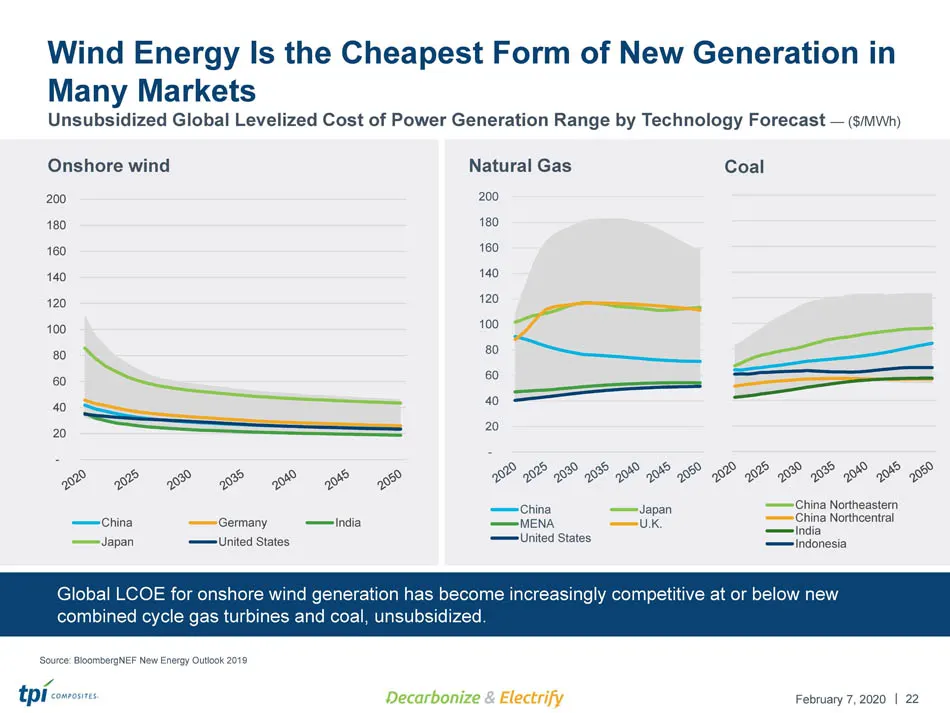
Slide 22: Wind Energy Is the Cheapest Form of New Generation in Many Markets
| February 7, 2020 China Northeastern China Northcentral India Indonesia - 20 40 60 80 100 120 140 160 180 200 China Japan MENA U.K. United States Wind Energy Is the Cheapest Form of New Generation in Many Markets 22 Unsubsidized Global Levelized Cost of Power Generation Range by Technology Forecast
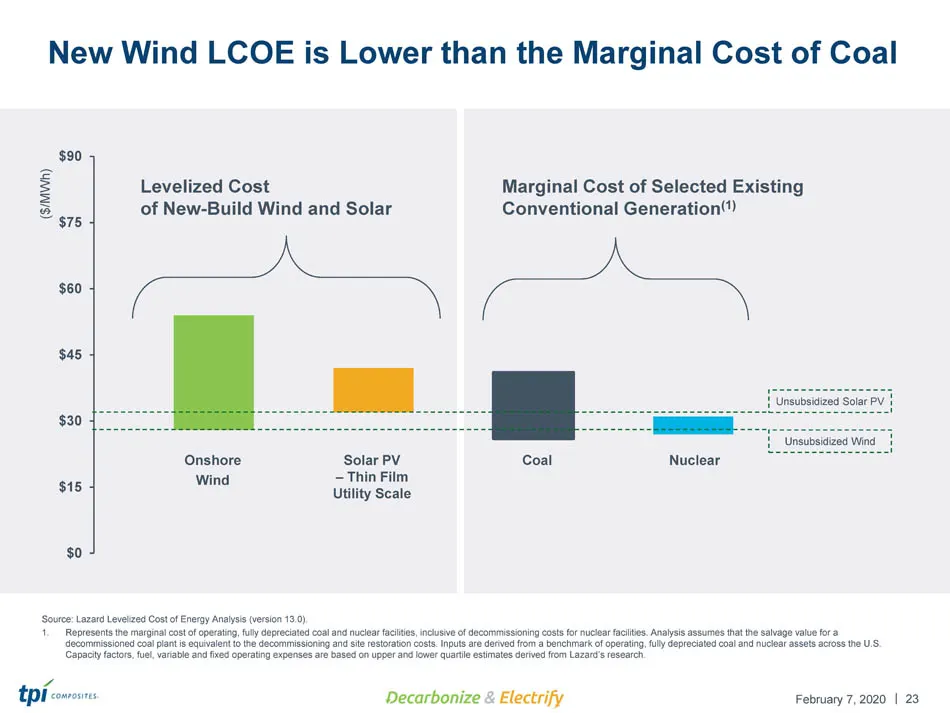
Slide 23: New Wind LCOE is Lower than the Marginal Cost of Coal
| February 7, 2020 New Wind LCOE is Lower than the Marginal Cost of Coal 23 $0 $15 $30 $45 $60 $75 $90 Onshore Wind Solar PV – Thin Film Utility Scale Coal Nuclear Levelized Cost of New - Build Wind and Solar Marginal Cost of Selected Existing Conventional Generation (1) Unsubsidized Solar PV Unsubs
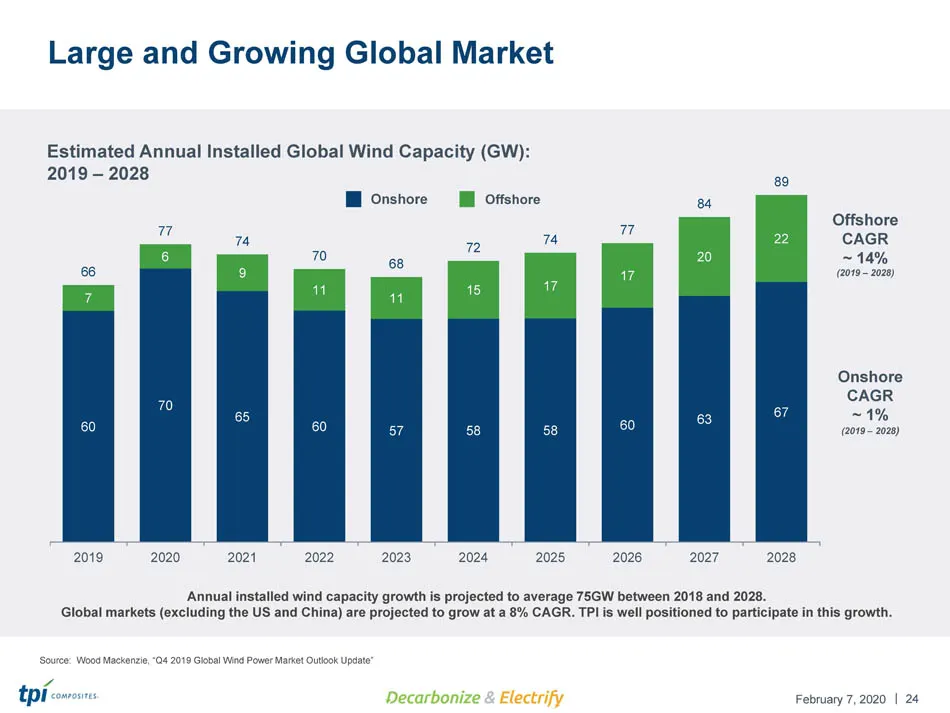
Slide 24: Large and Growing Global Market
| February 7, 2020 24 Large and Growing Global Market Source: Wood Mackenzie, “Q4 2019 Global Wind Power Market Outlook Update” 60 70 65 60 57 58 58 60 63 67 7 6 9 11 11 15 17 17 20 22 66 77 74 70 68 72 74 77 84 89 2019 2020 2021 2022 2023 2024 2025 2026 2027 2028 Onshore Offshore Offshore CAGR ~ 14
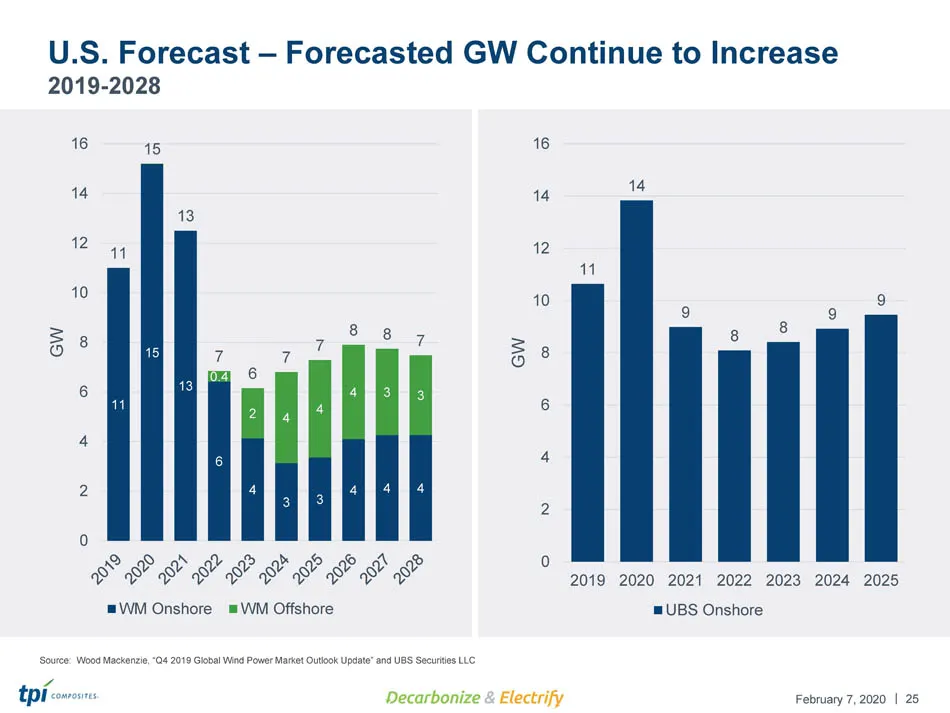
Slide 25: U.S. Forecast – Forecasted GW Continue to Increase
| February 7, 2020 25 Source: Wood Mackenzie, “Q4 2019 Global Wind Power Market Outlook Update” and UBS Securities LLC 11 15 13 6 4 3 3 4 4 4 0.4 2 4 4 4 3 3 11 15 13 7 6 7 7 8 8 7 0 2 4 6 8 10 12 14 16 GW WM Onshore WM Offshore 11 14 9 8 8 9 9 0 2 4 6 8 10 12 14 16 2019 2020 2021 2022 2023 2024 202
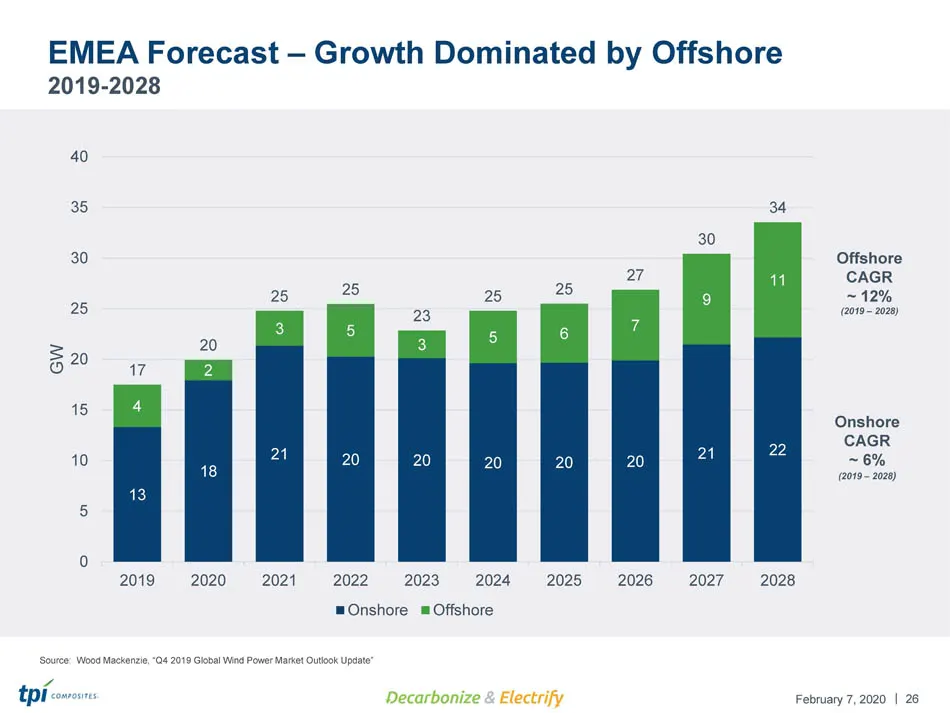
Slide 26: EMEA Forecast – Growth Dominated by Offshore
| February 7, 2020 26 Source: Wood Mackenzie, “Q4 2019 Global Wind Power Market Outlook Update” EMEA Forecast – Growth Dominated by Offshore 2019 - 2028 13 18 21 20 20 20 20 20 21 22 4 2 3 5 3 5 6 7 9 11 17 20 25 25 23 25 25 27 30 34 0 5 10 15 20 25 30 35 40 2019 2020 2021 2022 2023 2024 2025 2026 2
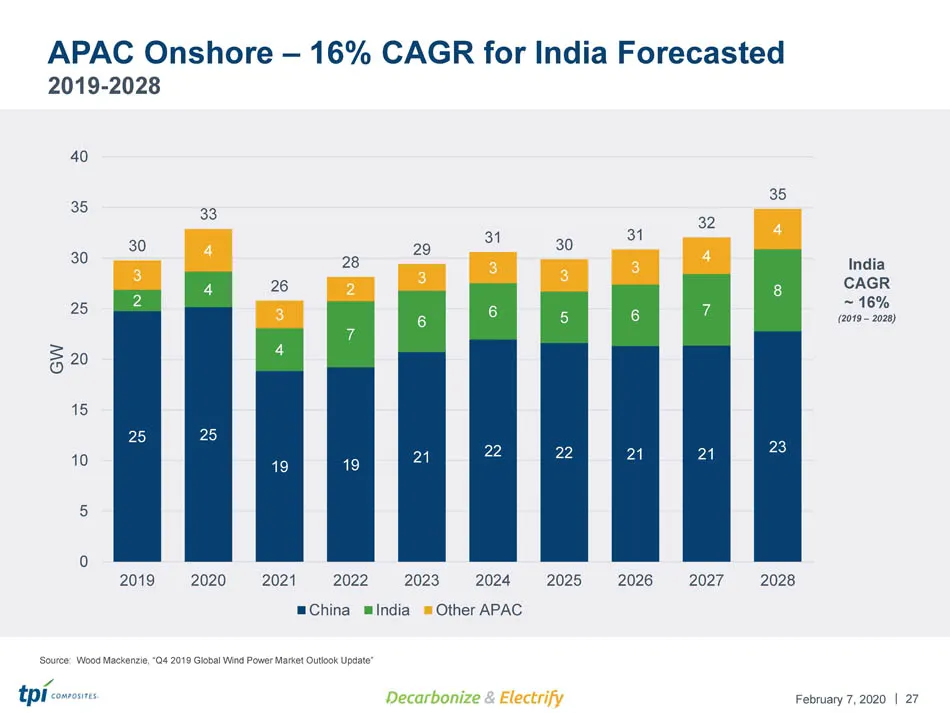
Slide 27: APAC Onshore – 16% CAGR for India
| February 7, 2020 27 Source: Wood Mackenzie, “Q4 2019 Global Wind Power Market Outlook Update” APAC Onshore – 16% CAGR for India Forecasted 2019 - 2028 25 25 19 19 21 22 22 21 21 23 2 4 4 7 6 6 5 6 7 8 3 4 3 2 3 3 3 3 4 4 30 33 26 28 29 31 30 31 32 35 0 5 10 15 20 25 30 35 40 2019 2020 2021 2022 20
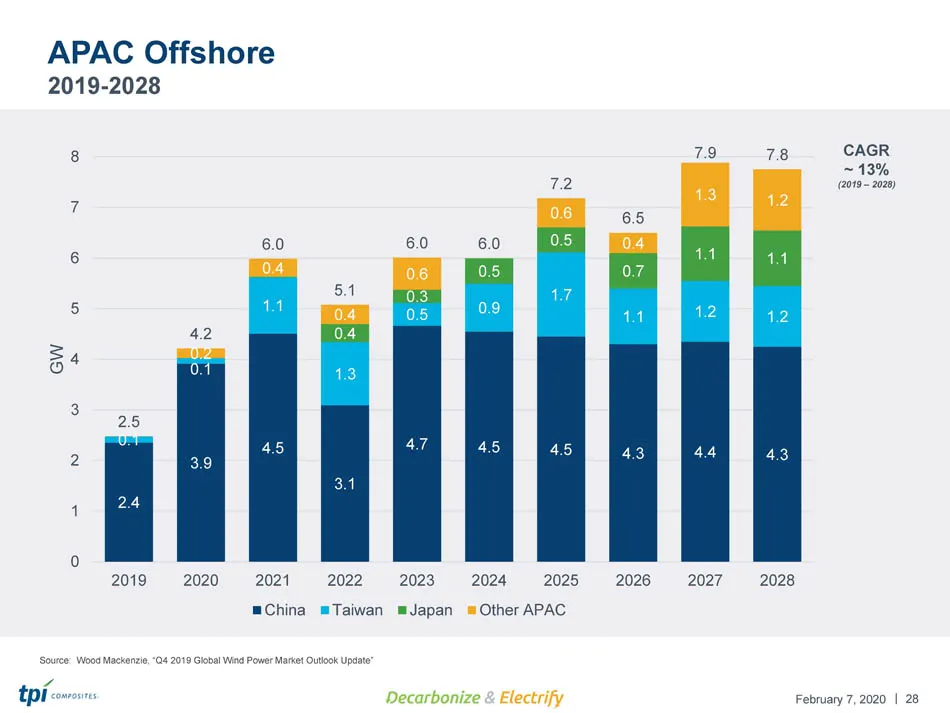
Slide 28: APAC Offshore
| February 7, 2020 28 Source: Wood Mackenzie, “Q4 2019 Global Wind Power Market Outlook Update” APAC Offshore 2019 - 2028 CAGR ~ 13% (2019 – 2028) 2.4 3.9 4.5 3.1 4.7 4.5 4.5 4.3 4.4 4.3 0.1 0.1 1.1 1.3 0.5 0.9 1.7 1.1 1.2 1.2 0.4 0.3 0.5 0.5 0.7 1.1 1.1 0.2 0.4 0.4 0.6 0.6 0.4 1.3 1.2 2.5 4.2 6.0 5
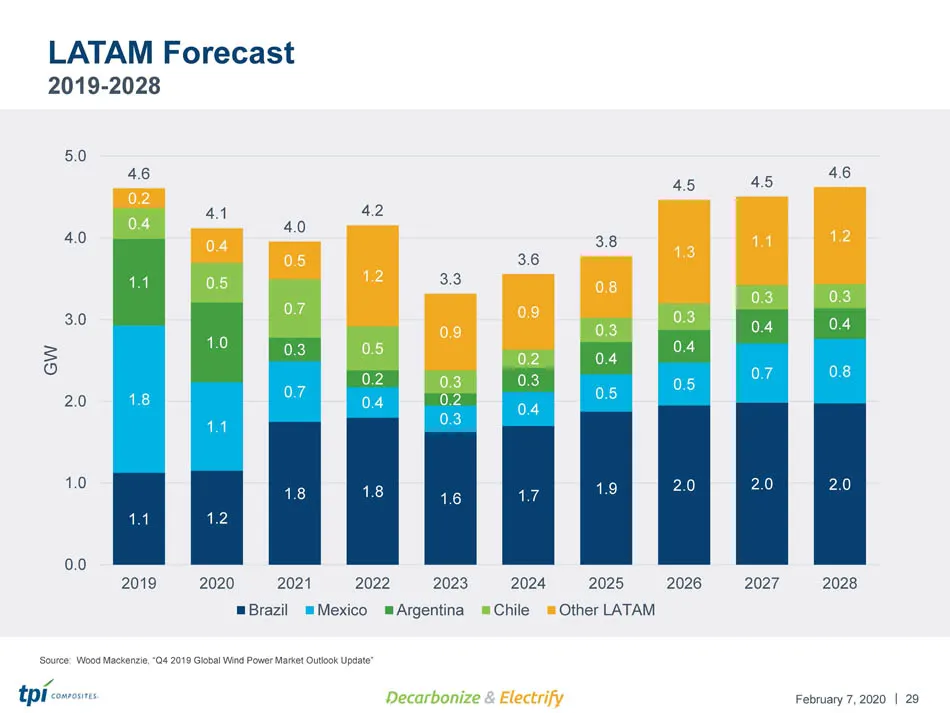
Slide 29: LATAM Forecast
| February 7, 2020 29 Source: Wood Mackenzie, “Q4 2019 Global Wind Power Market Outlook Update” LATAM Forecast 2019 - 2028 1.1 1.2 1.8 1.8 1.6 1.7 1.9 2.0 2.0 2.0 1.8 1.1 0.7 0.4 0.3 0.4 0.5 0.5 0.7 0.8 1.1 1.0 0.3 0.2 0.2 0.3 0.4 0.4 0.4 0.4 0.4 0.5 0.7 0.5 0.3 0.2 0.3 0.3 0.3 0.3 0.2 0.4 0.5 1.2 0
Slide 30: Wind Operations
| February 7, 2020 February 2020 Wind Operations
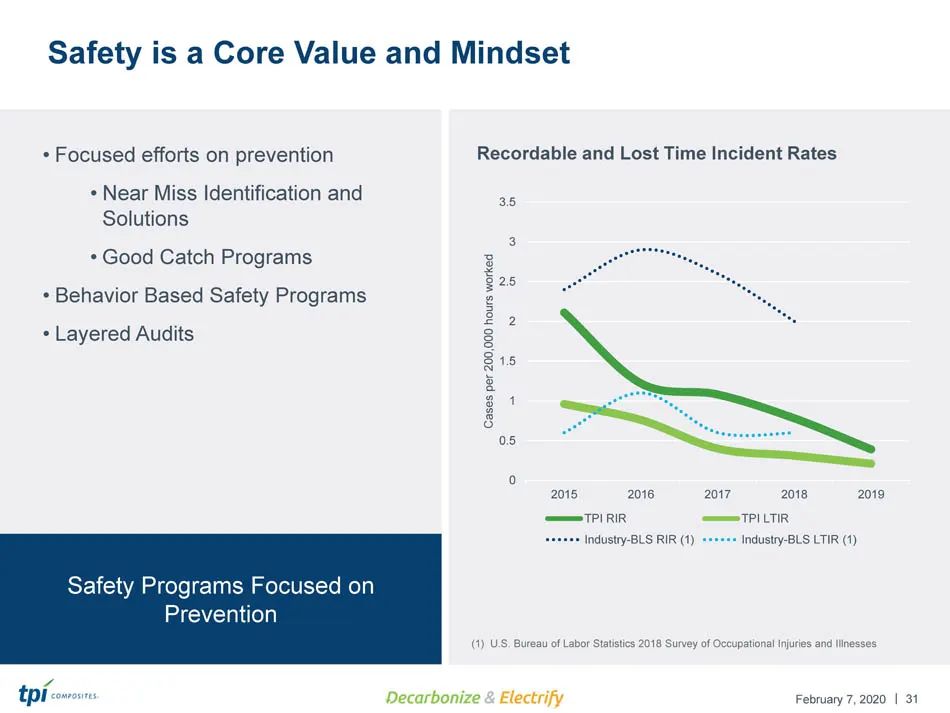
Slide 31: Safety is a Core Value and Mindset
| February 7, 2020 • Focused efforts on prevention • Near Miss Identification and Solutions • Good Catch Programs • Behavior Based Safety Programs • Layered Audits 31 Safety is a Core Value and Mindset Recordable and Lost Time Incident Rates 0 0.5 1 1.5 2 2.5 3 3.5 2015 2016 2017 2018 2019 Cases per
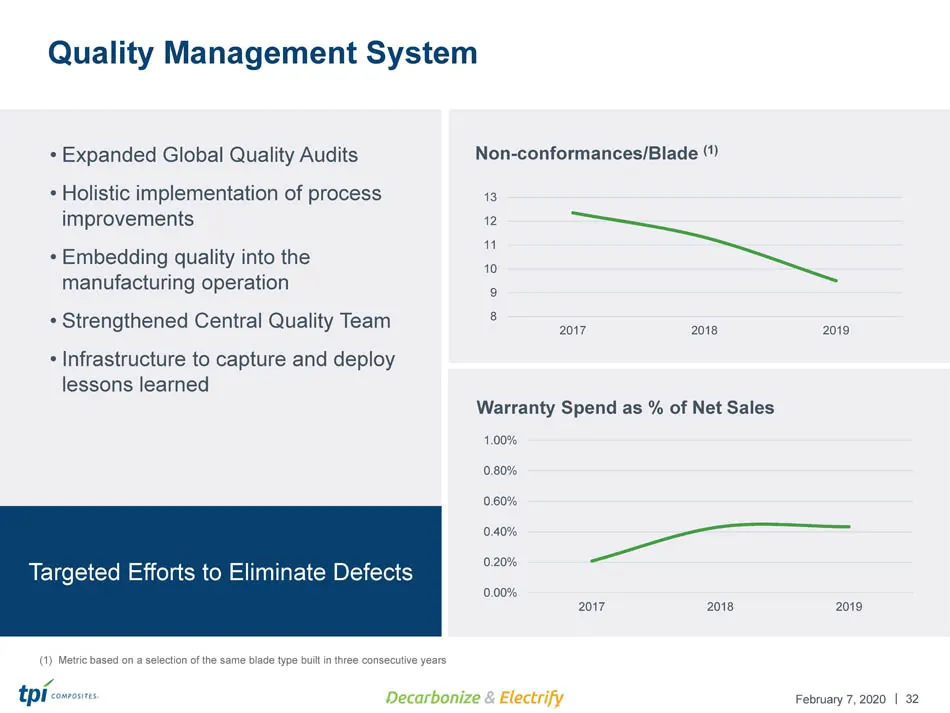
Slide 32: Targeted Efforts to Eliminate Defects
| February 7, 2020 0.00% 0.20% 0.40% 0.60% 0.80% 1.00% 2017 2018 2019 32 Quality Management System • Expanded Global Quality Audits • Holistic implementation of process improvements • Embedding quality into the manufacturing operation • Strengthened Central Quality Team • Infrastructure to capture a
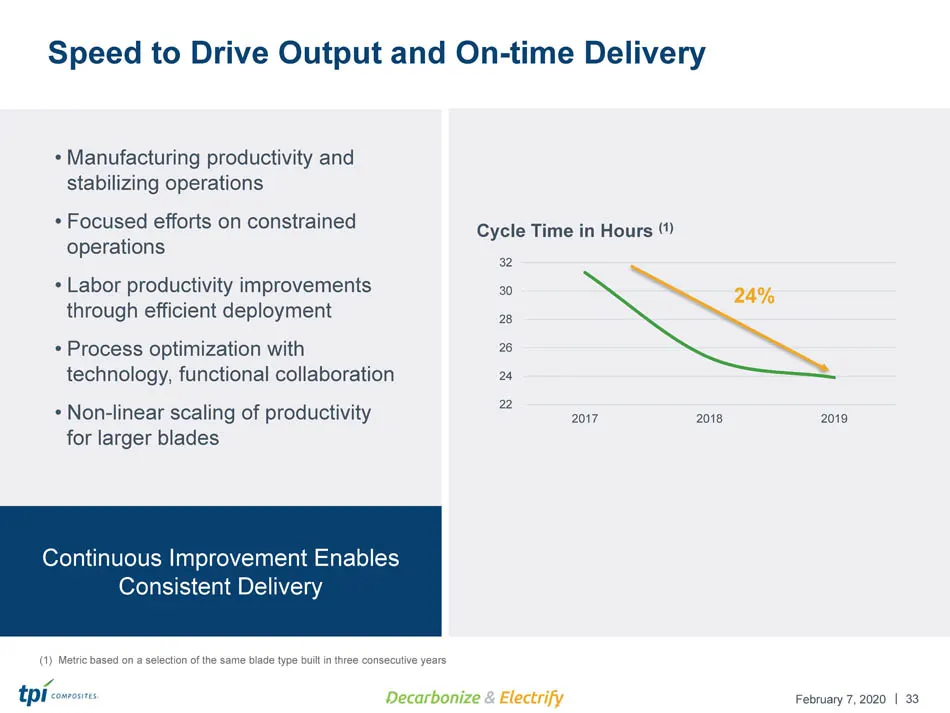
Slide 33: Speed to Drive Output and On-time Delivery
| February 7, 2020 33 Speed to Drive Output and On - time Delivery • Manufacturing productivity and stabilizing operations • Focused efforts on constrained operations • Labor productivity improvements through efficient deployment • Process optimization with technology, functional collaboration • Non
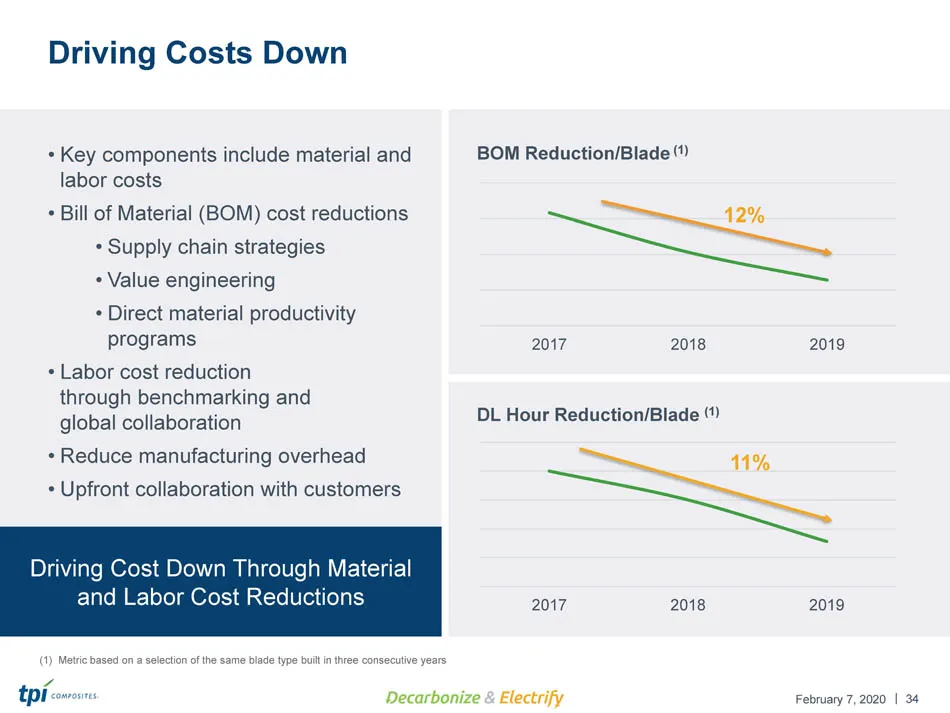
Slide 34: Driving Costs Down
| February 7, 2020 34 Driving Costs Down • Key components include material and labor costs • Bill of Material (BOM) cost reductions • Supply chain strategies • Value engineering • Direct material productivity programs • Labor cost reduction through benchmarking and global collaboration • Reduce manu
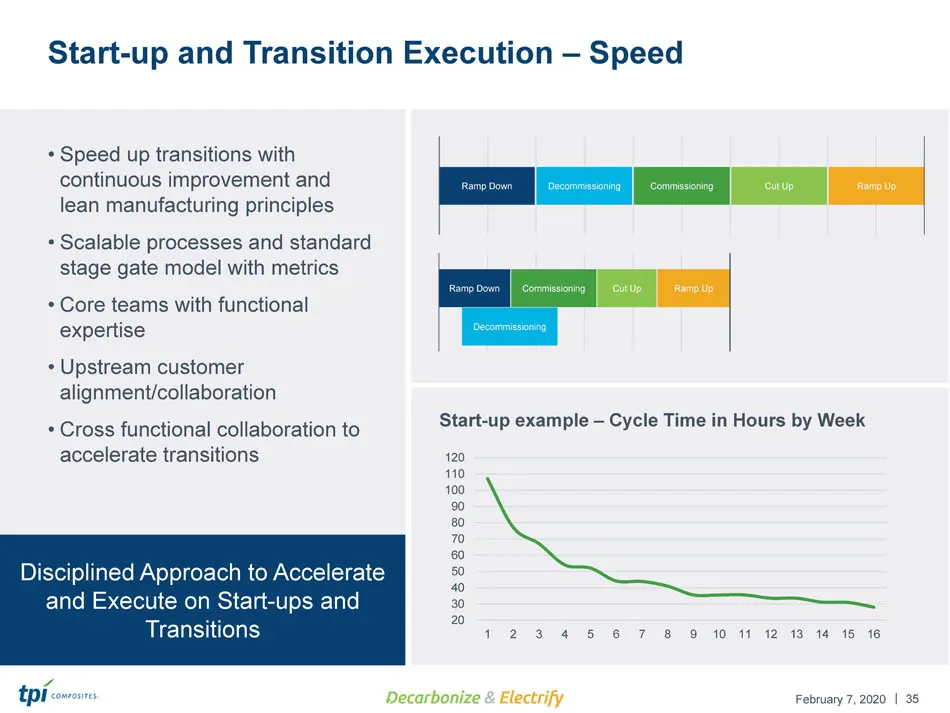
Slide 35: Start-up and Transition Execution – Speed
| February 7, 2020 35 Start - up and Transition Execution – Speed • Speed up transitions with continuous improvement and lean manufacturing principles • Scalable processes and standard stage gate model with metrics • Core teams with functional expertise • Upstream customer alignment/collaboration •
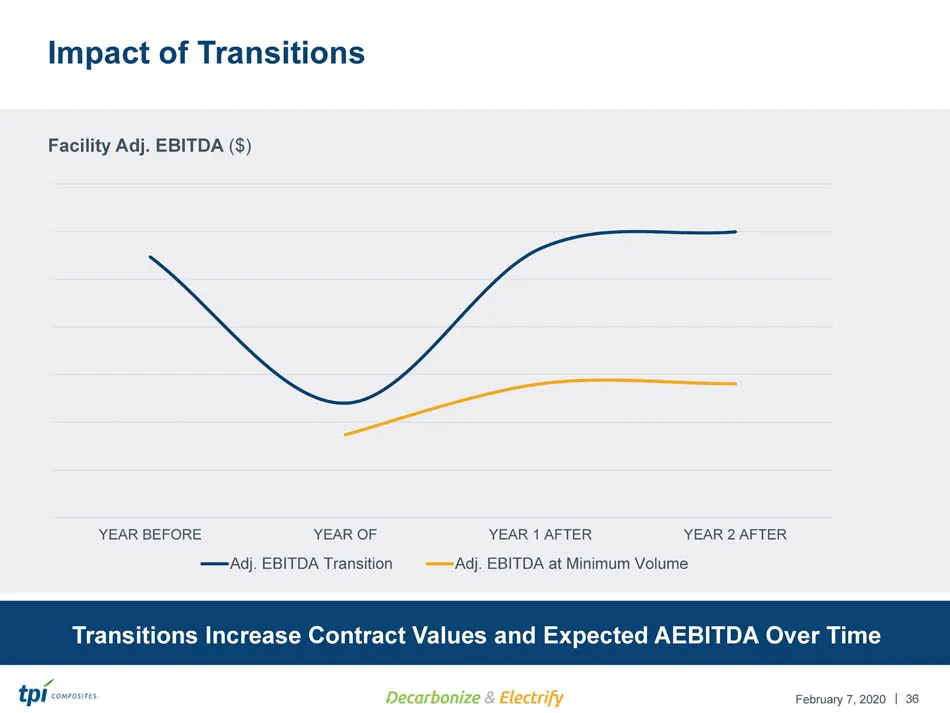
Slide 36: Impact of Transitions
| February 7, 2020 36 Impact of Transitions Transitions Increase Contract Values and Expected AEBITDA Over Time Facility Adj. EBITDA ($) YEAR BEFORE YEAR OF YEAR 1 AFTER YEAR 2 AFTER Adj. EBITDA Transition Adj. EBITDA at Minimum Volume
Slide 37: Technology
| February 7, 2020 February 2020 Technology
Slide 38: Technology Focused on Driving Business Performance
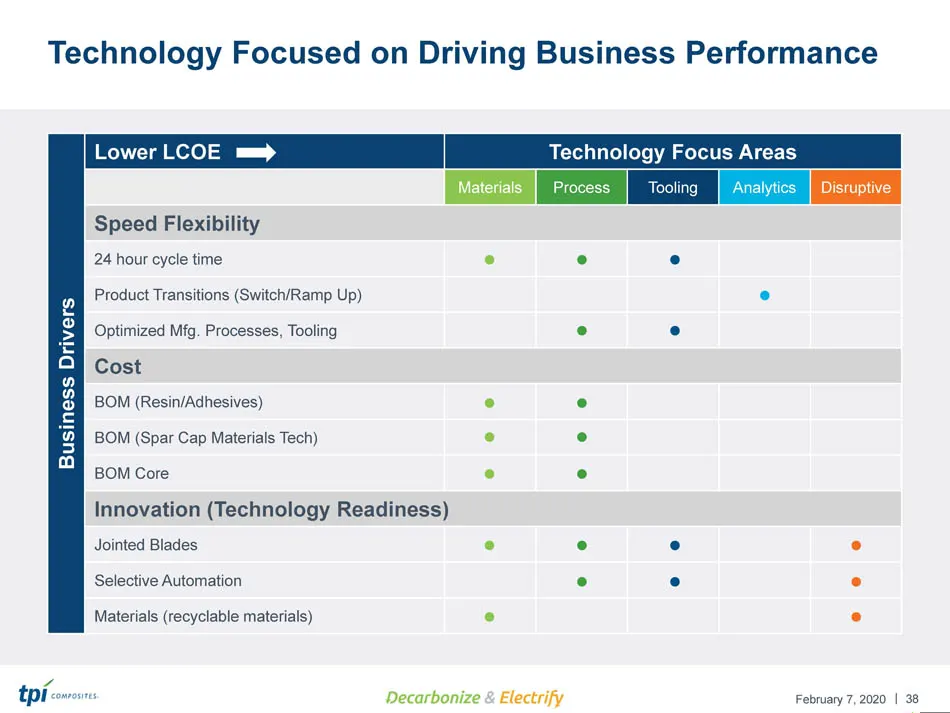
| February 7, 2020 38 Technology Focused on Driving Business Performance Business Drivers Lower LCOE Technology Focus Areas Materials Process Tooling Analytics Disruptive Speed Flexibility 24 hour cycle time Product Transitions (Switch/Ramp Up) Optimized Mfg. Processes, Tooling Cost BOM (Resin/Adhes
Slide 39: Technology Advantage
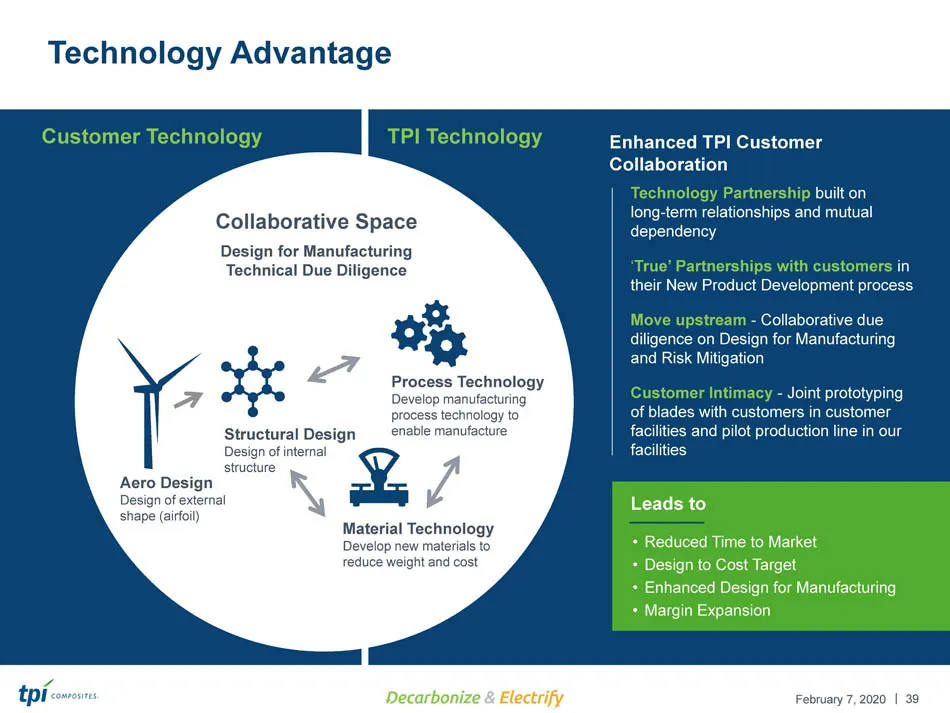
| February 7, 2020 39 Technology Advantage TPI Technology Customer Technology Collaborative Space Design for Manufacturing Technical Due Diligence Aero Design Design of external shape (airfoil) Structural Design Design of internal structure Material Technology Develop new materials to reduce weight
Slide 40: TPI Enabling Technologies
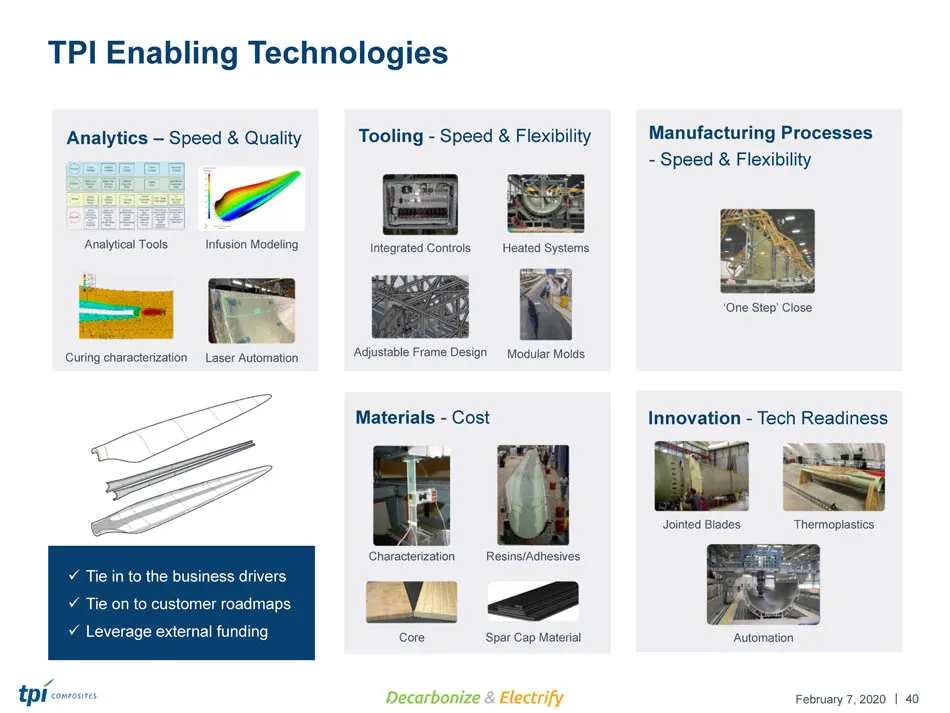
| February 7, 2020 40 TPI Enabling Technologies Innovation - Tech Readiness Jointed Blades Thermoplastics Automation x Tie in to the business drivers x Tie on to customer roadmaps x Leverage external funding Manufacturing Processes - Speed & Flexibility ‘One Step’ Close Analytics – Speed & Quality A
Slide 41: Global Supply Chain
| February 7, 2020 February 2020 Global Supply Chain
Slide 42: Global Supply Chain Expertise
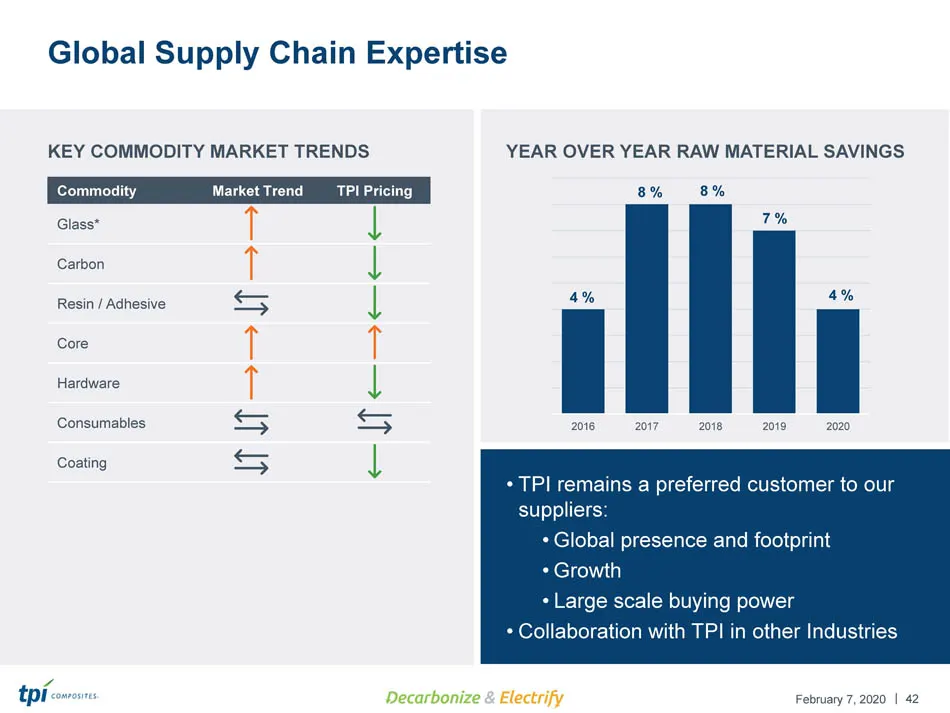
| February 7, 2020 2016 2017 2018 2019 2020 42 Global Supply Chain Expertise KEY COMMODITY MARKET TRENDS Commodity Market Trend TPI Pricing Glass* Carbon Resin / Adhesive Core Hardware Consumables Coating 4 % 8 % 8 % 4 % 7 % YEAR OVER YEAR RAW MATERIAL SAVINGS • TPI remains a preferred customer to o
Slide 43: Global Supply Chain and Localization Strategy
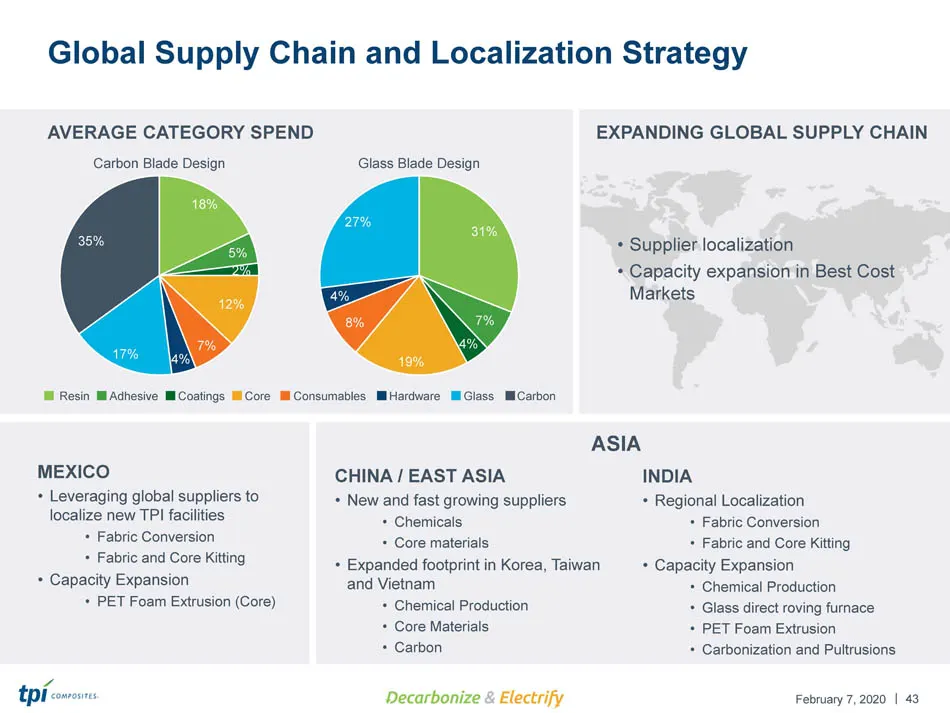
| February 7, 2020 43 Global Supply Chain and Localization Strategy AVERAGE CATEGORY SPEND Carbon Blade Design 18% 5% 2% 12% 7% 4% 17% 35% 31% 7% 4% 19% 8% 4% 27% Glass Blade Design Resin Adhesive Coatings Core Consumables Hardware Glass Carbon EXPANDING GLOBAL SUPPLY CHAIN • Supplier localization •

Slide 44: Global Talent
| February 7, 2020 February 2020 Global Talent
Slide 45: Adding Significant Global Talent
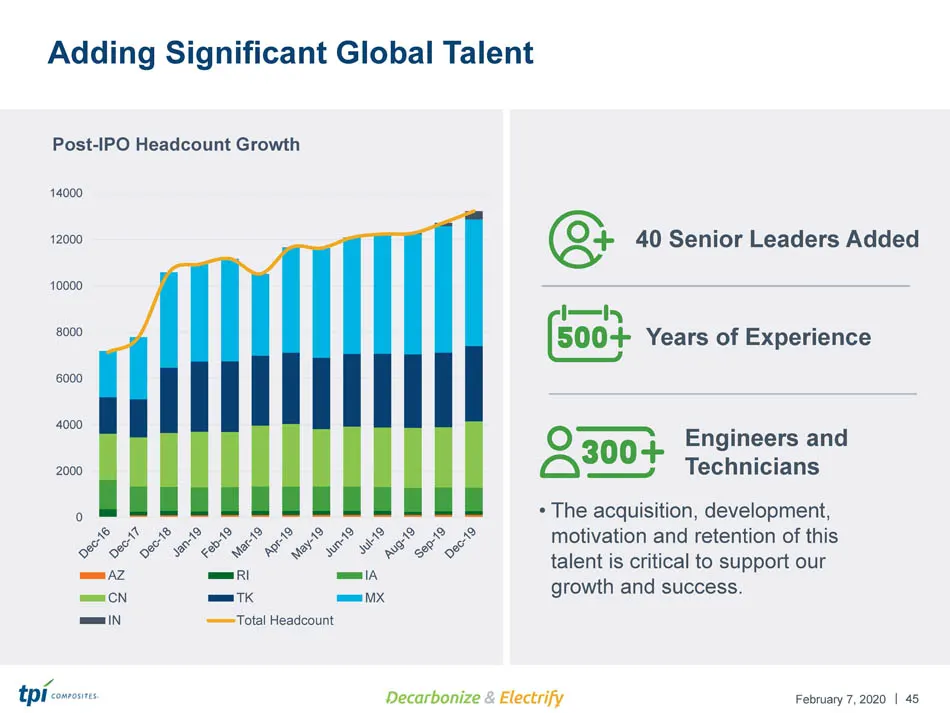
| February 7, 2020 45 Adding Significant Global Talent • The acquisition, development, motivation and retention of this talent is critical to support our growth and success. 40 Senior Leaders Added Years of Experience 0 2000 4000 6000 8000 10000 12000 14000 Post - IPO Headcount Growth AZ RI IA CN TK
Slide 46: Improving Technical Capabilities Across the Organization
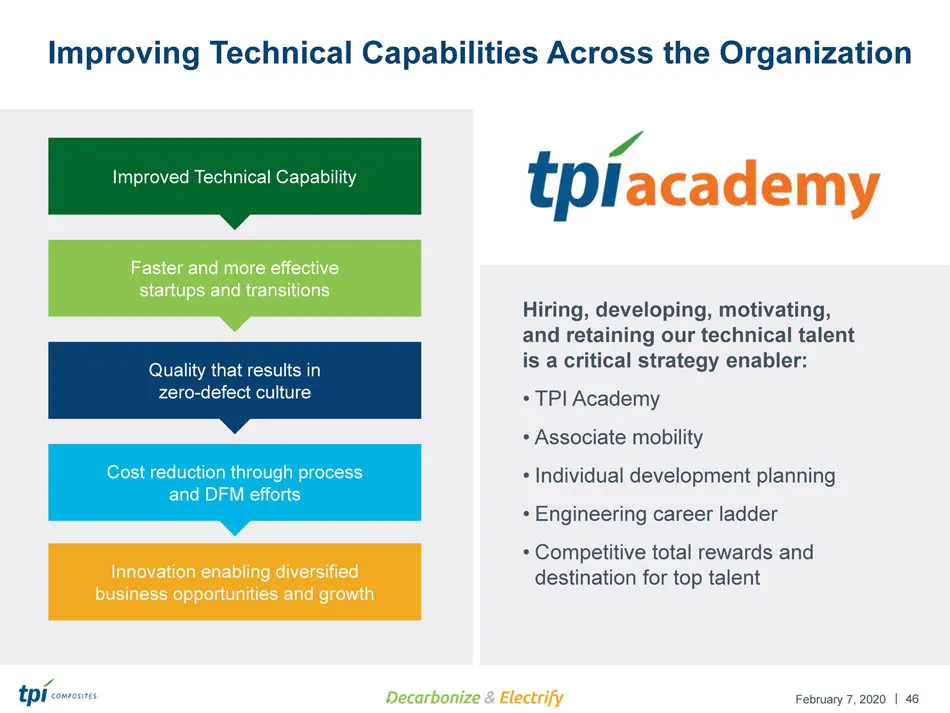
| February 7, 2020 46 Improving Technical Capabilities Across the Organization Hiring, developing, motivating, and retaining our technical talent is a critical strategy enabler: • TPI Academy • Associate mobility • Individual development planning • Engineering career ladder • Competitive total rewar
Slide 47: Global HR Strategy Builds the Foundation for Our People Strategy
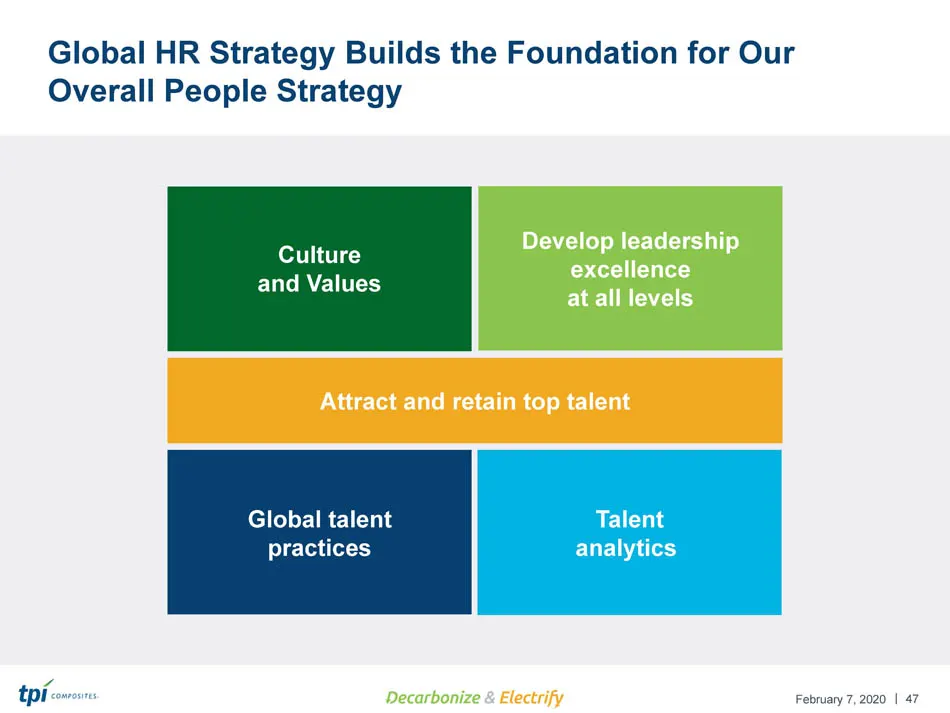
| February 7, 2020 47 Global HR Strategy Builds the Foundation for Our Overall People Strategy Culture and Values Develop leadership excellence at all levels Attract and retain top talent Global talent practices Talent analytics
Slide 48: Diversity and Inclusion Matters
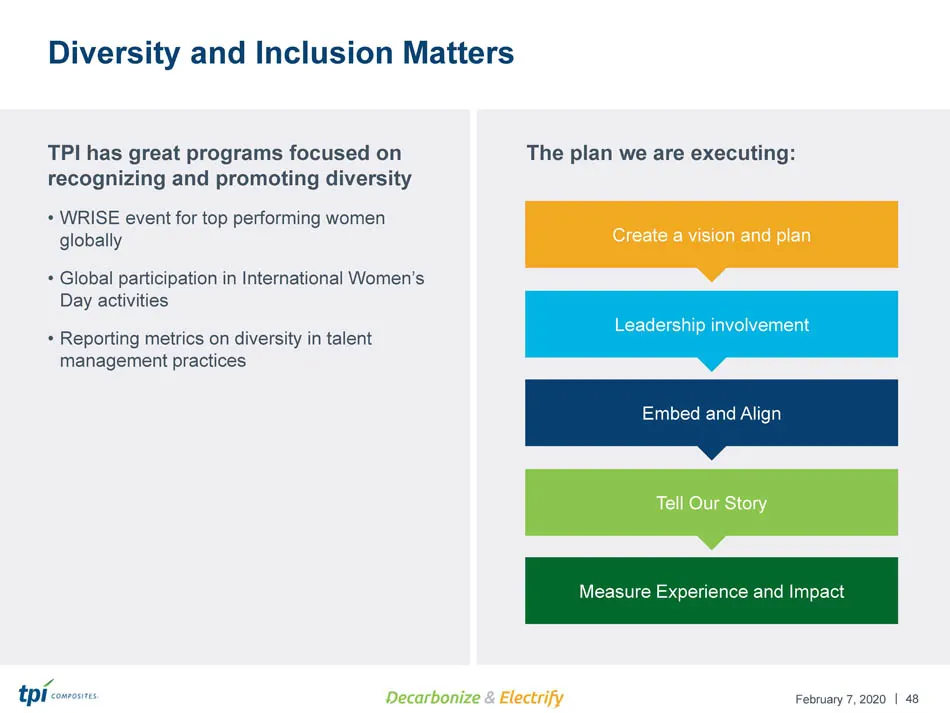
| February 7, 2020 48 Diversity and Inclusion Matters Create a vision and plan Leadership involvement Embed and Align Tell Our Story Measure Experience and Impact TPI has great programs focused on recognizing and promoting diversity • WRISE event for top performing women globally • Global participat

Slide 49: Q&A
| February 7, 2020 February 2020 Q&A
Slide 50: Coffee Break
| February 7, 2020 February 2020 Coffee Break
Slide 51: Global Service
| February 7, 2020 February 2020 Global Service
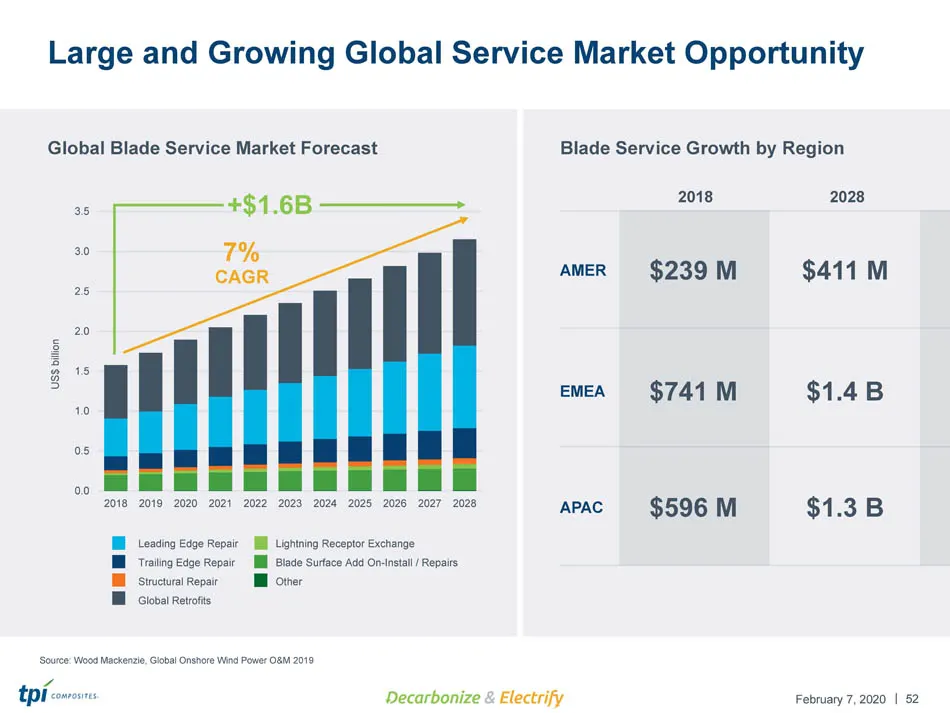
Slide 52: Large and Growing Global Service Market Opportunity
| February 7, 2020 52 Large and Growing Global Service Market Opportunity Global Blade Service Market Forecast Source: Wood Mackenzie, Global Onshore Wind Power O&M 2019 0.0 0.5 1.0 1.5 2.0 2.5 3.0 3.5 2018 2019 2020 2021 2022 2023 2024 2025 2026 2027 2028 US$ billion Blade Service Growth by Region
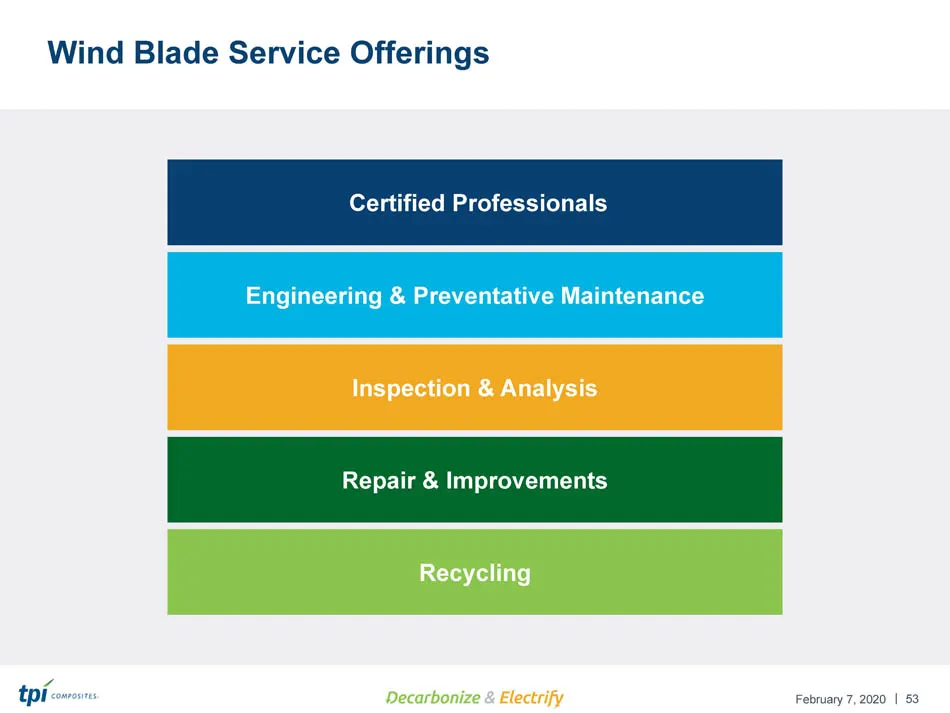
Slide 53: Wind Blade Service Offerings
| February 7, 2020 53 Wind Blade Service Offerings Engineering & Preventative Maintenance Certified Professionals Repair & Improvements Recycling Inspection & Analysis
Slide 54: Diversified Markets
| February 7, 2020 Diversified Markets February 2020
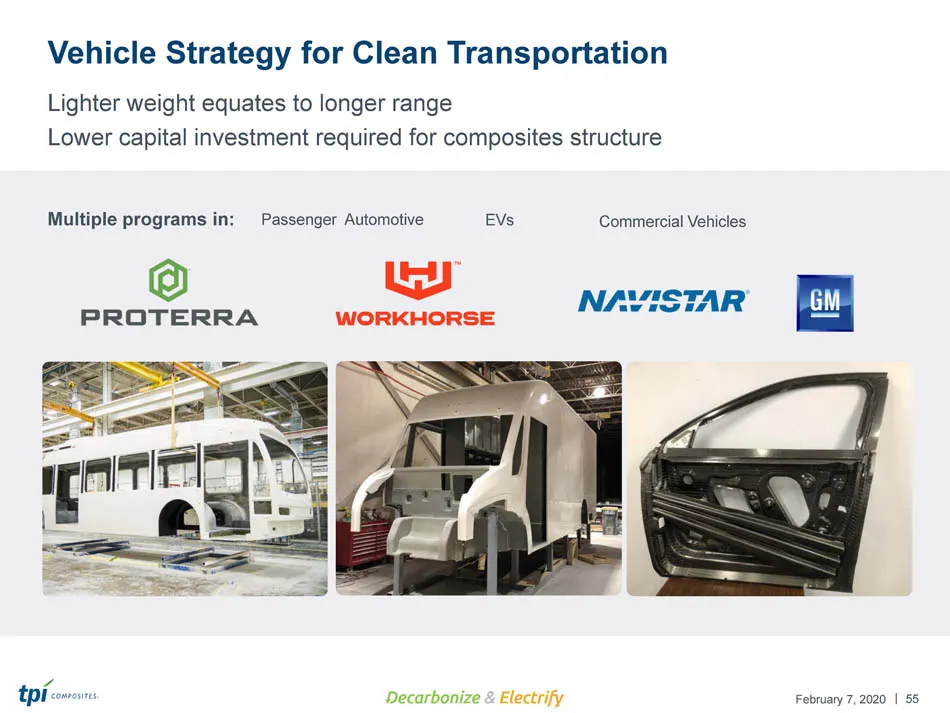
Slide 55: Vehicle Strategy for Clean Transportation
| February 7, 2020 Vehicle Strategy for Clean Transportation 55 Multiple programs in: Passenger Automotive EVs Commercial Vehicles Lighter weight equates to longer range Lower capital investment required for composites structure
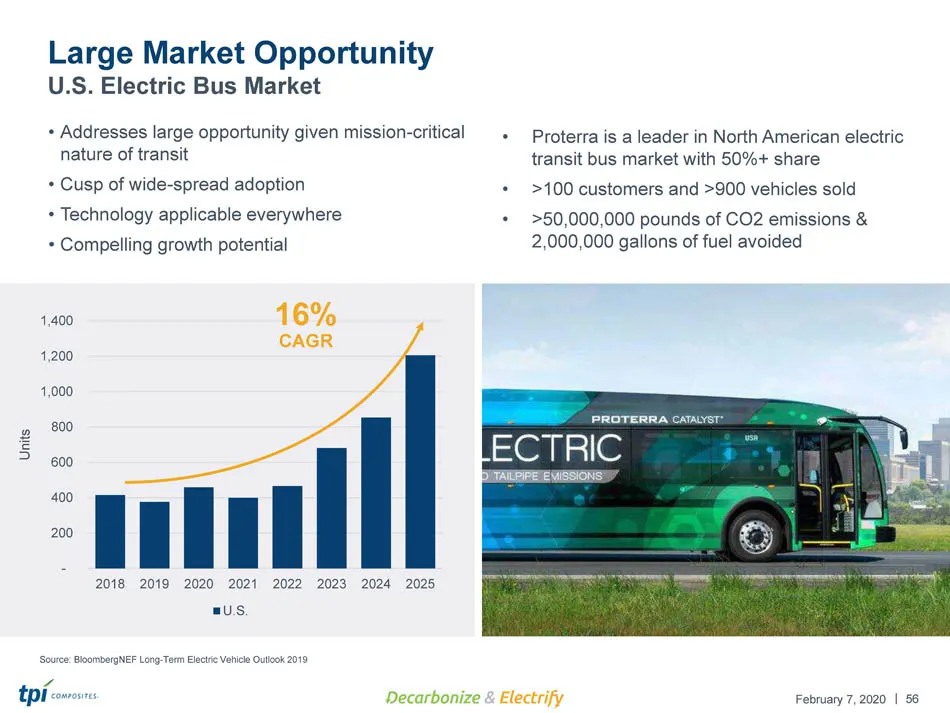
Slide 56: Large Market Opportunity: U.S. Electric Bus Market
| February 7, 2020 Large Market Opportunity U.S. Electric Bus Market Source: BloombergNEF Long - Term Electric Vehicle Outlook 2019 56 • Addresses large opportunity given mission - critical nature of transit • Cusp of wide - spread adoption • Technology applicable everywhere • Compelling growth pote
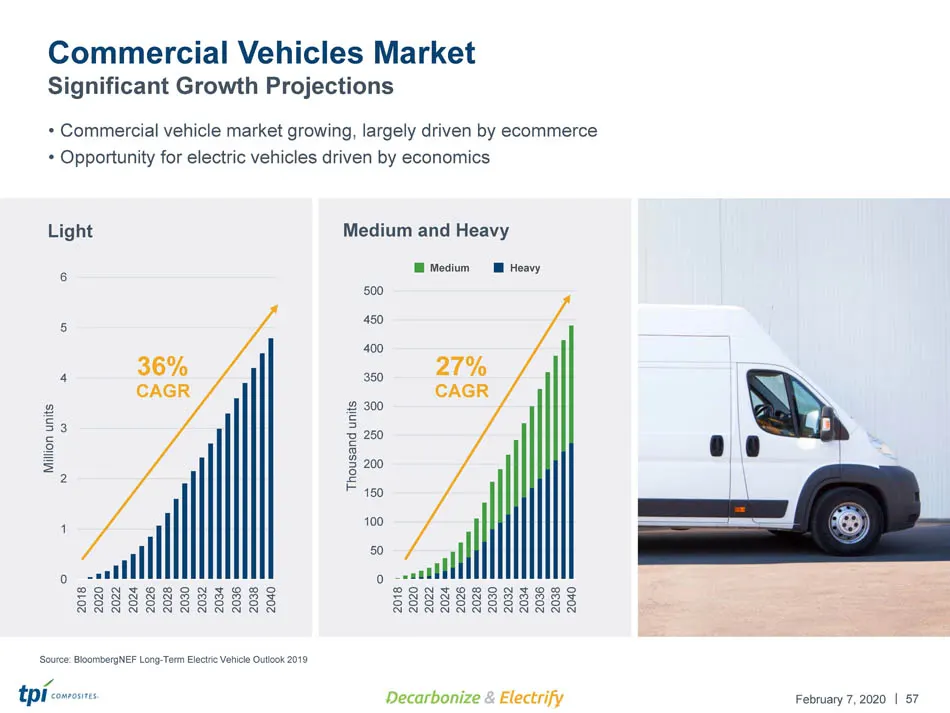
Slide 57: Commercial Vehicles Market Significant Growth Projections
| February 7, 2020 Commercial Vehicles Market Significant Growth Projections 57 Light 0 1 2 3 4 5 6 2018 2020 2022 2024 2026 2028 2030 2032 2034 2036 2038 2040 Million units Medium and Heavy 0 50 100 150 200 250 300 350 400 450 500 2018 2020 2022 2024 2026 2028 2030 2032 2034 2036 2038 2040 Thousand
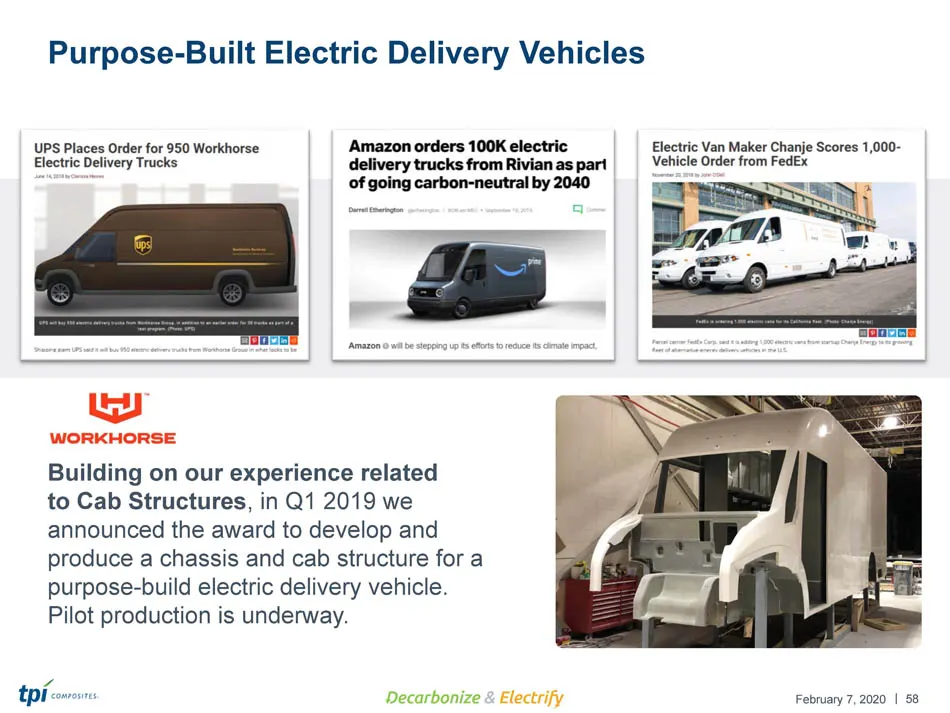
Slide 58: Purpose-Built Electric Delivery Vehicles
| February 7, 2020 Building on our experience related to Cab Structures , in Q1 2019 we announced the award to develop and produce a chassis and cab structure for a purpose - build electric delivery vehicle. Pilot production is underway. Purpose - Built Electric Delivery Vehicles 58
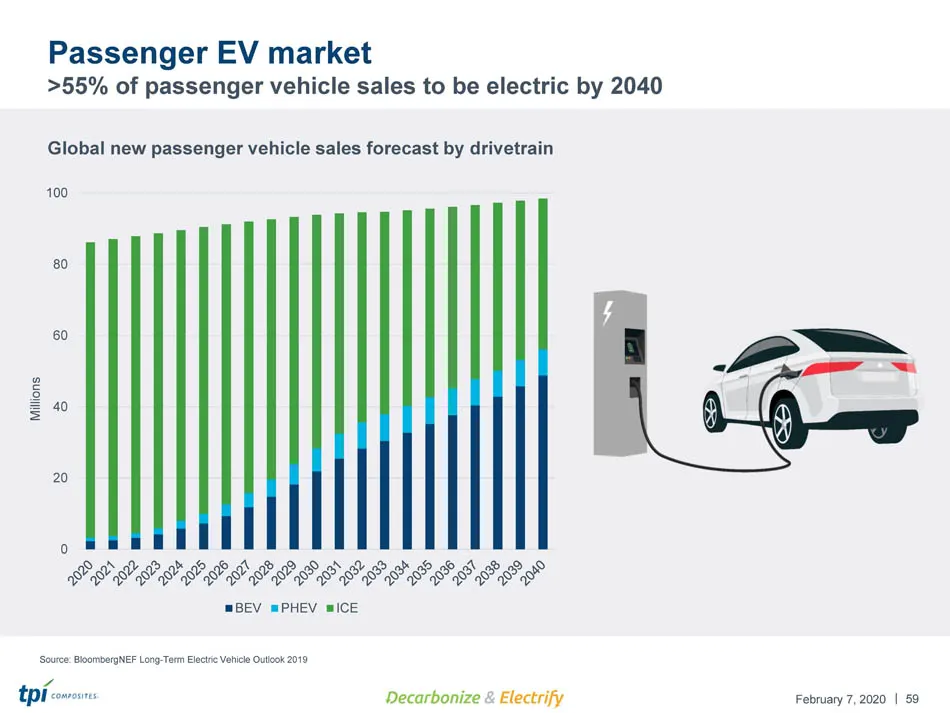
Slide 59: Passenger EV market
| February 7, 2020 Passenger EV market >55% of passenger vehicle sales to be electric by 2040 59 0 20 40 60 80 100 Millions BEV PHEV ICE Global new passenger vehicle sales forecast by drivetrain Source: BloombergNEF Long - Term Electric Vehicle Outlook 2019
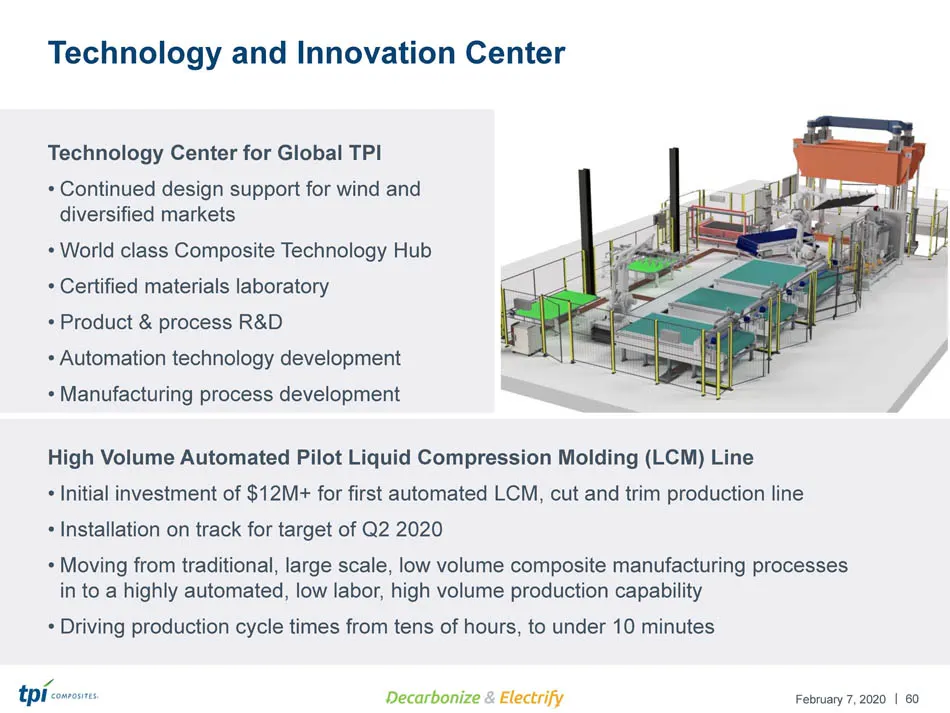
Slide 60: Technology and Innovation Center
| February 7, 2020 60 Technology and Innovation Center Technology Center for Global TPI • Continued design support for wind and diversified markets • World class Composite Technology Hub • Certified materials laboratory • Product & process R&D • Automation technology development • Manufacturing p
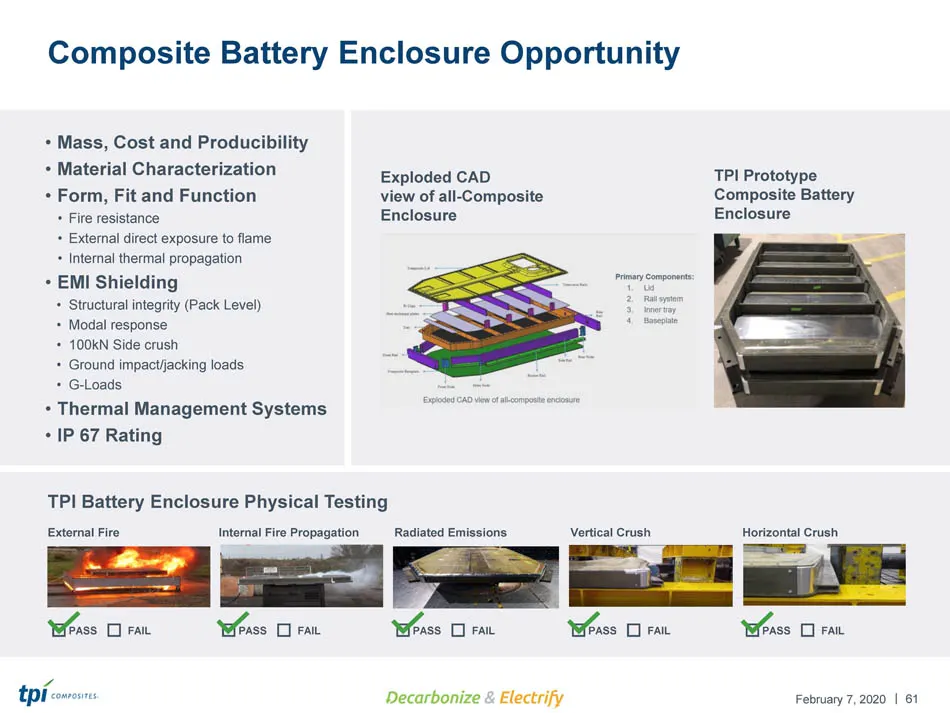
Slide 61: Composite Battery Enclosure Opportunity
| February 7, 2020 • Mass, Cost and Producibility • Material Characterization • Form, Fit and Function • Fire resistance • External direct exposure to flame • Internal thermal propagation • EMI Shielding • Structural integrity (Pack Level) • Modal response • 100kN Side crush • Ground impact/jacking
Slide 62: Financials
| February 7, 2020 February 2020 Financials
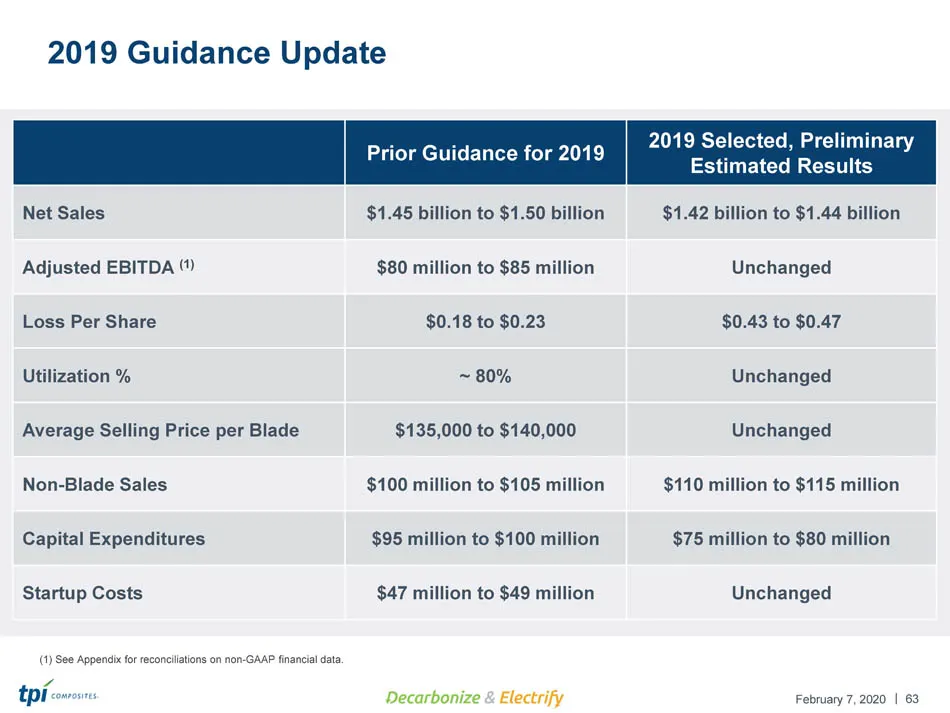
Slide 63: 2019 Guidance Update
| February 7, 2020 63 2019 Guidance Update Prior Guidance for 2019 2019 Selected, Preliminary Estimated Results Net Sales $1.45 billion to $1.50 billion $1.42 billion to $1.44 billion Adjusted EBITDA (1) $80 million to $85 million Unchanged Loss Per Share $0.18 to $0.23 $0.43 to $0.47 Utilization %
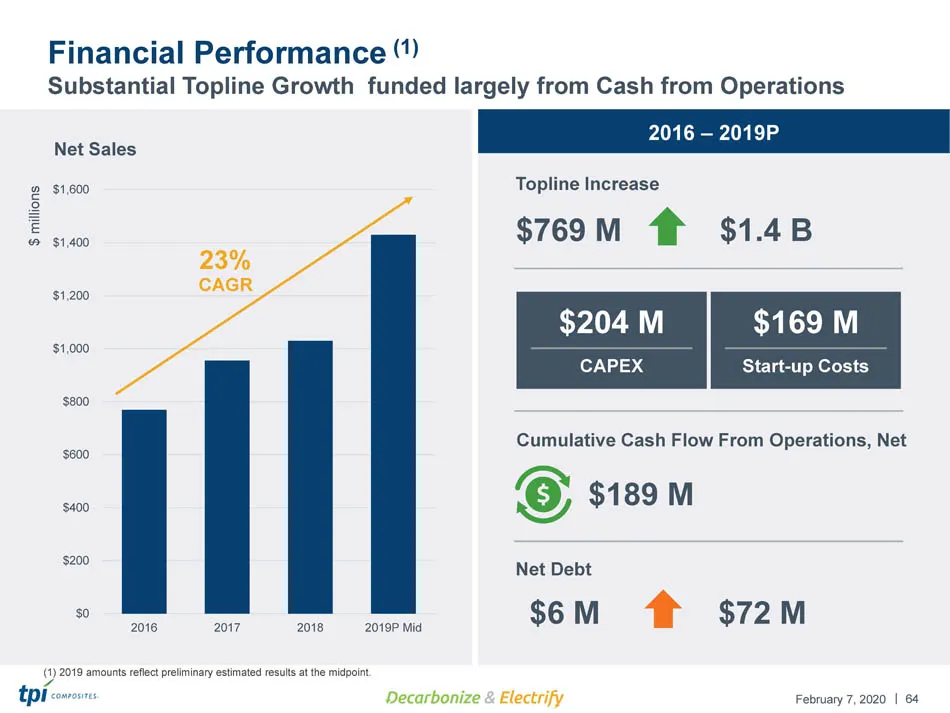
Slide 64: Net Sales and Financial Performance
| February 7, 2020 64 Net Sales $0 $200 $400 $600 $800 $1,000 $1,200 $1,400 $1,600 2016 2017 2018 2019P Mid Topline Increase Cumulative Cash Flow From Operations, Net Net Debt $769 M $1.4 B $204 M CAPEX $169 M Start - up Costs $6 M $72 M $189 M 23% CAGR 2016 – 2019P Financial Performance (1) Substan
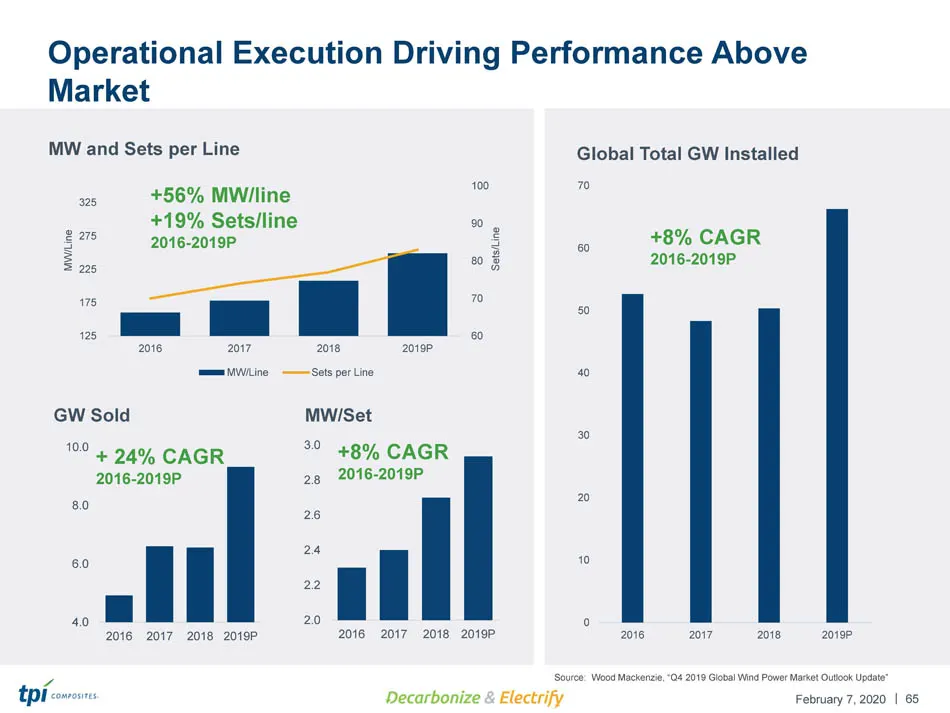
Slide 65: Operational Execution Driving Performance Above Market
| February 7, 2020 60 70 80 90 100 125 175 225 275 325 2016 2017 2018 2019P Sets/Line MW/Line MW/Line Sets per Line Operational Execution Driving Performance Above Market 65 MW and Sets per Line + 56% MW/line +19% Sets/line 2016 - 2019P 4.0 6.0 8.0 10.0 2016 2017 2018 2019P GW Sold + 24% CAGR 2016 -
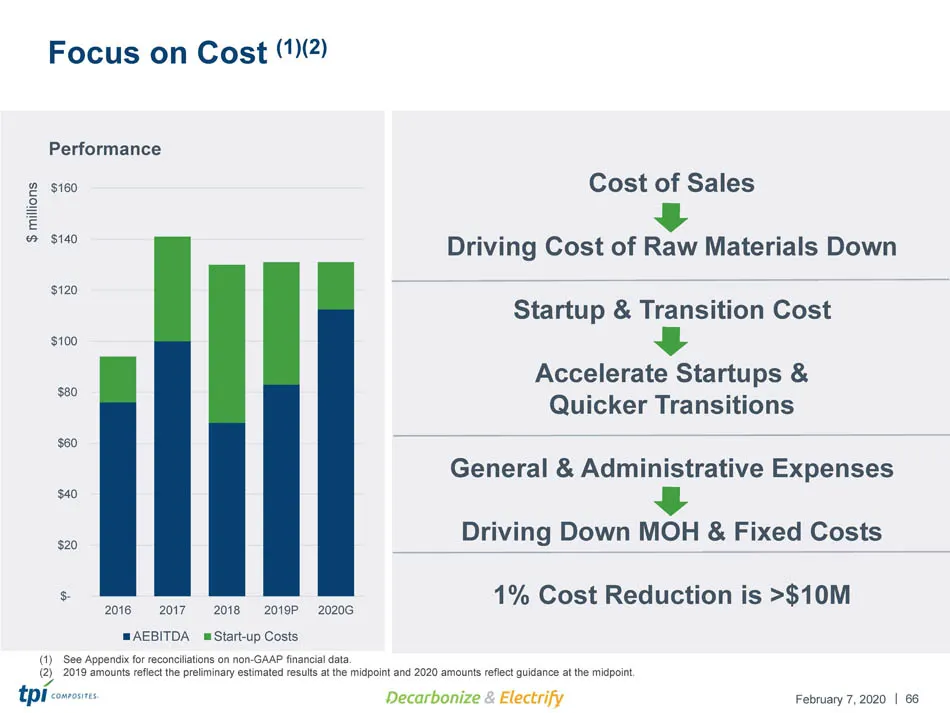
Slide 66: Focus on Cost
| February 7, 2020 66 Focus on Cost (1)(2) $- $20 $40 $60 $80 $100 $120 $140 $160 2016 2017 2018 2019P 2020G AEBITDA Start-up Costs Cost of Sales Driving Cost of Raw Materials Down Startup & Transition Cost Accelerate Startups & Quicker Transitions General & Administrative Expenses Driving Down MOH
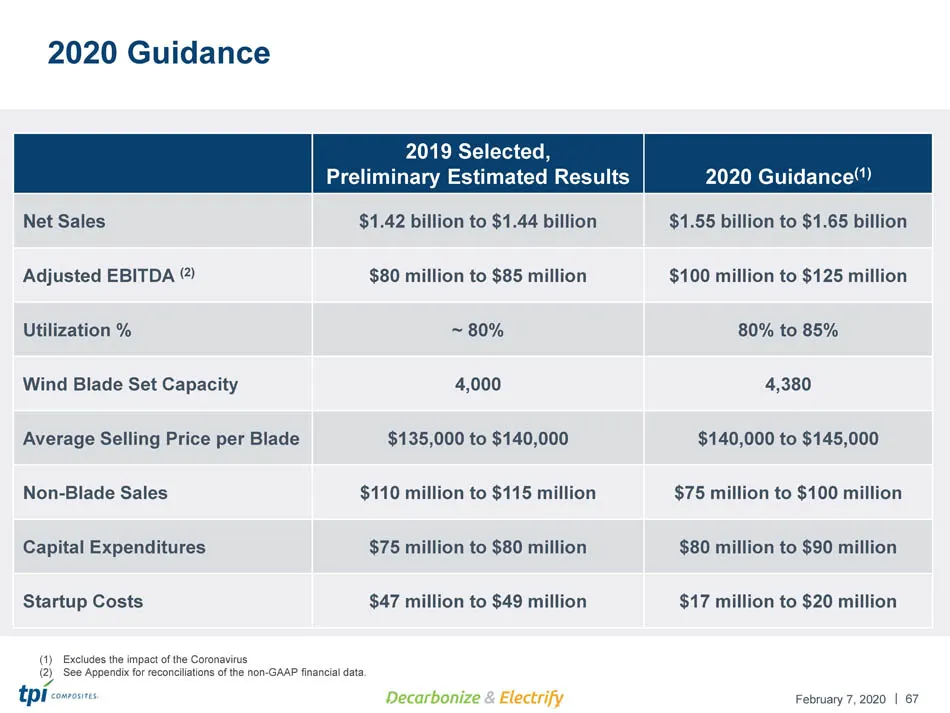
Slide 67: 2020 Guidance
| February 7, 2020 67 2020 Guidance (1) Excludes the impact of the Coronavirus (2) See Appendix for reconciliations of the non - GAAP financial data. 2019 Selected, Preliminary Estimated Results 2020 Guidance (1) Net Sales $1.42 billion to $1.44 billion $1.55 billion to $1.65 billion Adjusted EBITDA
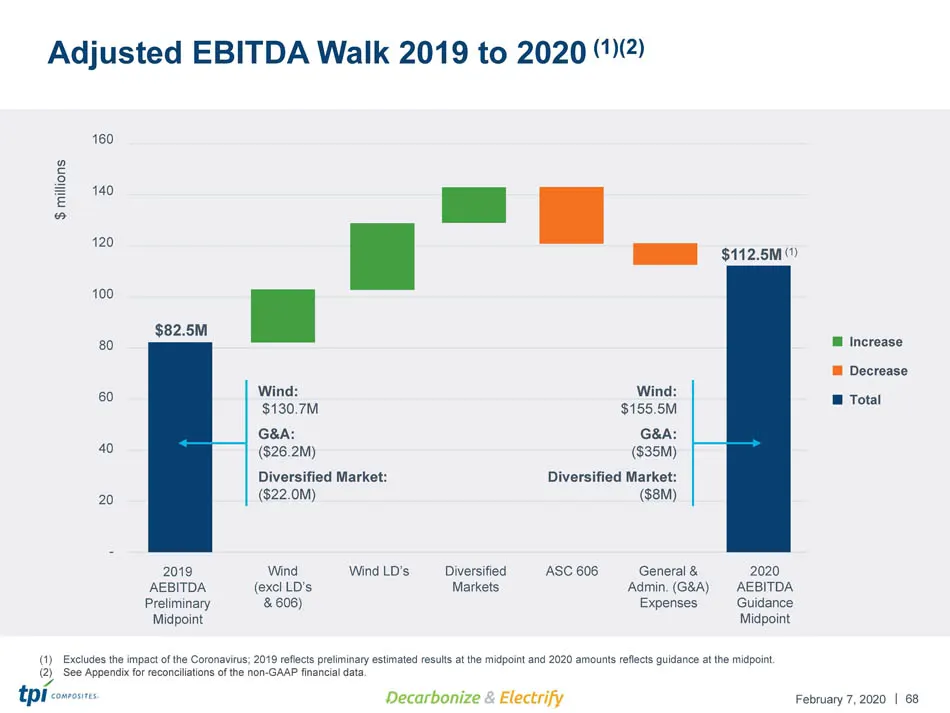
Slide 68: Adjusted EBITDA Walk 2019 to 2020
| February 7, 2020 68 Adjusted EBITDA Walk 2019 to 2020 (1)(2) 2019 AEBITDA Preliminary Midpoint Wind (excl LD’s & 606) Wind LD’s Diversified Markets ASC 606 General & Admin. (G&A) Expenses 2020 AEBITDA Guidance Midpoint Increase Decrease Total 160 140 120 100 80 60 40 20 - $ millions Wind: $130.7M
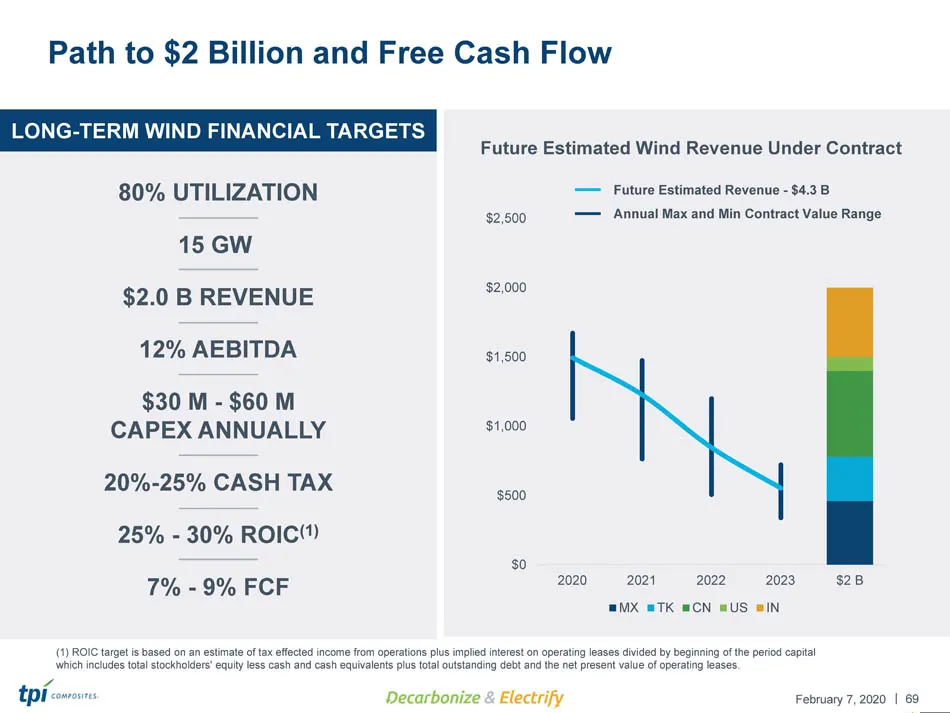
Slide 69: Path to $2 Billion and Free Cash Flow
| February 7, 2020 $0 $500 $1,000 $1,500 $2,000 $2,500 2020 2021 2022 2023 $2 B MX TK CN US IN 69 Path to $2 Billion and Free Cash Flow (1) ROIC target is based on an estimate of tax effected income from operations plus implied interest on operating leases divi ded by beginning of the period capital
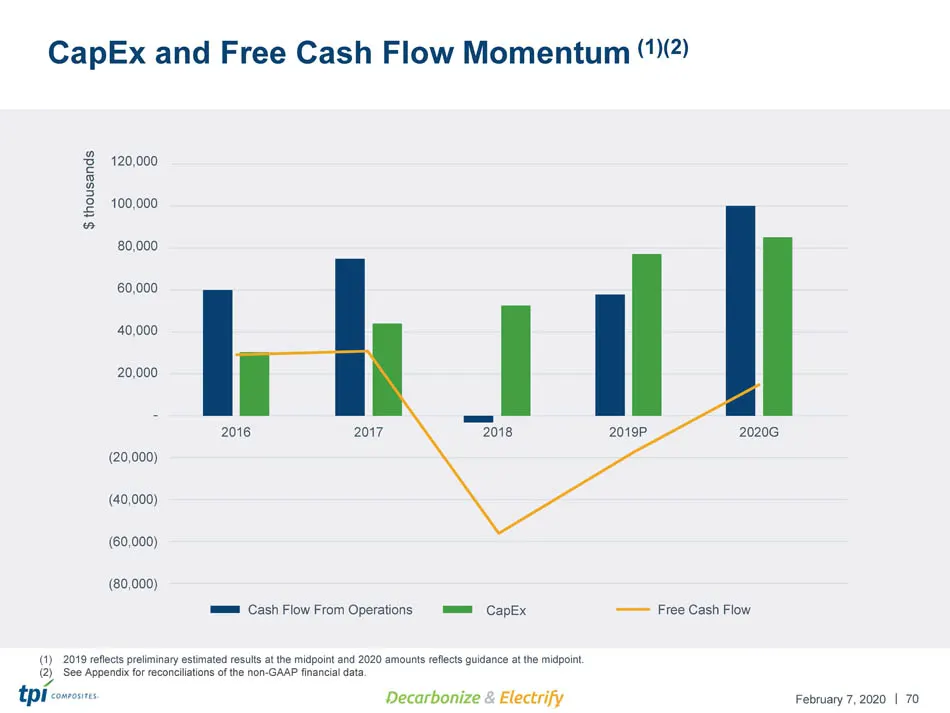
Slide 70: CapEx and Free Cash Flow Momentum
| February 7, 2020 70 CapEx and Free Cash Flow Momentum (1)(2) 120,000 100,000 80,000 60,000 40,000 20,000 - (20,000) (40,000) (60,000) (80,000) 2016 2017 2018 2019P 2020G Cash Flow From Operations CapEx Free Cash Flow $ thousands (1) 2019 reflects preliminary estimated results at the midpoint and 2
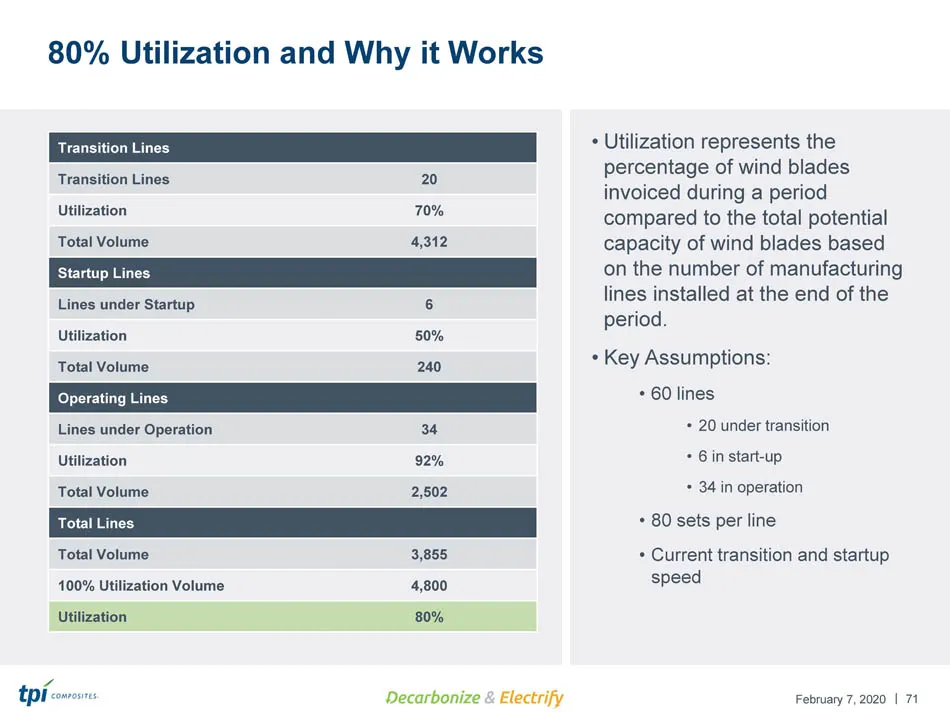
Slide 71: 80% Utilization and Why it Works
| February 7, 2020 71 80% Utilization and Why it Works • Utilization represents the percentage of wind blades invoiced during a period compared to the total potential capacity of wind blades based on the number of manufacturing lines installed at the end of the period. • Key Assumptions: • 60 lines
Slide 72: ESG
| February 7, 2020 February 2020 ESG
Slide 73: Benefits of TPI's ESG Efforts
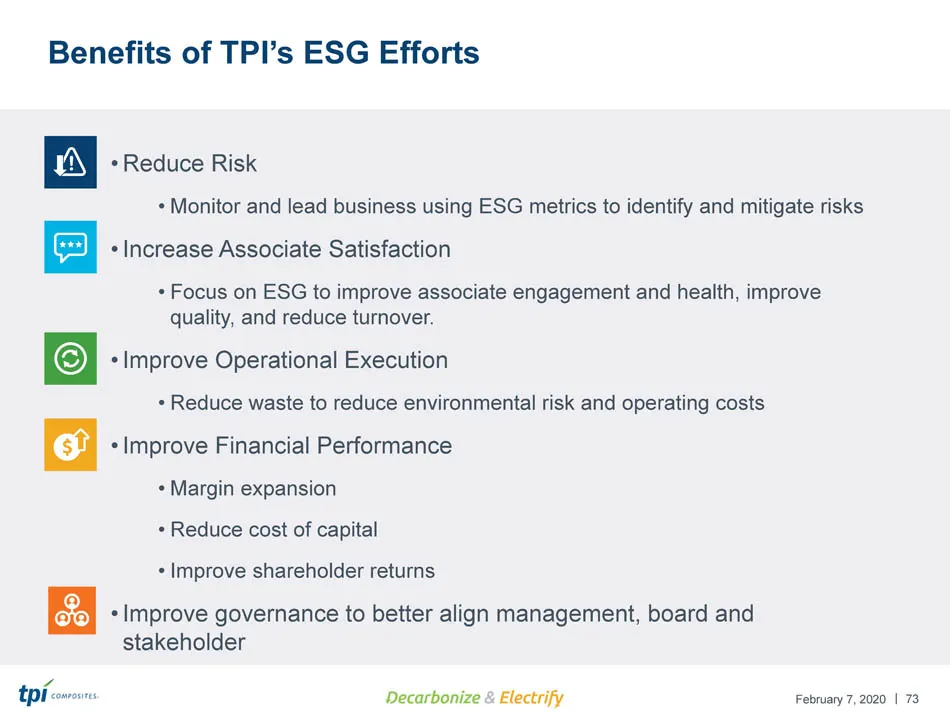
| February 7, 2020 73 Benefits of TPI’s ESG Efforts • Reduce Risk • Monitor and lead business using ESG metrics to identify and mitigate risks • Increase Associate Satisfaction • Focus on ESG to improve associate engagement and health, improve quality, and reduce turnover. • Improve Operational Exec
Slide 74: ESG Status Update
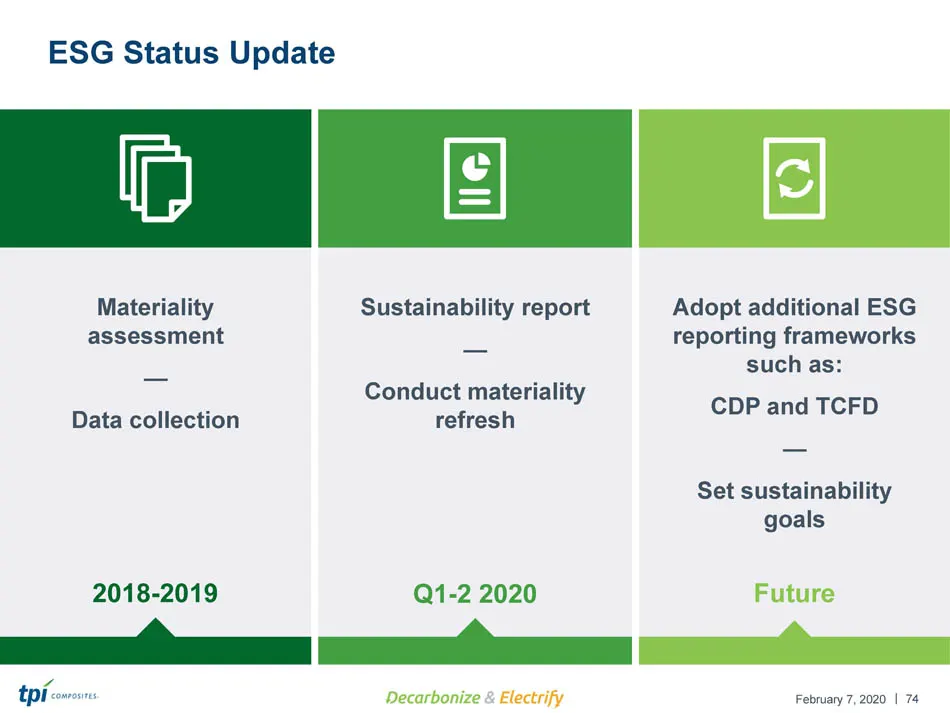
| February 7, 2020 74 ESG Status Update Materiality assessment — Data collection Sustainability report — Conduct materiality refresh Adopt additional ESG reporting frameworks such as: CDP and TCFD — Set sustainability goals 2018 - 2019 Future Q1 - 2 2020
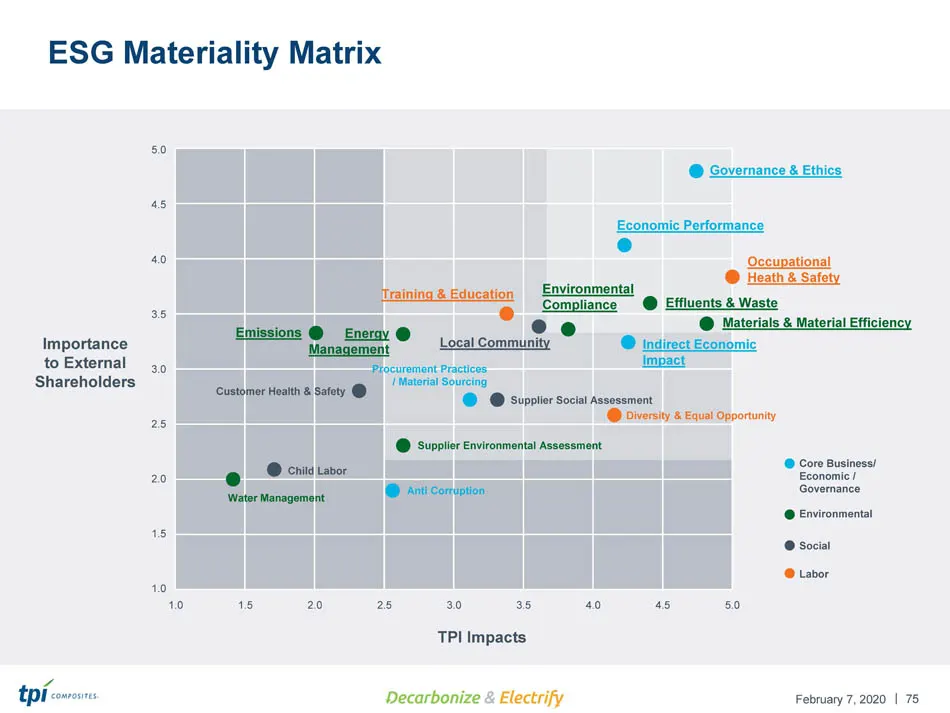
Slide 75: ESG Materiality Matrix
| February 7, 2020 75 ESG Materiality Matrix 5.0 4.5 4.0 3.5 3.0 2.5 2.0 1.5 1.0 Importance to External Shareholders TPI Impacts 1.5 2.0 2.5 3.0 3.5 4.0 4.5 5.0 Core Business/ Economic / Governance Environmental Labor Social Anti Corruption Procurement Practices / Material Sourcing Water Management
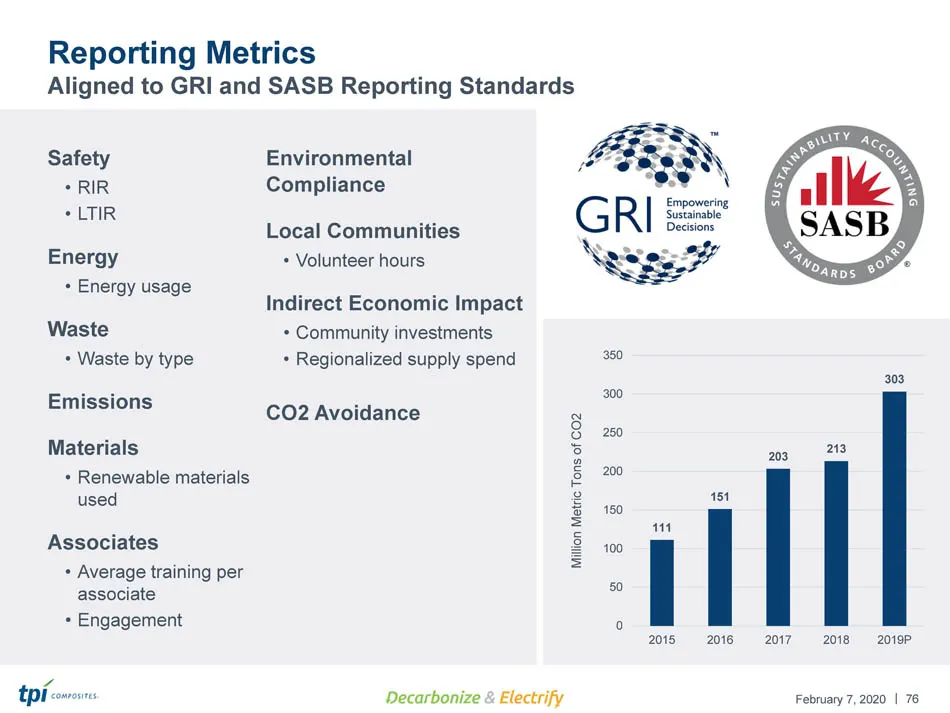
Slide 76: Reporting Metrics Aligned to GRI and SASB Reporting Standards
| February 7, 2020 76 Reporting Metrics Aligned to GRI and SASB Reporting Standards Environmental Compliance Local Communities • Volunteer hours Indirect Economic Impact • Community investments • Regionalized supply spend CO2 Avoidance Safety • RIR • LTIR Energy • Energy usage Waste • Waste by type

Slide 77: Closing Remarks
| February 7, 2020 February 2020 Closing Remarks
Slide 78: Summary Comments
| February 7, 2020 78 Summary Comments Wind energy and EV’s offer tremendous opportunity for TPI’s diversified, profitable, global growth. Wind growth is mostly about economics, customers, investors and the need to positively impact climate change. Wind costs will continue to be driven down to compe
Slide 79: Summary Comments
| February 7, 2020 79 We are bringing relentless focus to manufacturing execution, productivity gains, cost reduction and risk mitigation. We plan to turn speed into a source of competitive advantage – cut transition and startup time in half, reduce cost of transitions and share those costs with our
Slide 80: Summary Comments
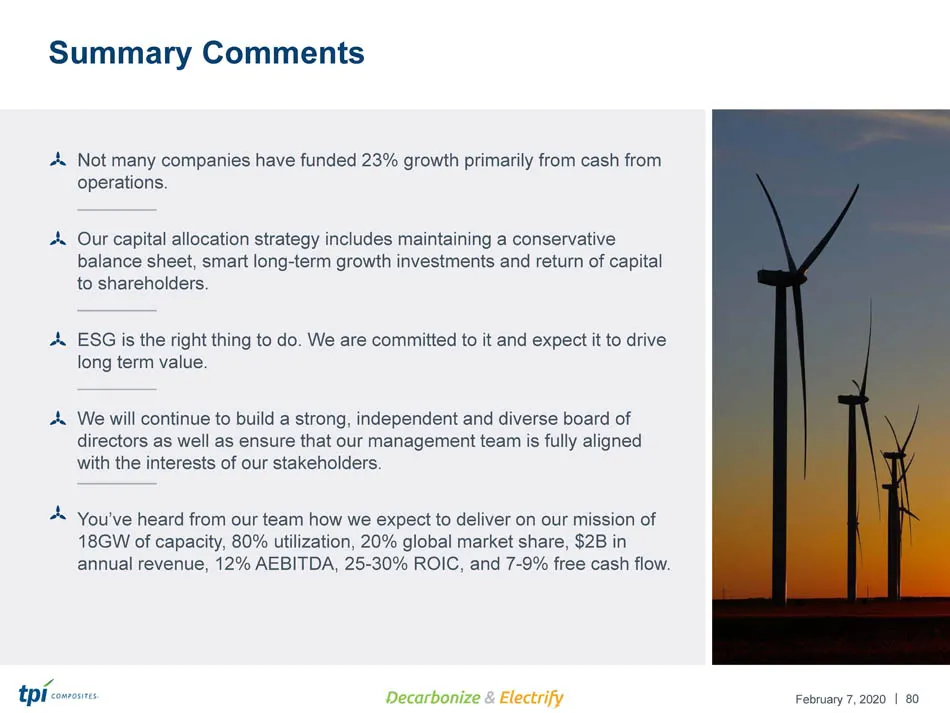
| February 7, 2020 80 Summary Comments Not many companies have funded 23% growth primarily from cash from operations. Our capital allocation strategy includes maintaining a conservative balance sheet, smart long - term growth investments and return of capital to shareholders. ESG is the right thing
Slide 81: Q&A / Lunch
| February 7, 2020 February 2020 Q&A / Lunch
Slide 82: Appendix – Non-GAAP Information
| February 7, 2020 February 2020 Appendix – Non - GAAP Information 82 This presentation includes unaudited non - GAAP financial measures including EBITDA, adjusted EBITDA, net cash (debt) and free cash flow. We define EBITDA as net income (loss) plus interest expense (including losses on the extingu
Slide 83: Non-GAAP Reconciliations (unaudited)
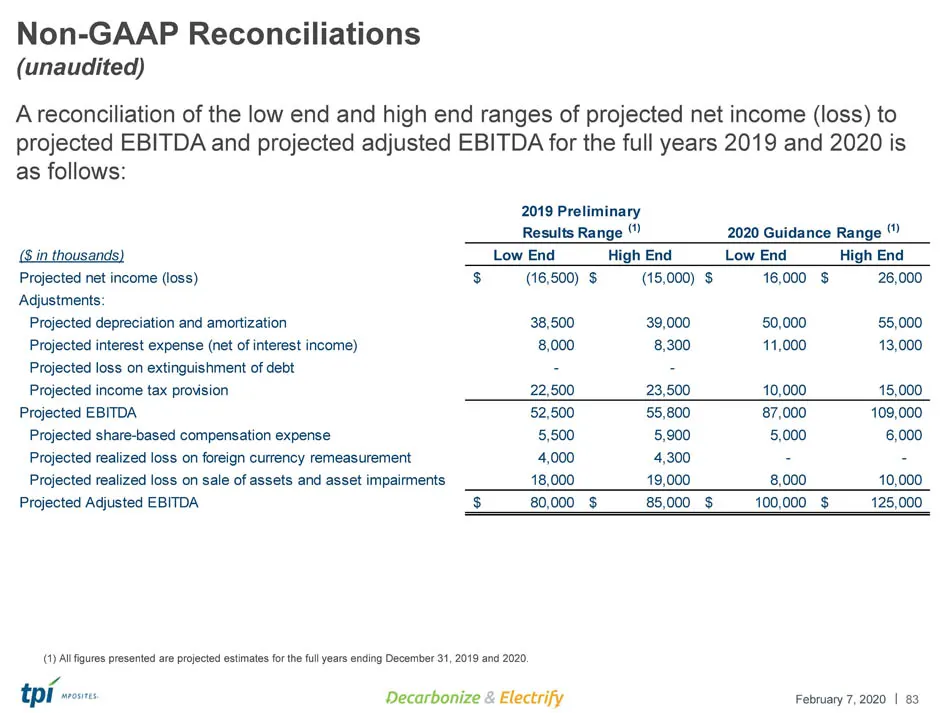
| February 7, 2020 Non - GAAP Reconciliations (unaudited) A reconciliation of the low end and high end ranges of projected net income (loss) to projected EBITDA and projected adjusted EBITDA for the full years 2019 and 2020 is as follows: 83 (1) All figures presented are projected estimates for the
Slide 84: Non-GAAP Reconciliations (continued)
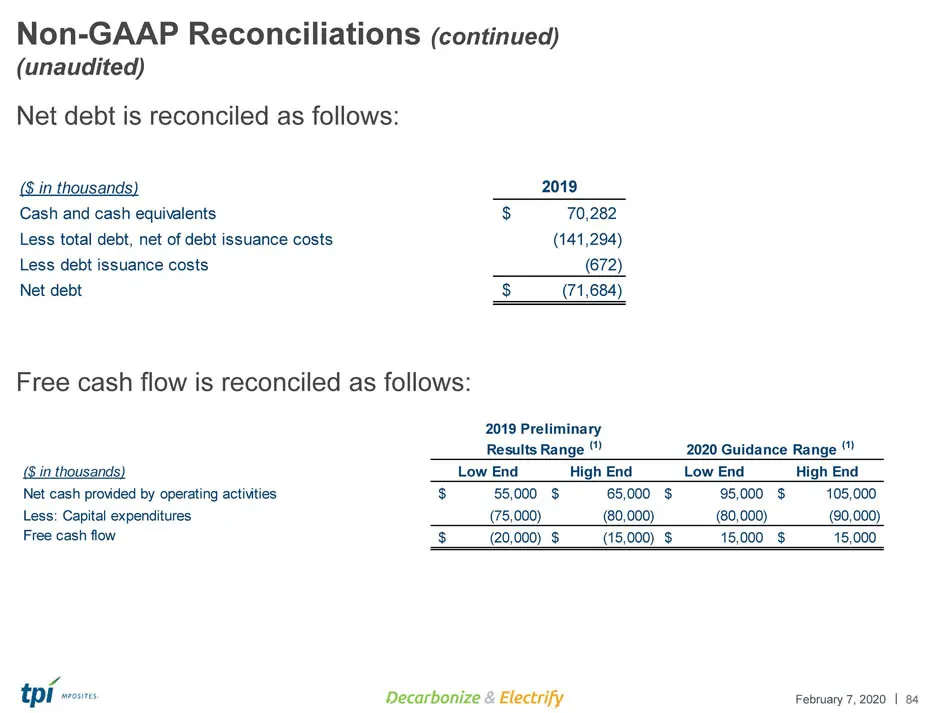
| February 7, 2020 Non - GAAP Reconciliations (continued) (unaudited) Net debt is reconciled as follows: Free cash flow is reconciled as follows: 84 ($ in thousands) 2019 Cash and cash equivalents 70,282$ Less total debt, net of debt issuance costs (141,294) Less debt issuance costs (672) Net debt (
Source: SEC EDGAR · 8-K filed Feb 7, 2020
More decks from TPI Composites Inc
 Q1 2025 Earnings Presentation18 slides · May 12, 2025
 Q4 2024 Earnings Presentation16 slides · Feb 20, 2025
 Q3 2024 Earnings Presentation16 slides · Nov 7, 2024
 Q2 2024 Earnings Presentation16 slides · Aug 8, 2024
 Q1 2024 Earnings Presentation18 slides · May 2, 2024
 Q4 2023 Earnings Presentation16 slides · Feb 22, 2024