Air Transport Services Group Inc
Air Transport Services — BB&T Capital Markets Transportation Services Conference 2012
15 slides from Air Transport Services's conference presentation, Feb 15, 2012
Slide 1: BB&T Capital Markets Transportation Services Conference
BB&T Capital Markets Transportation Services Conference February 16, 2012 Joe Hete, President & CEO Quint Turner, CFO AISG Air Transport Services Group, Inc.
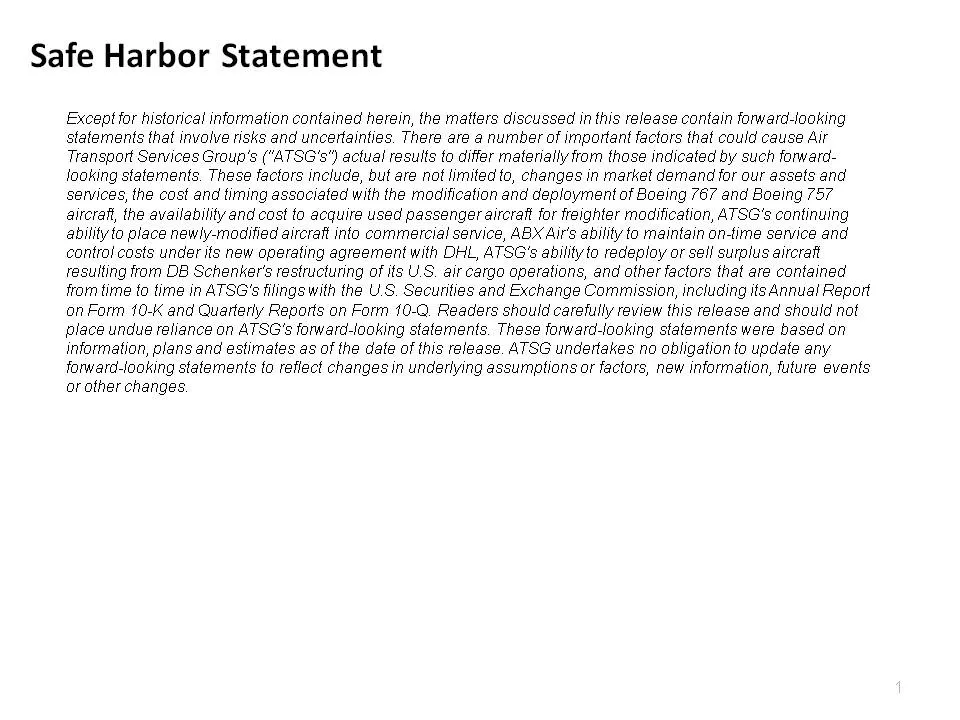
Slide 2: Safe Harbor Statement
Safe Harbor Statement Except for historical information contained herein, the matters discussed in this release contain forward-looking statements that involve risks and uncertainties. There are a number of important factors that could cause Air Transport Services Group's ("ATSG's") actual results t
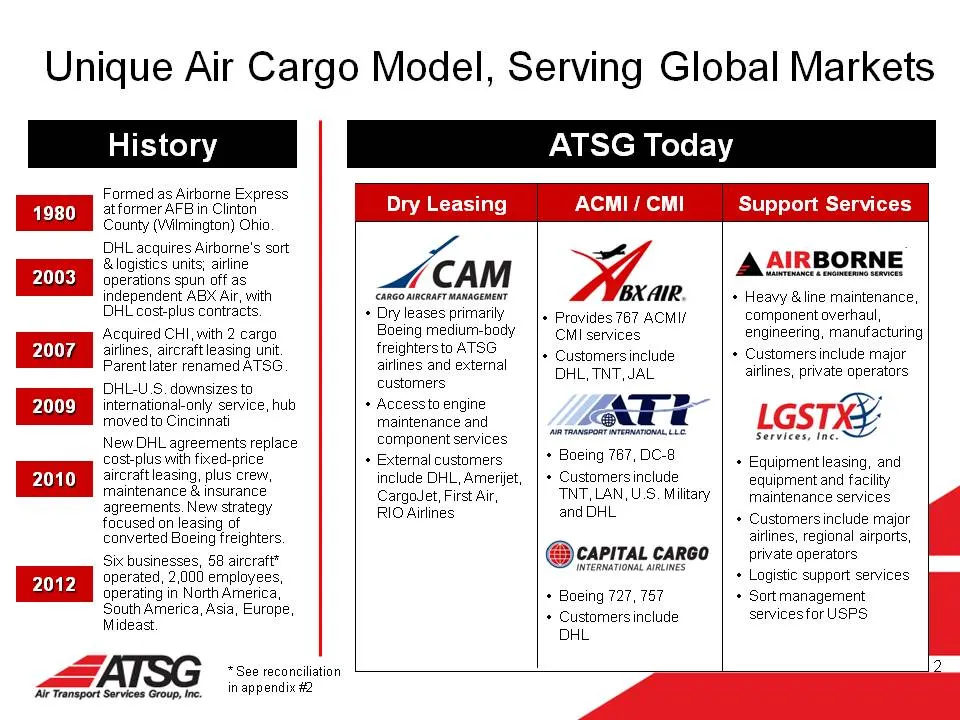
Slide 3: Unique Air Cargo Model, Serving Global Markets
Unique Air Cargo Model, Serving Global Markets G Today Formed as Airhome Express at former AFB in Clinton County (Wilmington) Ohio DHL acquires Airborne's sort logistics units; airline operations spun off as independent ABX Air, with DHL cost-plus contracts Acquired CHI, with 2 cargo airlines, aircr
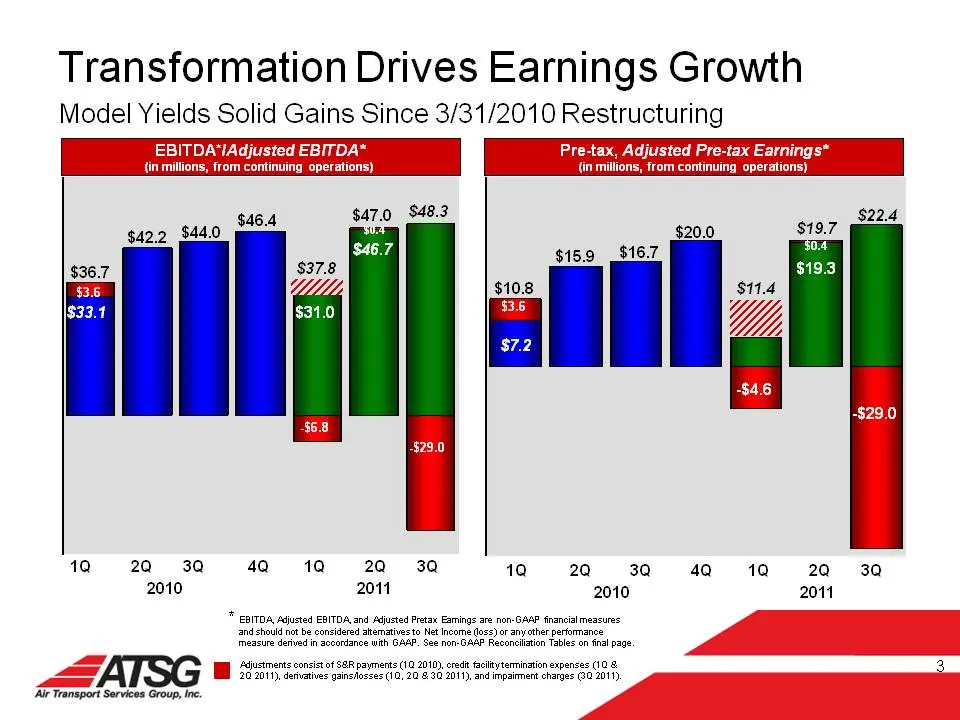
Slide 4: Transformation Drives Earnings Growth
Transformation Drives Earnings Growth Model Yields Solid Gains Since 3/31/2010 Restructuring EBITDA‘IAdjusted EBITDA* Pre-tax, Adjusted Pre-tax Earnings* (in millions, from continuing operations) (inmillions, from continuing operations) $46.4 $47.0 $48.3 $44.0 m $42.2 Eo $36.7 $37.8 | | 2Q 3a 10 2a
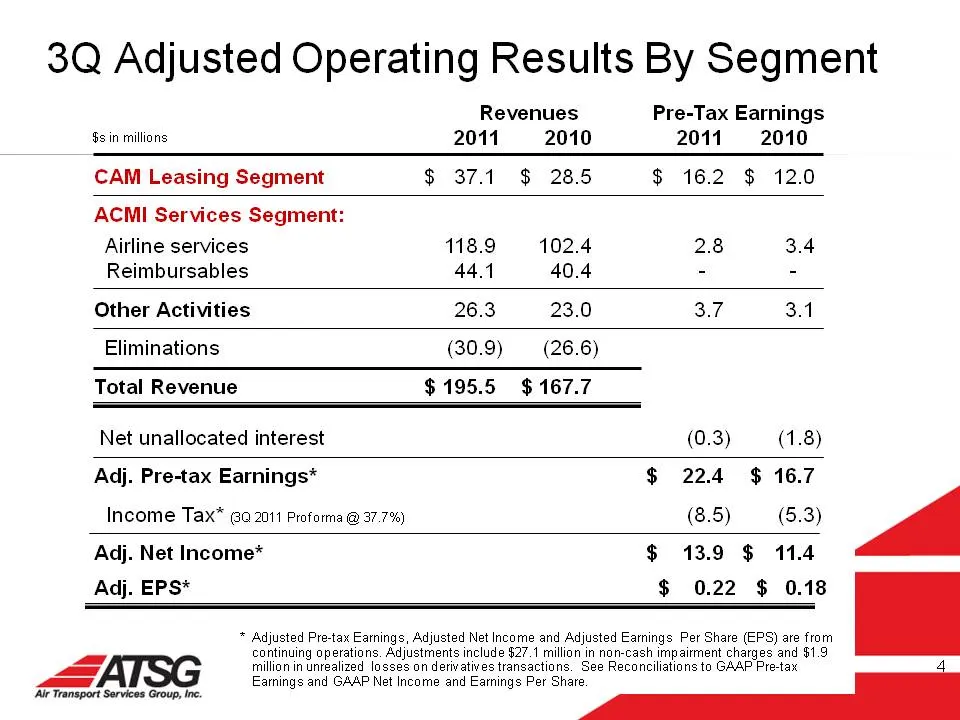
Slide 5: 3Q Adjusted Operating Results By Segment
3Q Adjusted Operating Results By Segment Revenues Pre-Tax Earnings $3 in millions 2011 2010 2011 2010 CAM Leasing Segment $ 37.1 $ 285 $ 16.2 $ 12.0 ACMI Services Segment: Airline services 118.9 102.4 2.8 3.4 Reimbursables 44.1 40.4 2 2 Other Activities 26.3 23.0 Se Se Eliminations (30.9) (26.6) Tot
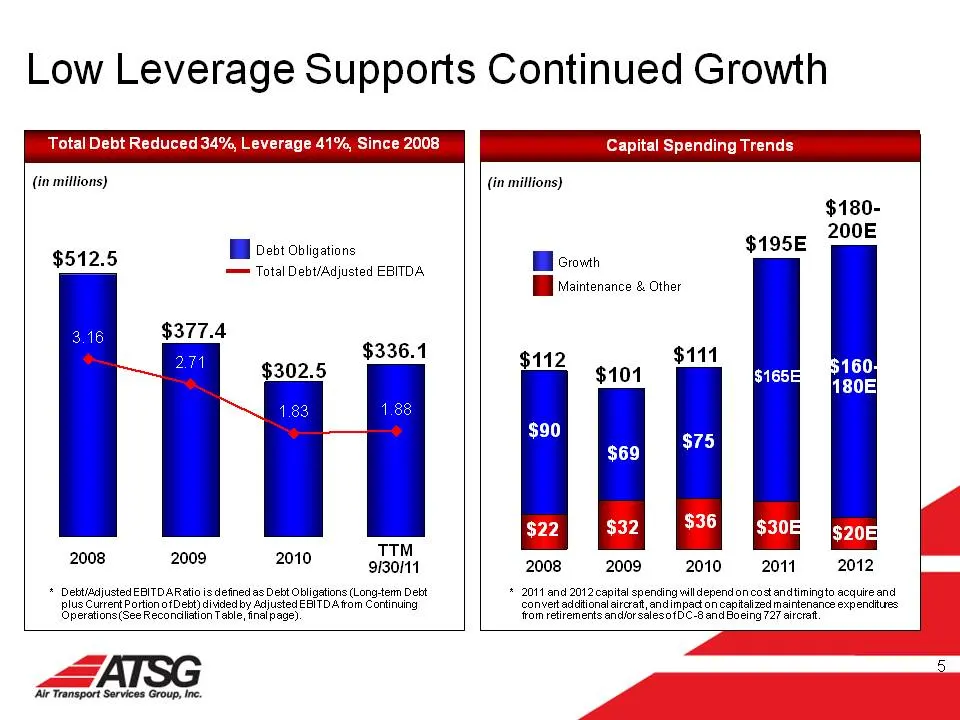
Slide 6: Low Leverage Supports Continued Growth
Low Leverage Supports Continued Growth Total Debt Reduced 34%, Leverage 41%, Since 2008 Capital Spending Trends (in millions) (in millions) $180- 200E [Bl Debt obligations $195E $512.5 — Total Debt/Adjusted EBITDA — Growth Maintenance & Other $377.4 $ 336.1 $112 $111 $302.5 $101 qa $75 $36 52084 TT™
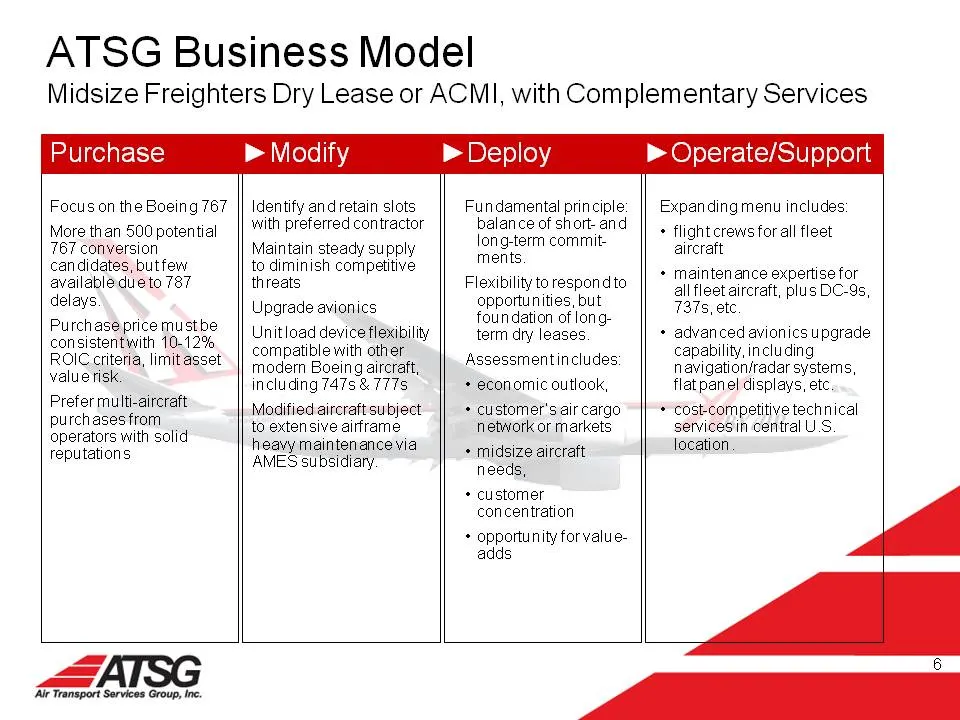
Slide 7: ATSG Business Model
ATSG Business Model Midsize Freighters Dry Lease or ACMI, with Complementary Services Pur ase Focus on the Boeing 767 More than 500 potential 767 conversion candidates, butfew available due to 787 delays Purchase price mustbe consistentwith 10-12% ROIC ciiteria, limitasset value risk Prefer multi-ai
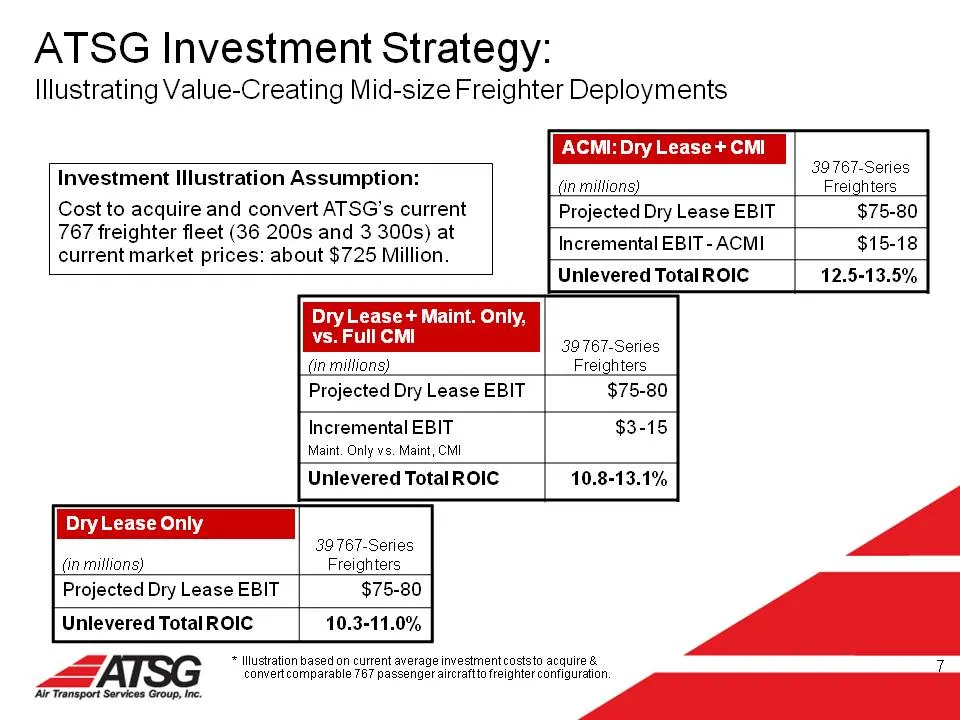
Slide 8: ATSG Investment Strategy: Illustrating Value-Creating Mid-size Freighter Deployments
ATSG Investment Strategy: Illustrating Value-Creating Mid-size Freighter Deployments Investment Illustration Assumption: Cost to acquire and convert ATSG’s current 767 freighter fleet (36 200s and 3 300s) at current market prices: about $725 Million. DryLease+ Mi vs. Full CMI Projected Dry Lease EBI
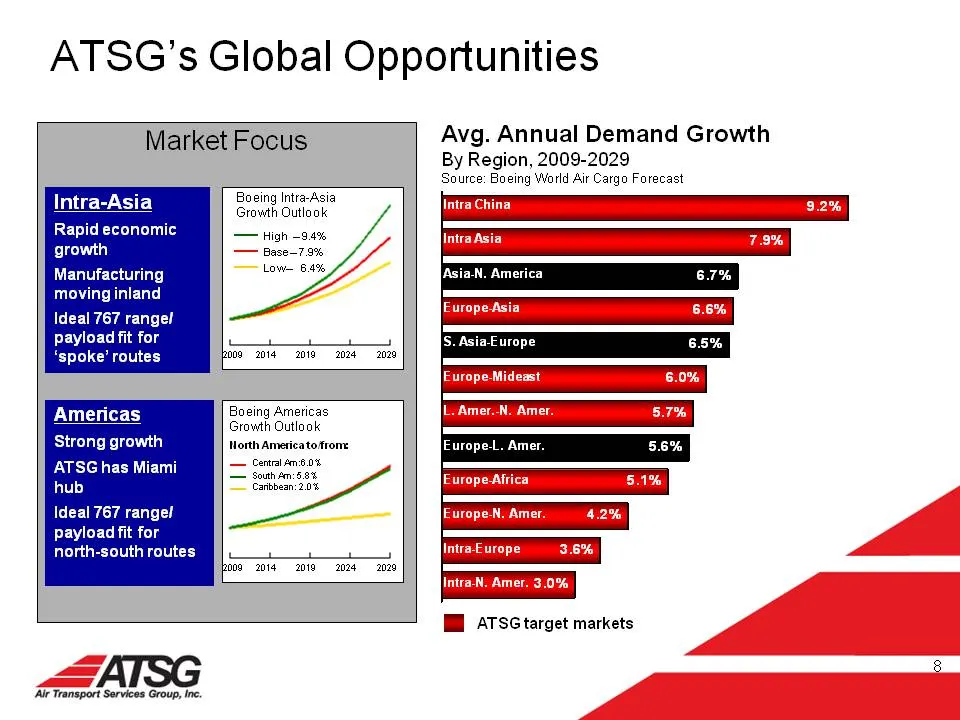
Slide 9: ATSG's Global Opportunities
ATSG’s Global Opportunities Intra-Asia Rapid economic growth Manufacturing moving inland Ideal 767 rangel payload fit for ‘spoke’ routes Americas Strong growth ATSG has Miami hub Ideal 767 rangel payload fit for north-south routes Market Focus Boeing Intra-Asia Growth Outlook — High -3.4% — Bese-7.9
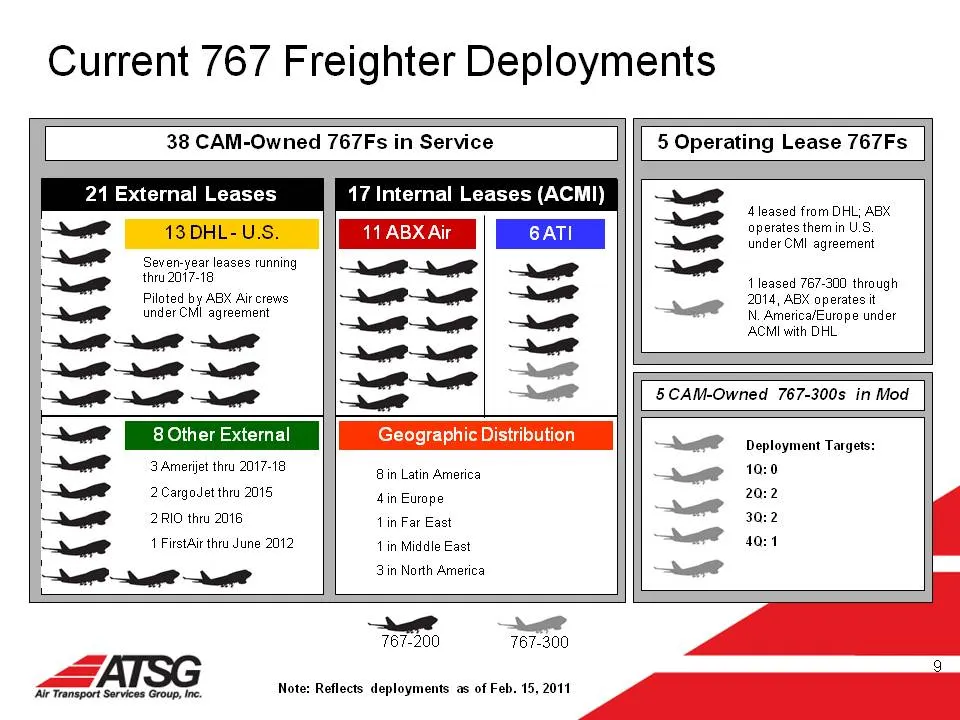
Slide 10: Current Freighter Deployments CAM-Owned 767Fs in Service
Current 767 Freighter Deployments 38 CAM-Owned 767Fs in Service 5 Operating Lease 767Fs External Leases i ke seven-year leases running q Le thru 2017-18 1 Piloted by ABX Air crews Reg under CM agreement et? ee? ae et? a? ae a? 17 Internal Leases (ACMI) 11 ABX Air 6ATI ie 4 leased from DHL; ABX opera
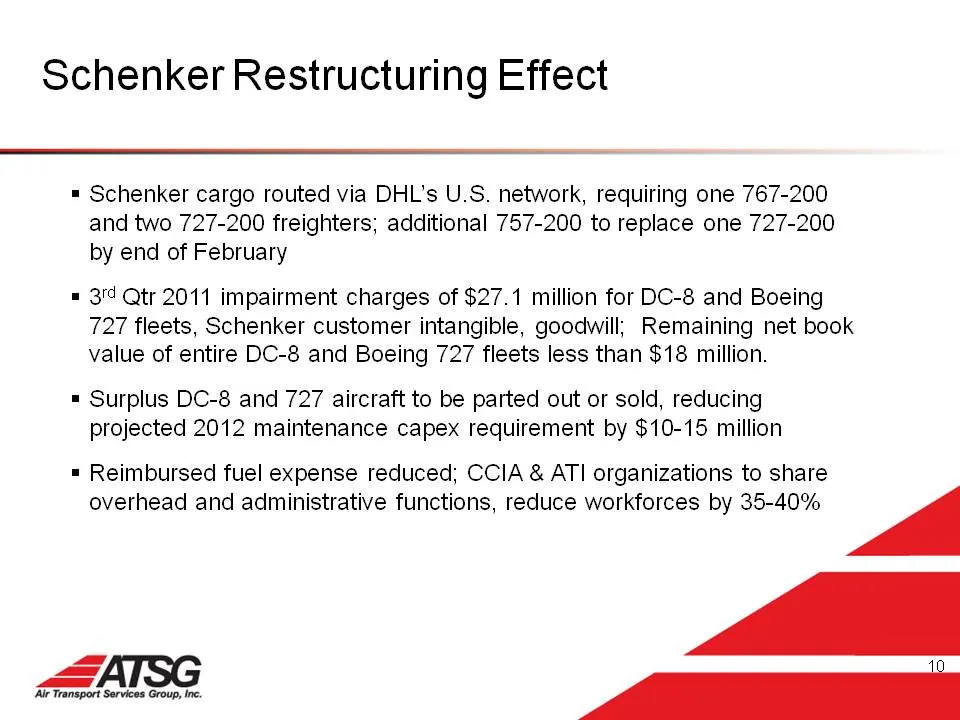
Slide 11: Schenker Restructuring Effect
Schenker Restructuring Effect = Schenker cargo routed via DHL’s U.S. network, requiring one 767-200 and two 727-200 freighters; additional 757-200 to replace one 727-200 by end of February = 3/4 Qtr 2011 impairment charges of $27.1 million for DC-8 and Boeing 727 fleets, Schenker customer intangible
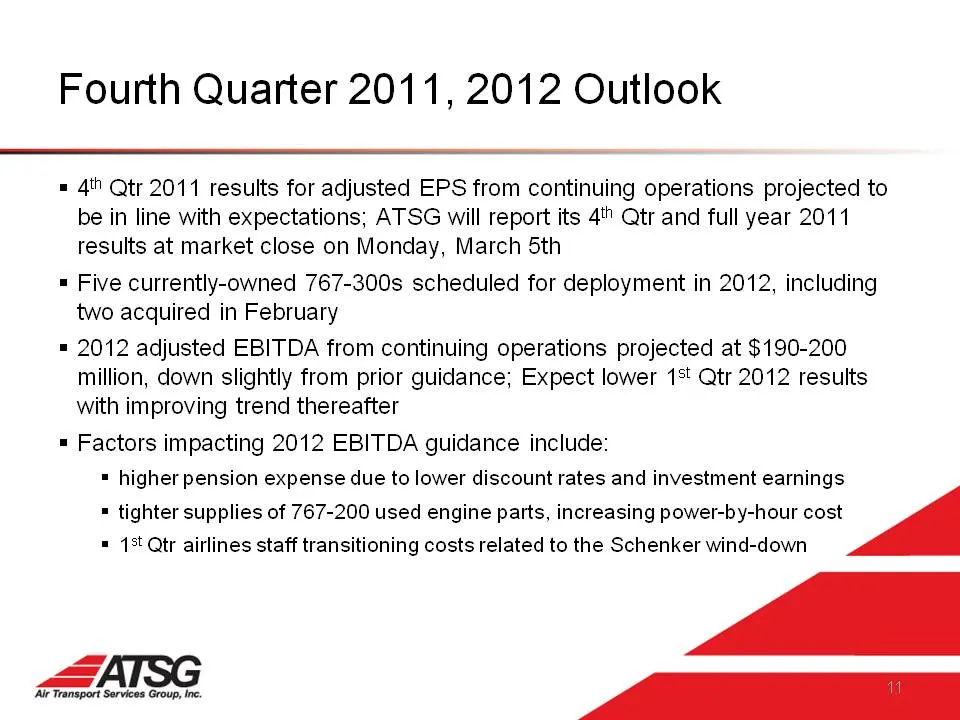
Slide 12: Fourth Quarter 2011, 2012 Outlook
Fourth Quarter 2011, 2012 Outlook = 4 Qtr 2011 results for adjusted EPS from continuing operations projected to be in line with expectations; ATSG will report its 4" Qtr and full year 2011 results at market close on Monday, March 5th = Five currently-owned 767-300s scheduled for deployment in 2012,
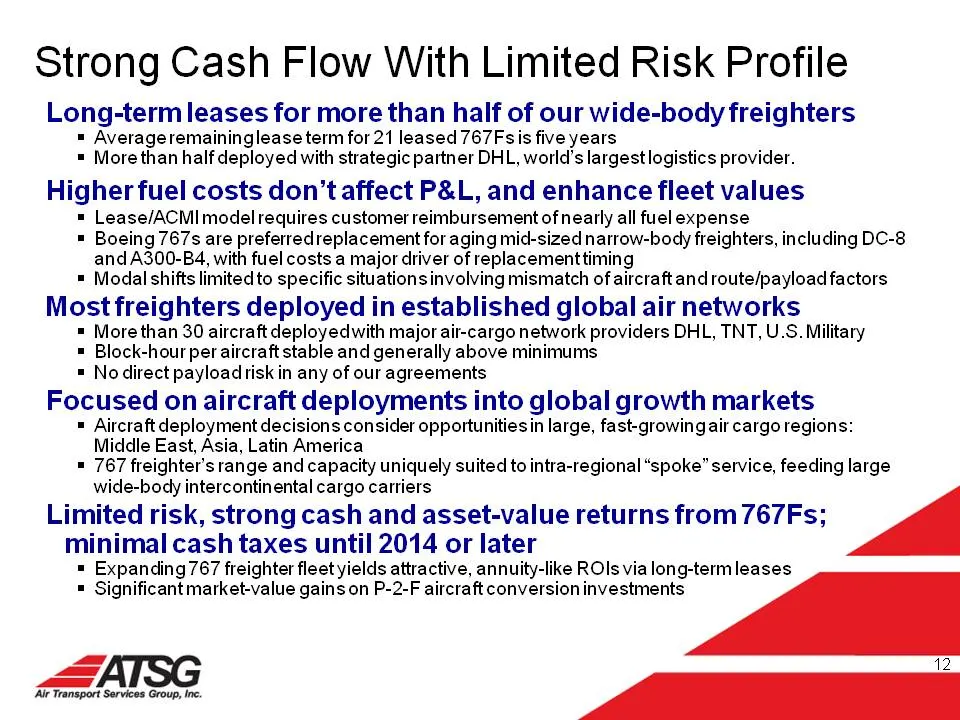
Slide 13: Strong Cash Flow With Limited Risk Profile
Strong Cash Flow With Limited Risk Profile Long-term leases for more than half of our wide-body freighters = Averageremaininglease term for 21 leased 767F sis five years = More than half deployed with strategic partner DHL, world’s largest logistics provider. Higher fuel costs don’t affect P&L, and
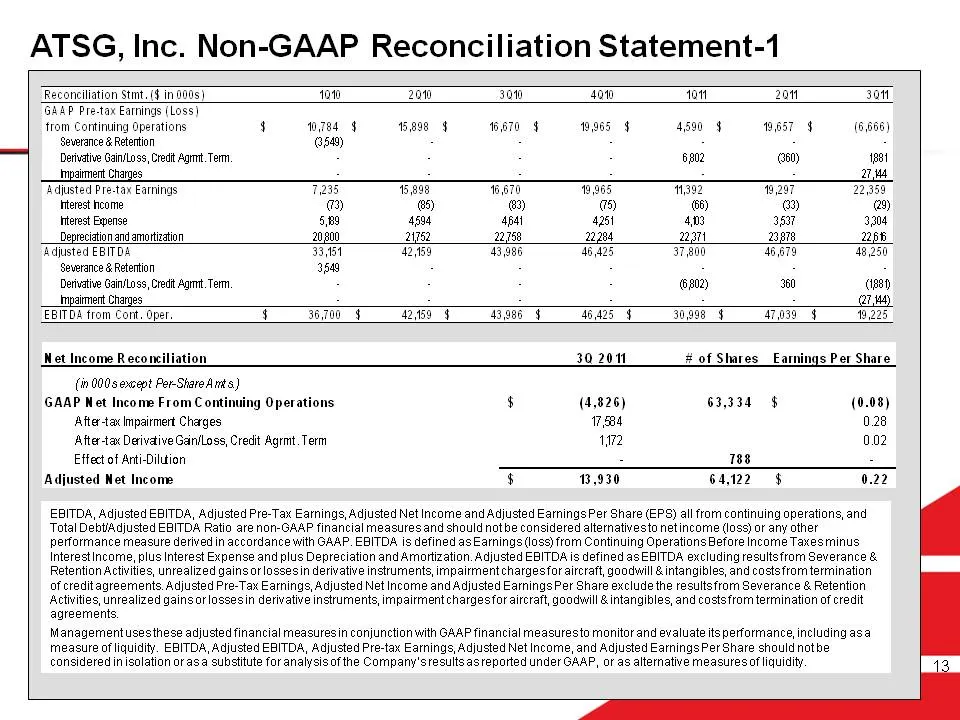
Slide 14: ATSG, Inc. Non-GAAP Reconciliation Statement-1
ATSG, Inc. Non-GAAP Reconciliation Statement-1 Adjusted Net Income agreements. Reconciliation Stmt. (4 in 000s) 20 ED 100 on Zant P Prectax Earrings (Loss) n Continuing Operations $784 a8 $8870 4 4 $ (6,668) Severance & Retetion 658) “| _ Derivative GaniLoss, Credit Agrnt. Term Sa02 G60) ‘pet Inpaim
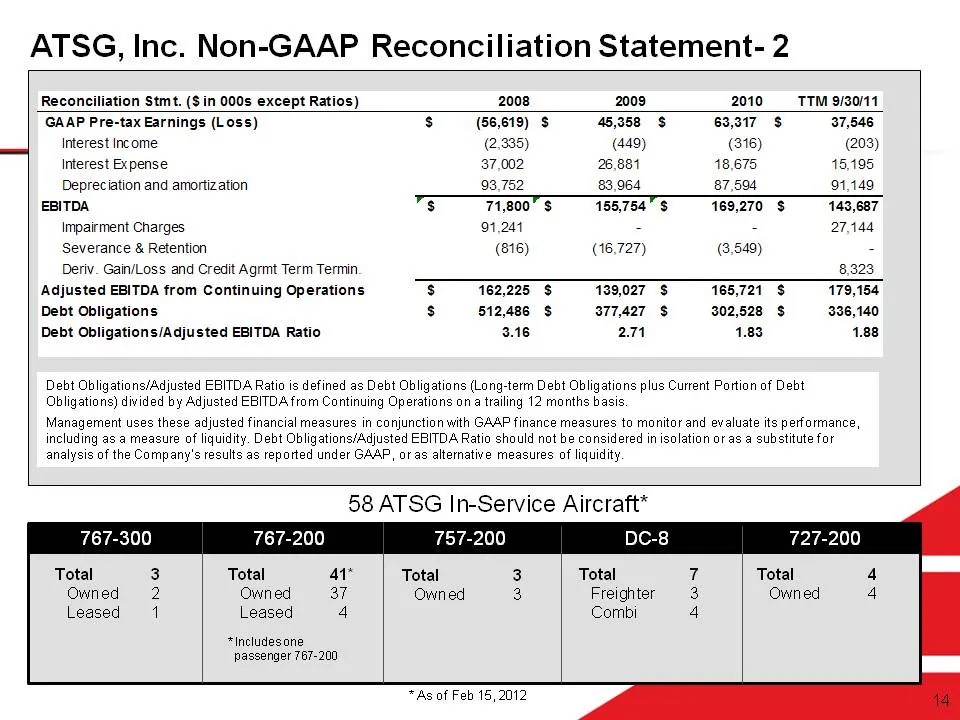
Slide 15: ATSG, Inc. Non-GAAP Reconciliation Statement-2
ATSG, Inc. Non-GAAP Reconciliation Statement- 2 Reconciliation stmt. ($in 000s except Ratios) 2008 2009 2010 TTM 9/30/11 GAAP Pre-tax Earnings (Loss) S (66,619) $ 45,358 S 63317 $ 37,546 Interest Income (2,336) (449) (316) (203) Interest Expense 37,002 26,881 18,675 16,195 Depreciation and amortizat
Source: SEC EDGAR · 8-K filed Feb 15, 2012
More decks from Air Transport Services Group Inc
 Shareholder Meeting (May 2024)26 slides · May 23, 2024
 Stephens Annual Investment Conference 202321 slides · Nov 14, 2023
 Investor Day (September 2023)68 slides · Sep 27, 2023
 Shareholder Meeting (May 2023)25 slides · May 26, 2023
 Stifel conference (February 2023)15 slides · Feb 6, 2023
 Stifel 2020 Transportation & Logistics Conference18 slides · Feb 11, 2020