OMNOVA Solutions — Gabelli & Company Specialty Chemicals Conference (May 2008)
45 slides from OMNOVA Solutions's conference presentation, May 15, 2008
Slide 1: Gabelli & Company Specialty Chemicals Conference
Exhibit 99 Gabelli & Company Specialty Chemicals Conference Kevin McMullen Chairman & CEO May 15, 2008
Slide 2: Cautionary Forward-Looking Statements
Cautionary Forward-Looking Statements • This presentation includes “forward-lookingstatements” as defined by federal securities laws. Forward-looking statements may address a number of matters including the Company'sbusiness, markets in which the Companyoperates, results of operations, financial con
Slide 3: 2008 Price Increases
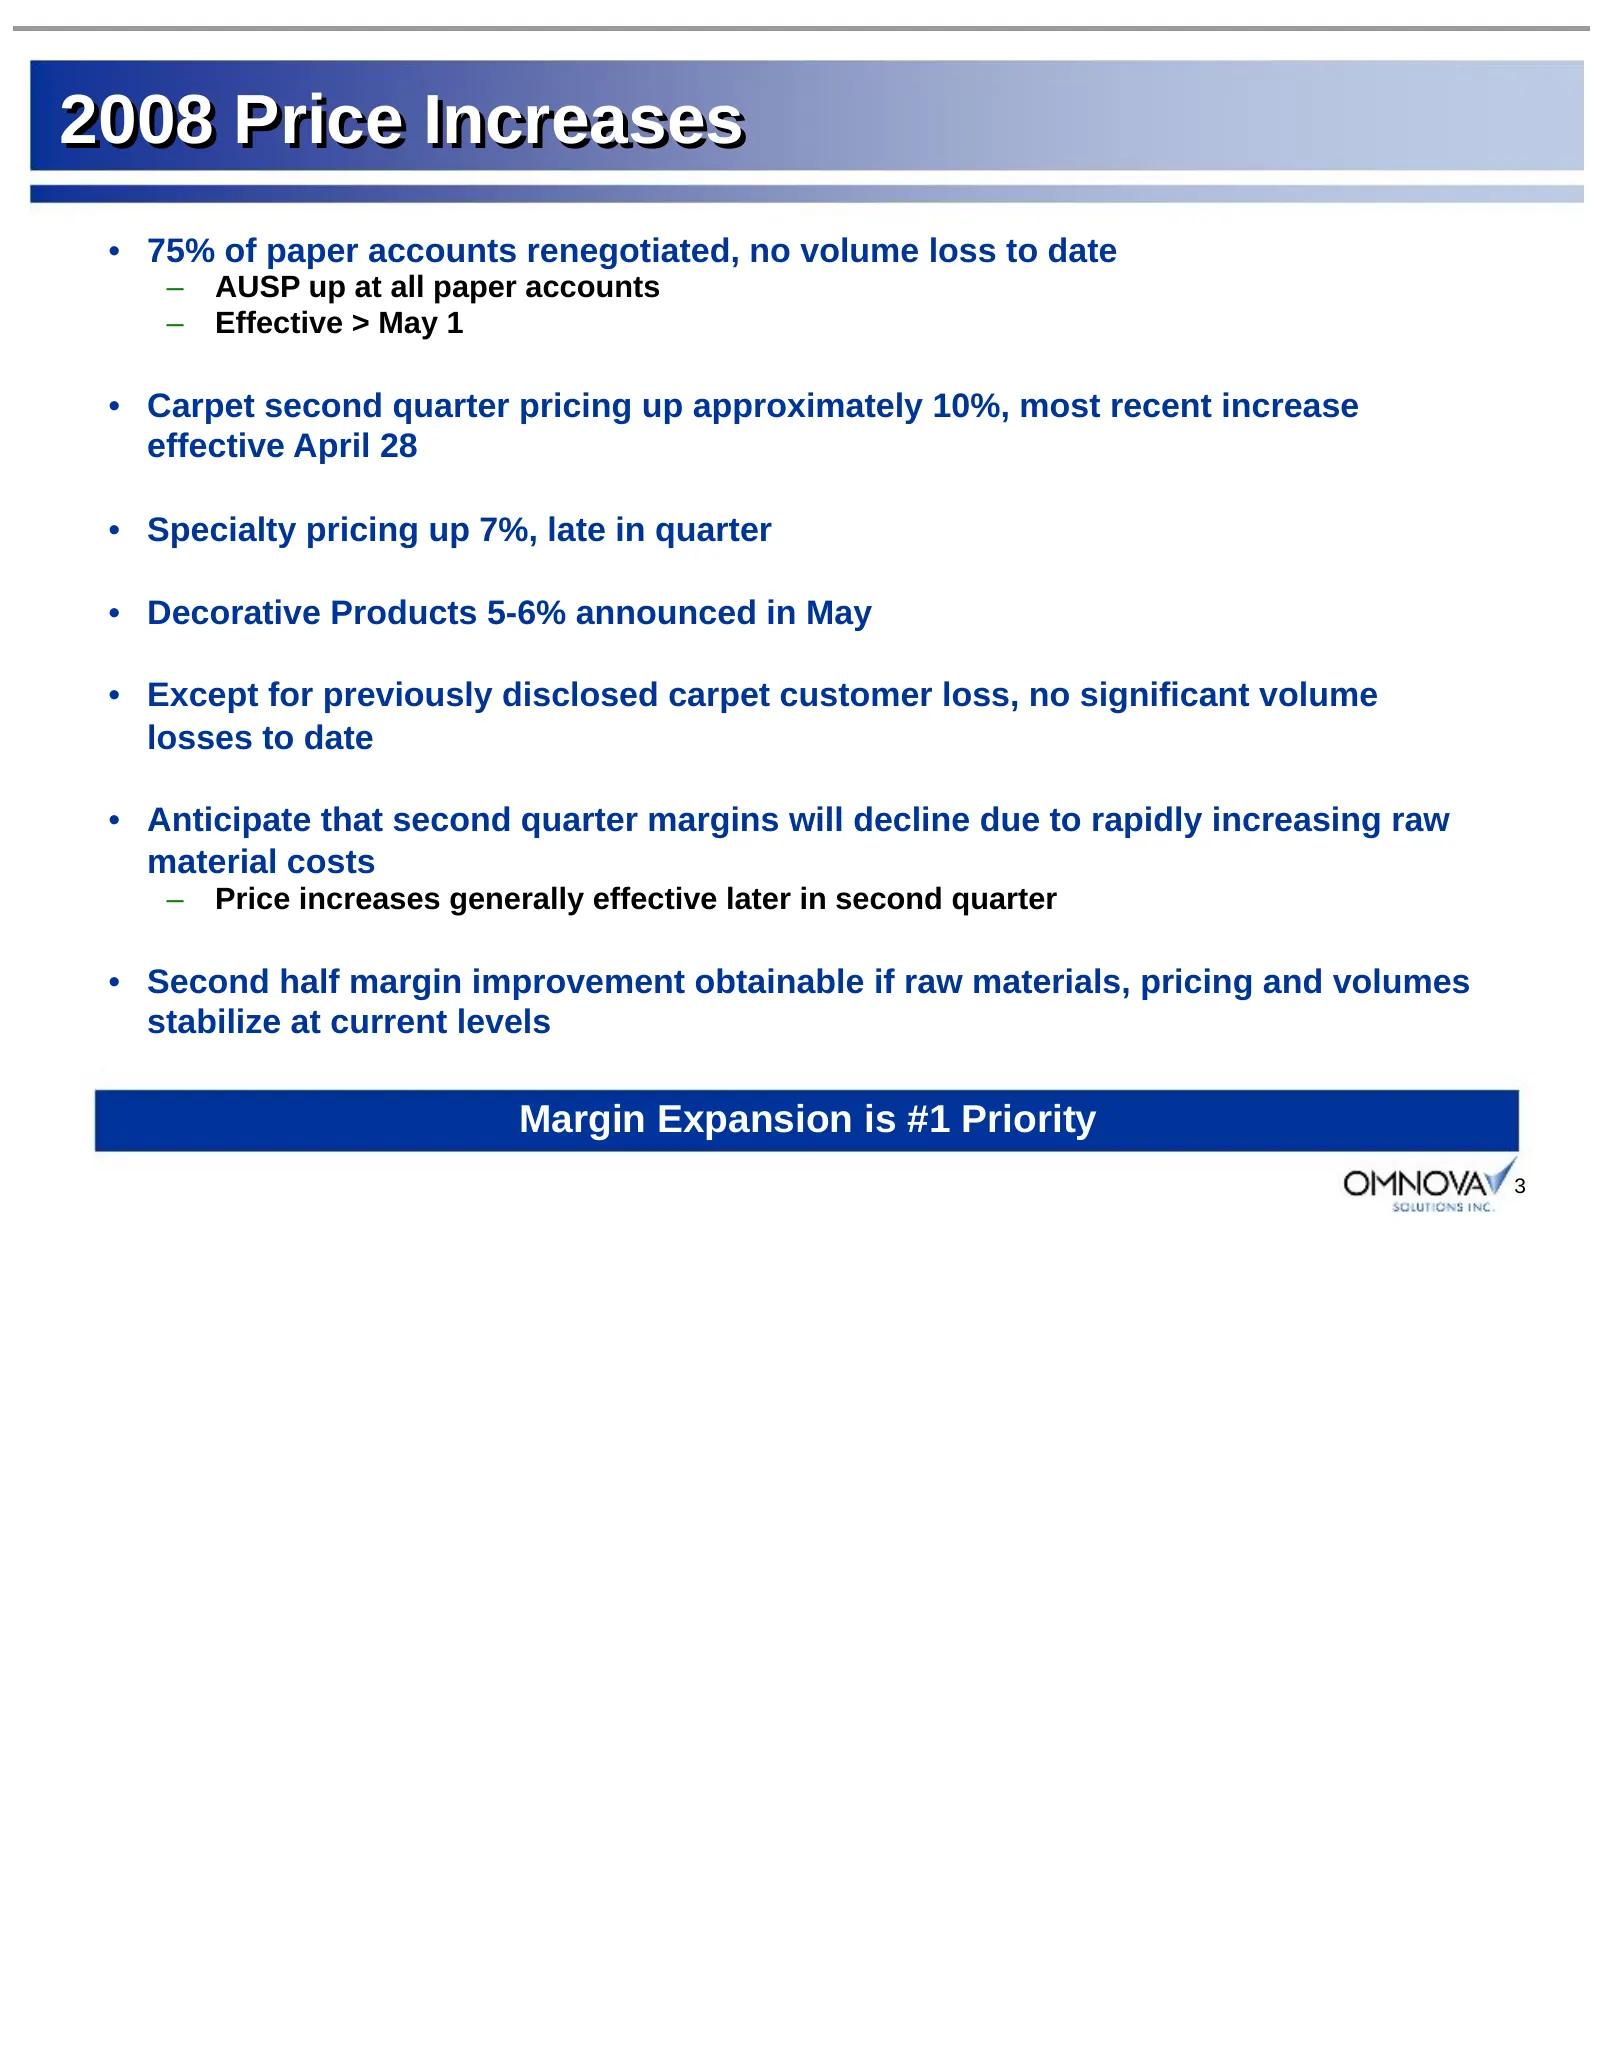
2008 Price Increases • 75% of paper accounts renegotiated, no volume loss to date – AUSP up at all paper accounts – Effective > May 1 • Carpet second quarter pricing up approximately 10%, most recent increase effective April 28 • Specialty pricing up 7%, late in quarter • Decorative Products 5-6% an
Slide 4: Business Segments At A Glance
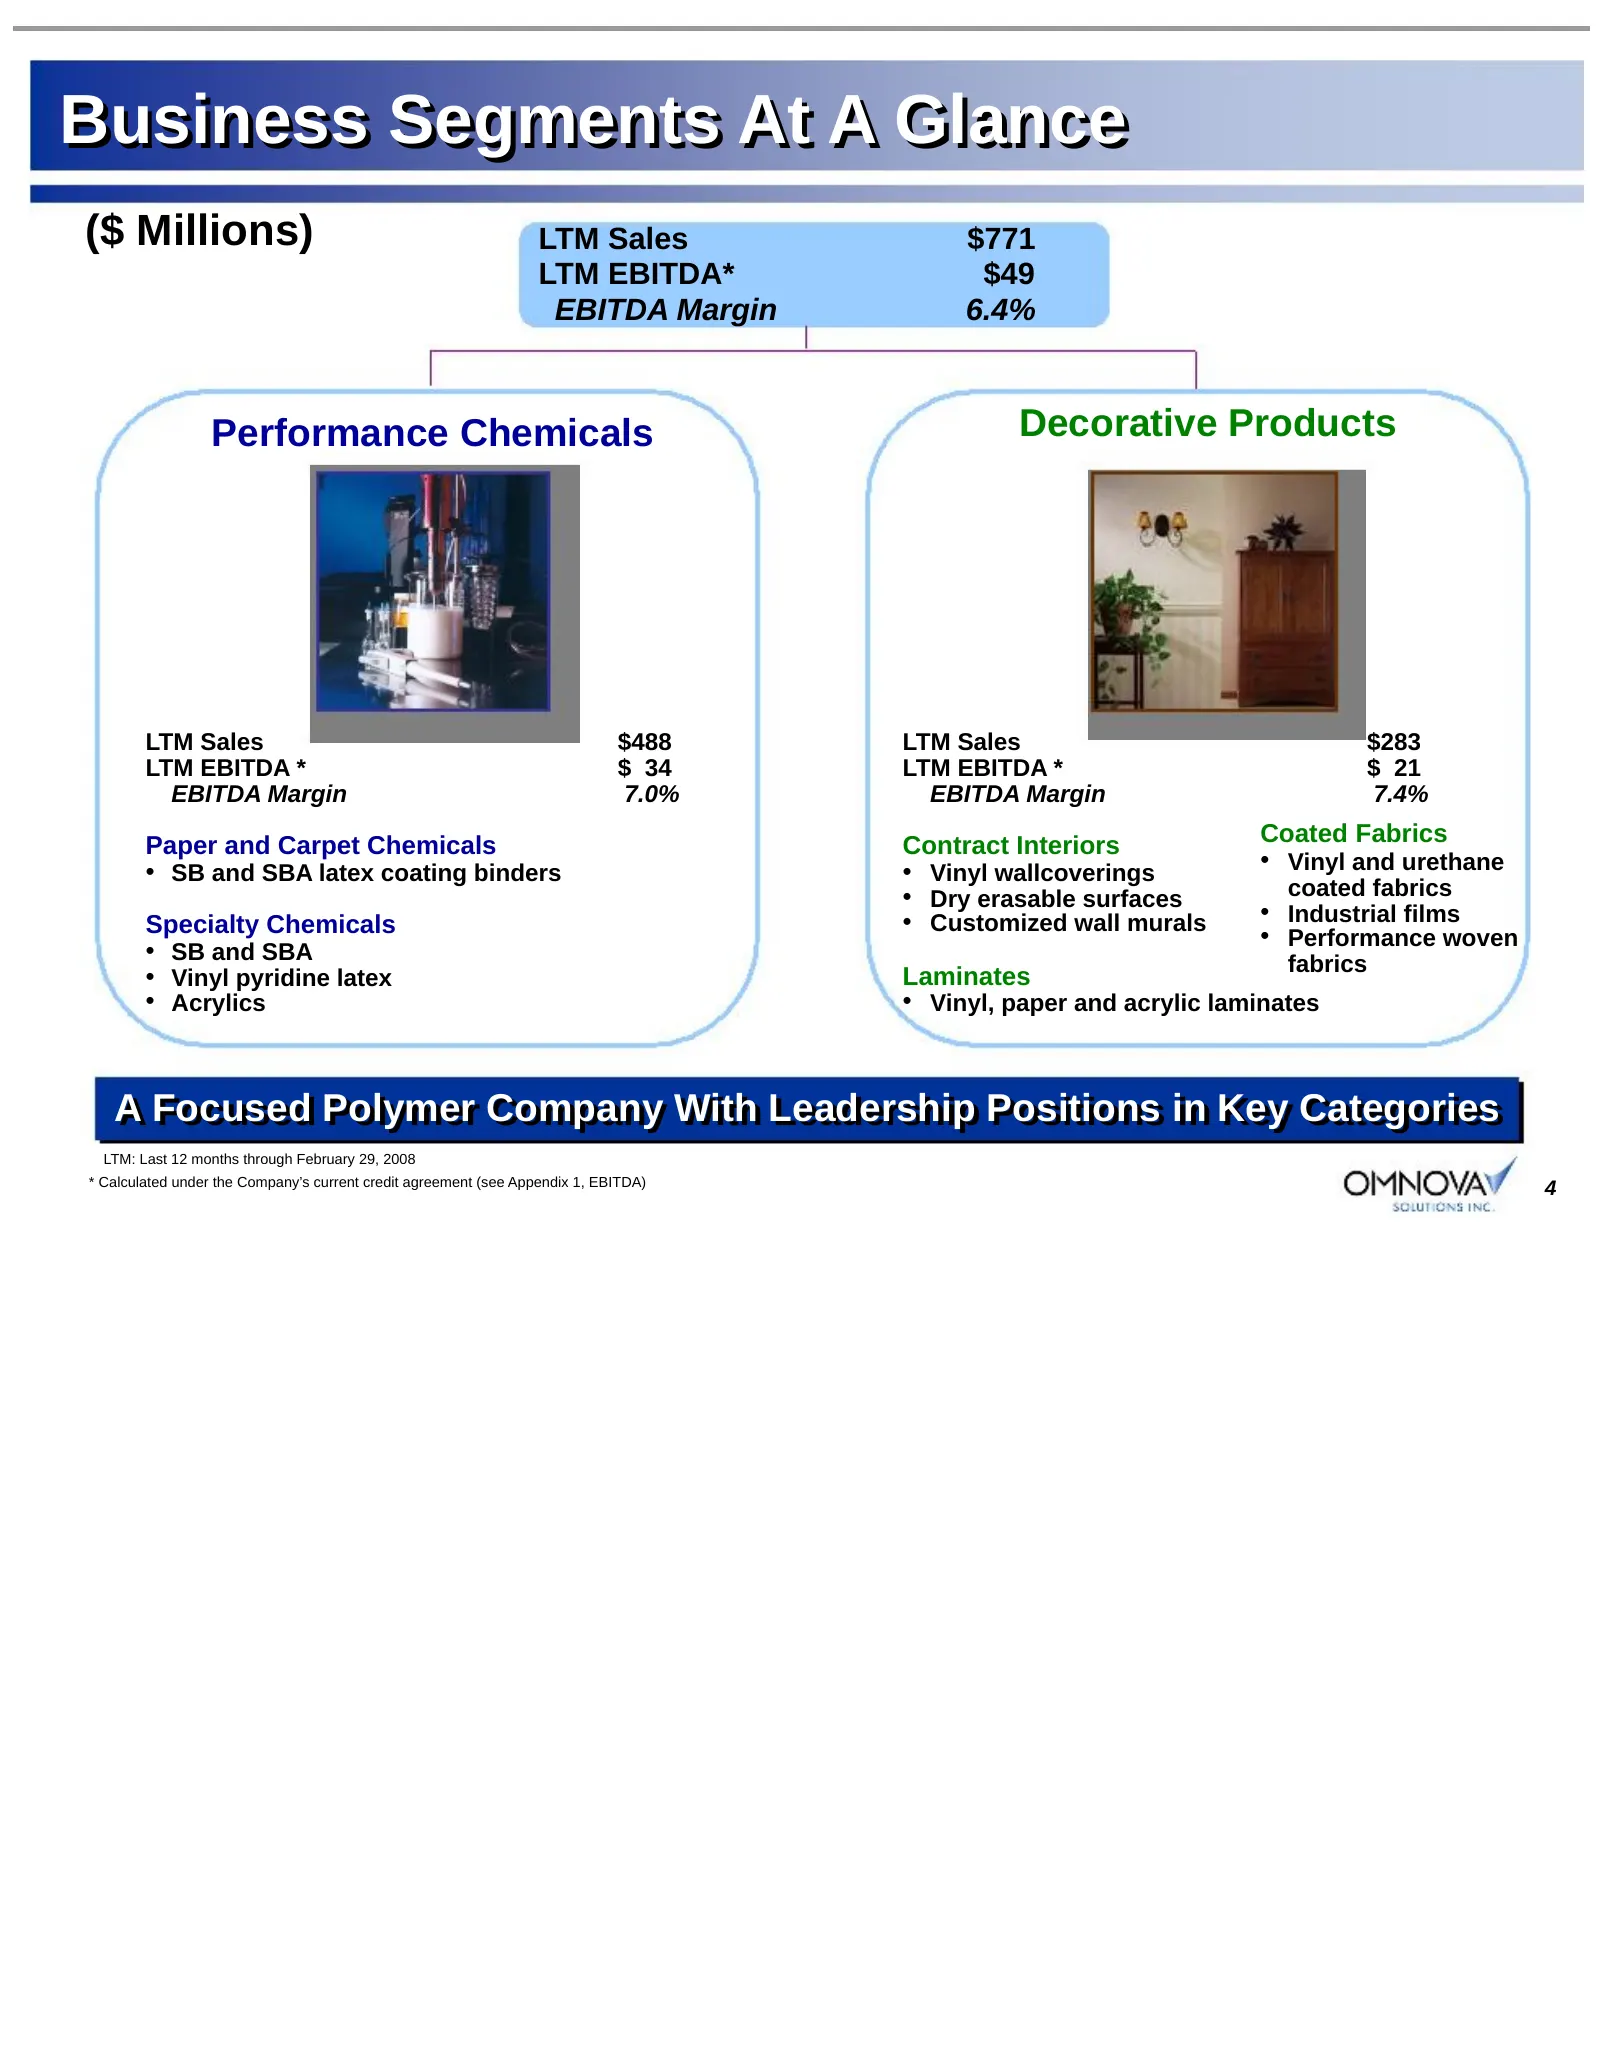
Business Segments At A Glance ($ Millions) LTM Sales $771 LTM EBITDA* $49 EBITDA Margin 6.4% Performance Chemicals Decorative Products LTM Sales $488 LTM Sales $283 LTM EBITDA * $ 34 LTM EBITDA * $ 21 EBITDA Margin 7.0% EBITDA Margin 7.4% Paper and Carpet Chemicals Contract Interiors Coated Fabrics
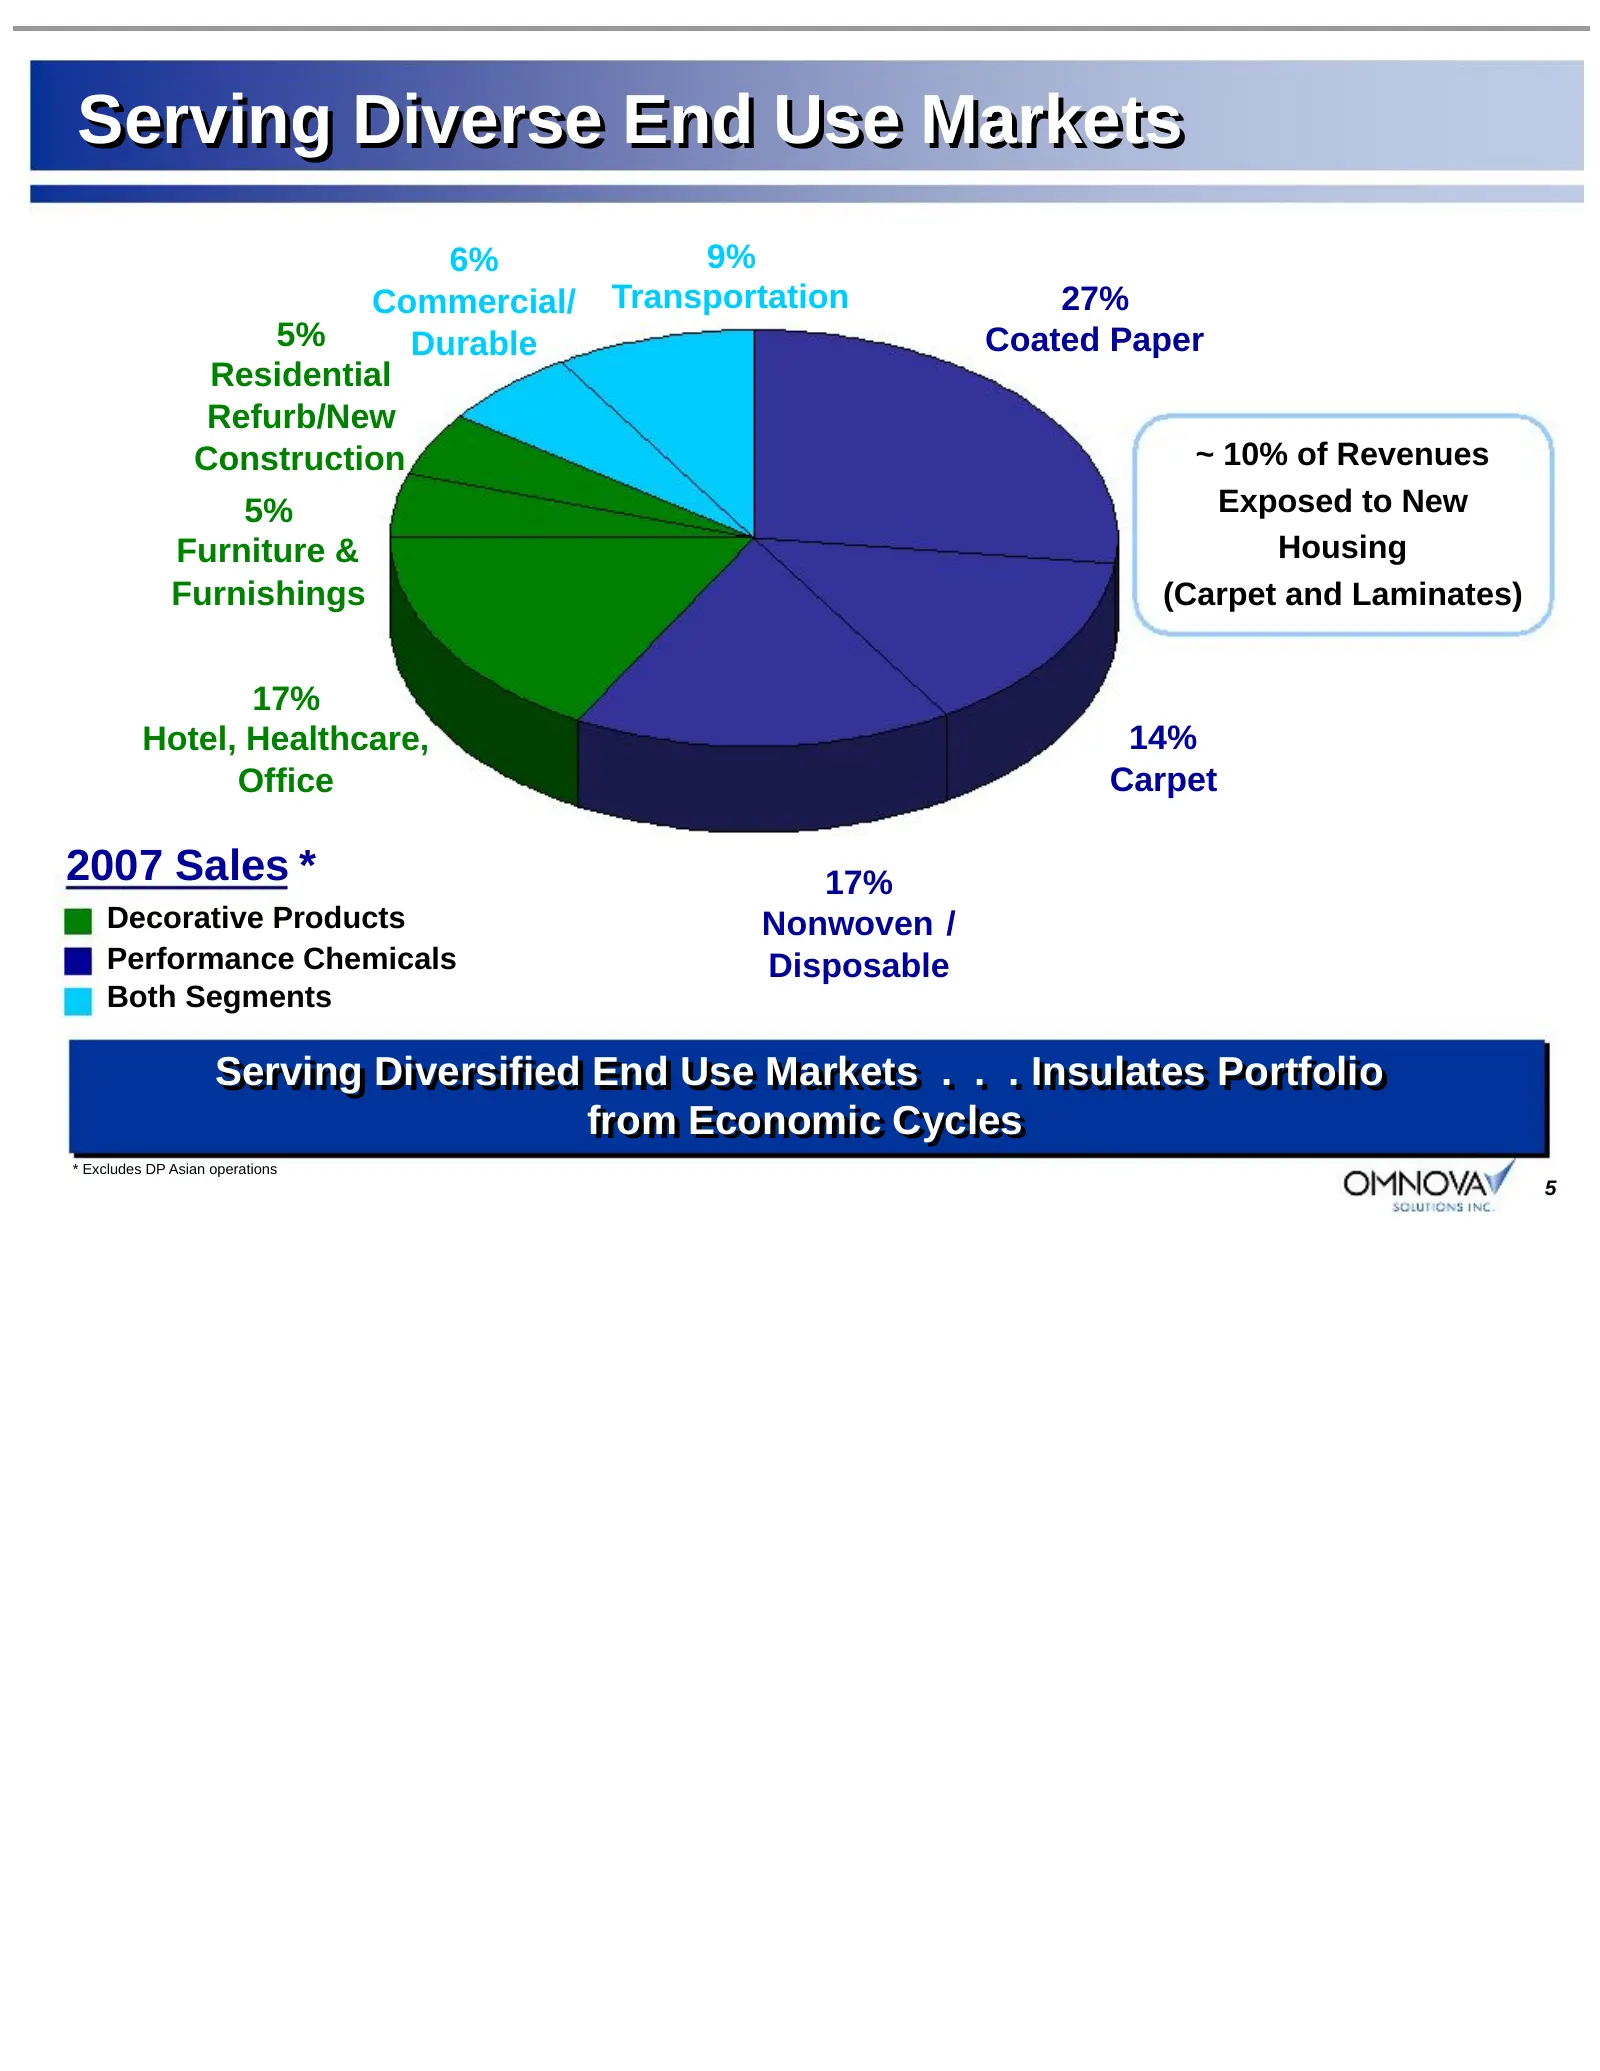
Slide 5: Serving Diverse End Use Markets
Serving Diverse End Use Markets 6% 9% Commercial/ Transportation 27% 5% Durable Coated Paper Residential Refurb/New Construction ~ 10% of Revenues 5% Exposed to New Furniture & Housing Furnishings (Carpet and Laminates) 17% Hotel, Healthcare, 14% Office Carpet 2007 Sales * 17% Decorative Products No
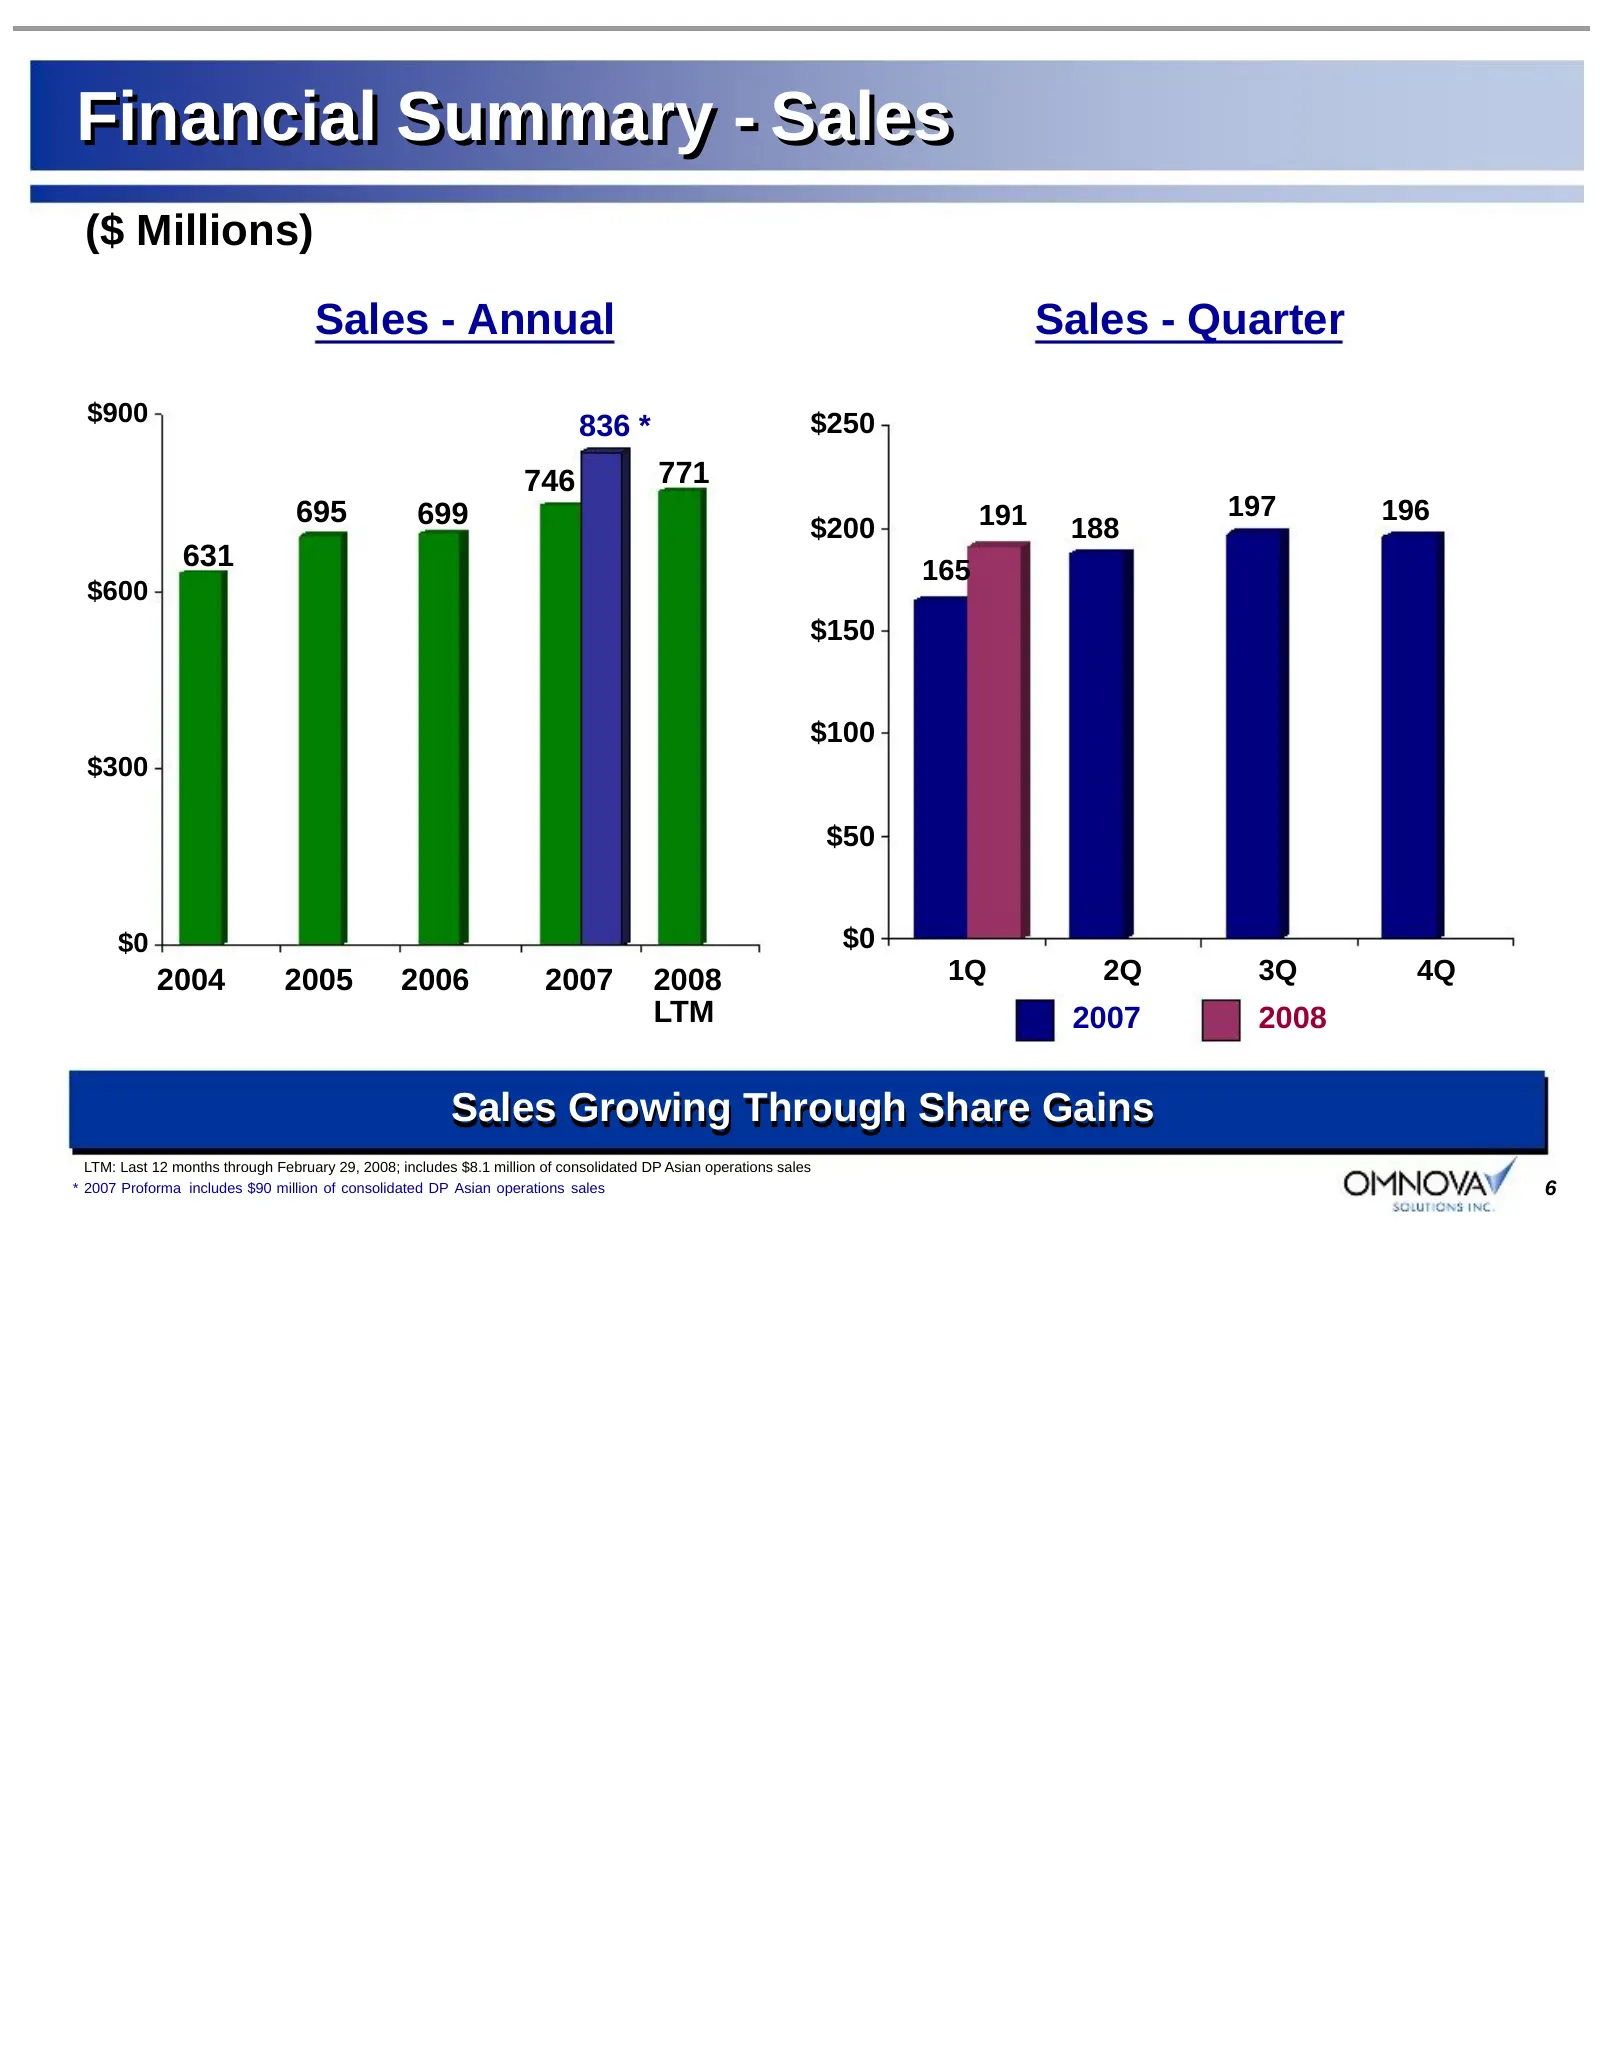
Slide 6: Financial Summary - Sales
Financial Summary - Sales ($ Millions) Sales - Annual Sales - Quarter $900 $250 836 * 746 771 695 699 191 197 196 $200 188 631 165 $600 $150 $100 $300 $50 $0 $0 2004 2005 2006 2007 2008 1Q 2Q 3Q 4Q LTM 2007 2008 Sales Growing Through Share Gains LTM: Last 12 months through February 29, 2008; include
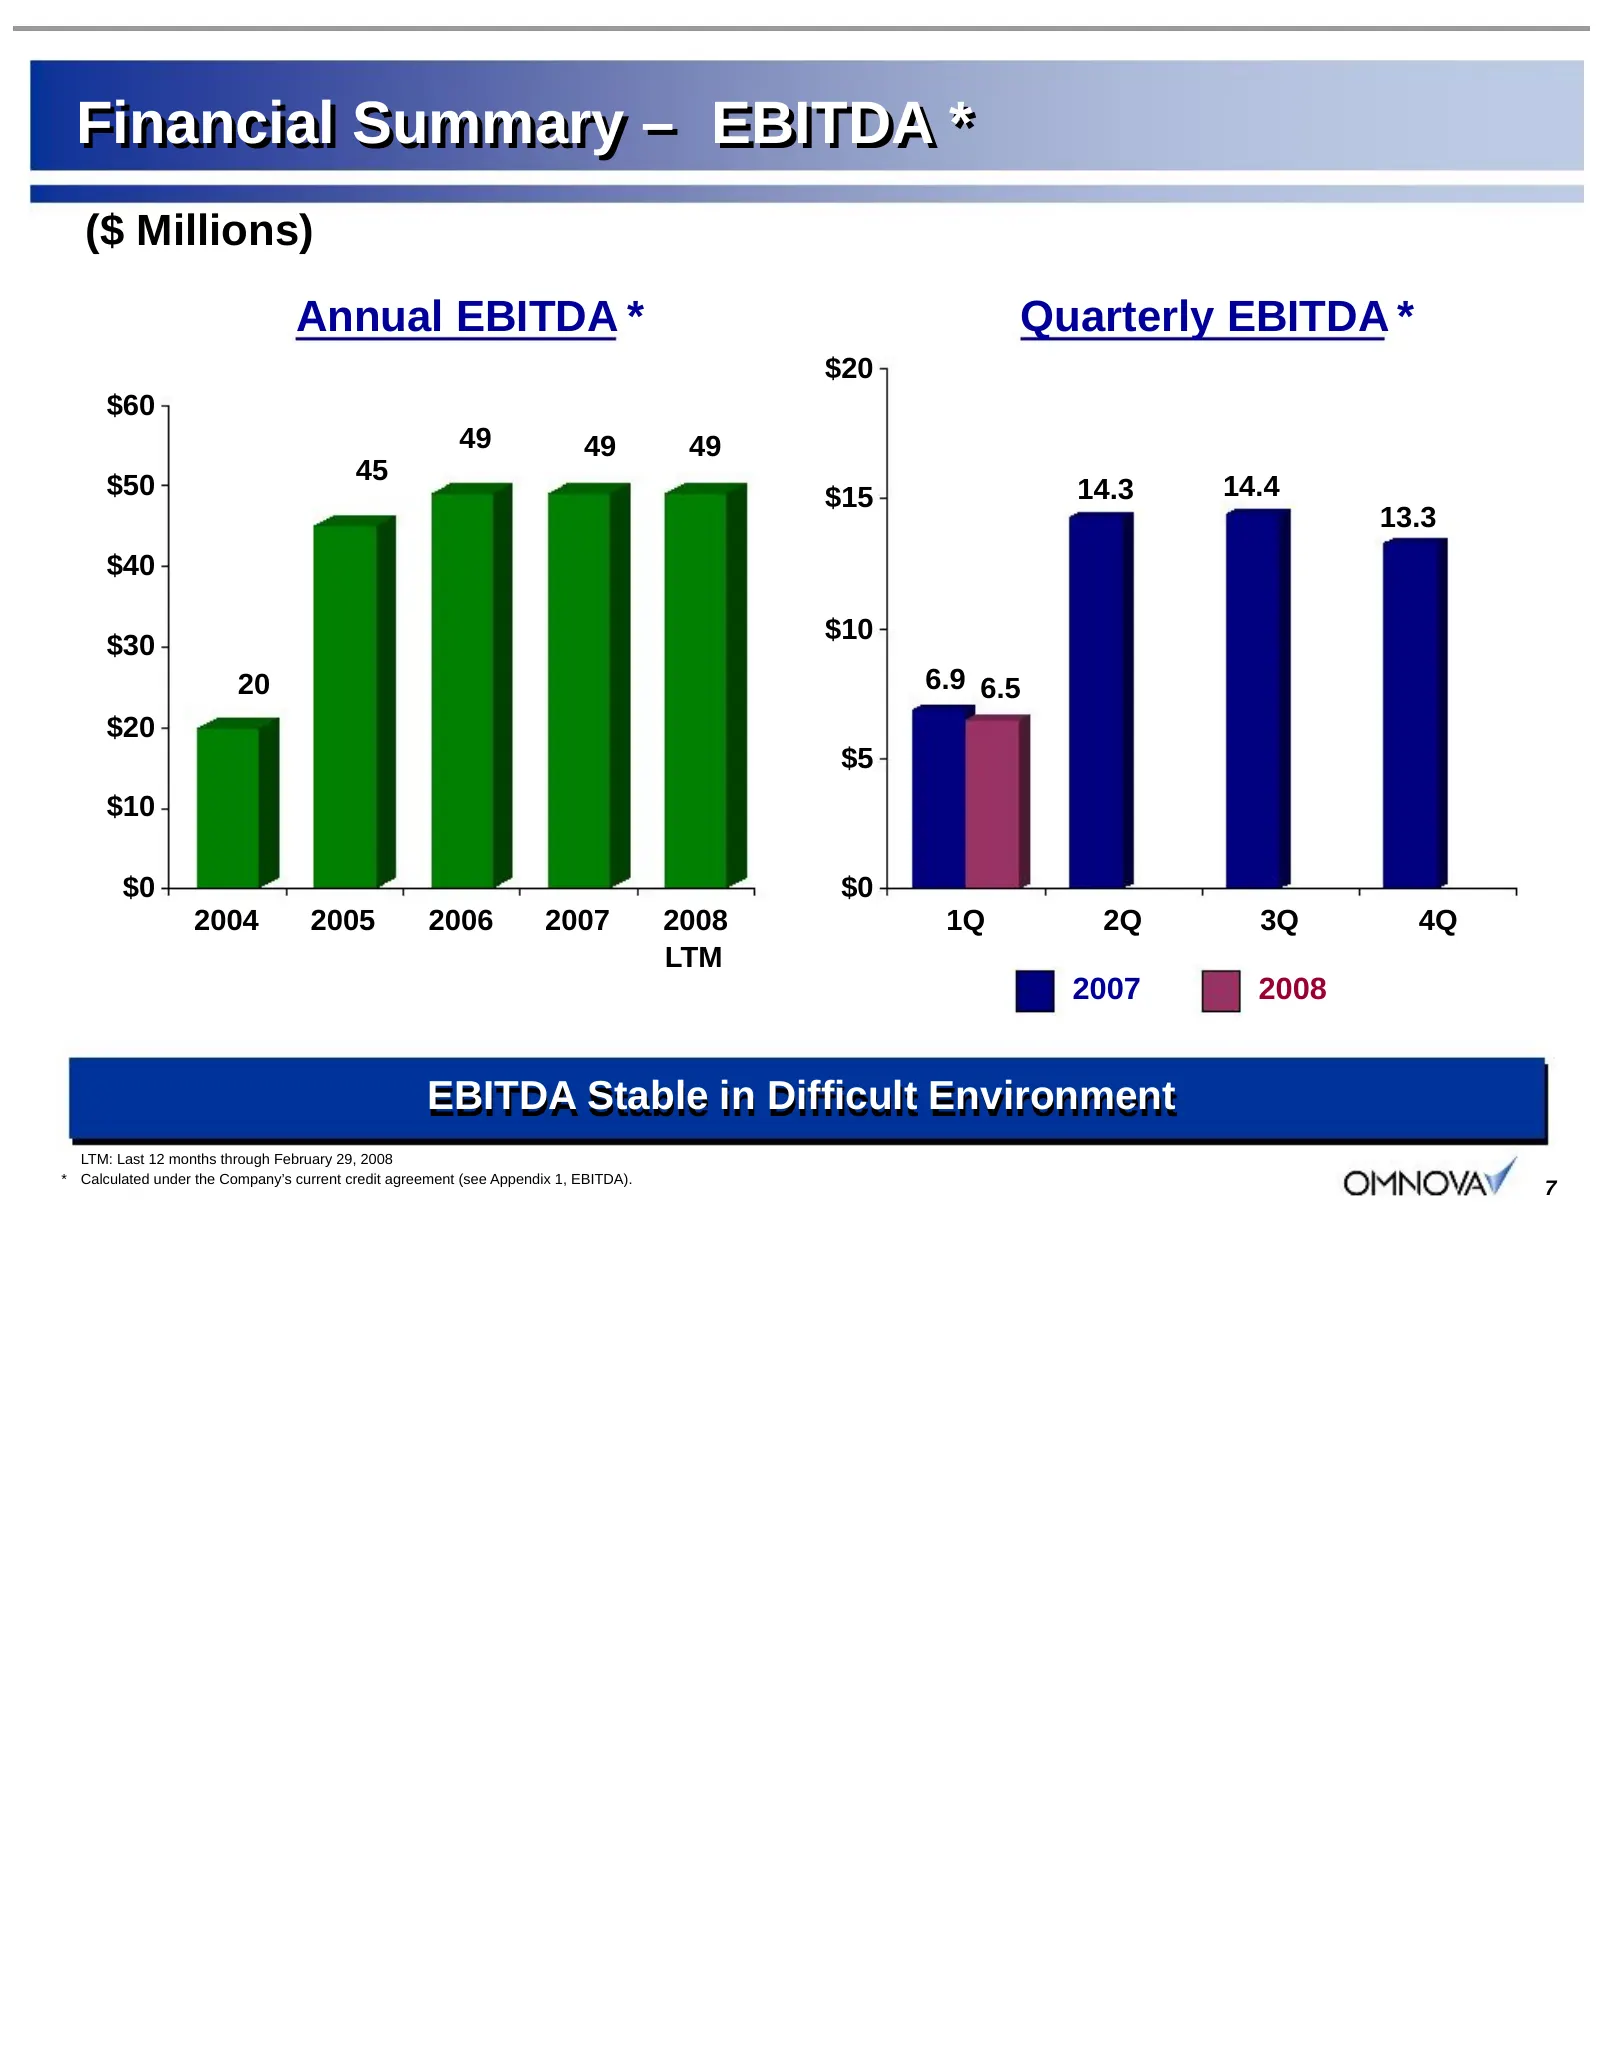
Slide 7: Financial Summary – EBITDA
Financial Summary – EBITDA * ($ Millions) Annual EBITDA * Quarterly EBITDA * $20 $60 49 49 49 45 $50 $15 14.3 14.4 13.3 $40 $10 $30 20 6.9 6.5 $20 $5 $10 $0 $0 2004 2005 2006 2007 2008 1Q 2Q 3Q 4Q LTM 2007 2008 EBITDA Stable in Difficult Environment LTM: Last 12 months through February 29, 2008 * Ca
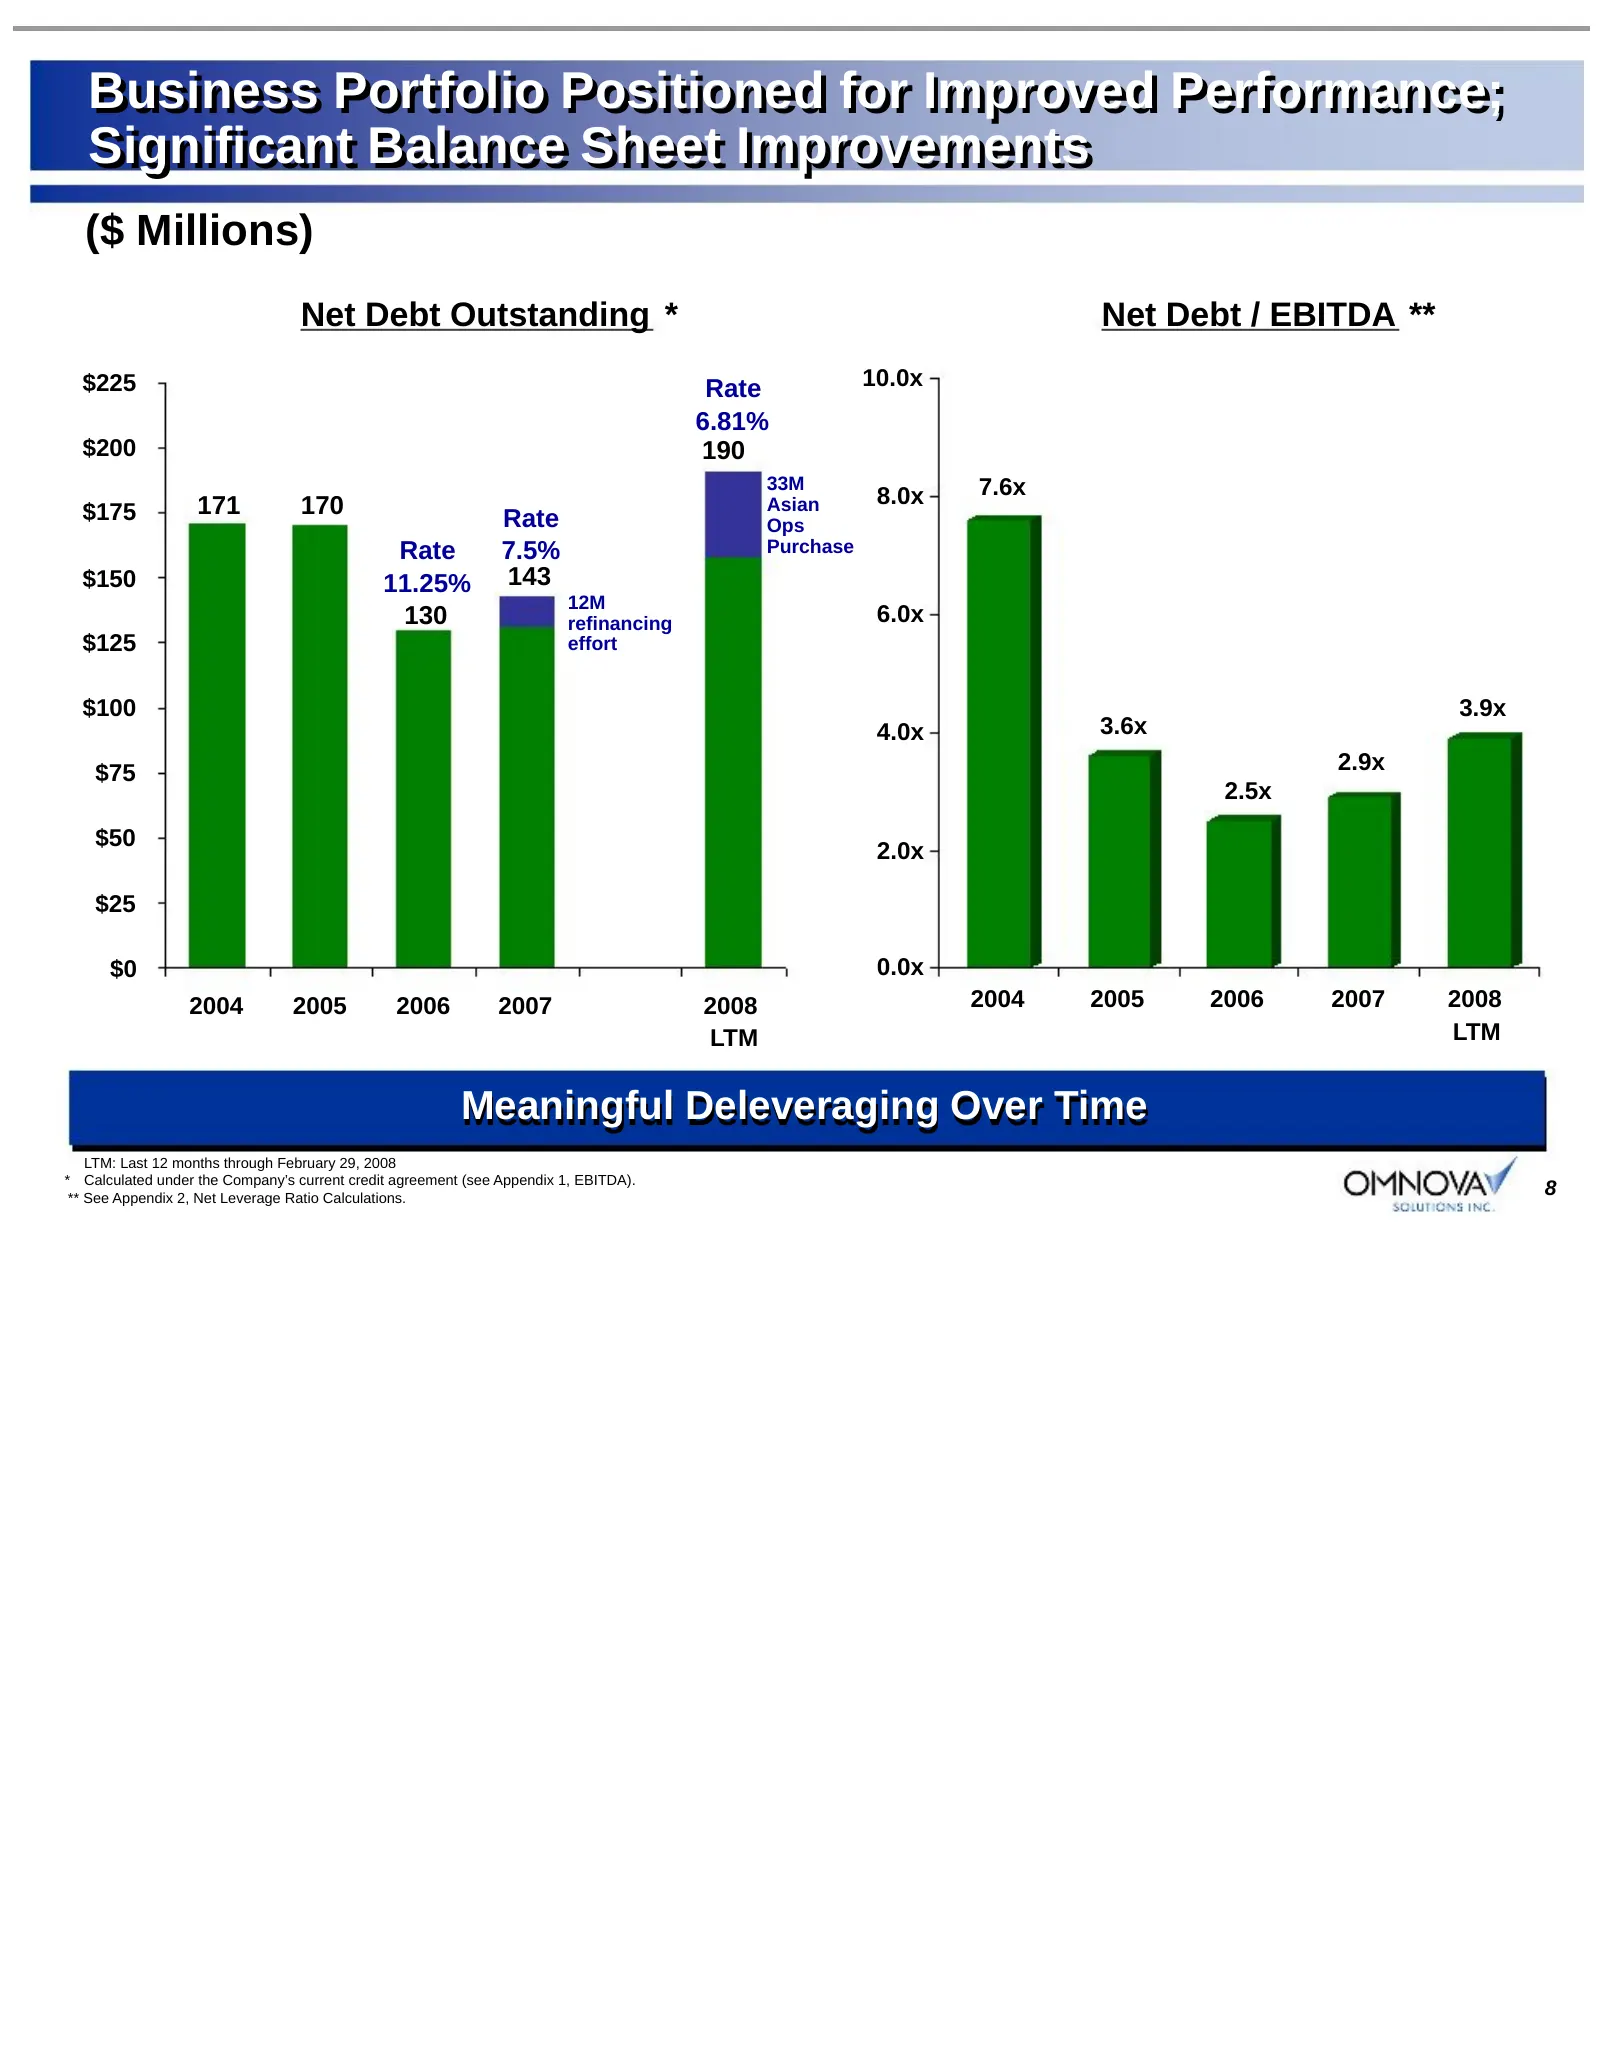
Slide 8: Business Portfolio Positioned for Improved Performance; Significant Balance Sheet Improvements
Business Portfolio Positioned for Improved Performance; Significant Balance Sheet Improvements ($ Millions) Net Debt Outstanding * Net Debt / EBITDA ** $225 Rate 10.0x 6.81% $200 190 33M 7.6x 171 170 Asian 8.0x $175 Rate Ops Rate 7.5% Purchase $150 11.25% 143 12M 130 refinancing 6.0x $125 effort $10
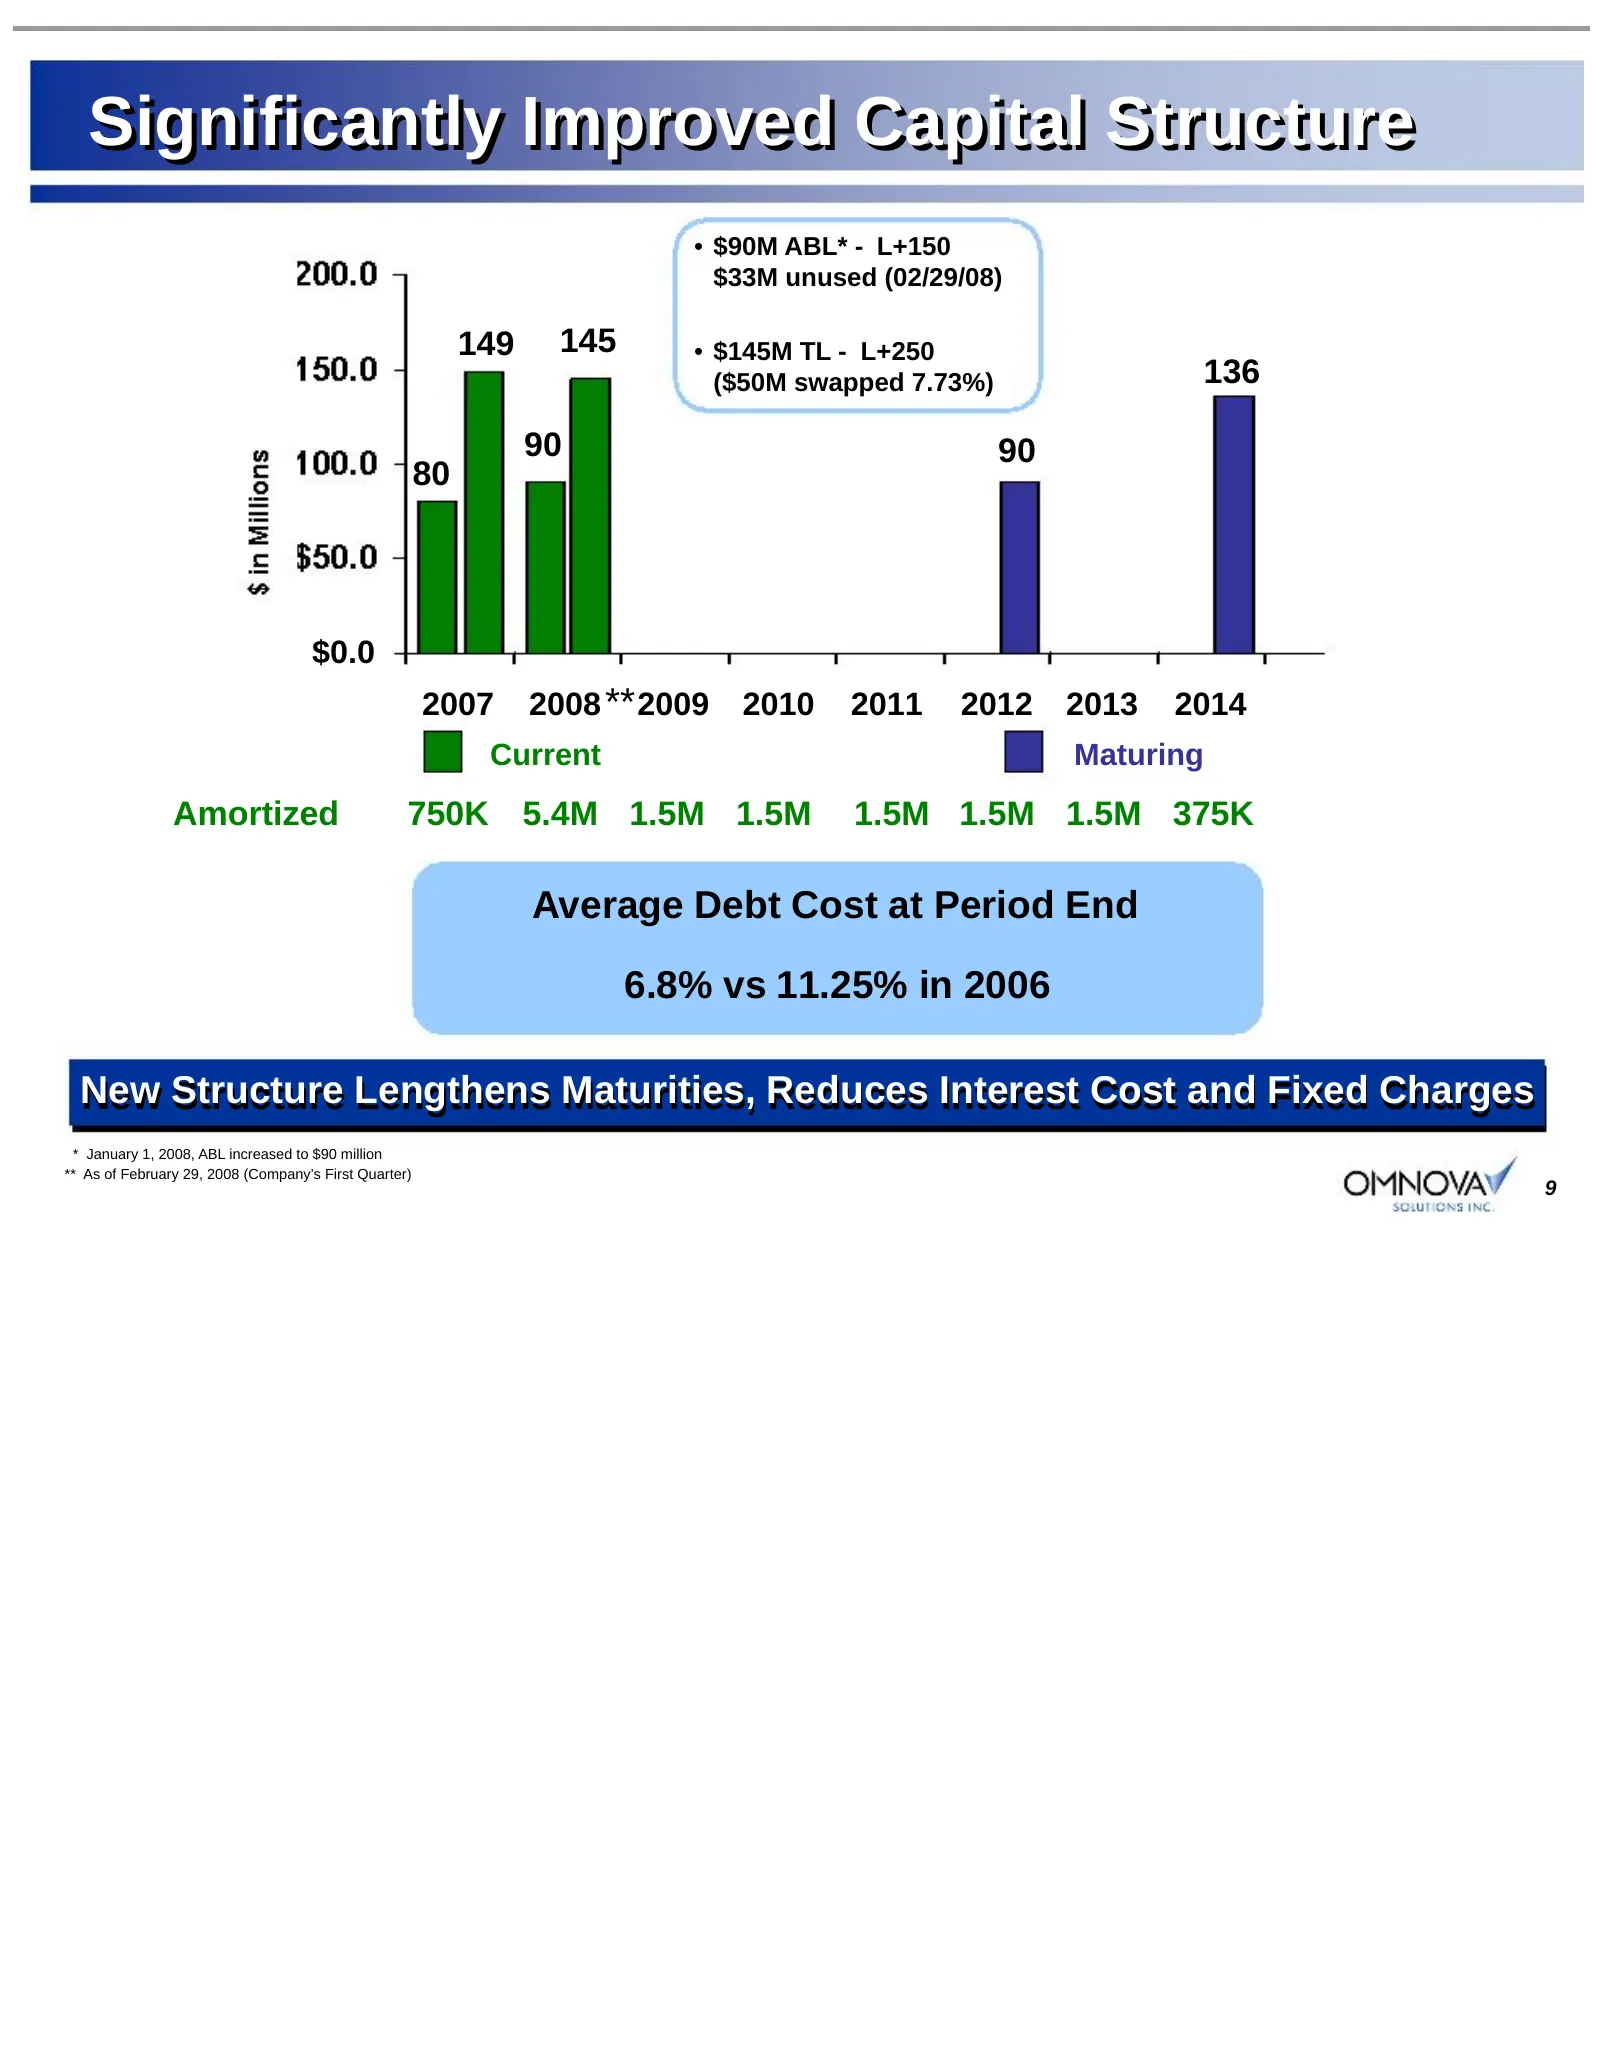
Slide 9: Significantly Improved Capital Structure
Significantly Improved Capital Structure • $90M ABL* - L+150 $33M unused (02/29/08) 149 145 • $145M TL - L+250 ($50M swapped 7.73%) 136 90 90 80 $0.0 2007 2008 ** 2009 2010 2011 2012 2013 2014 Current Maturing Amortized 750K 5.4M 1.5M 1.5M 1.5M 1.5M 1.5M 375K Average Debt Cost at Period End 6.8% vs
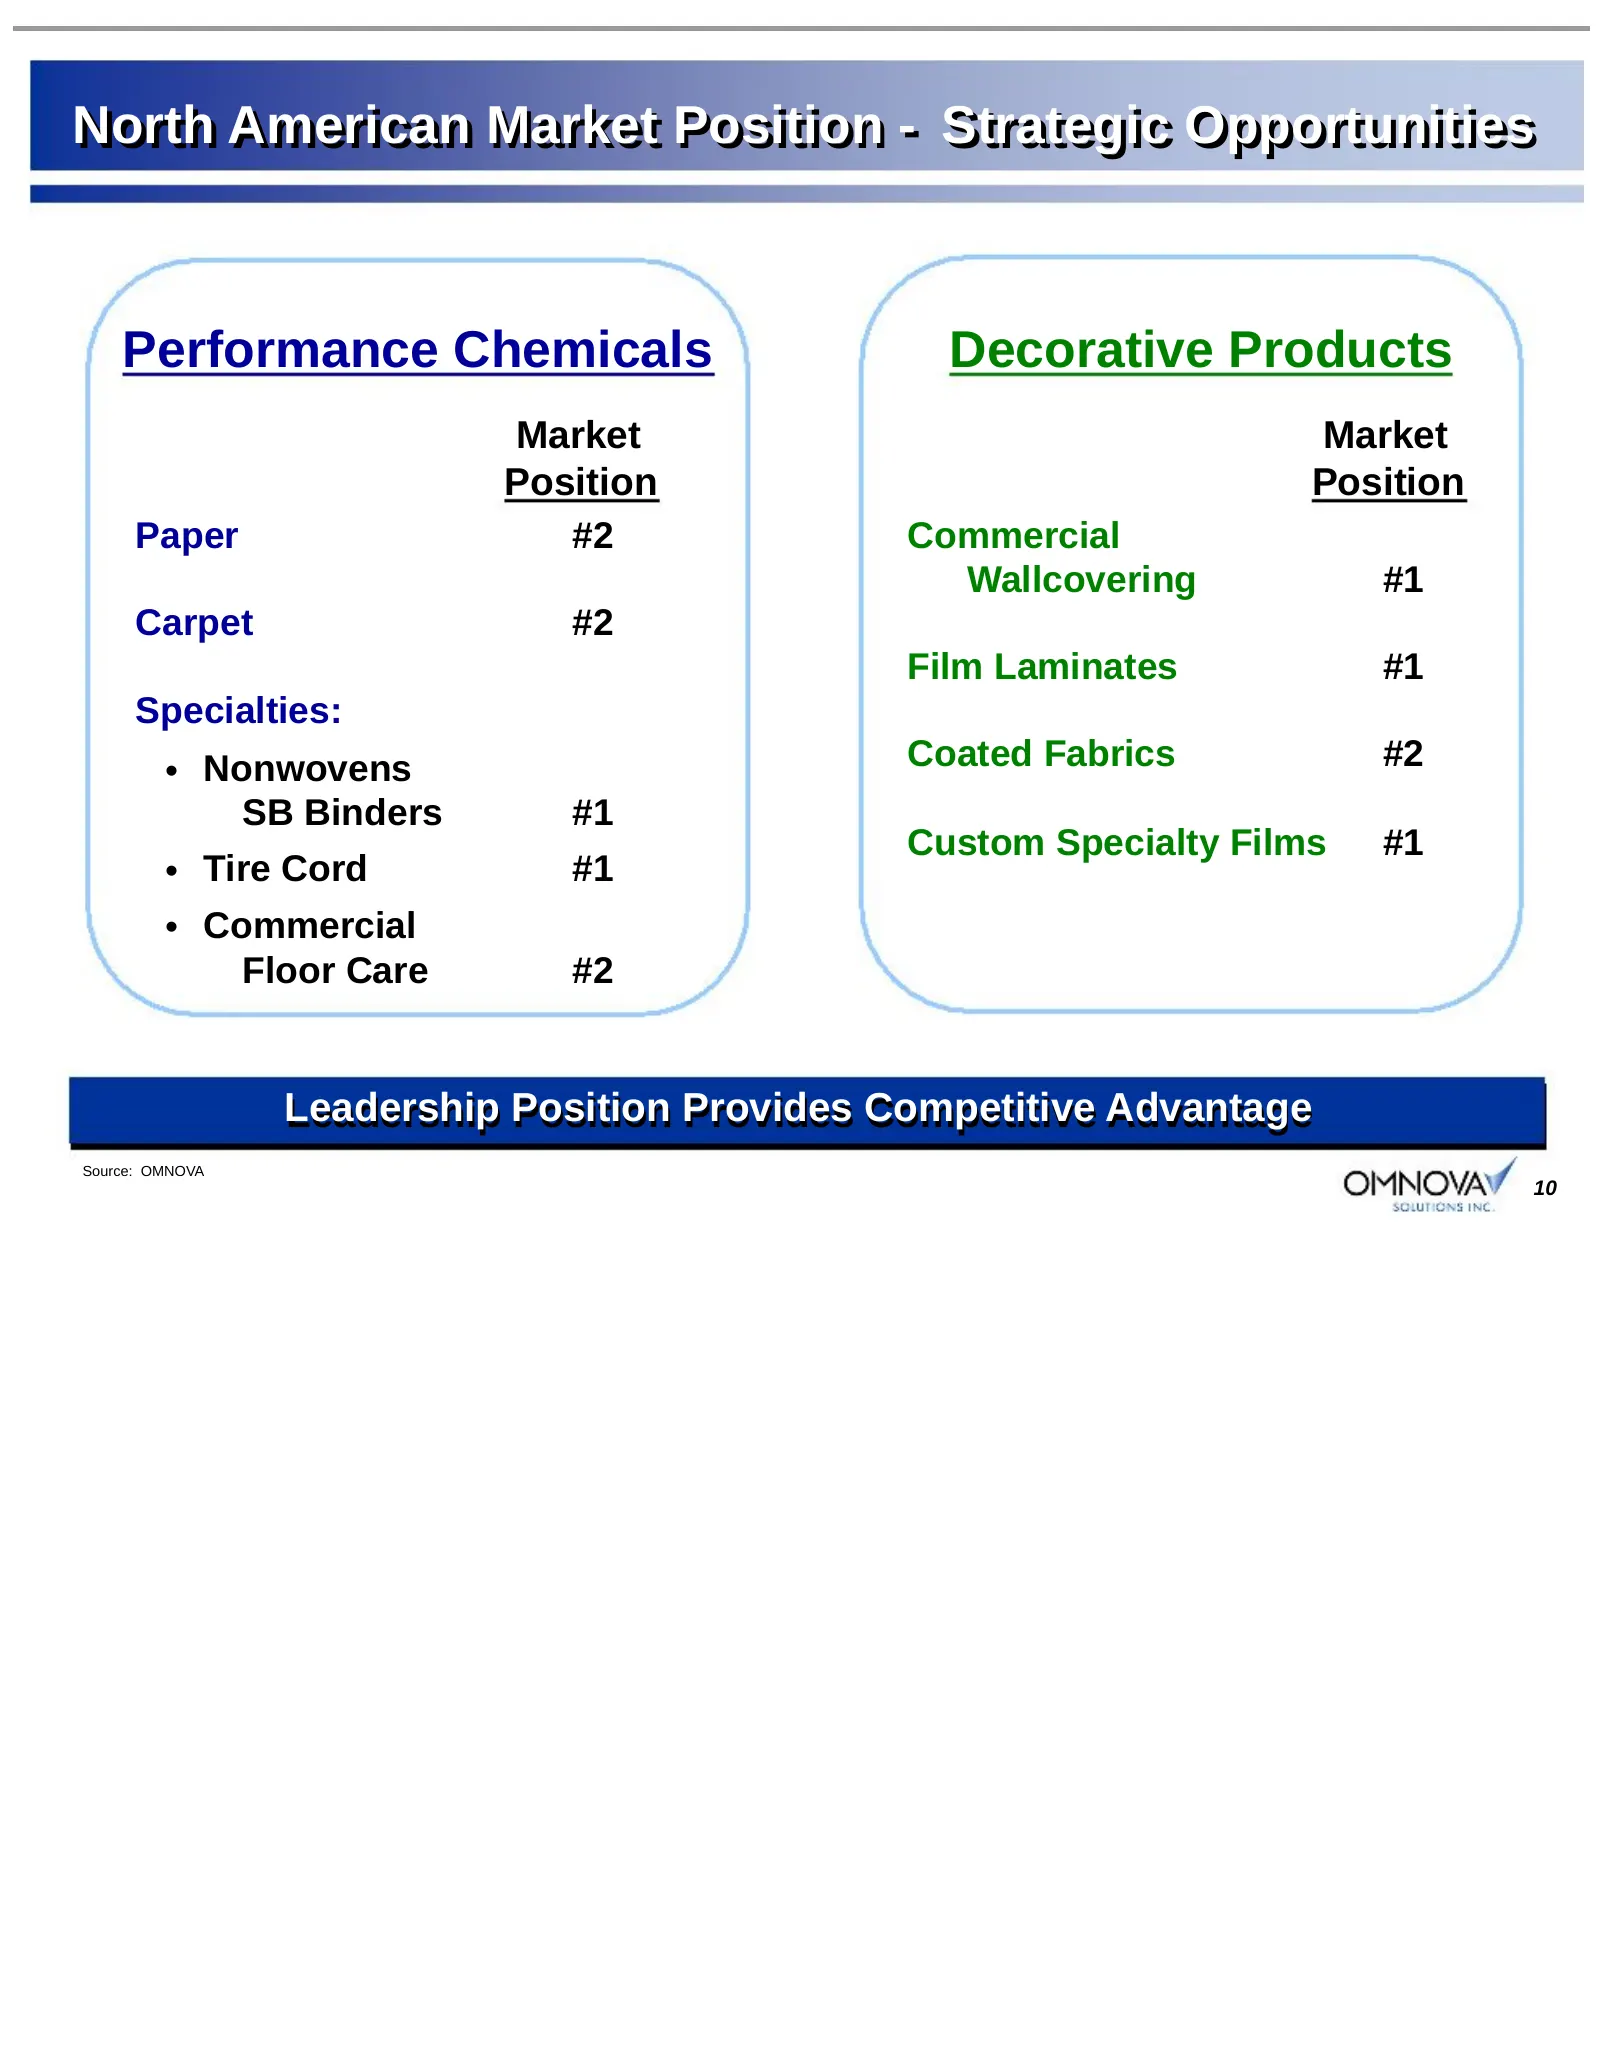
Slide 10: North American Market Position - Strategic Opportunities
North American Market Position - Strategic Opportunities Performance Chemicals Decorative Products Market Market Position Position Paper #2 Commercial Wallcovering #1 Carpet #2 Film Laminates #1 Specialties: • Nonwovens Coated Fabrics #2 SB Binders #1 Custom Specialty Films #1 • Tire Cord #1 • Comme
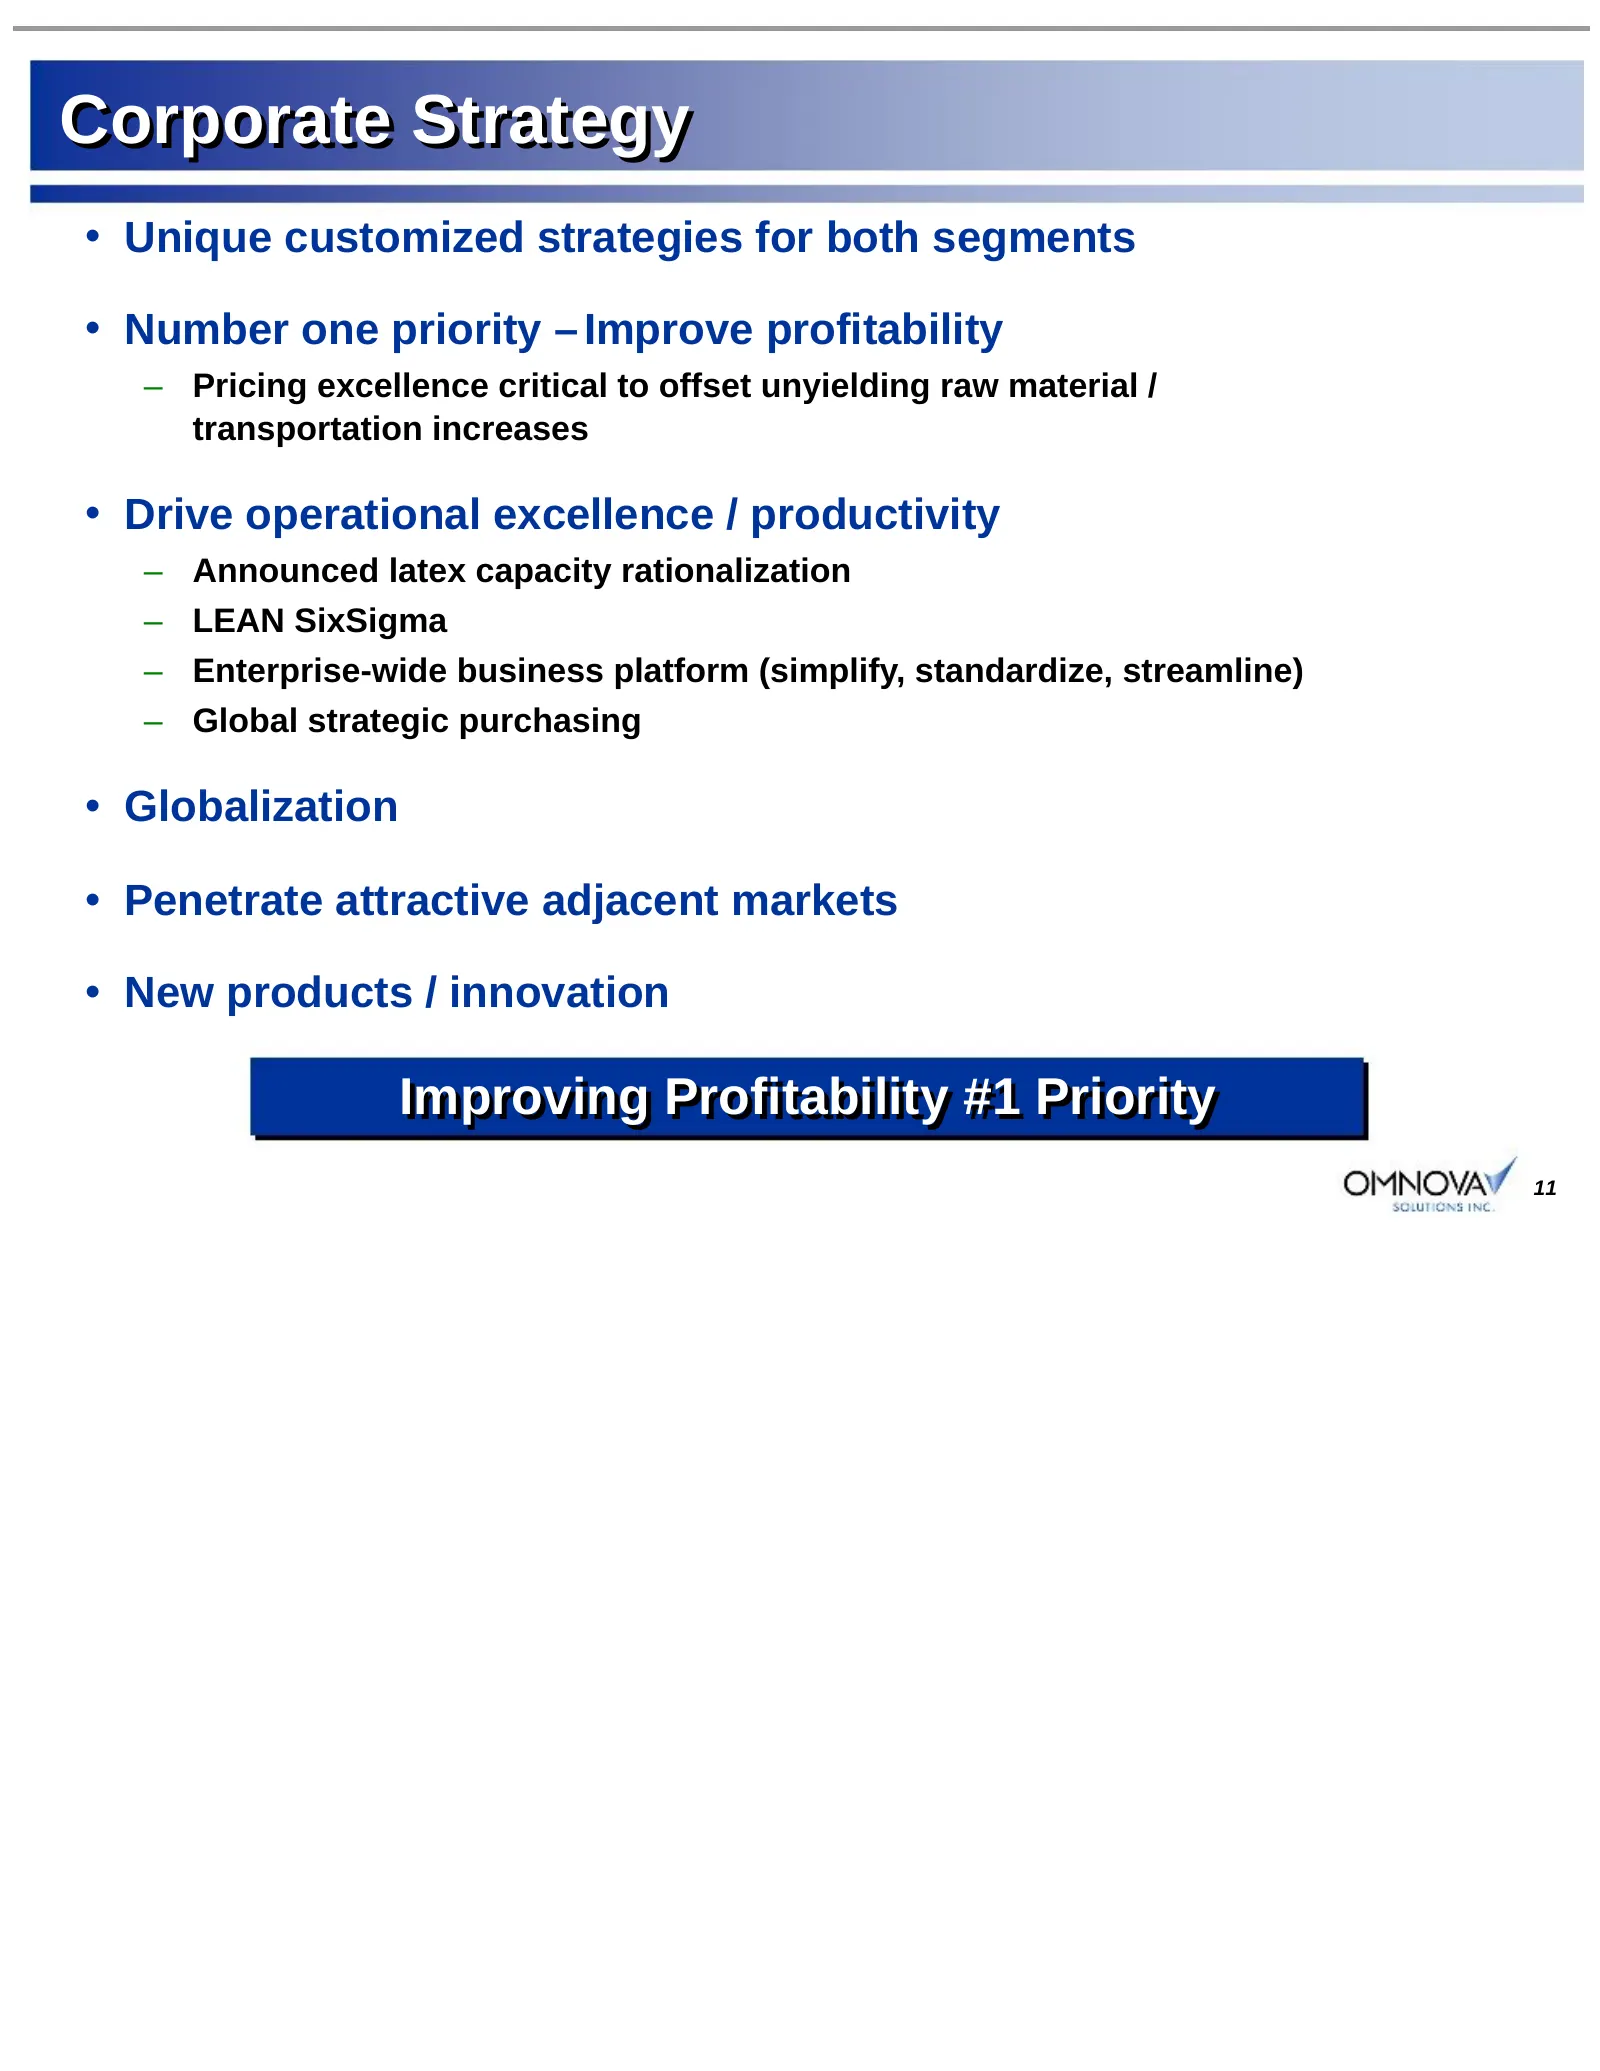
Slide 11: Corporate Strategy
Corporate Strategy • Unique customized strategies for both segments • Number one priority – Improve profitability – Pricing excellence critical to offset unyielding raw material / transportation increases • Drive operational excellence / productivity – Announced latex capacity rationalization – LEAN
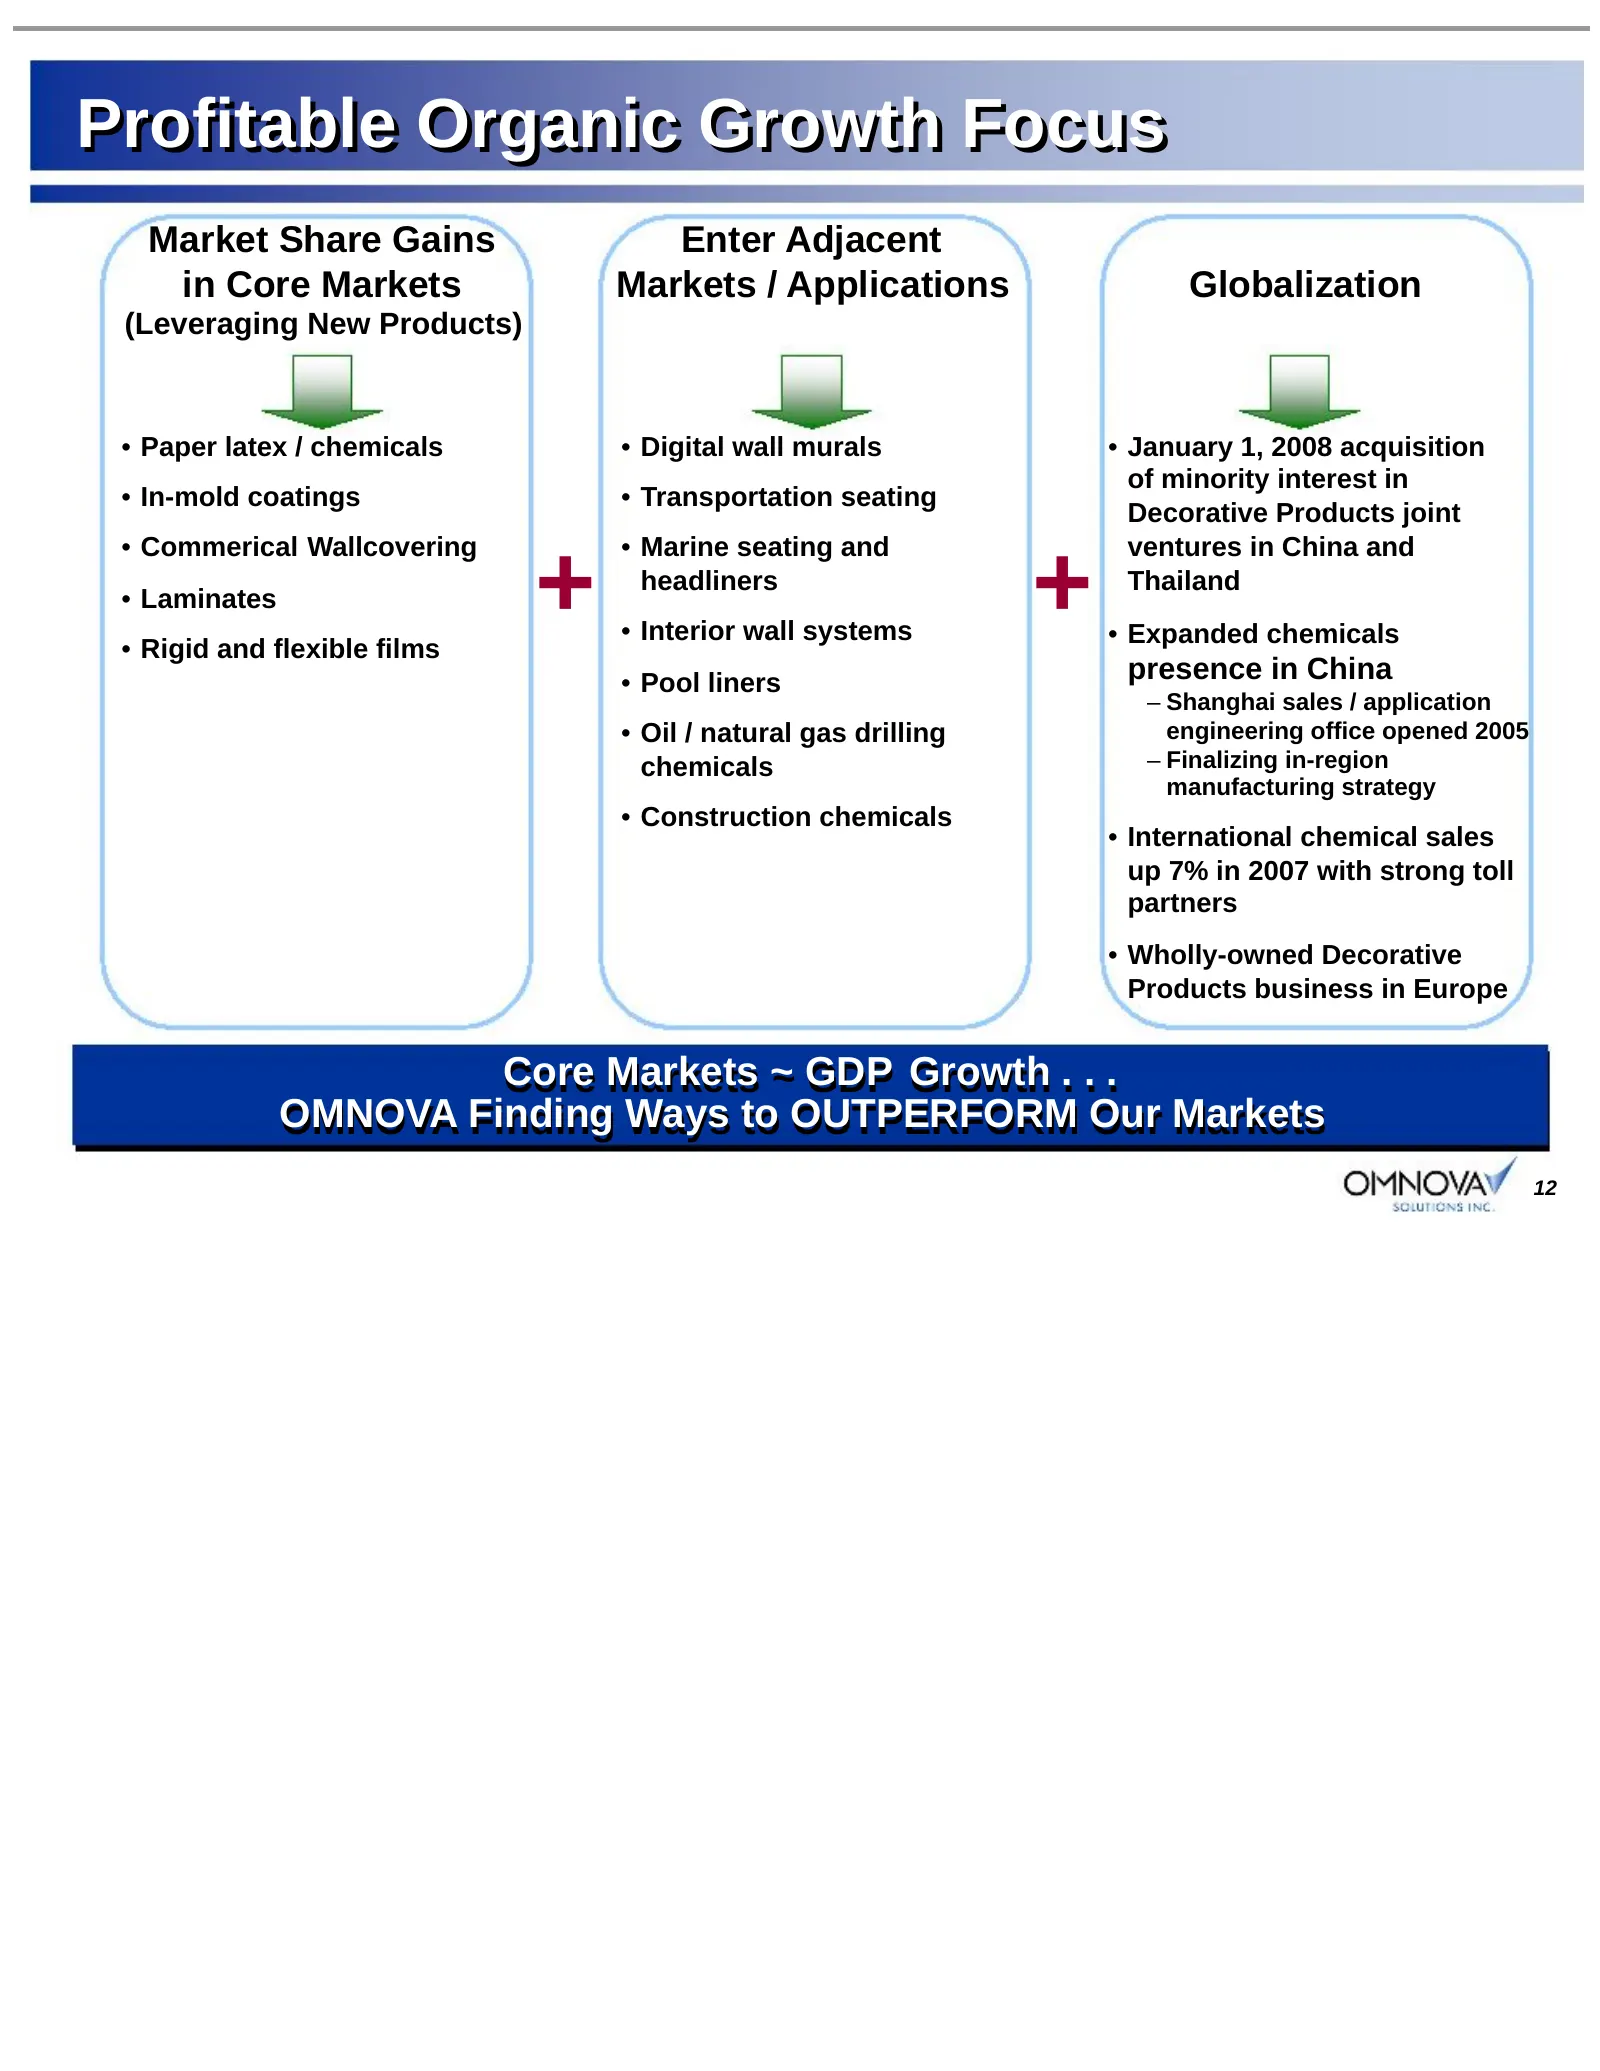
Slide 12: Profitable Organic Growth Focus
Profitable Organic Growth Focus Market Share Gains Enter Adjacent in Core Markets Markets / Applications Globalization (Leveraging New Products) • Paper latex / chemicals • Digital wall murals • January 1, 2008 acquisition of minority interest in • In-mold coatings • Transportation seating Decorativ
Slide 13: Operational Highlights
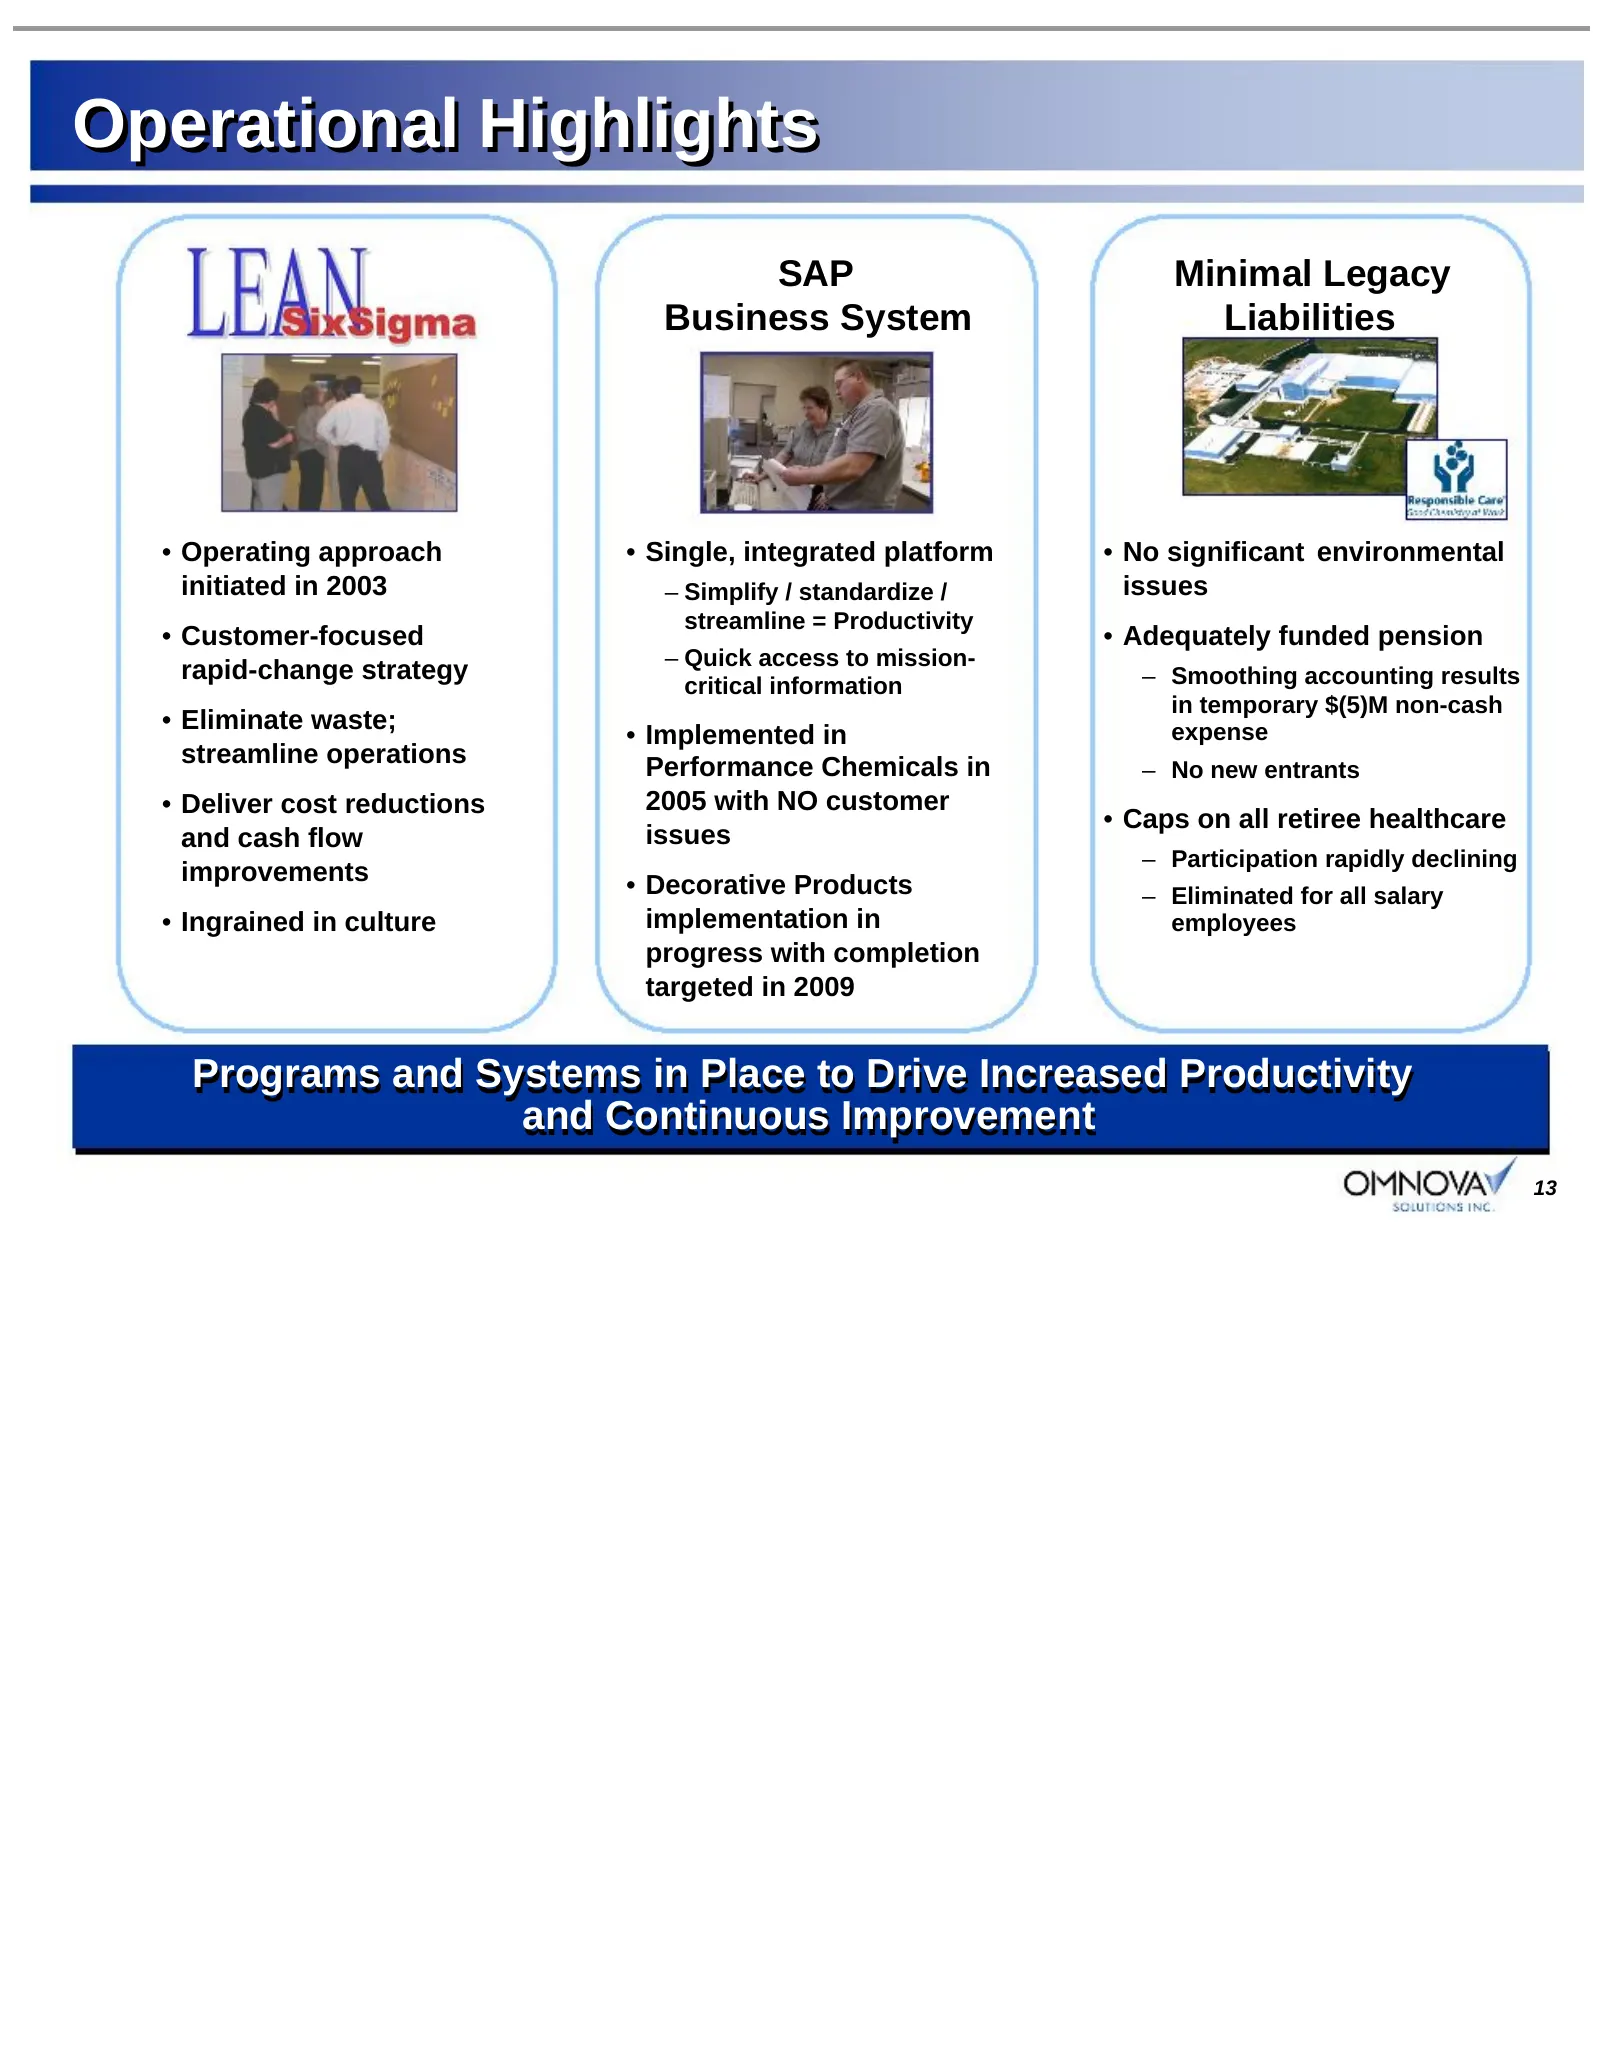
Operational Highlights SAP Minimal Legacy Business System Liabilities • Operating approach • Single, integrated platform • No significant environmental initiated in 2003 – Simplify / standardize / issues streamline = Productivity • Customer-focused • Adequately funded pension – Quick access to missi
Slide 14: Decorative Products Segment
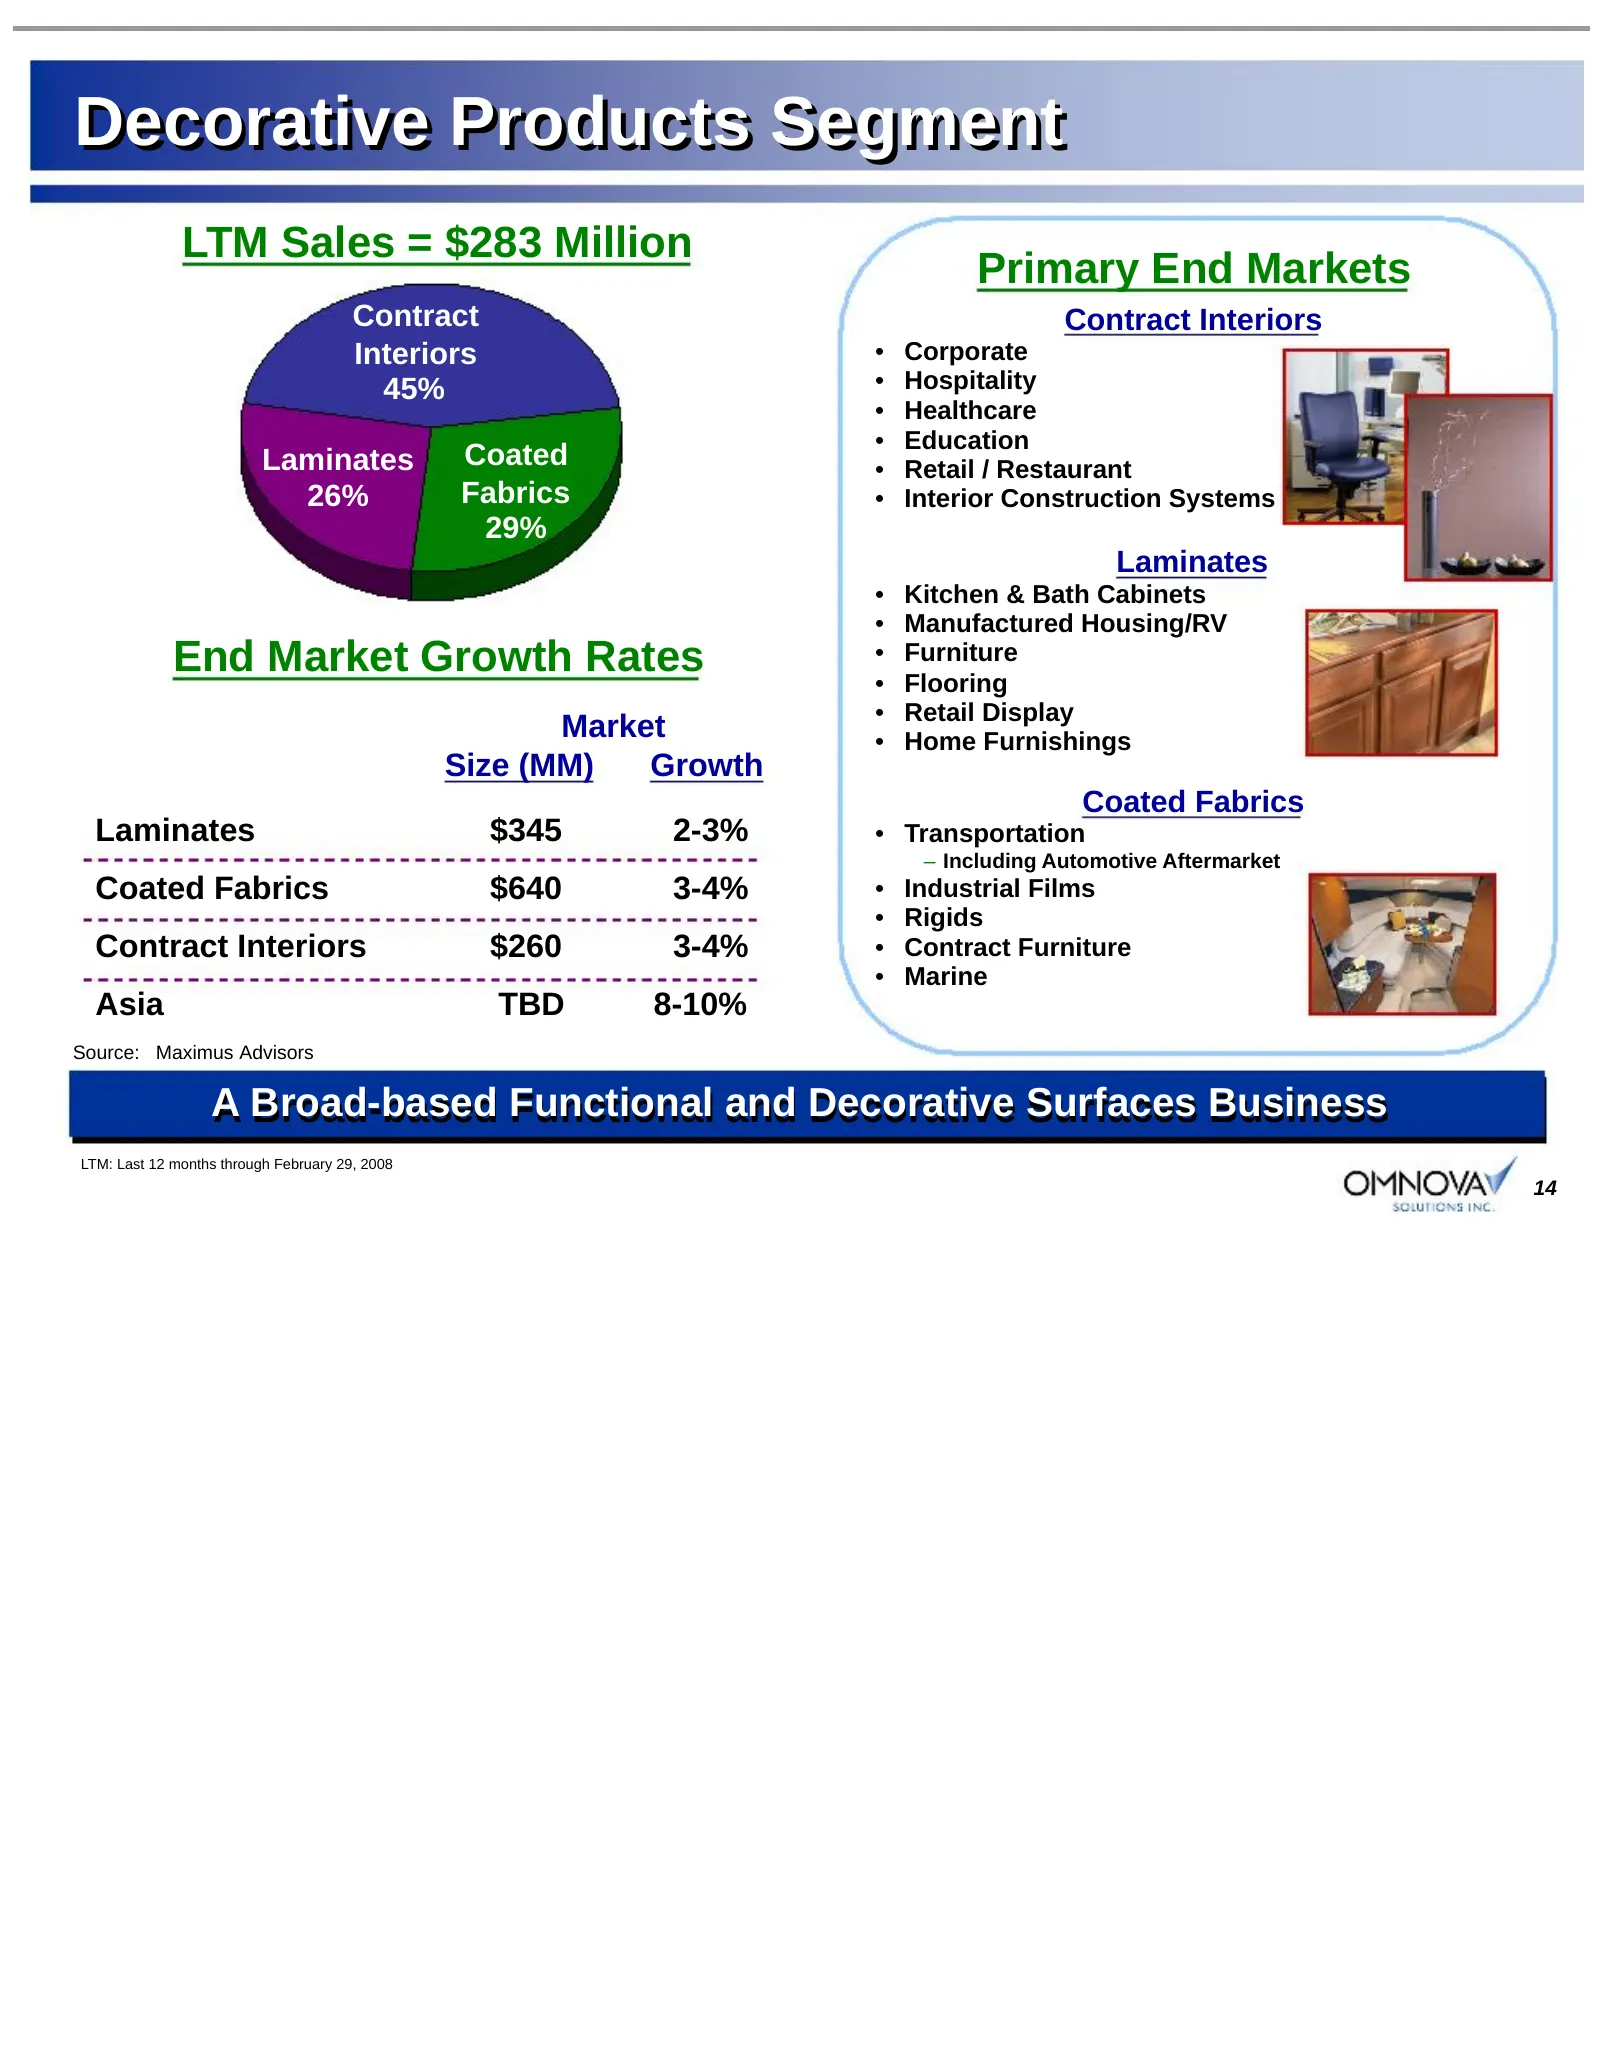
Decorative Products Segment LTM Sales = $283 Million Primary End Markets Contract Contract Interiors Interiors • Corporate 45% • Hospitality • Healthcare • Education Laminates Coated • Retail / Restaurant 26% Fabrics • Interior Construction Systems 29% Laminates • Kitchen & Bath Cabinets • Manufactu
Slide 15: Decorative Products - End Uses
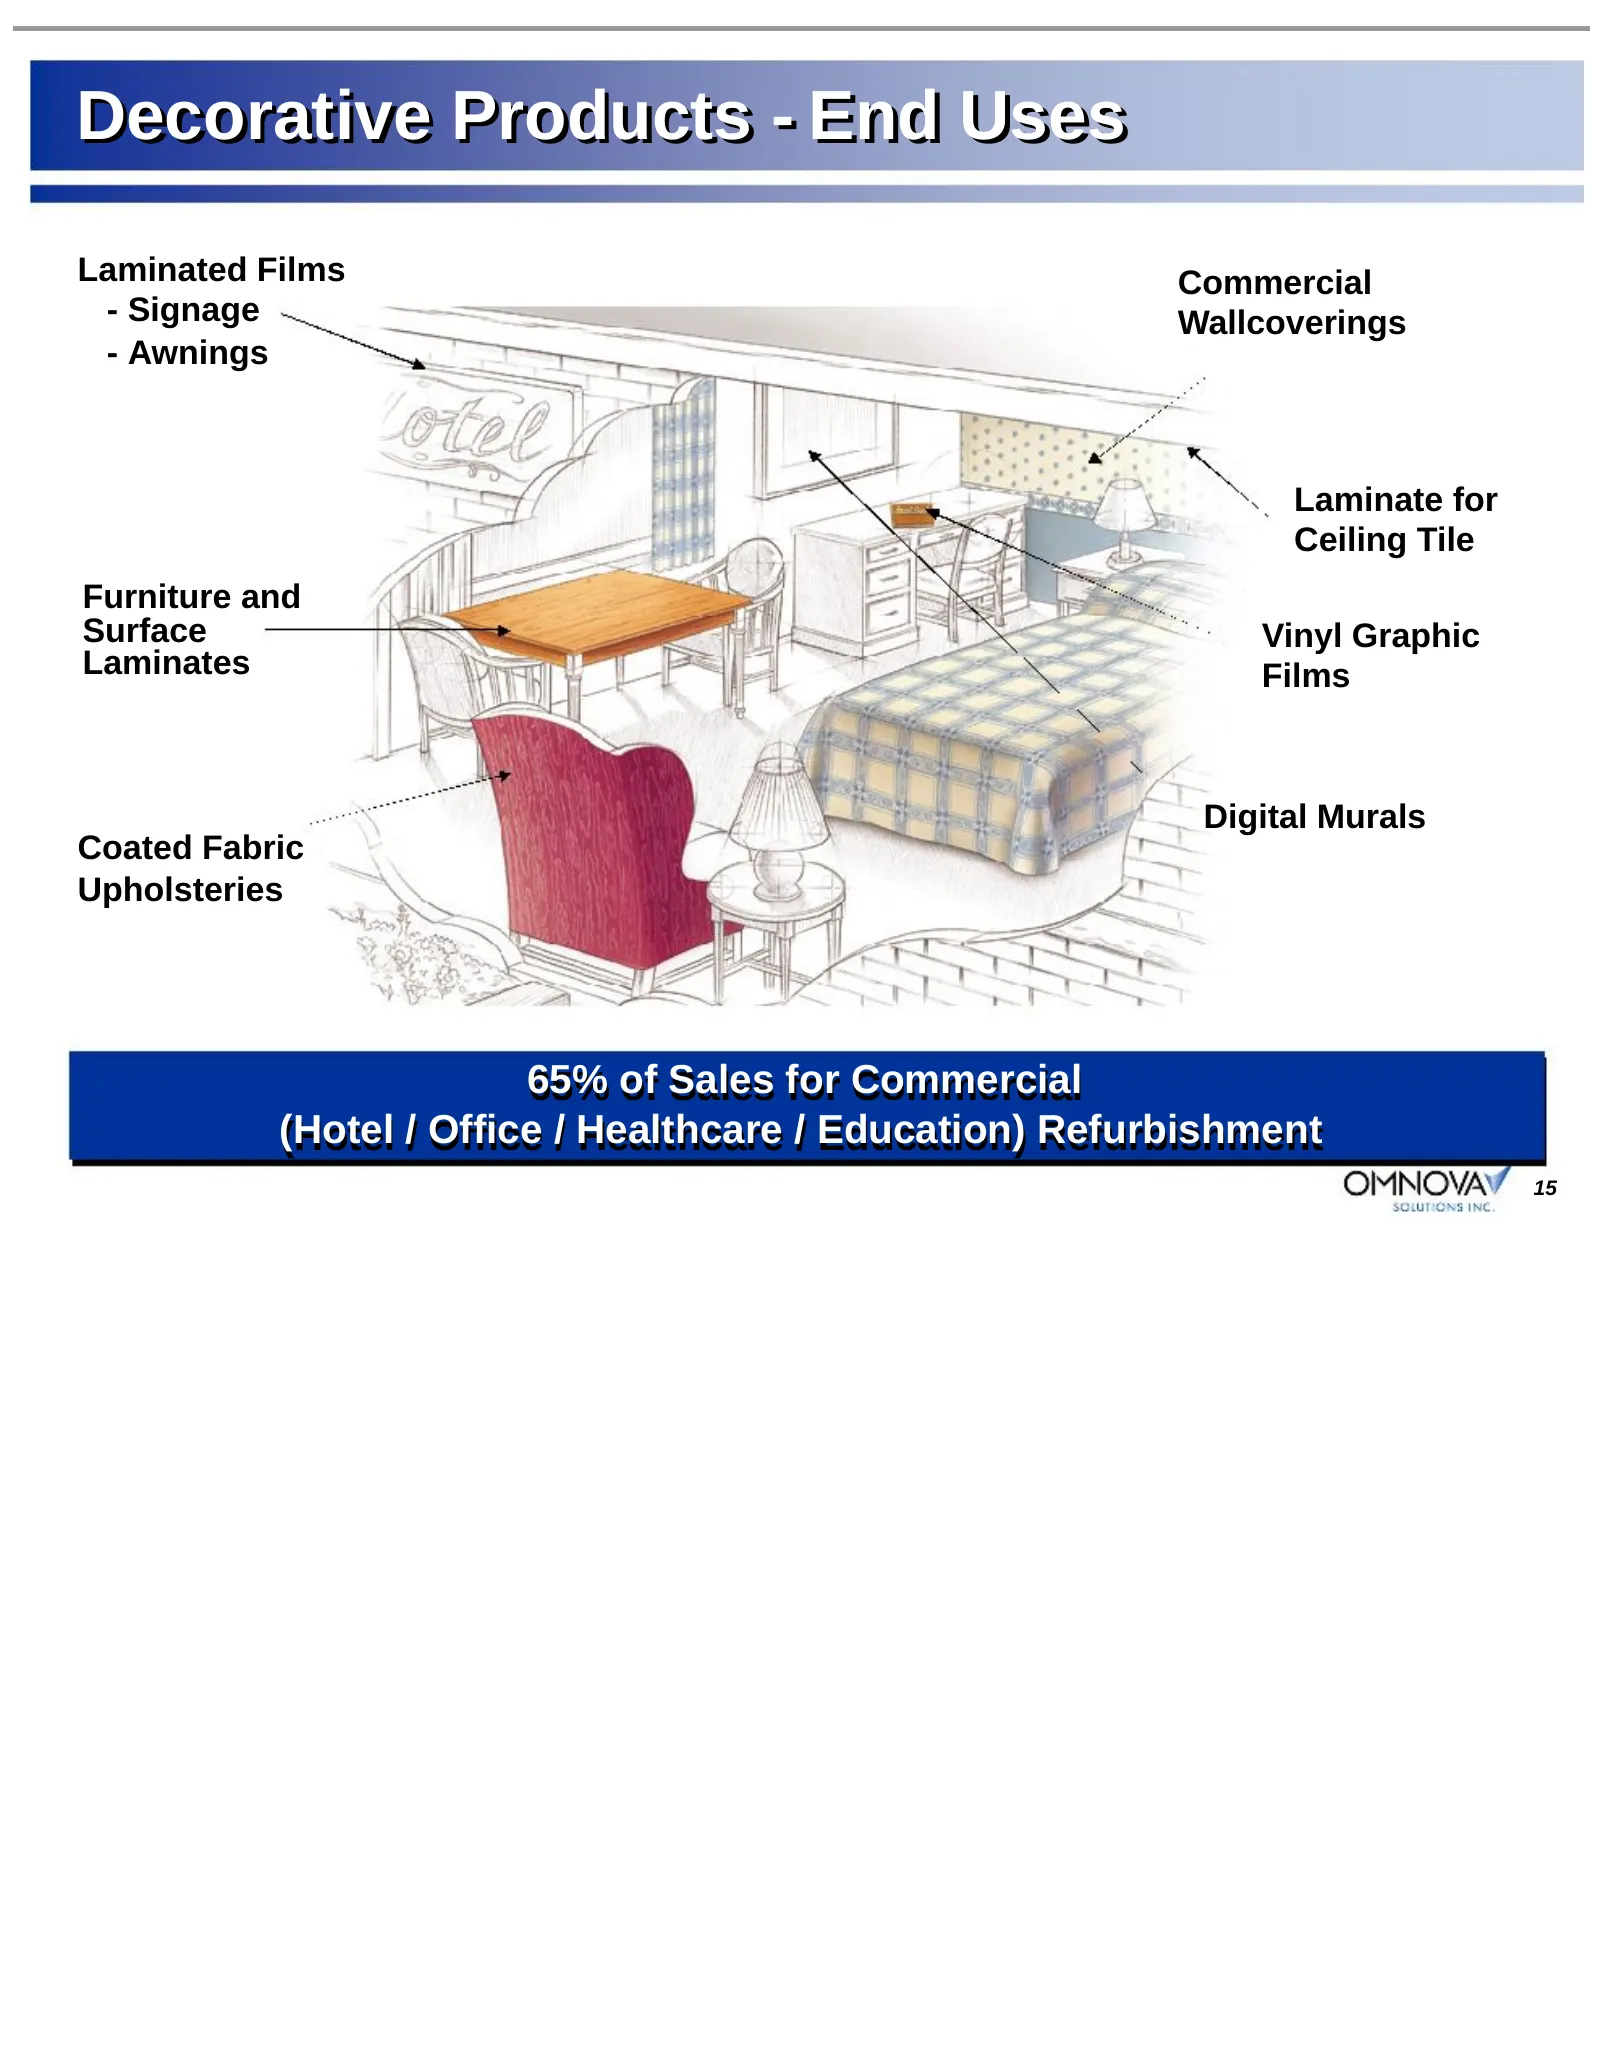
Decorative Products - End Uses Laminated Films Commercial - Signage Wallcoverings - Awnings Laminate for Ceiling Tile Furniture and Surface Vinyl Graphic Laminates Films Digital Murals Coated Fabric Upholsteries 65% of Sales for Commercial (Hotel / Office / Healthcare / Education) Refurbishment 15
Slide 16: Decorative Products - Key Economic Drivers
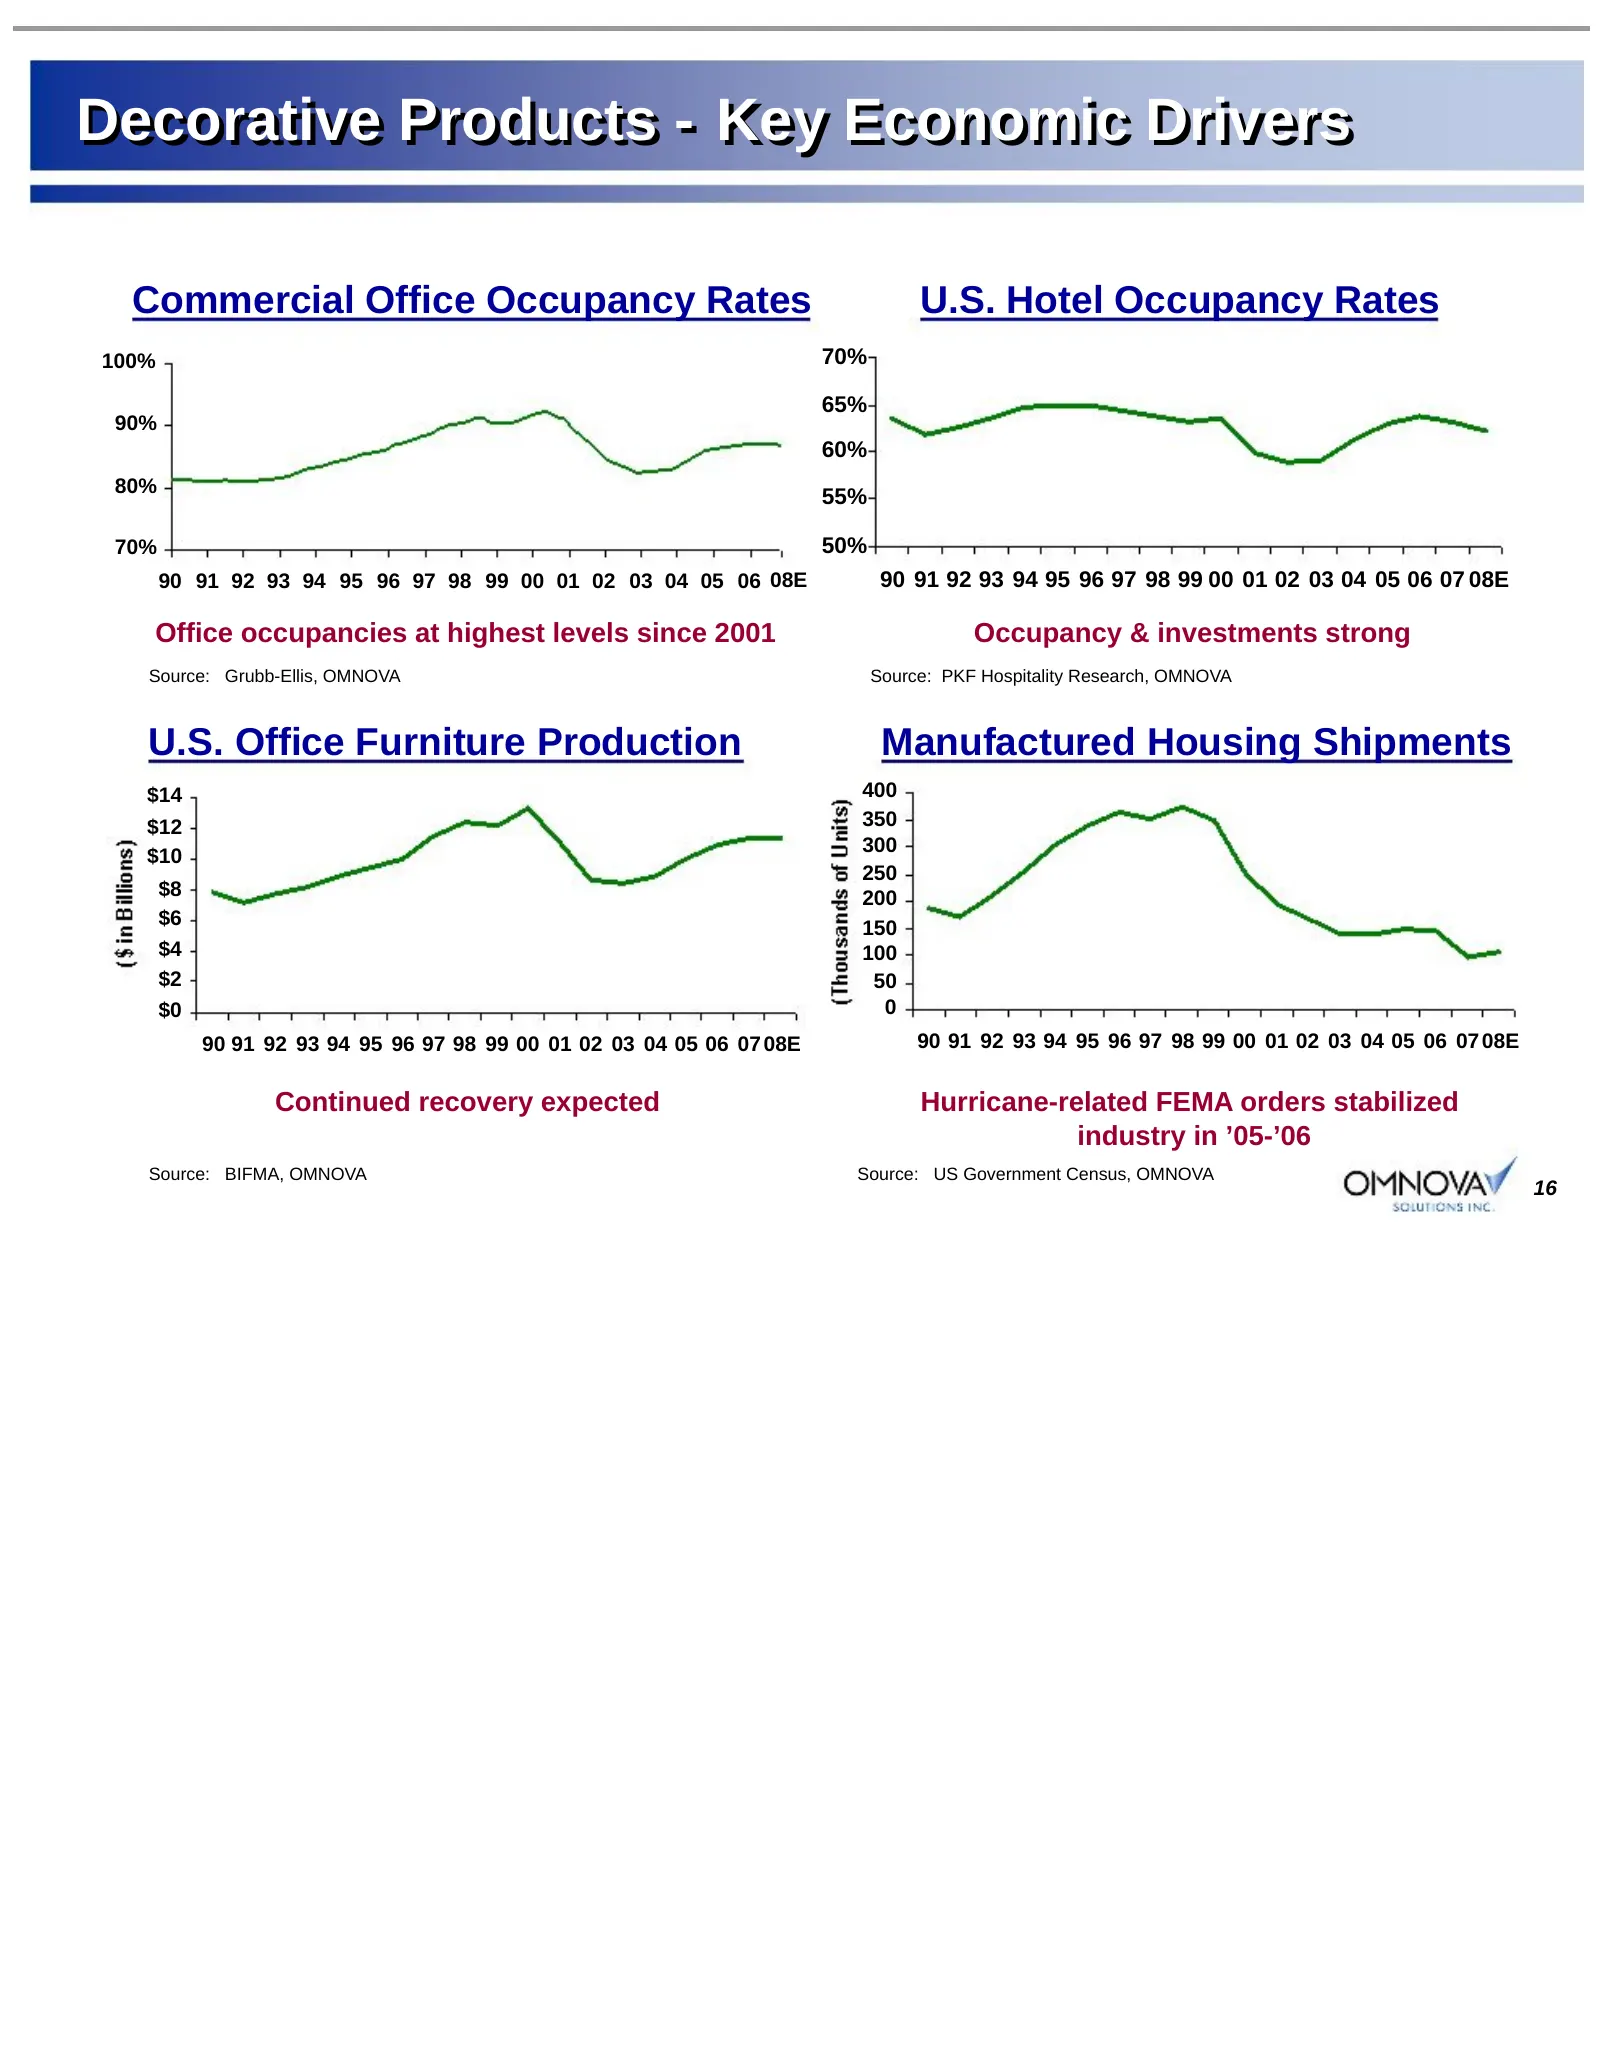
Decorative Products - Key Economic Drivers Commercial Office Occupancy Rates U.S. Hotel Occupancy Rates 100% 70% 65% 90% 60% 80% 55% 70% 50% 90 91 92 93 94 95 96 97 98 99 00 01 02 03 04 05 06 08E 90 91 92 93 94 95 96 97 98 99 00 01 02 03 04 05 06 07 08E Office occupancies at highest levels since 200
Slide 17: Decorative Products - Facilities
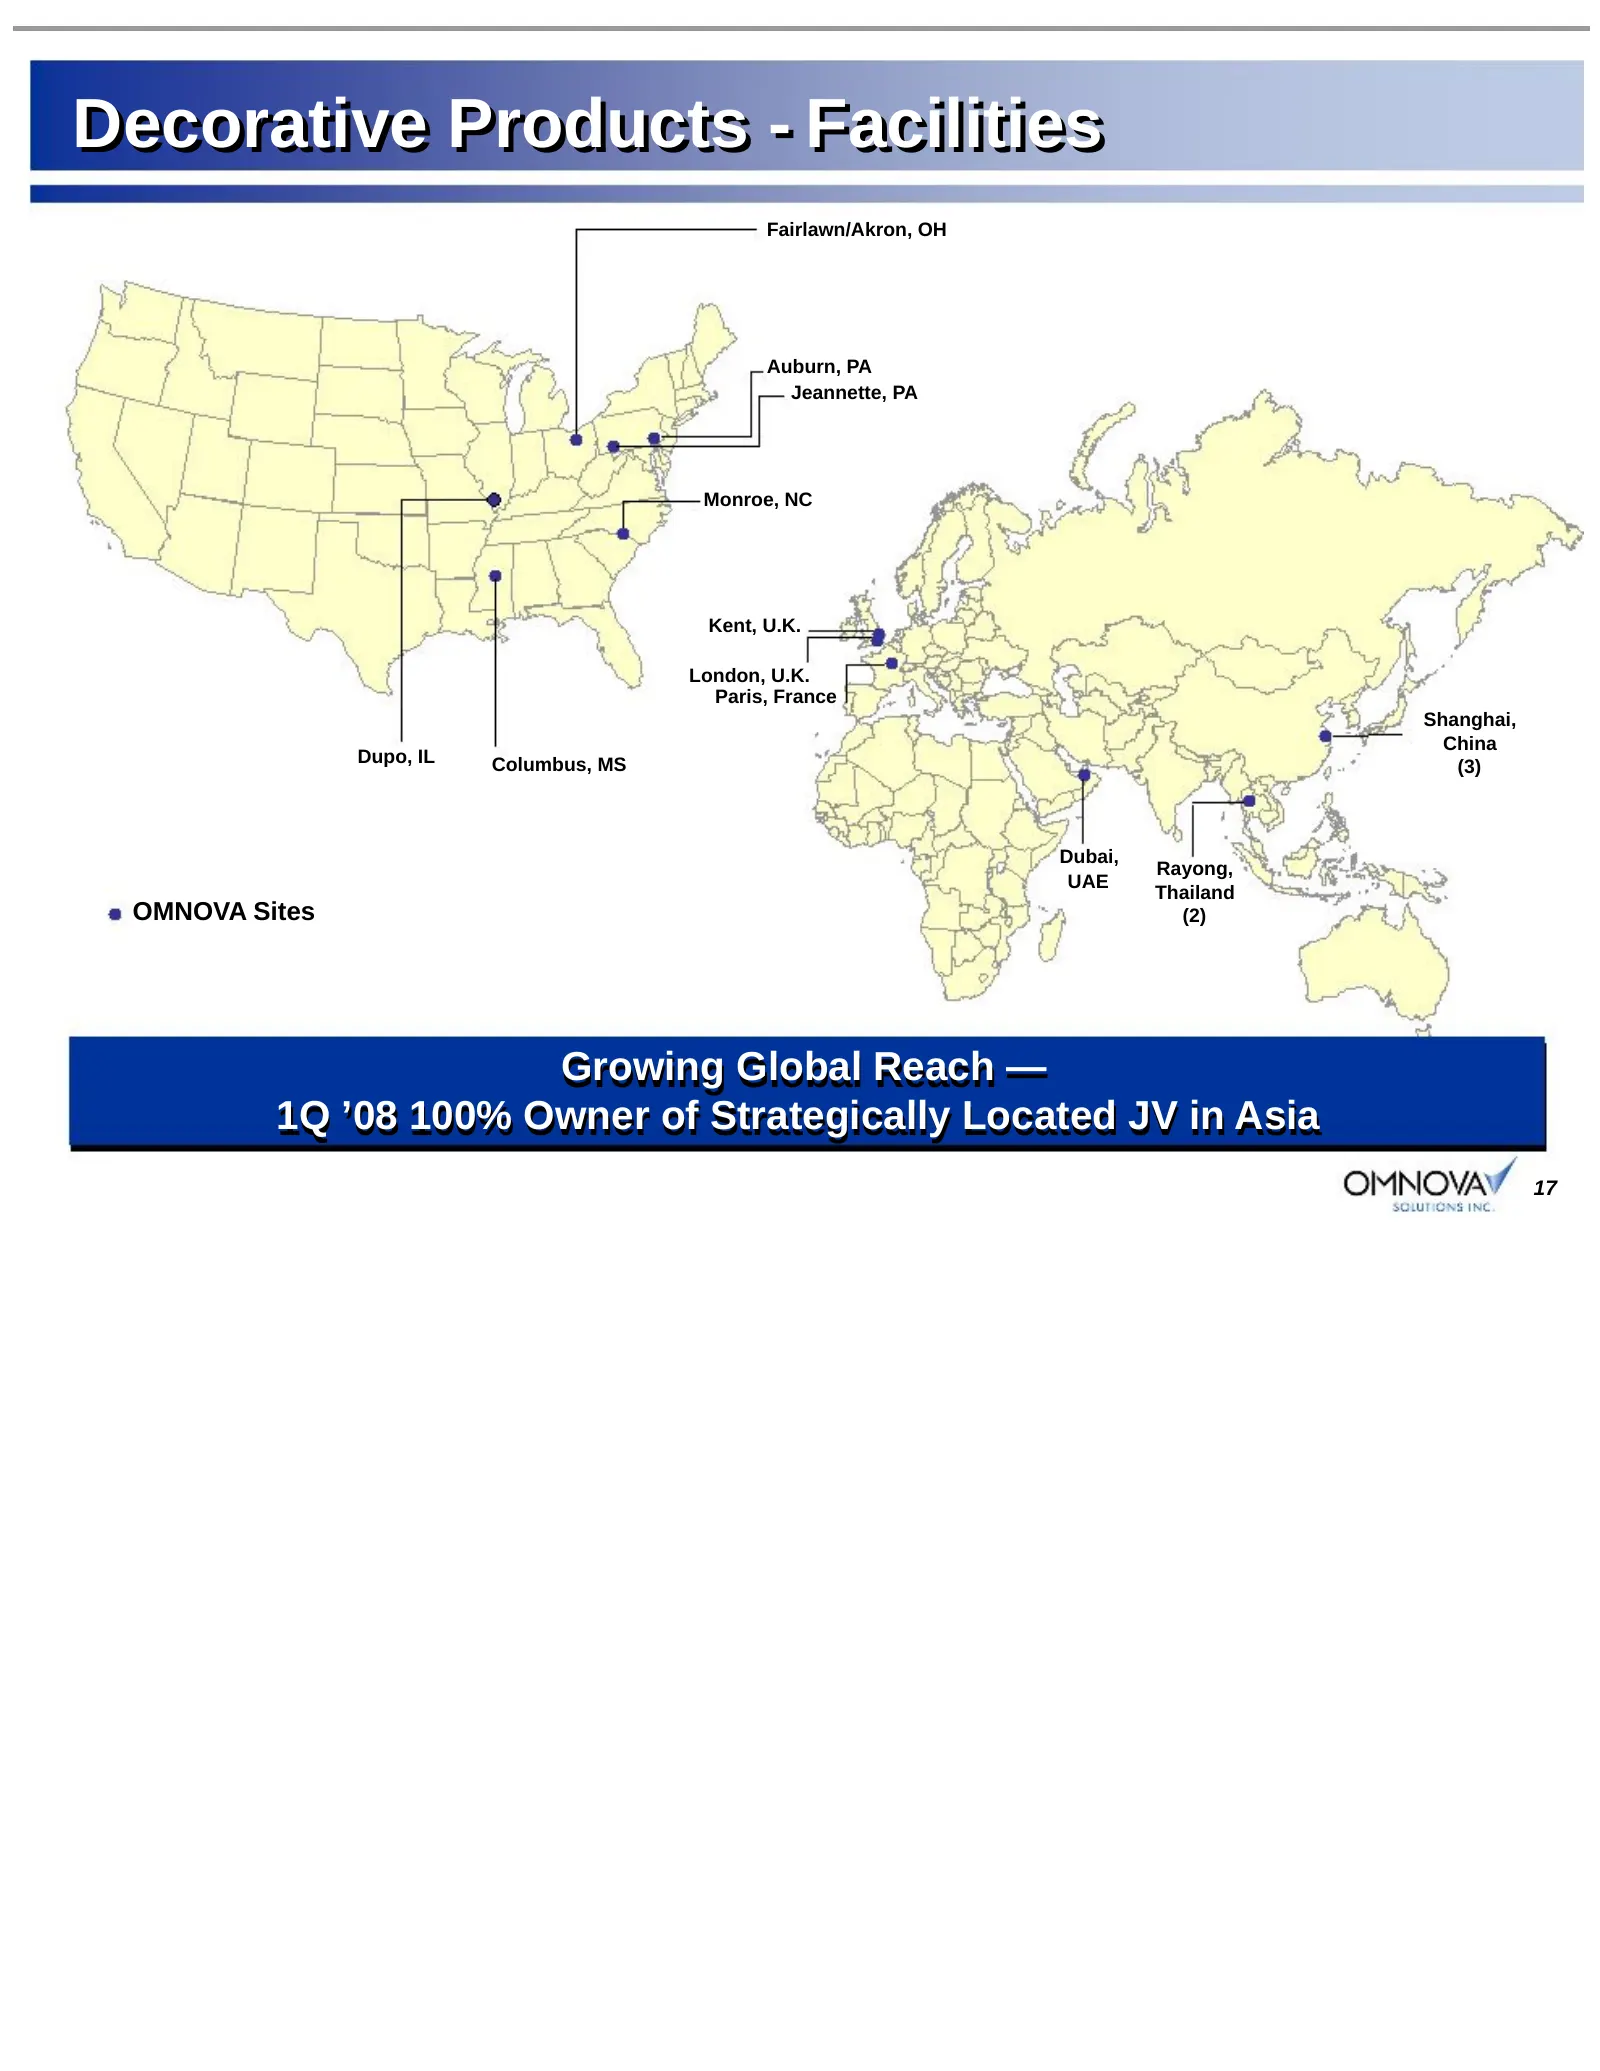
Decorative Products - Facilities Fairlawn/Akron, OH Auburn, PA Jeannette, PA Monroe, NC Kent, U.K. London, U.K. Paris, France Shanghai, China Dupo, IL Columbus, MS (3) Dubai, Rayong, UAE Thailand OMNOVA Sites (2) Growing Global Reach — 1Q ’08 100% Owner of Strategically Located JV in Asia 17
Slide 18: Decorative Products – Asian Operations
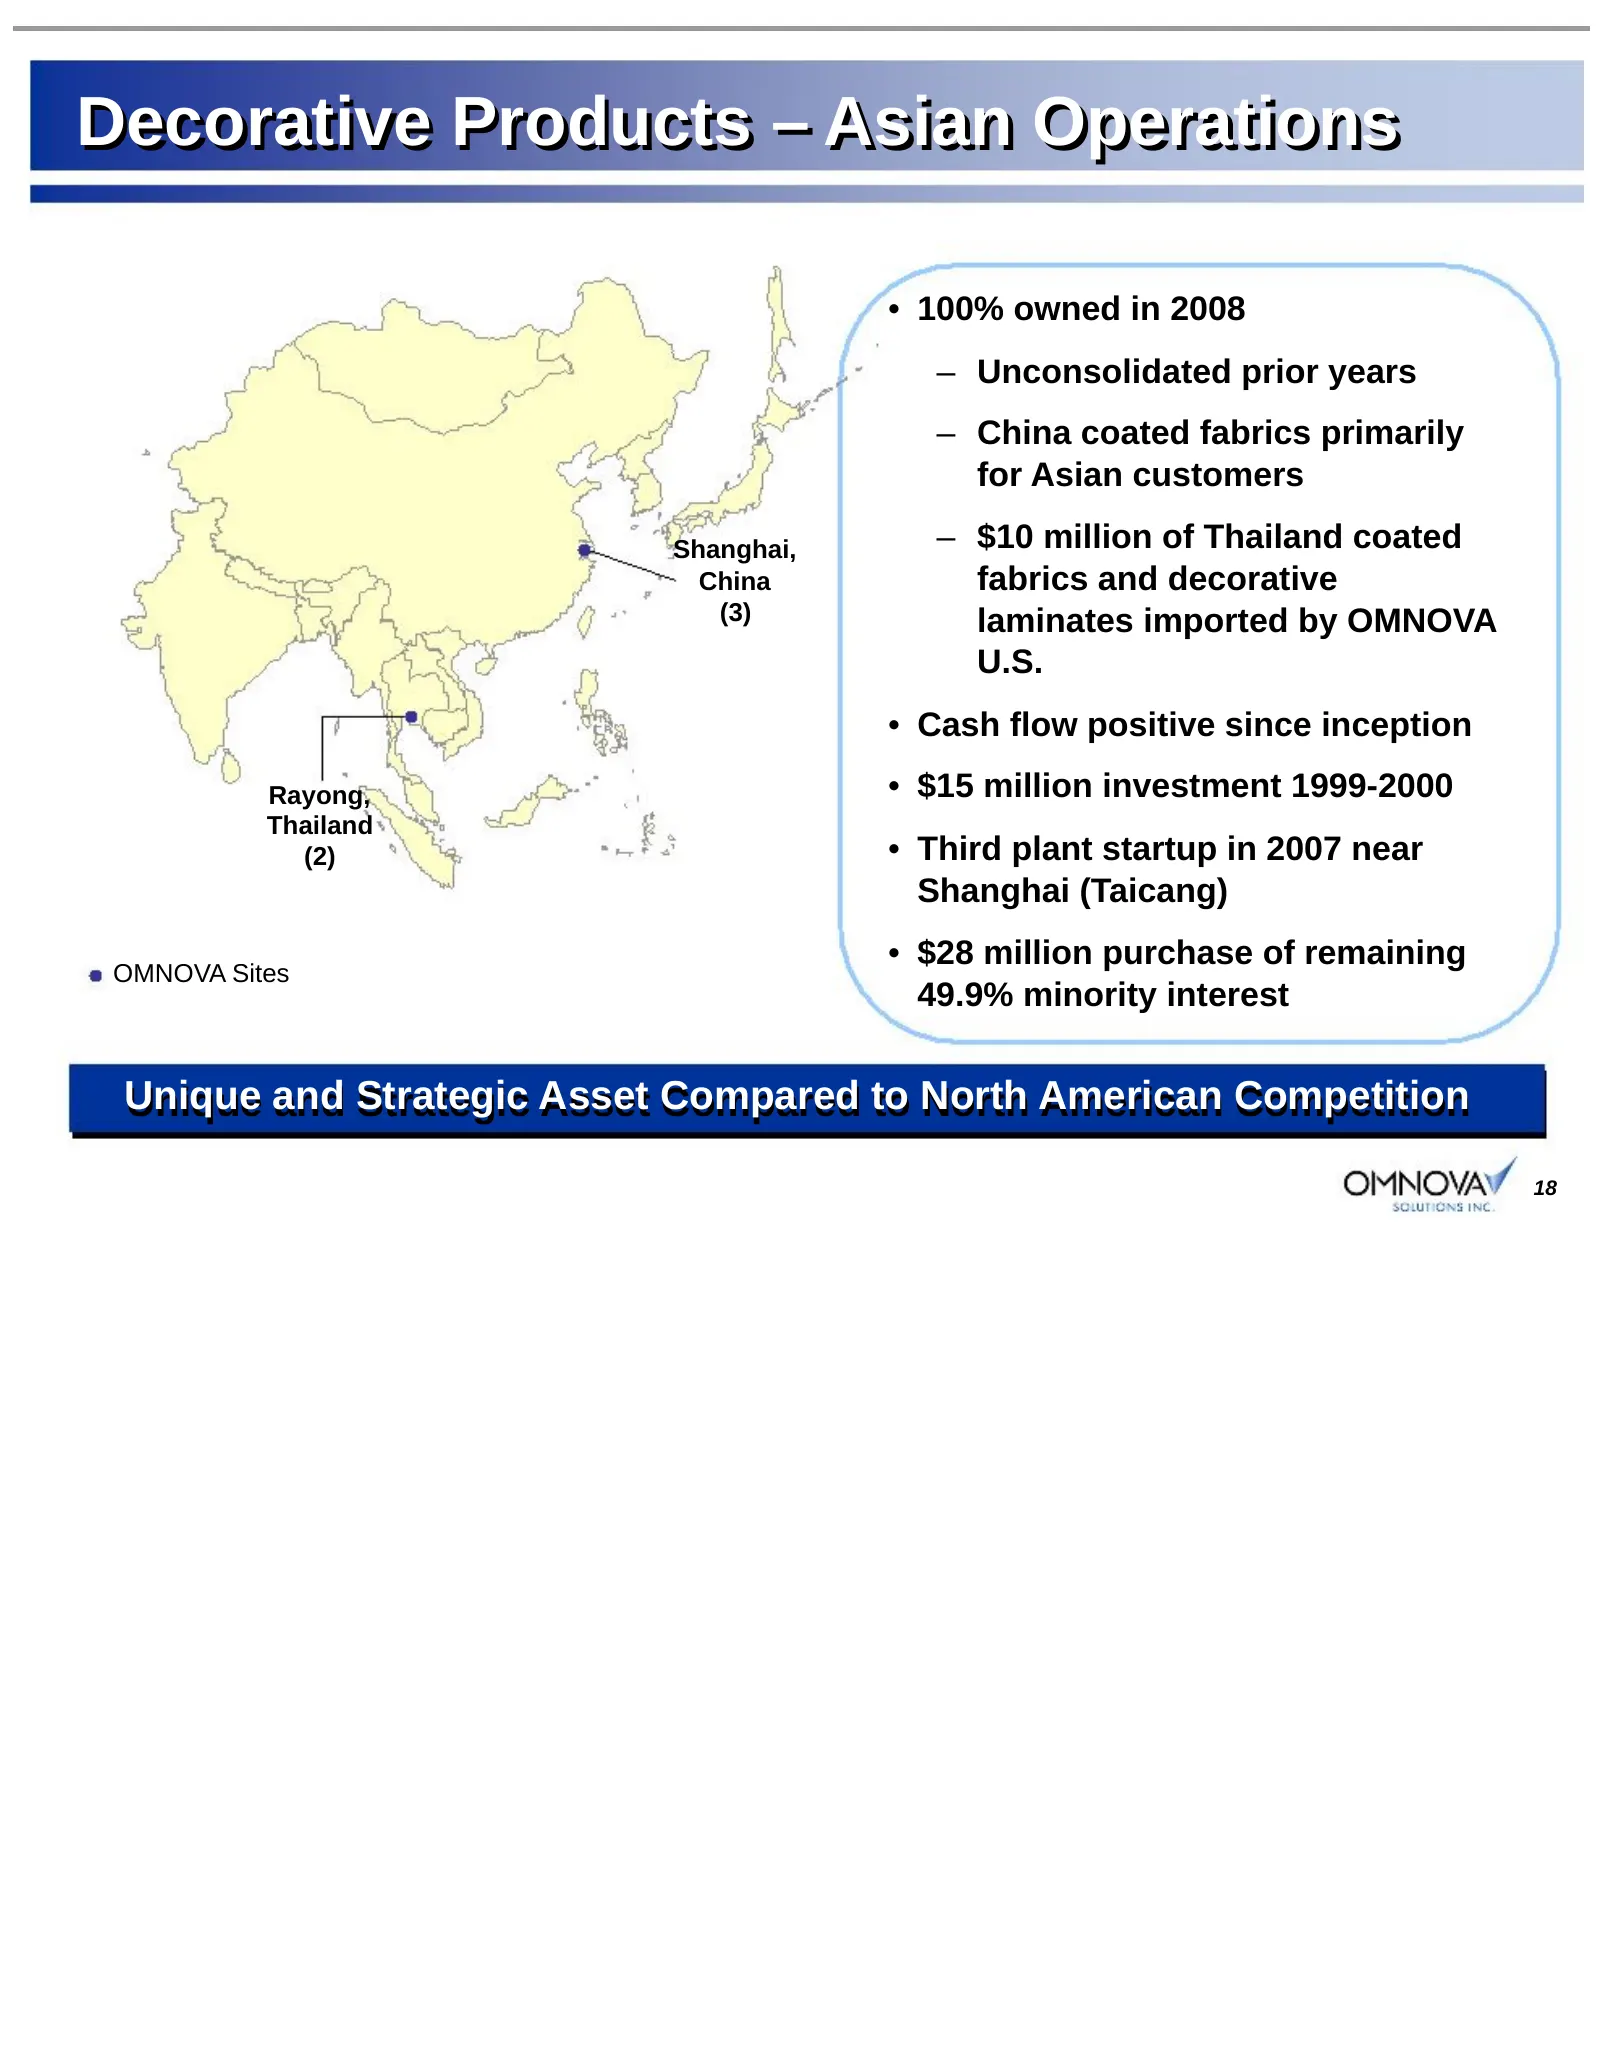
Decorative Products – Asian Operations • 100% owned in 2008 – Unconsolidated prior years – China coated fabrics primarily for Asian customers Shanghai, – $10 million of Thailand coated China fabrics and decorative (3) laminates imported by OMNOVA U.S. • Cash flow positive since inception Rayong, • $
Slide 19: Decorative Products – New Products
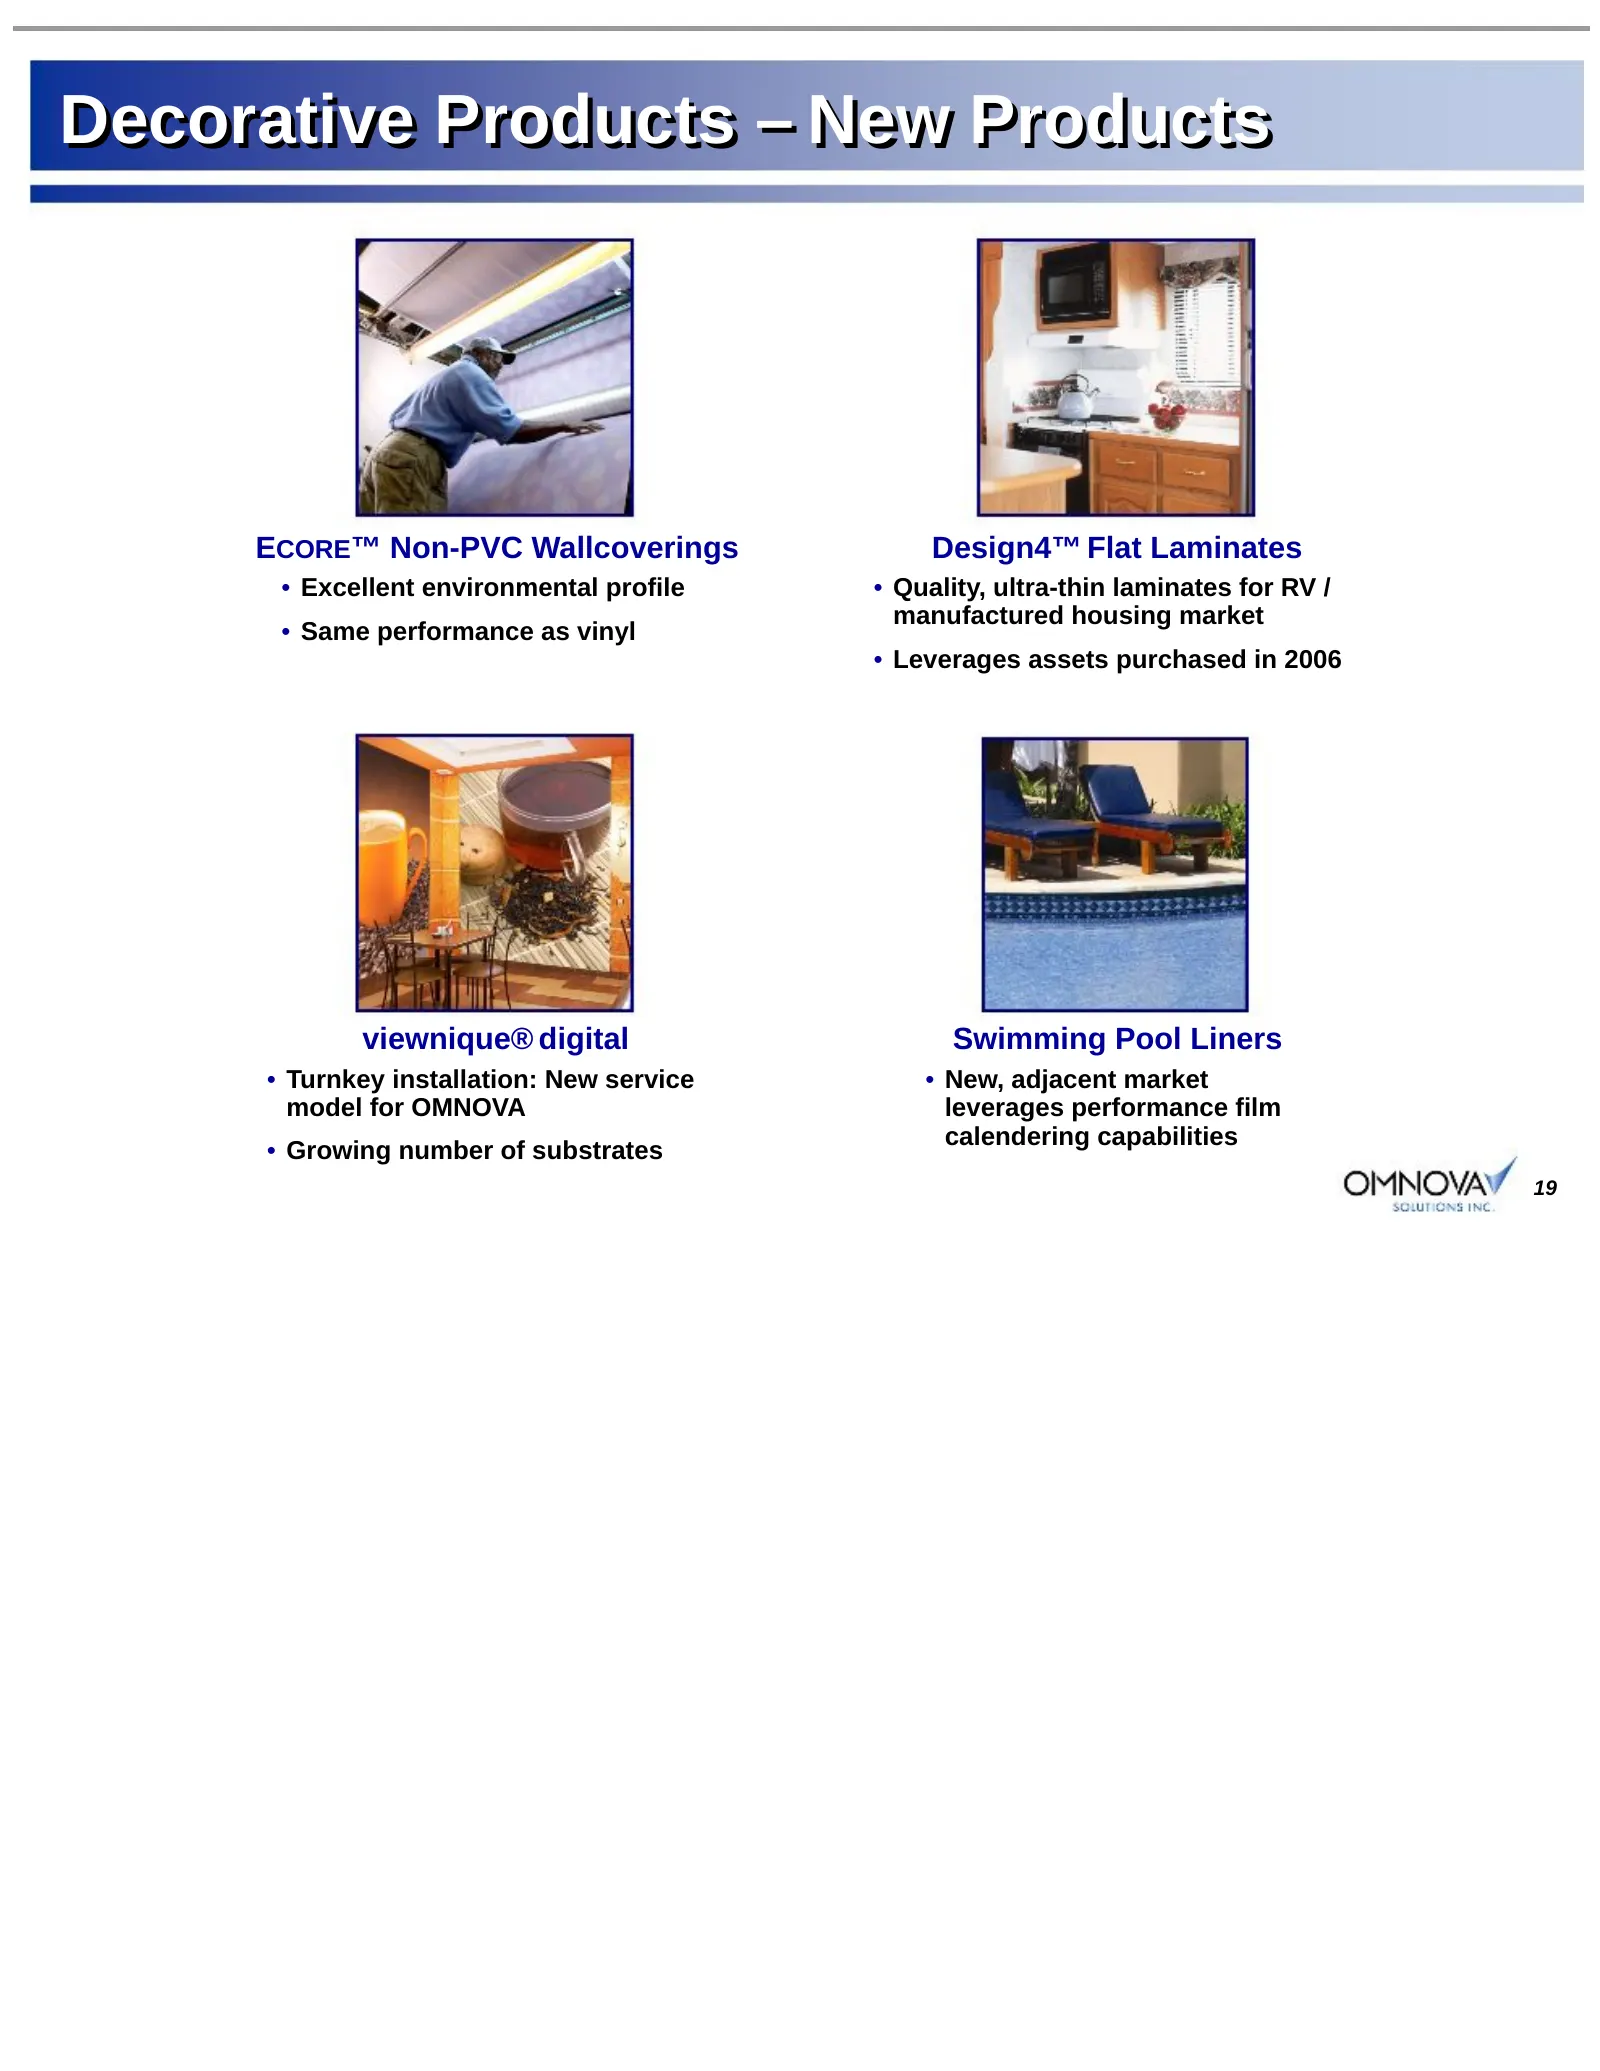
Decorative Products – New Products ECORE™ Non-PVC Wallcoverings Design4™ Flat Laminates • Excellent environmental profile • Quality, ultra-thin laminates for RV / manufactured housing market • Same performance as vinyl • Leverages assets purchased in 2006 viewnique® digital Swimming Pool Liners • Tu
Slide 20: Decorative Products – Trends
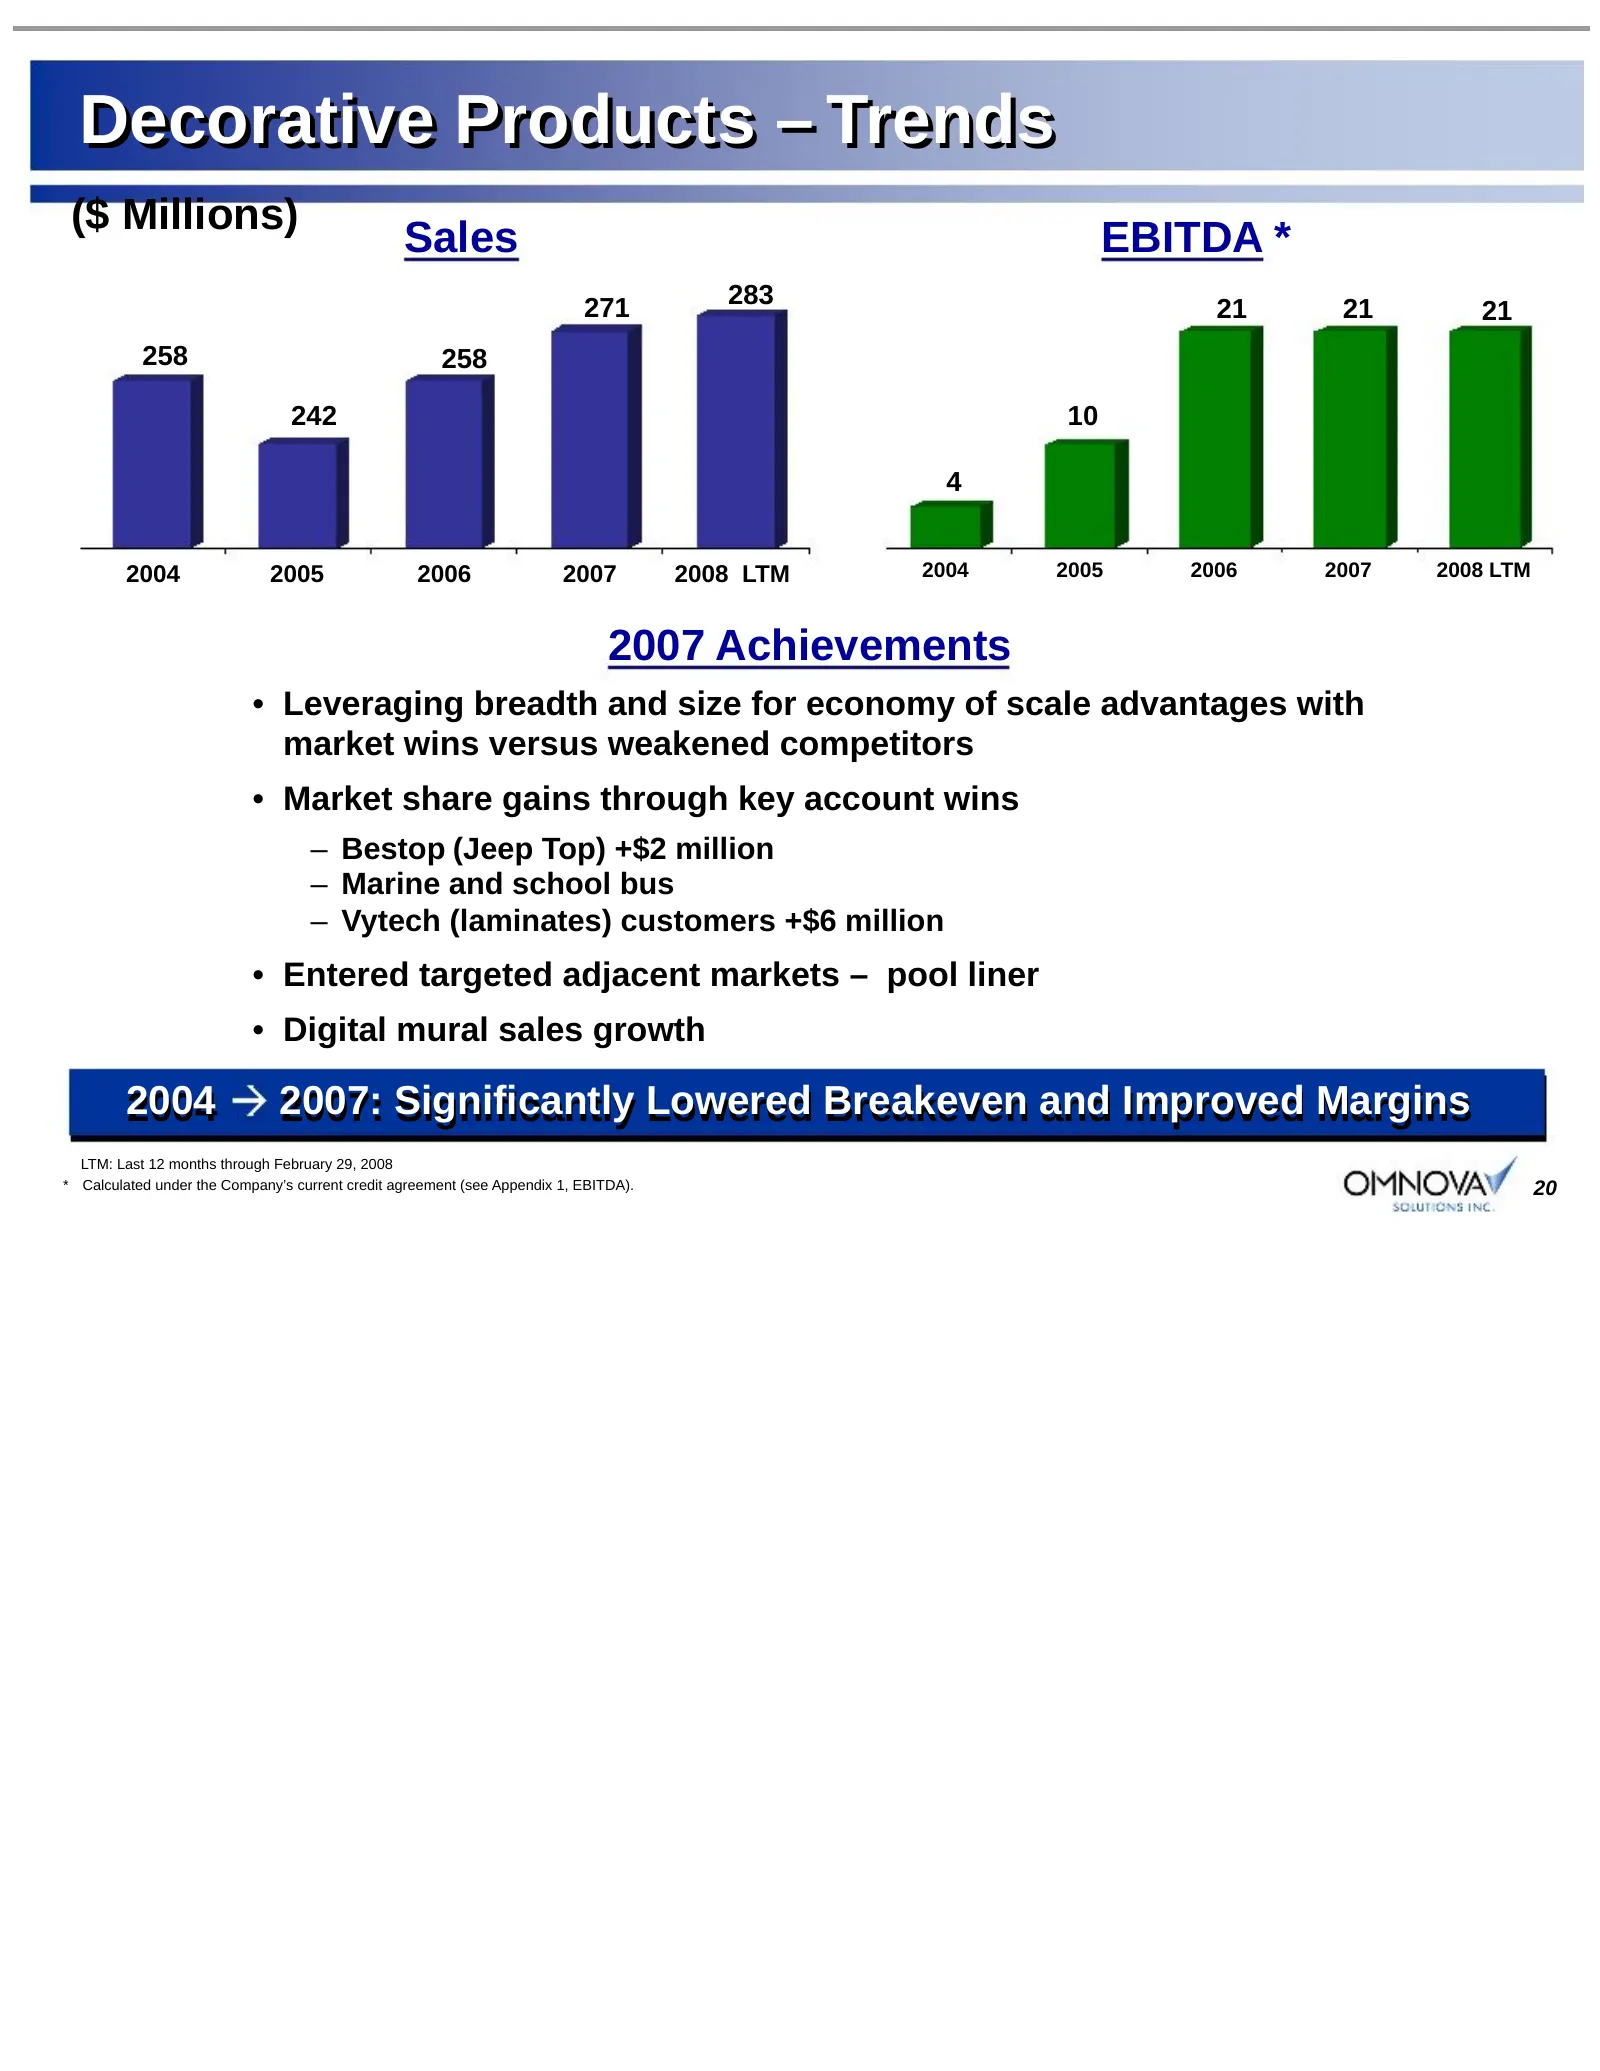
Decorative Products – Trends ($ Millions) Sales EBITDA * 271 283 21 21 21 258 258 242 10 4 2004 2005 2006 2007 2008 LTM 2004 2005 2006 2007 2008 LTM 2007 Achievements • Leveraging breadth and size for economy of scale advantages with market wins versus weakened competitors • Market share gains throu
Slide 21: Performance Chemicals Segment
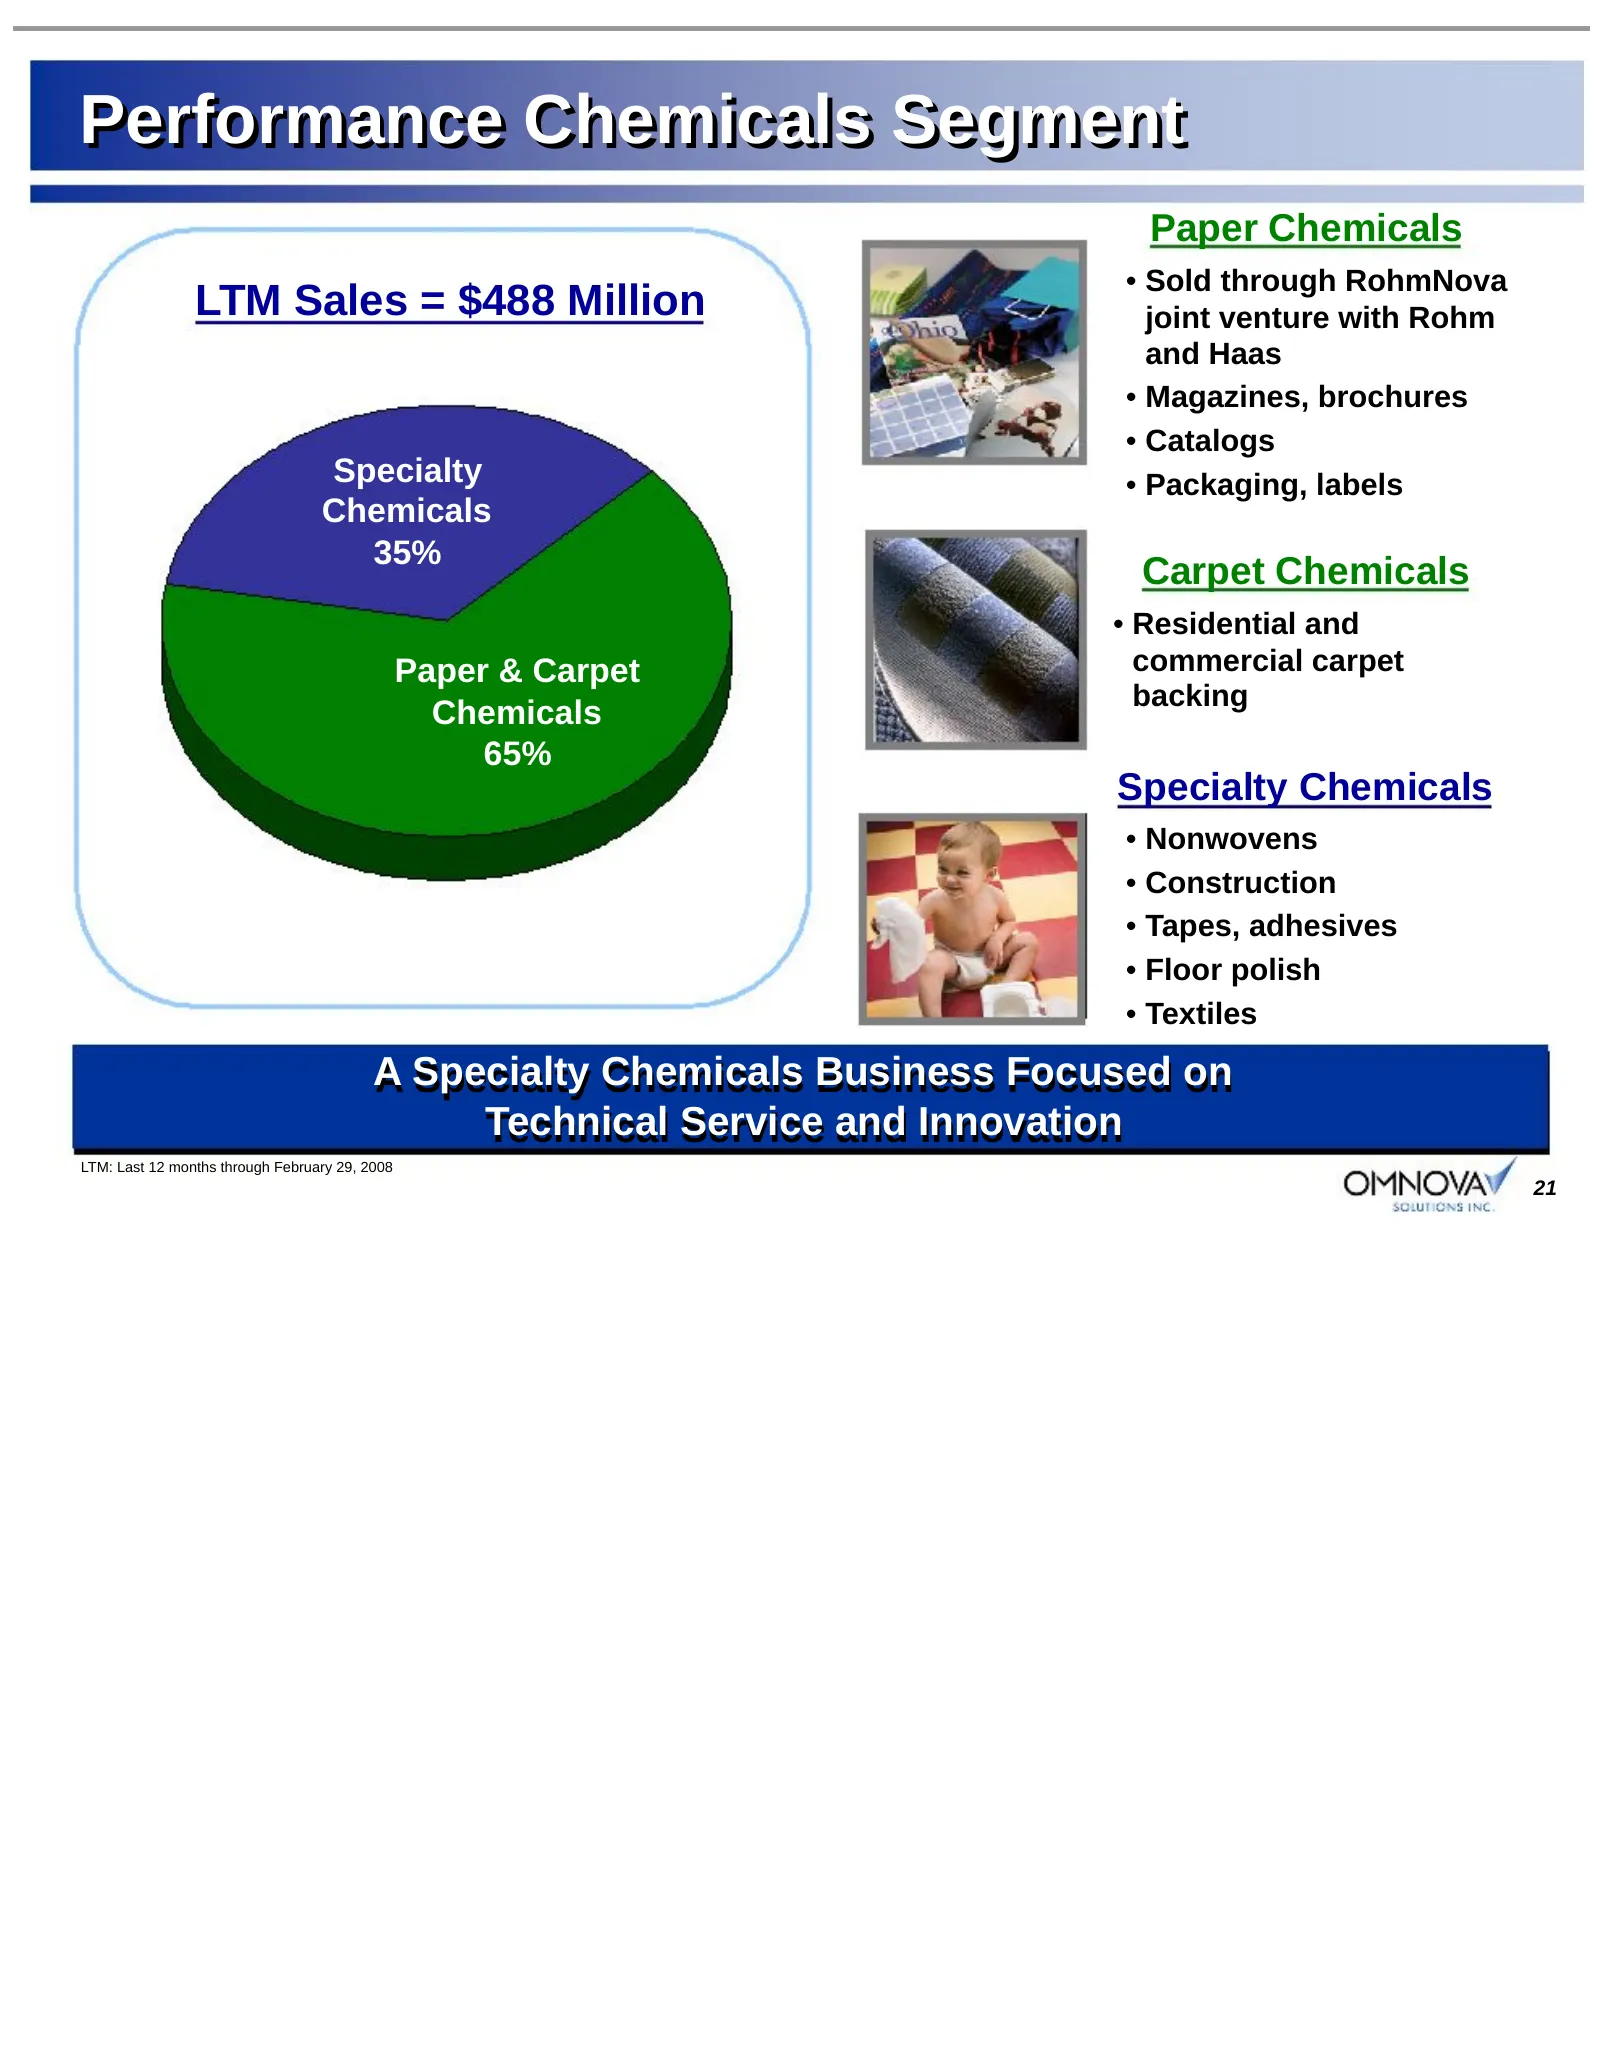
Performance Chemicals Segment Paper Chemicals • Sold through RohmNova LTM Sales = $488 Million joint venture with Rohm and Haas • Magazines, brochures • Catalogs Specialty • Packaging, labels Chemicals 35% Carpet Chemicals • Residential and Paper & Carpet commercial carpet backing Chemicals 65% Spec
Slide 22: Performance Chemicals - End Uses
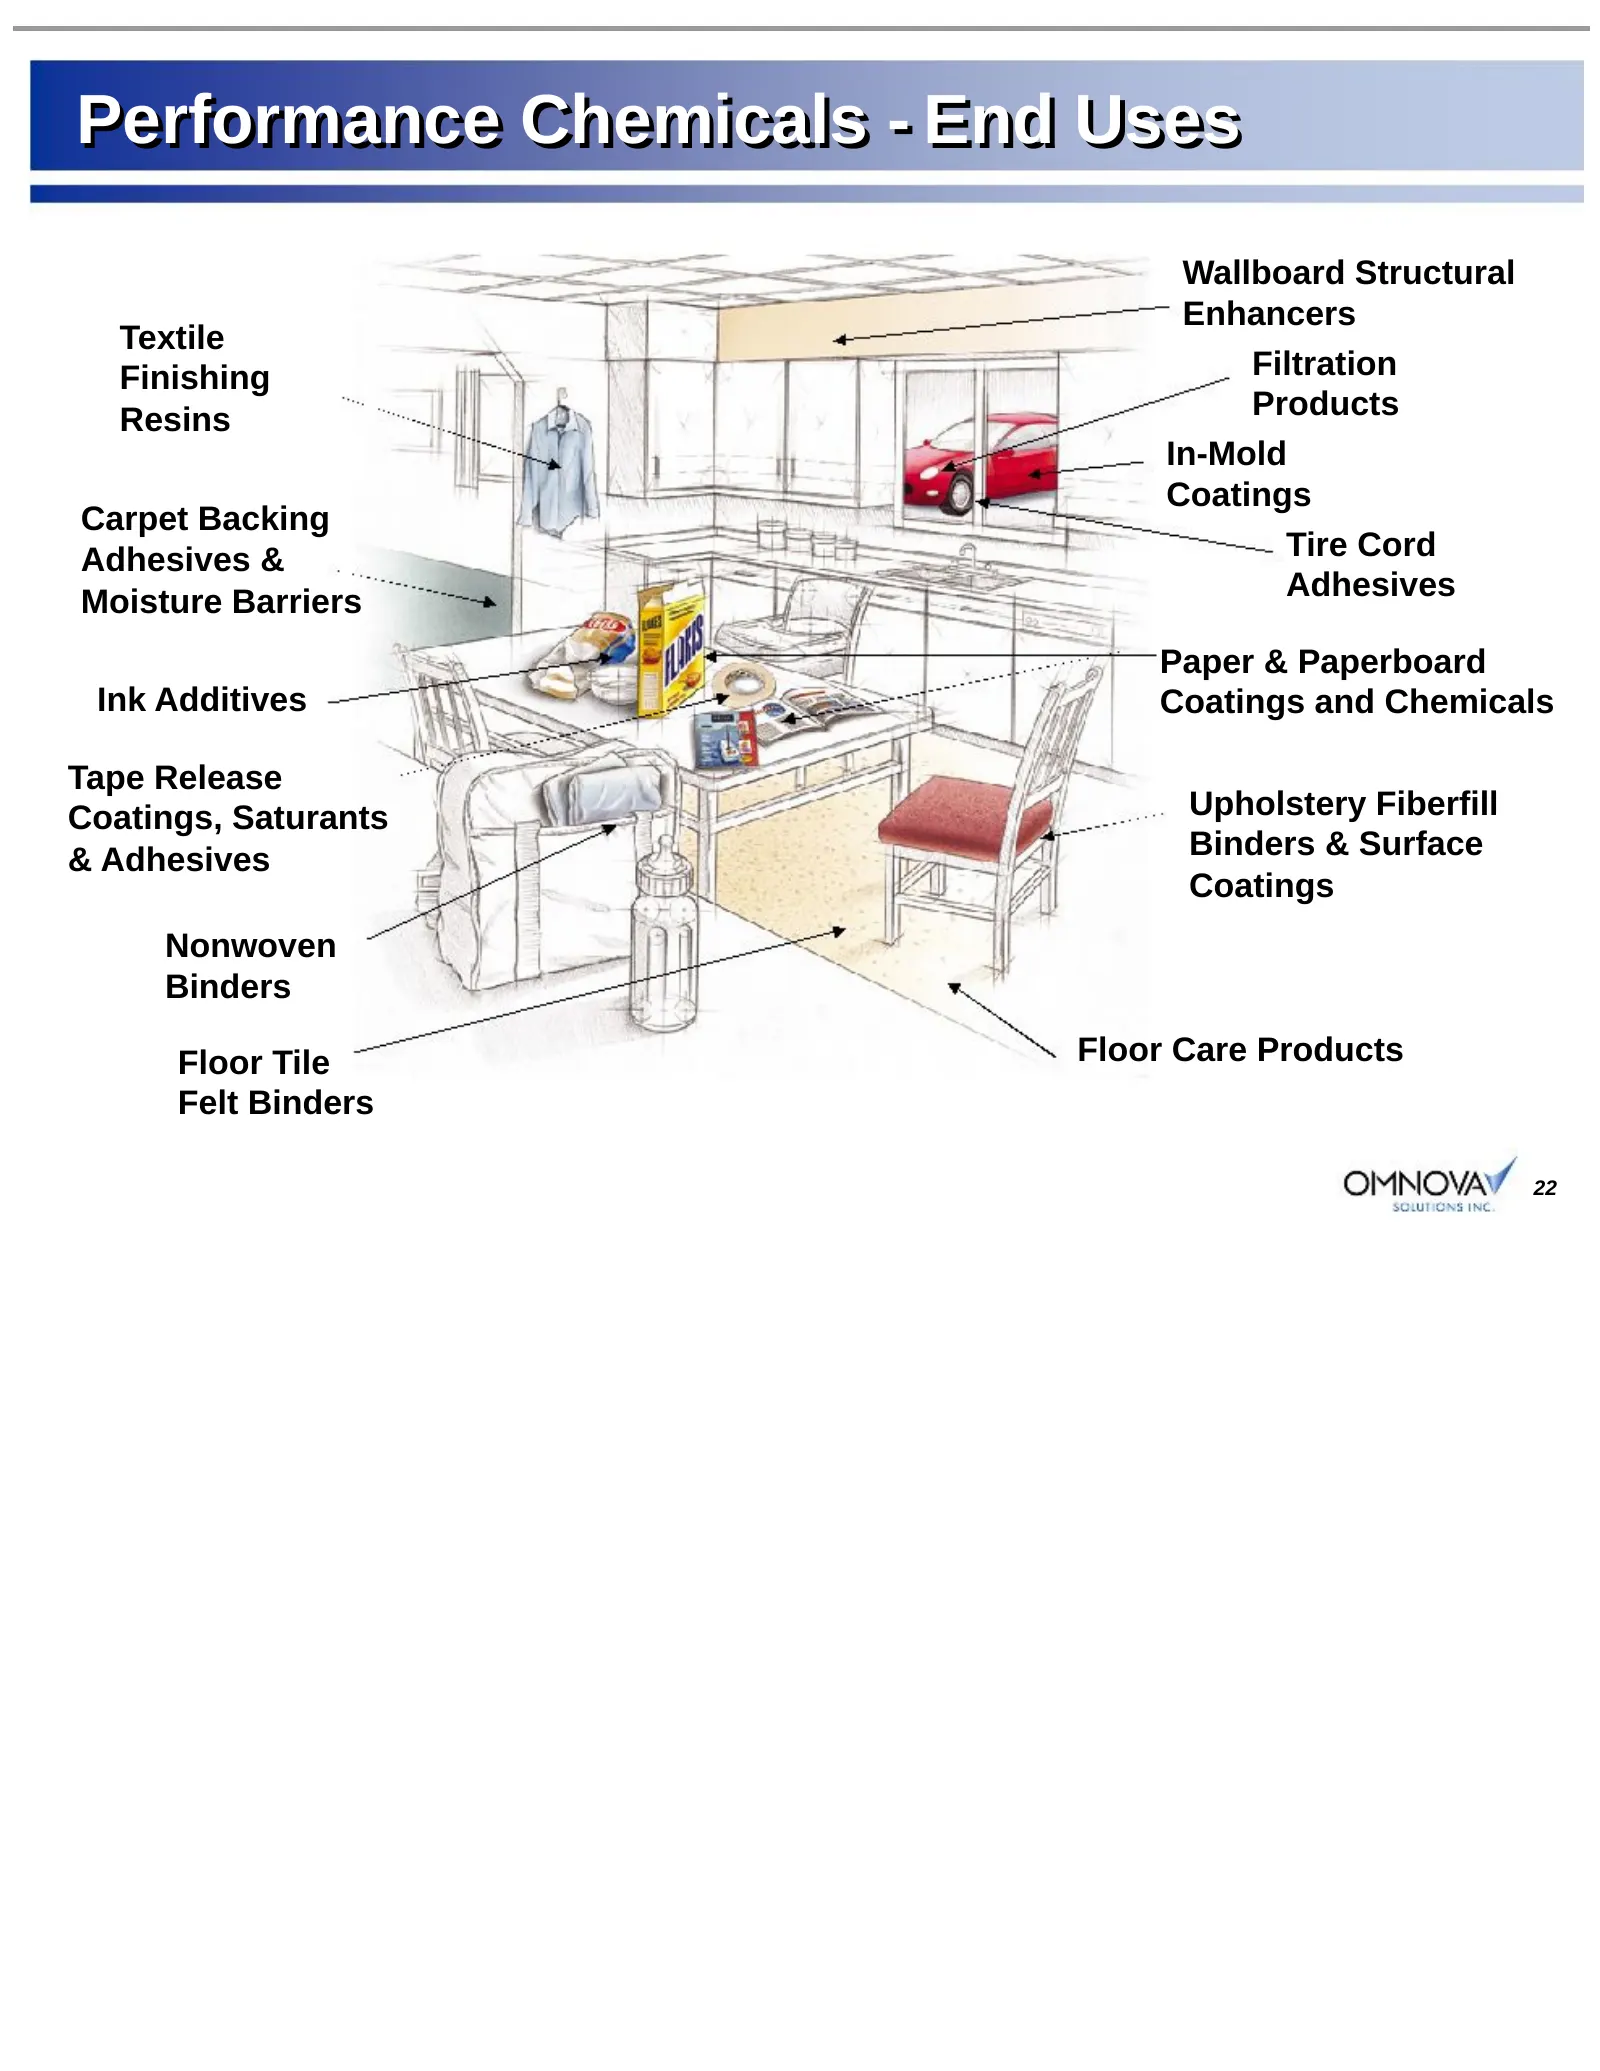
Performance Chemicals - End Uses Wallboard Structural Enhancers Textile Finishing Filtration Resins Products In-Mold Coatings Carpet Backing Adhesives & Tire Cord Moisture Barriers Adhesives Paper & Paperboard Ink Additives Coatings and Chemicals Tape Release Coatings, Saturants Upholstery Fiberfill
Slide 23: Performance Chemicals – North American Market
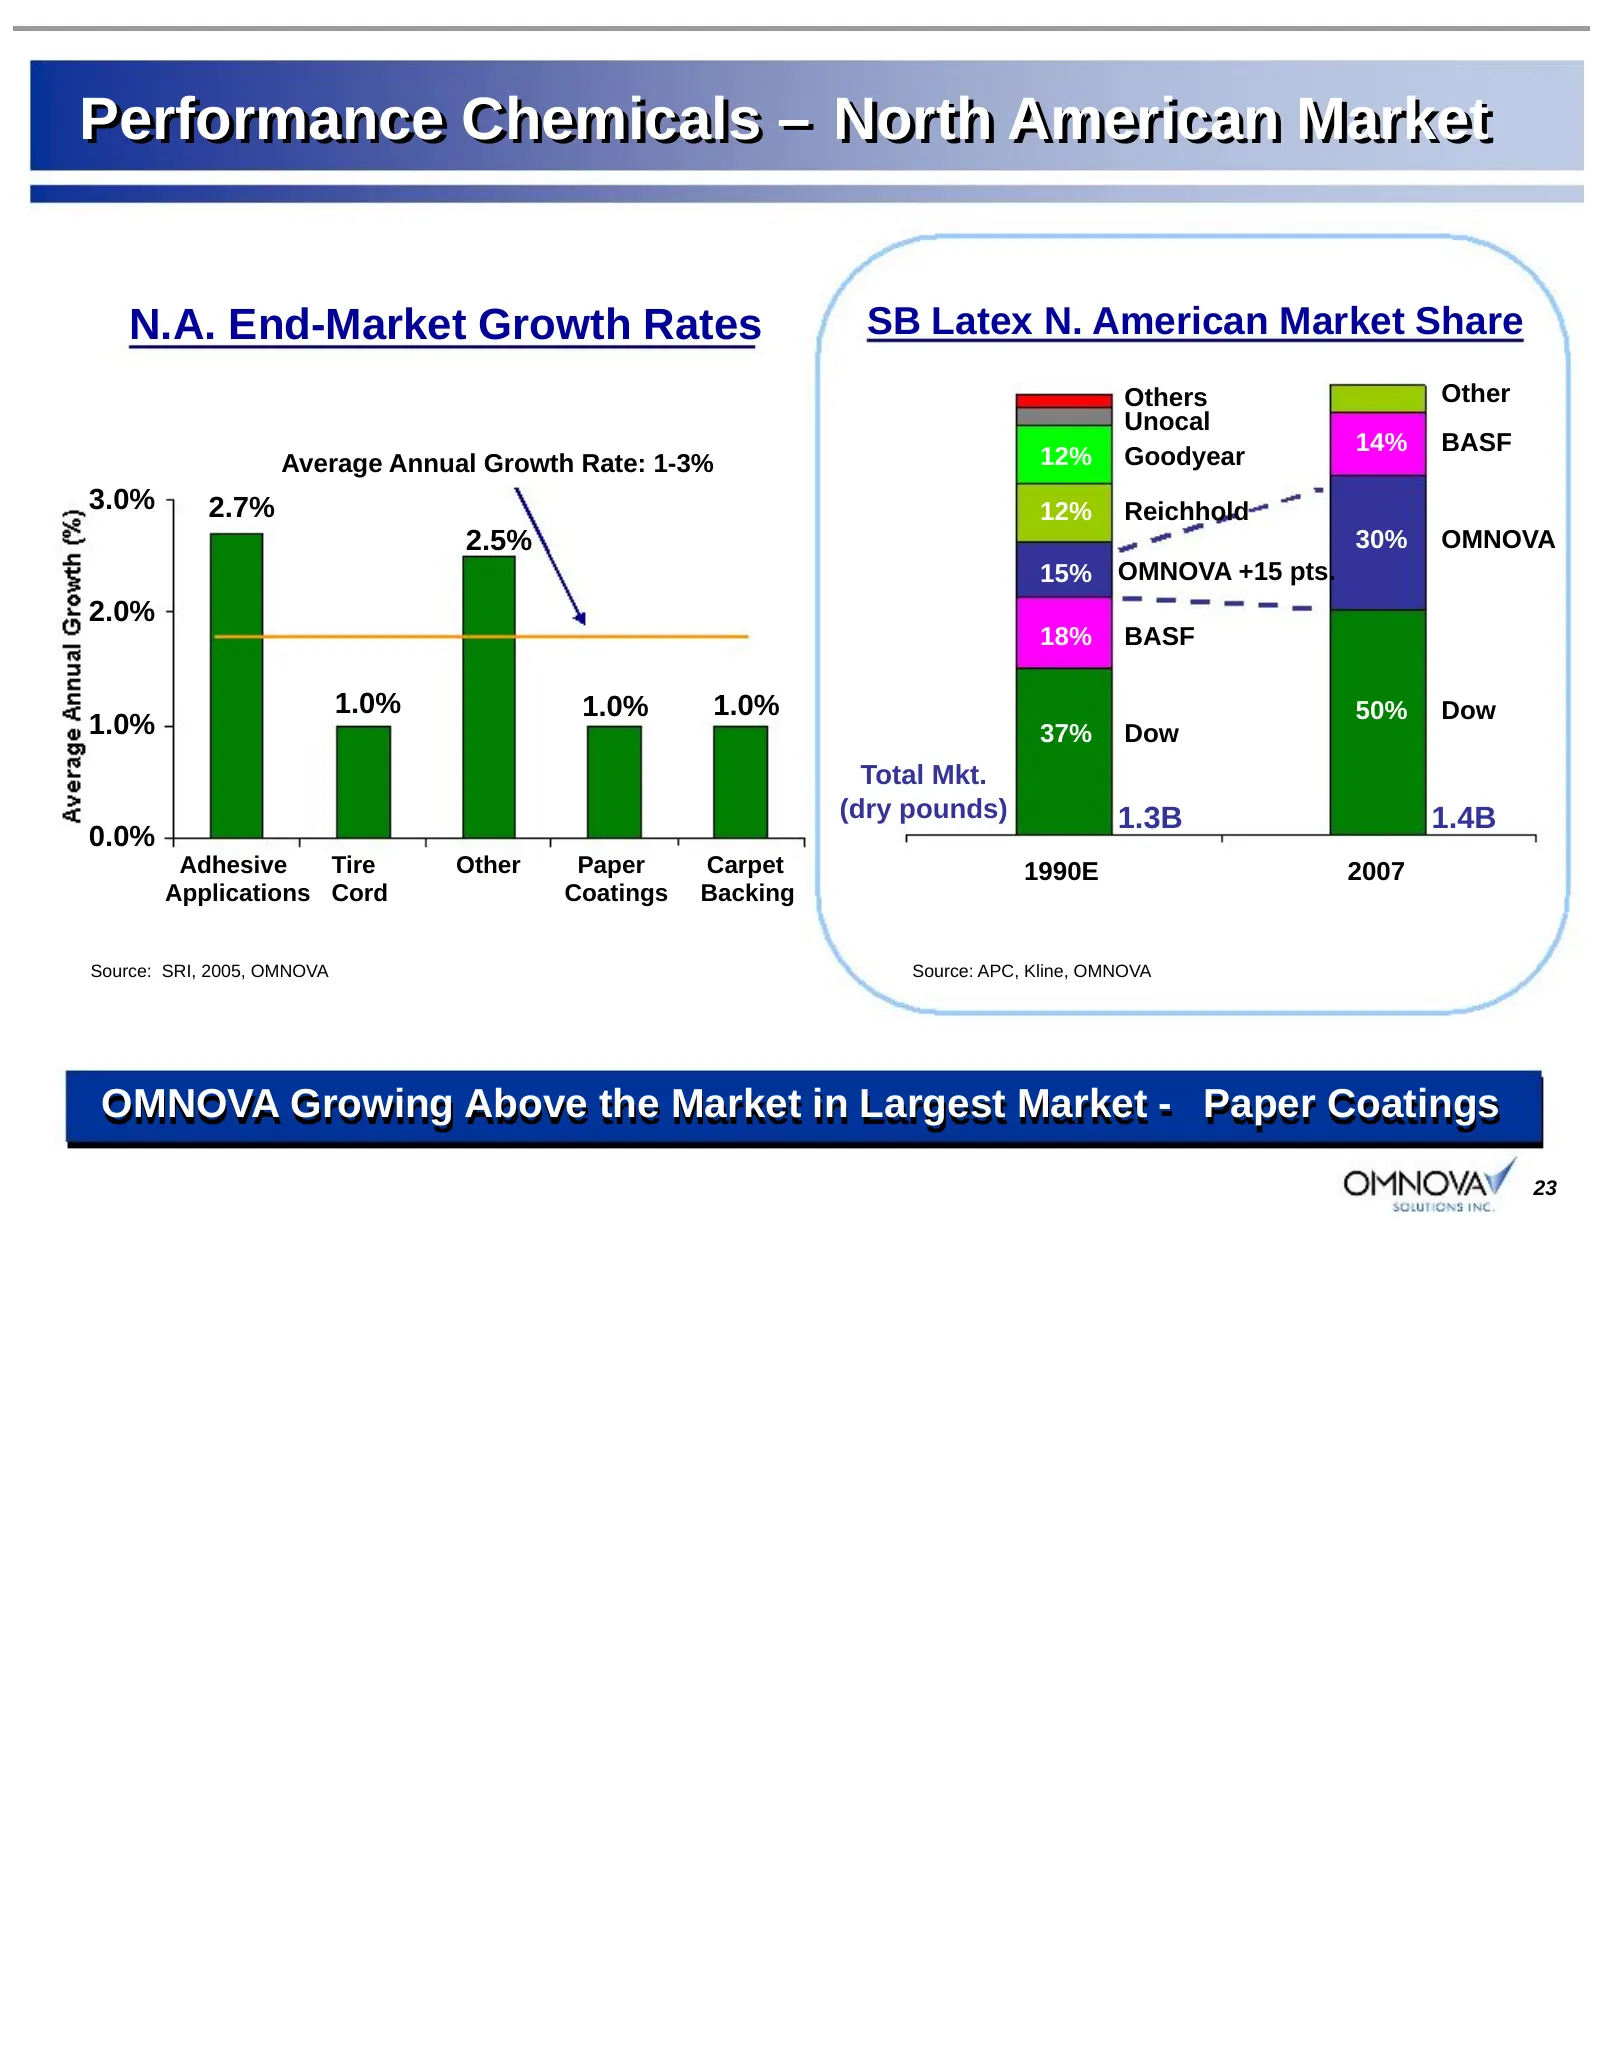
Performance Chemicals – North American Market N.A. End-Market Growth Rates SB Latex N. American Market Share Others Other Unocal 14% BASF Average Annual Growth Rate: 1-3% 12% Goodyear 3.0% 2.7% 12% Reichhold 2.5% 30% OMNOVA 15% OMNOVA +15 pts. 2.0% 18% BASF 1.0% 1.0% 1.0% 50% Dow 1.0% 37% Dow Total
Slide 24: Performance Chemicals - Key Economic Drivers
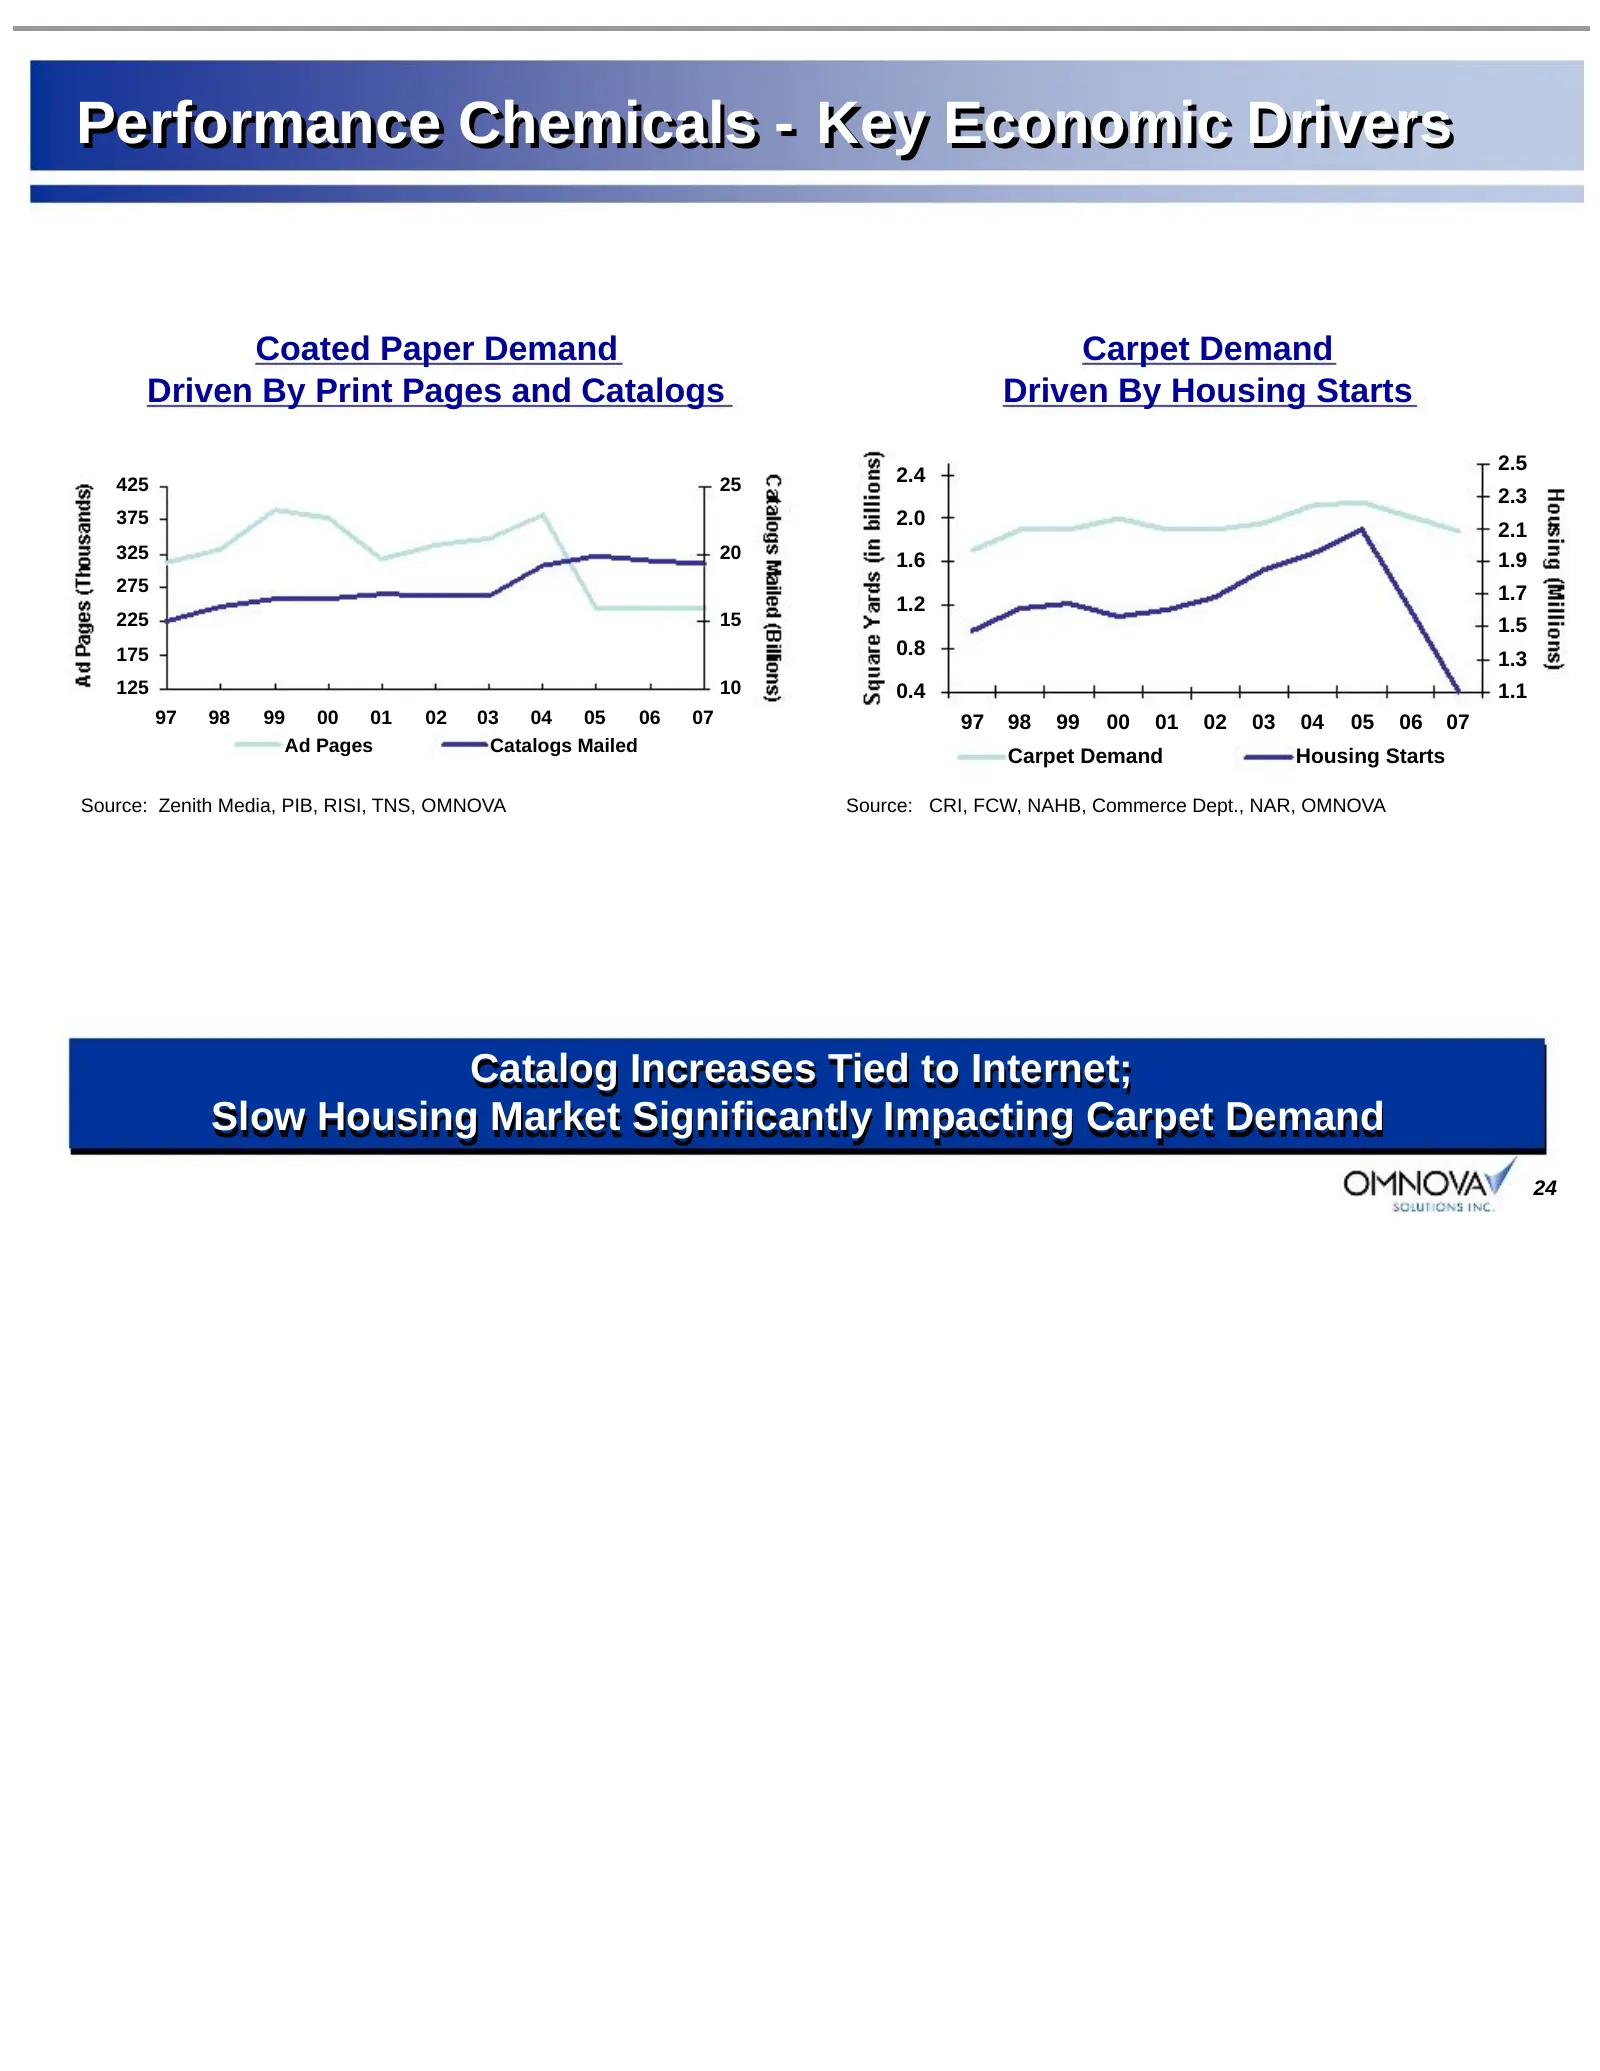
Performance Chemicals - Key Economic Drivers Coated Paper Demand Carpet Demand Driven By Print Pages and Catalogs Driven By Housing Starts 2.5 425 25 2.4 2.3 375 2.0 2.1 325 20 1.6 1.9 275 1.7 1.2 225 15 1.5 175 0.8 1.3 125 10 0.4 1.1 97 98 99 00 01 02 03 04 05 06 07 97 98 99 00 01 02 03 04 05 06 07
Slide 25: Continuing Challenges
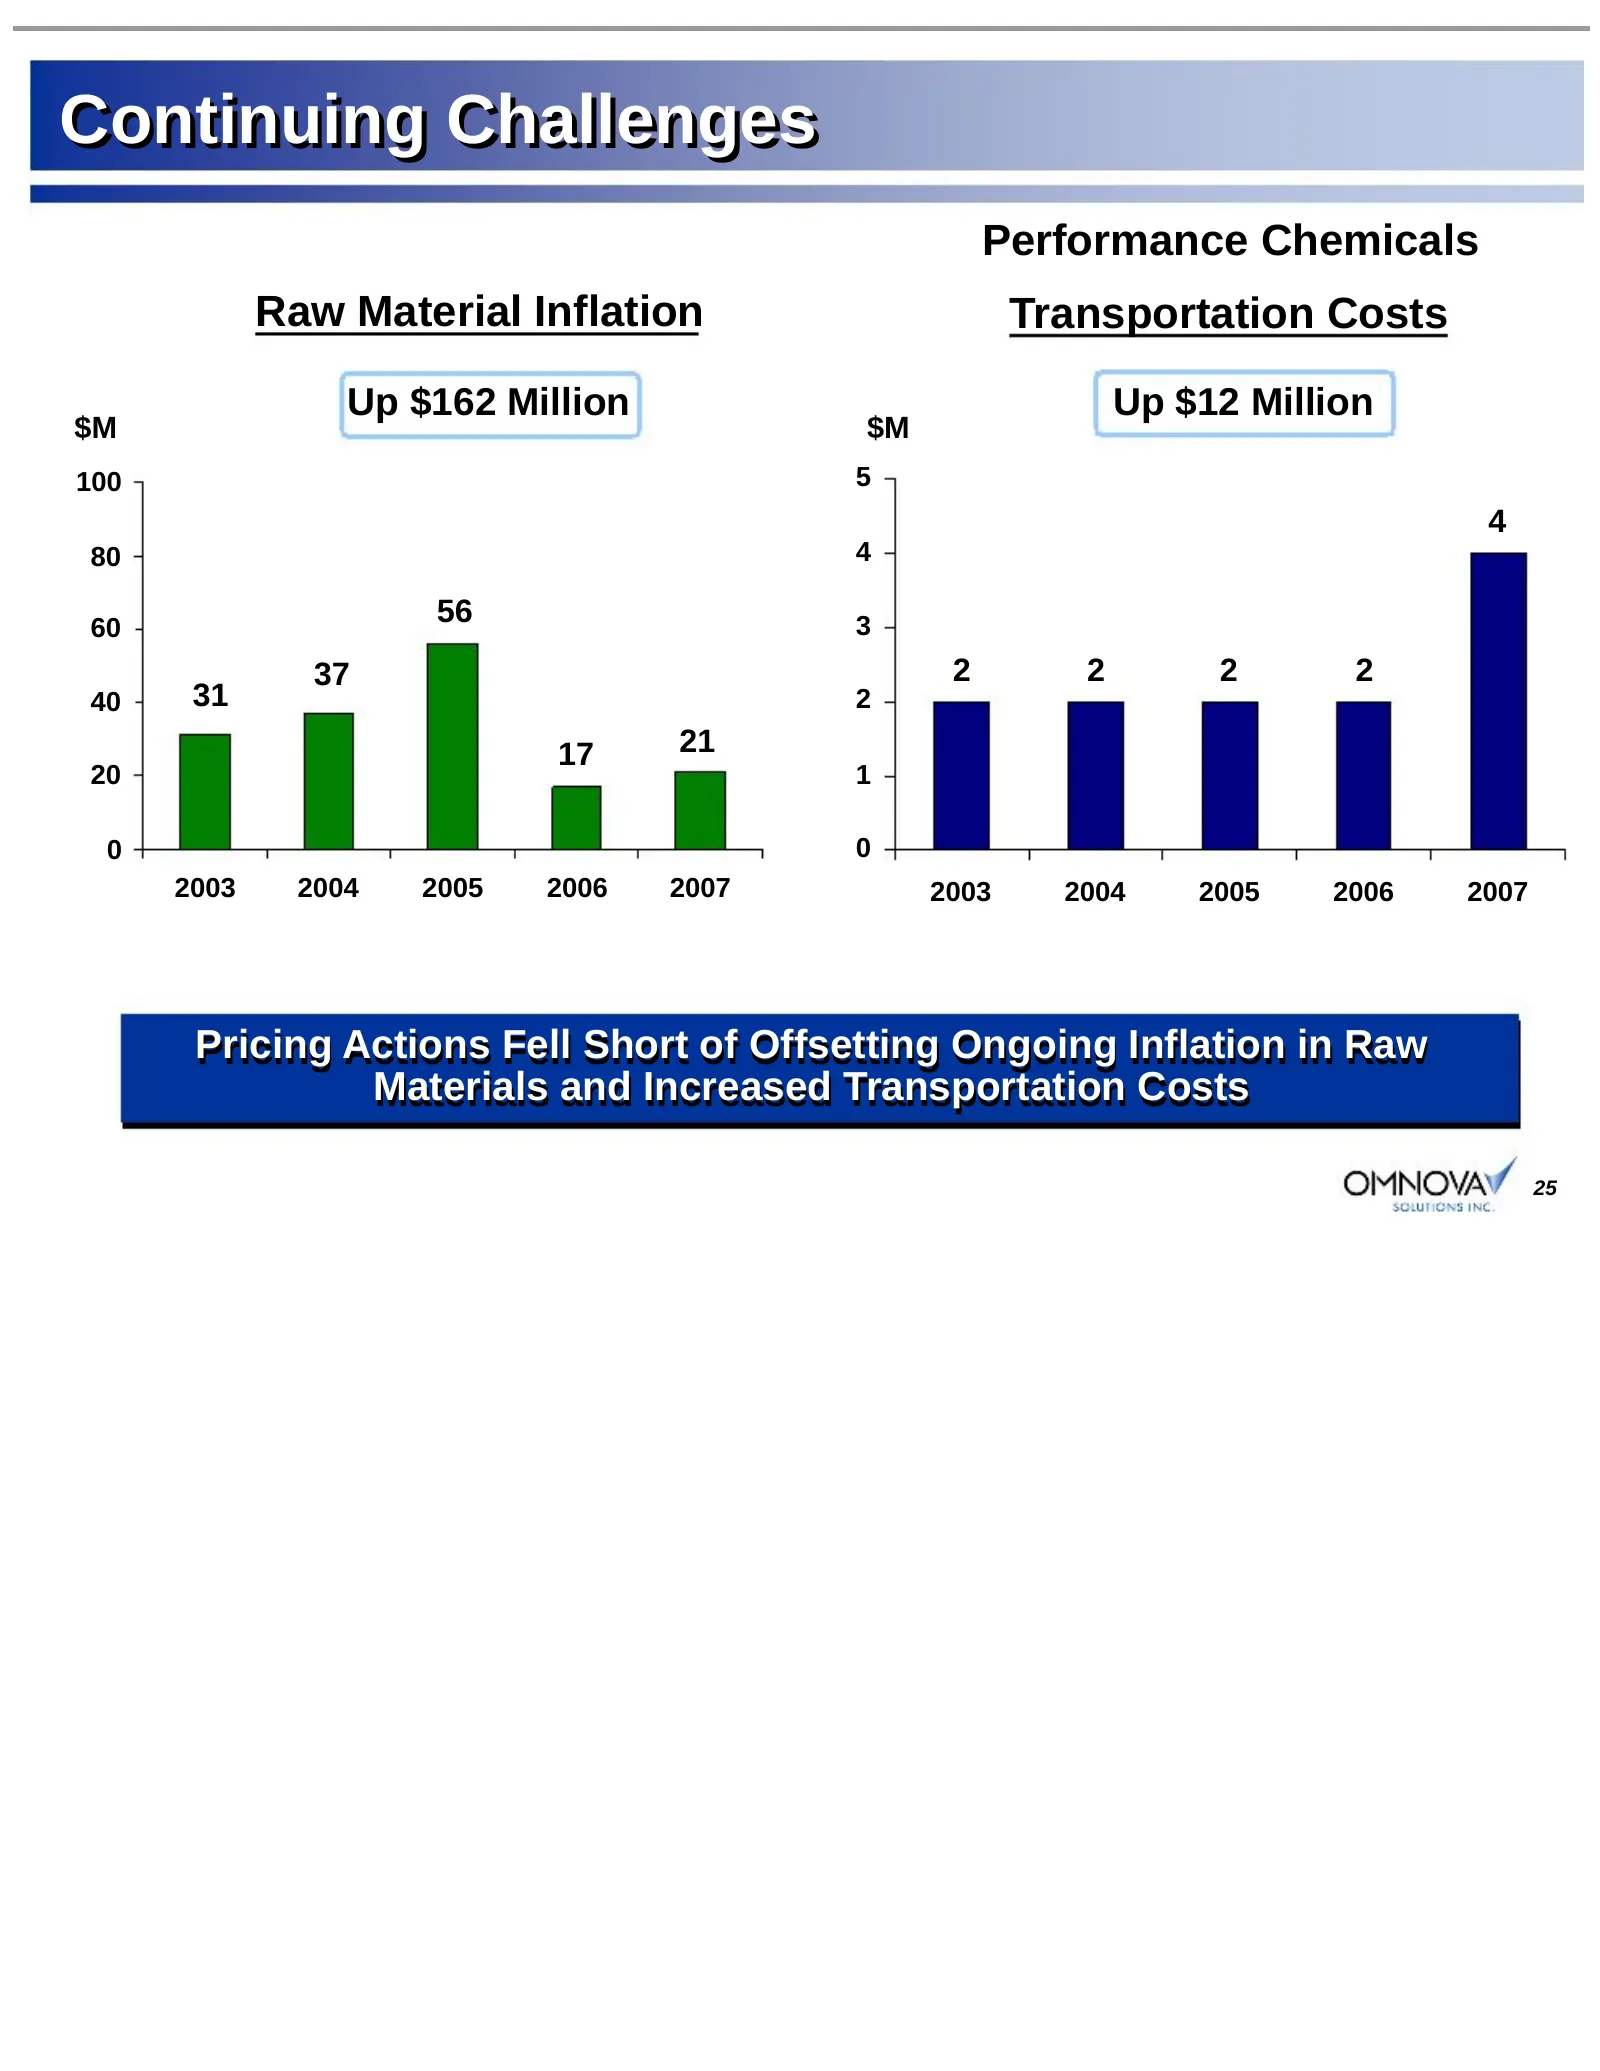
Continuing Challenges Performance Chemicals Raw Material Inflation Transportation Costs Up $162 Million Up $12 Million $M $M 100 5 4 80 4 60 56 3 37 2 2 2 2 40 31 2 17 21 20 1 0 0 2003 2004 2005 2006 2007 2003 2004 2005 2006 2007 Pricing Actions Fell Short of Offsetting Ongoing Inflation in Raw Mate
Slide 26: Oil Price Inflation
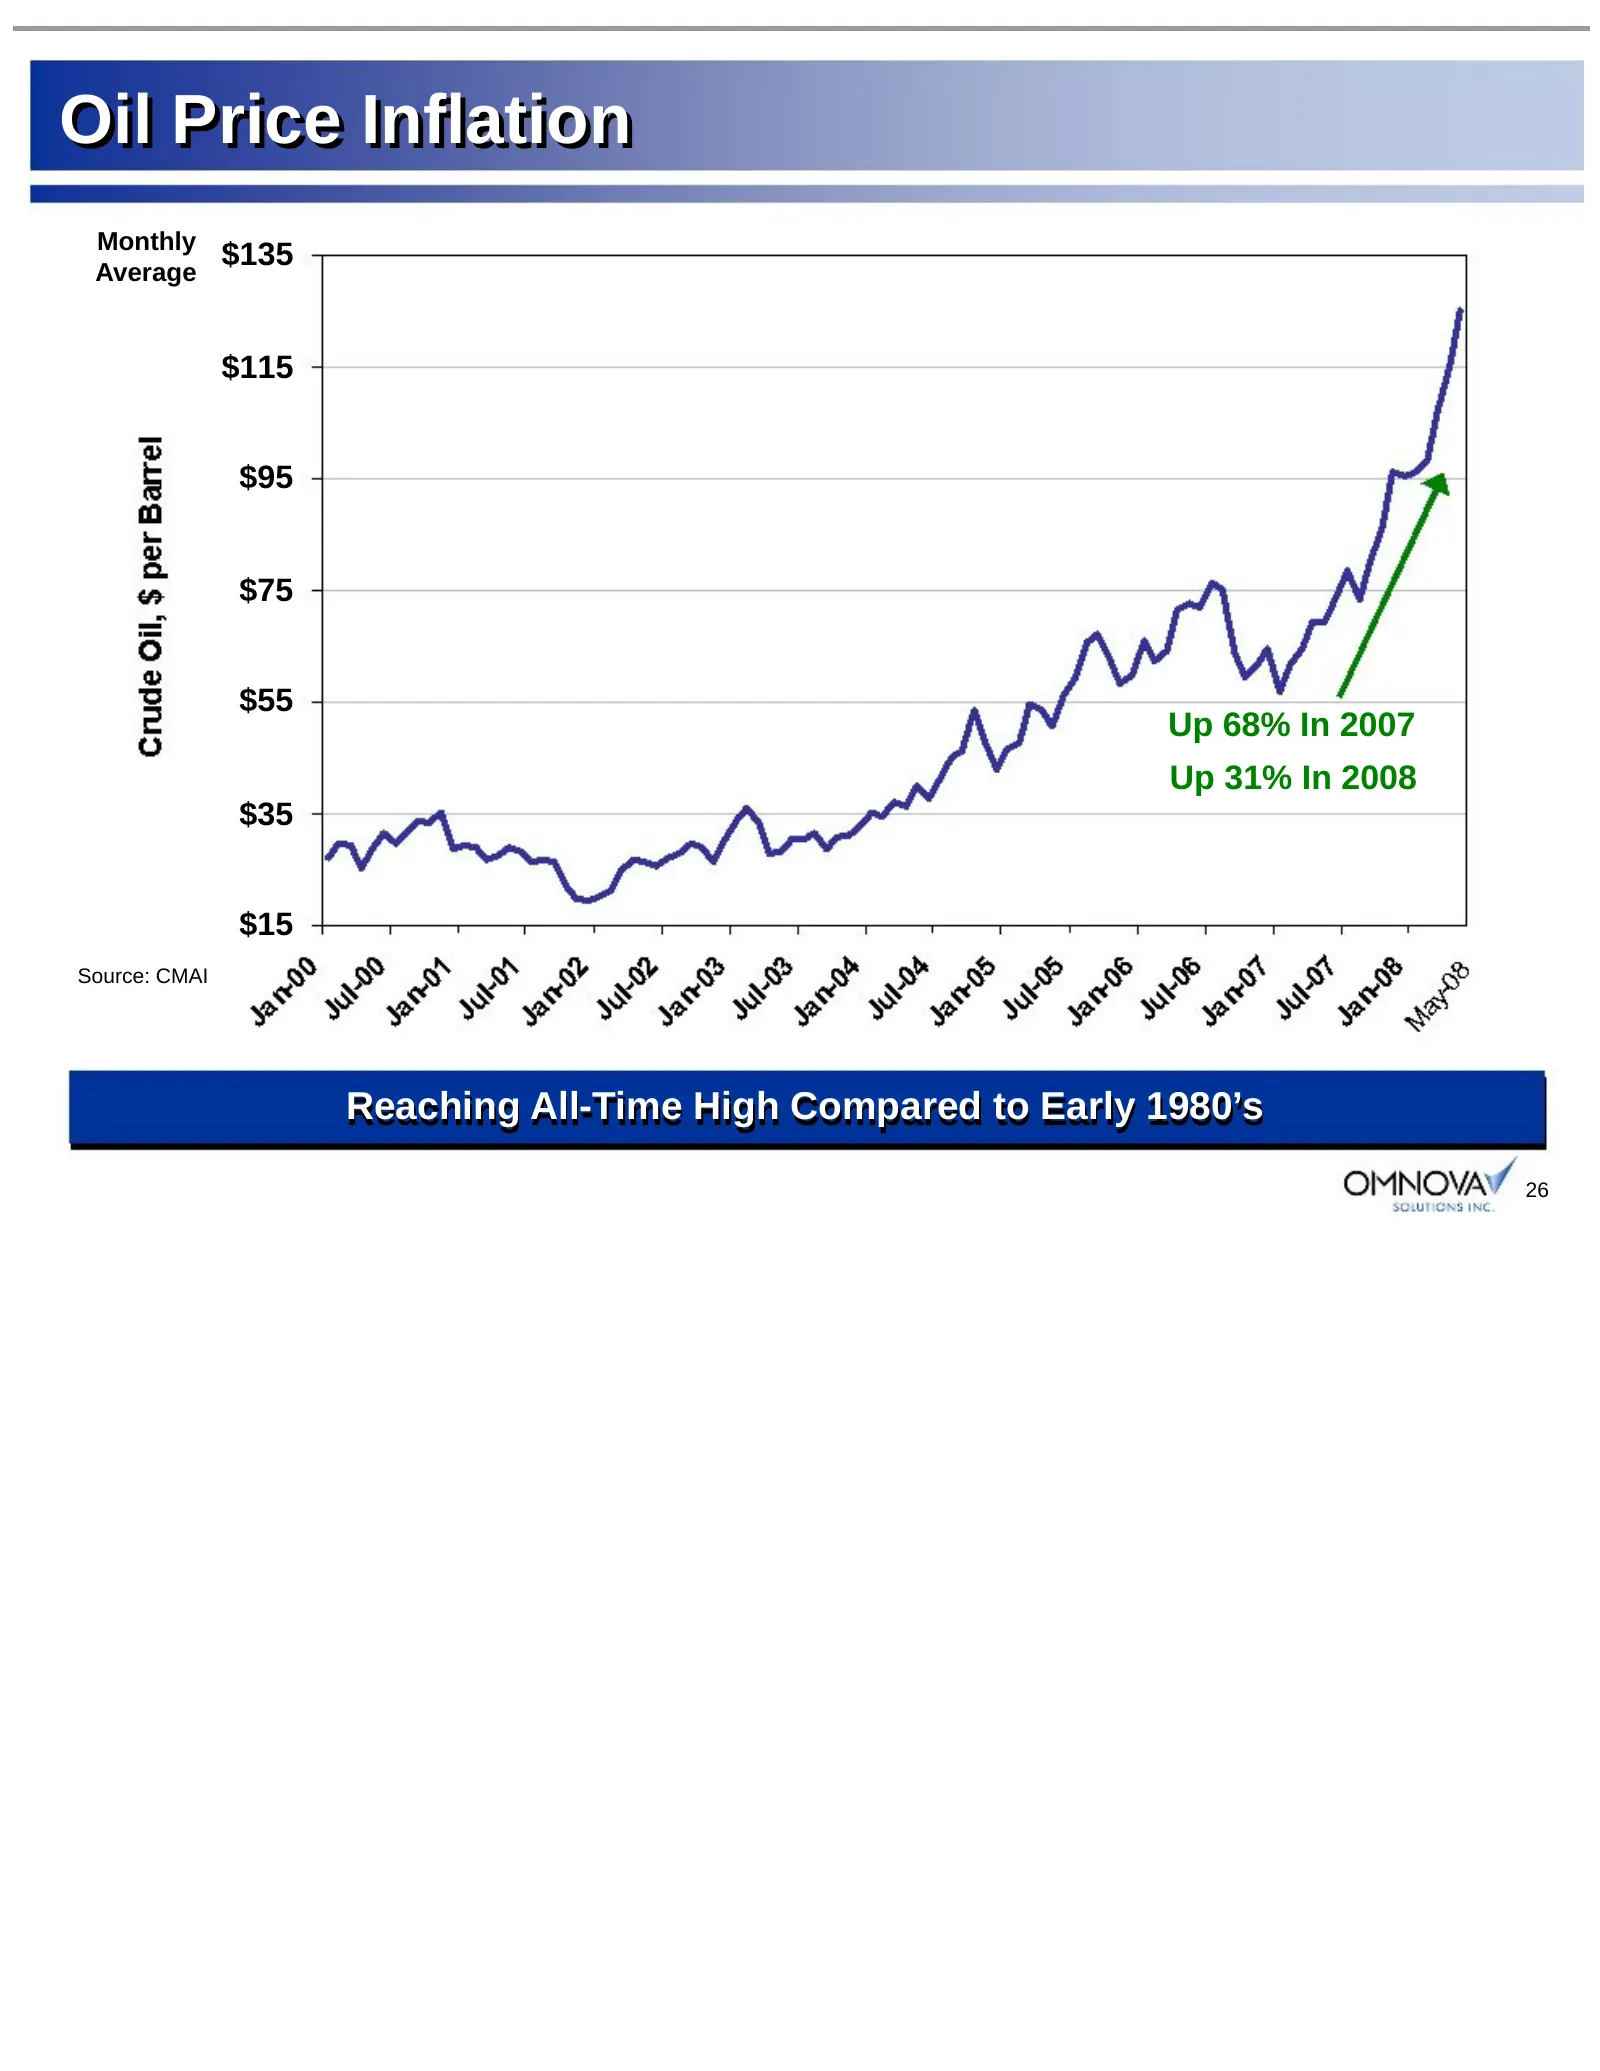
Oil Price Inflation Monthly $135 Average $115 $95 $75 $55 Up 68% In 2007 Up 31% In 2008 $35 $15 Source: CMAI Reaching All-Time High Compared to Early 1980’s 26
Slide 27: Raw Materials – Styrene
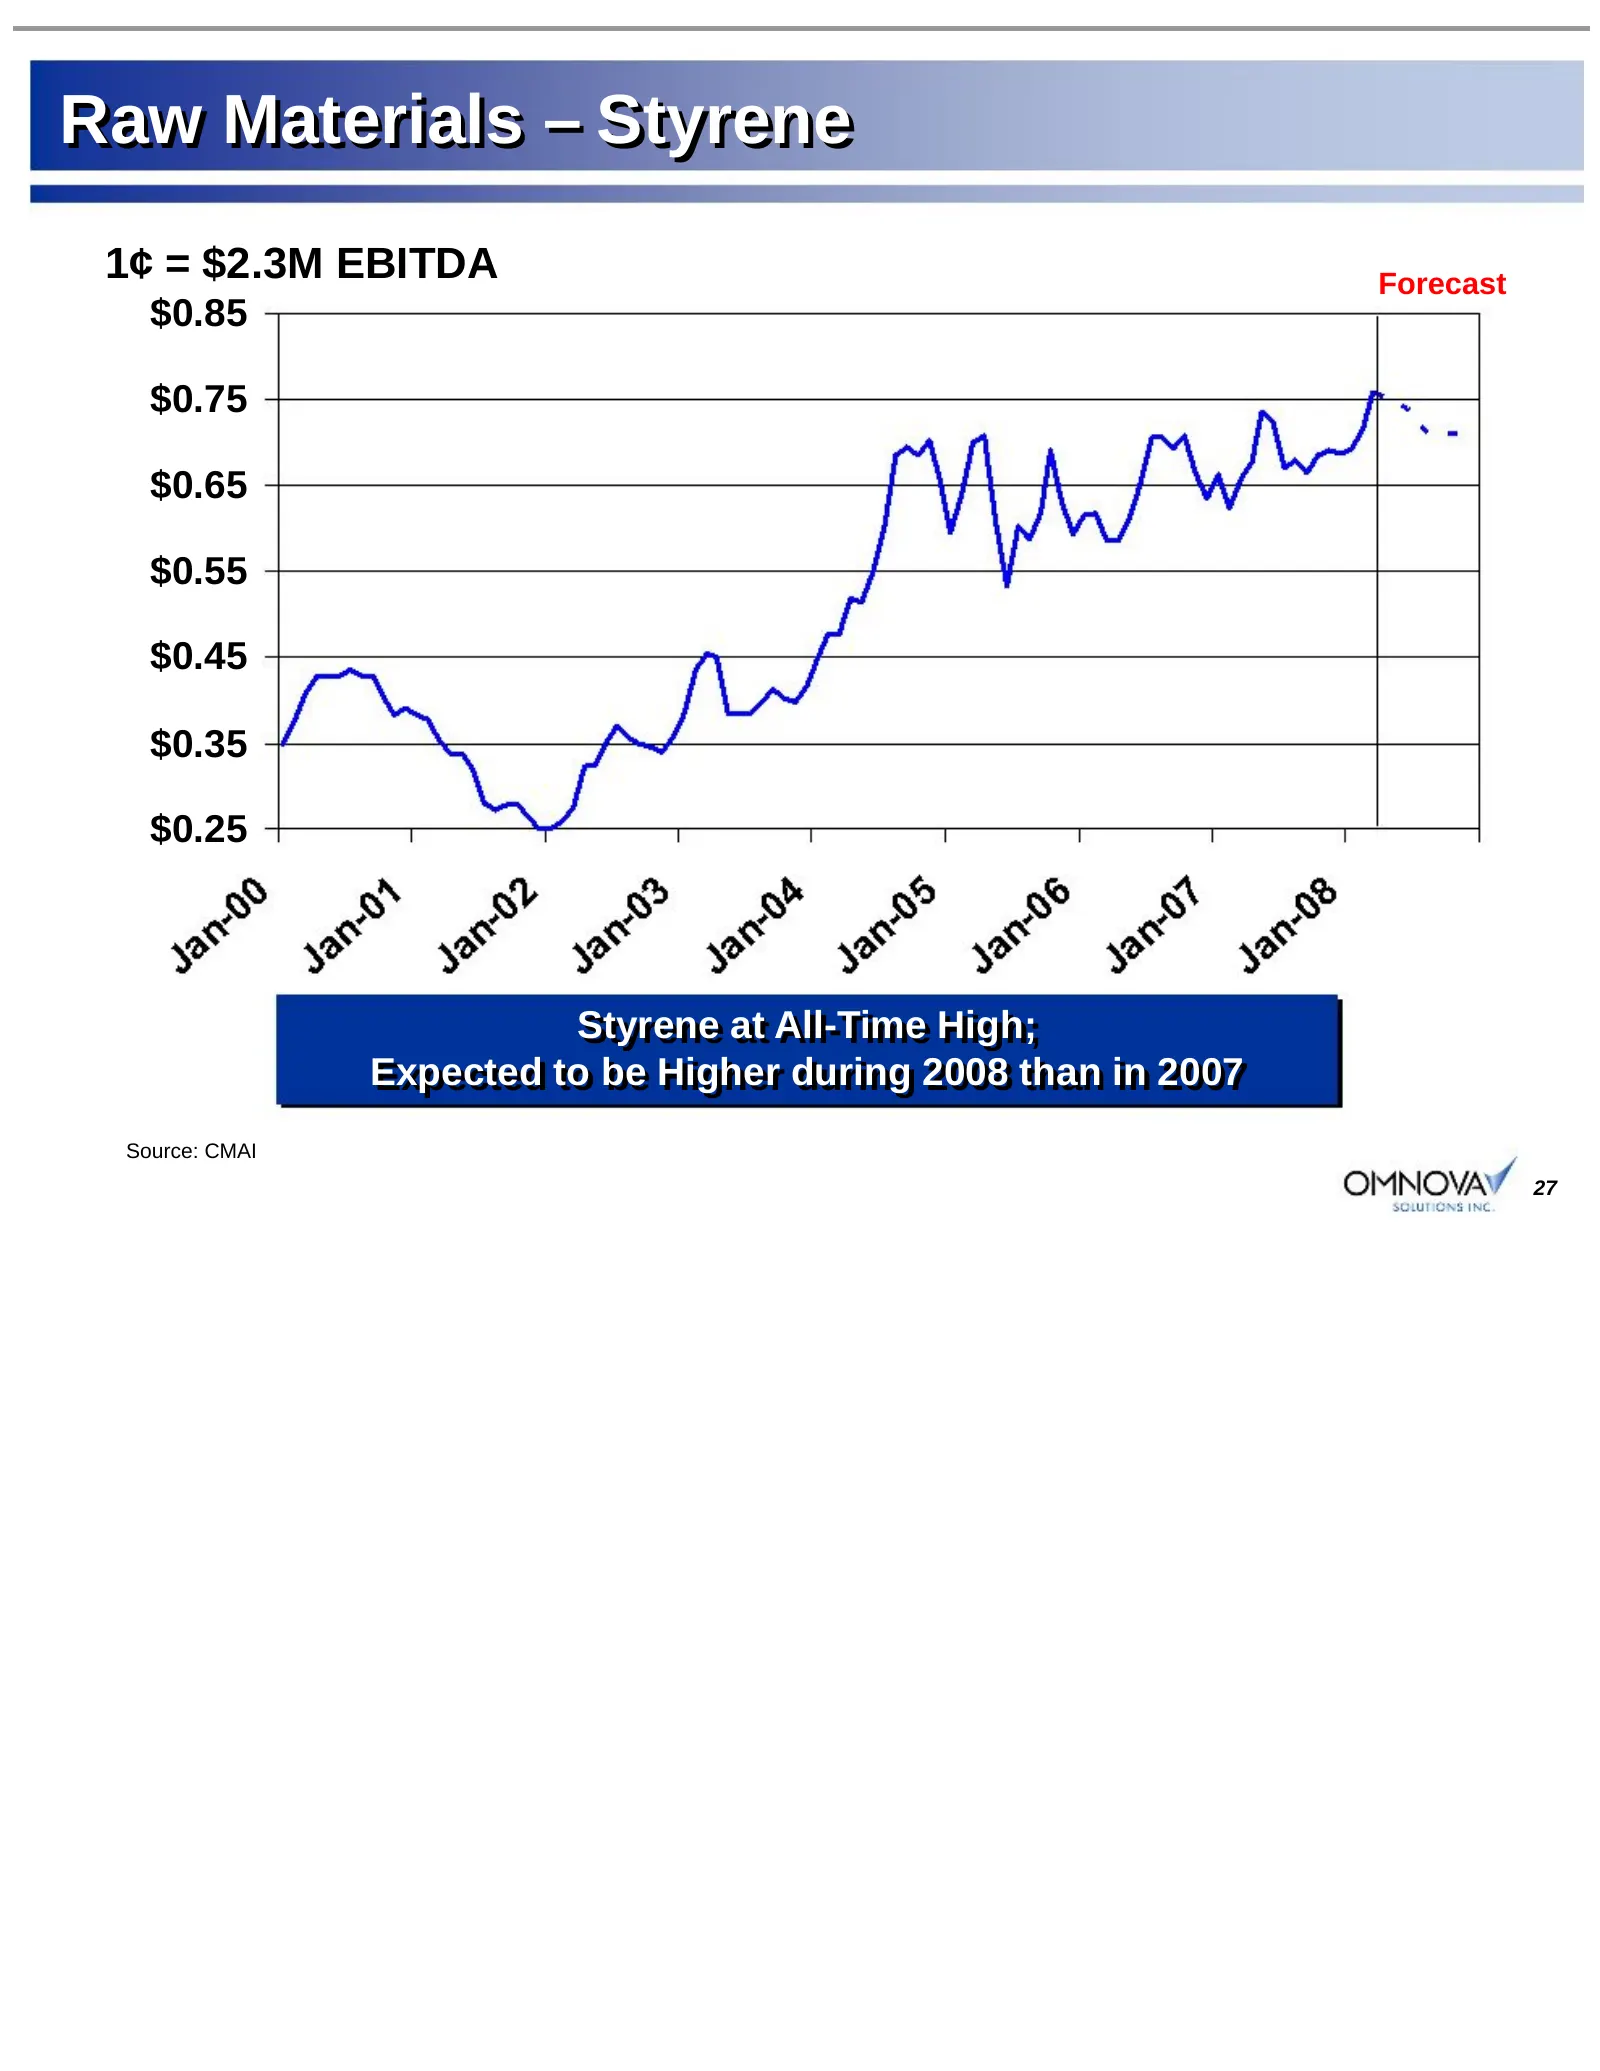
Raw Materials – Styrene 1¢ = $2.3M EBITDA Forecast $0.85 $0.75 $0.65 $0.55 $0.45 $0.35 $0.25 Styrene Styrene at at All-Time All-Time High; High; Expected Expected to to be be Higher Higher during during 2008 2008 than than in in 2007 2007 Source: CMAI 27
Slide 28: Raw Materials – Butadiene
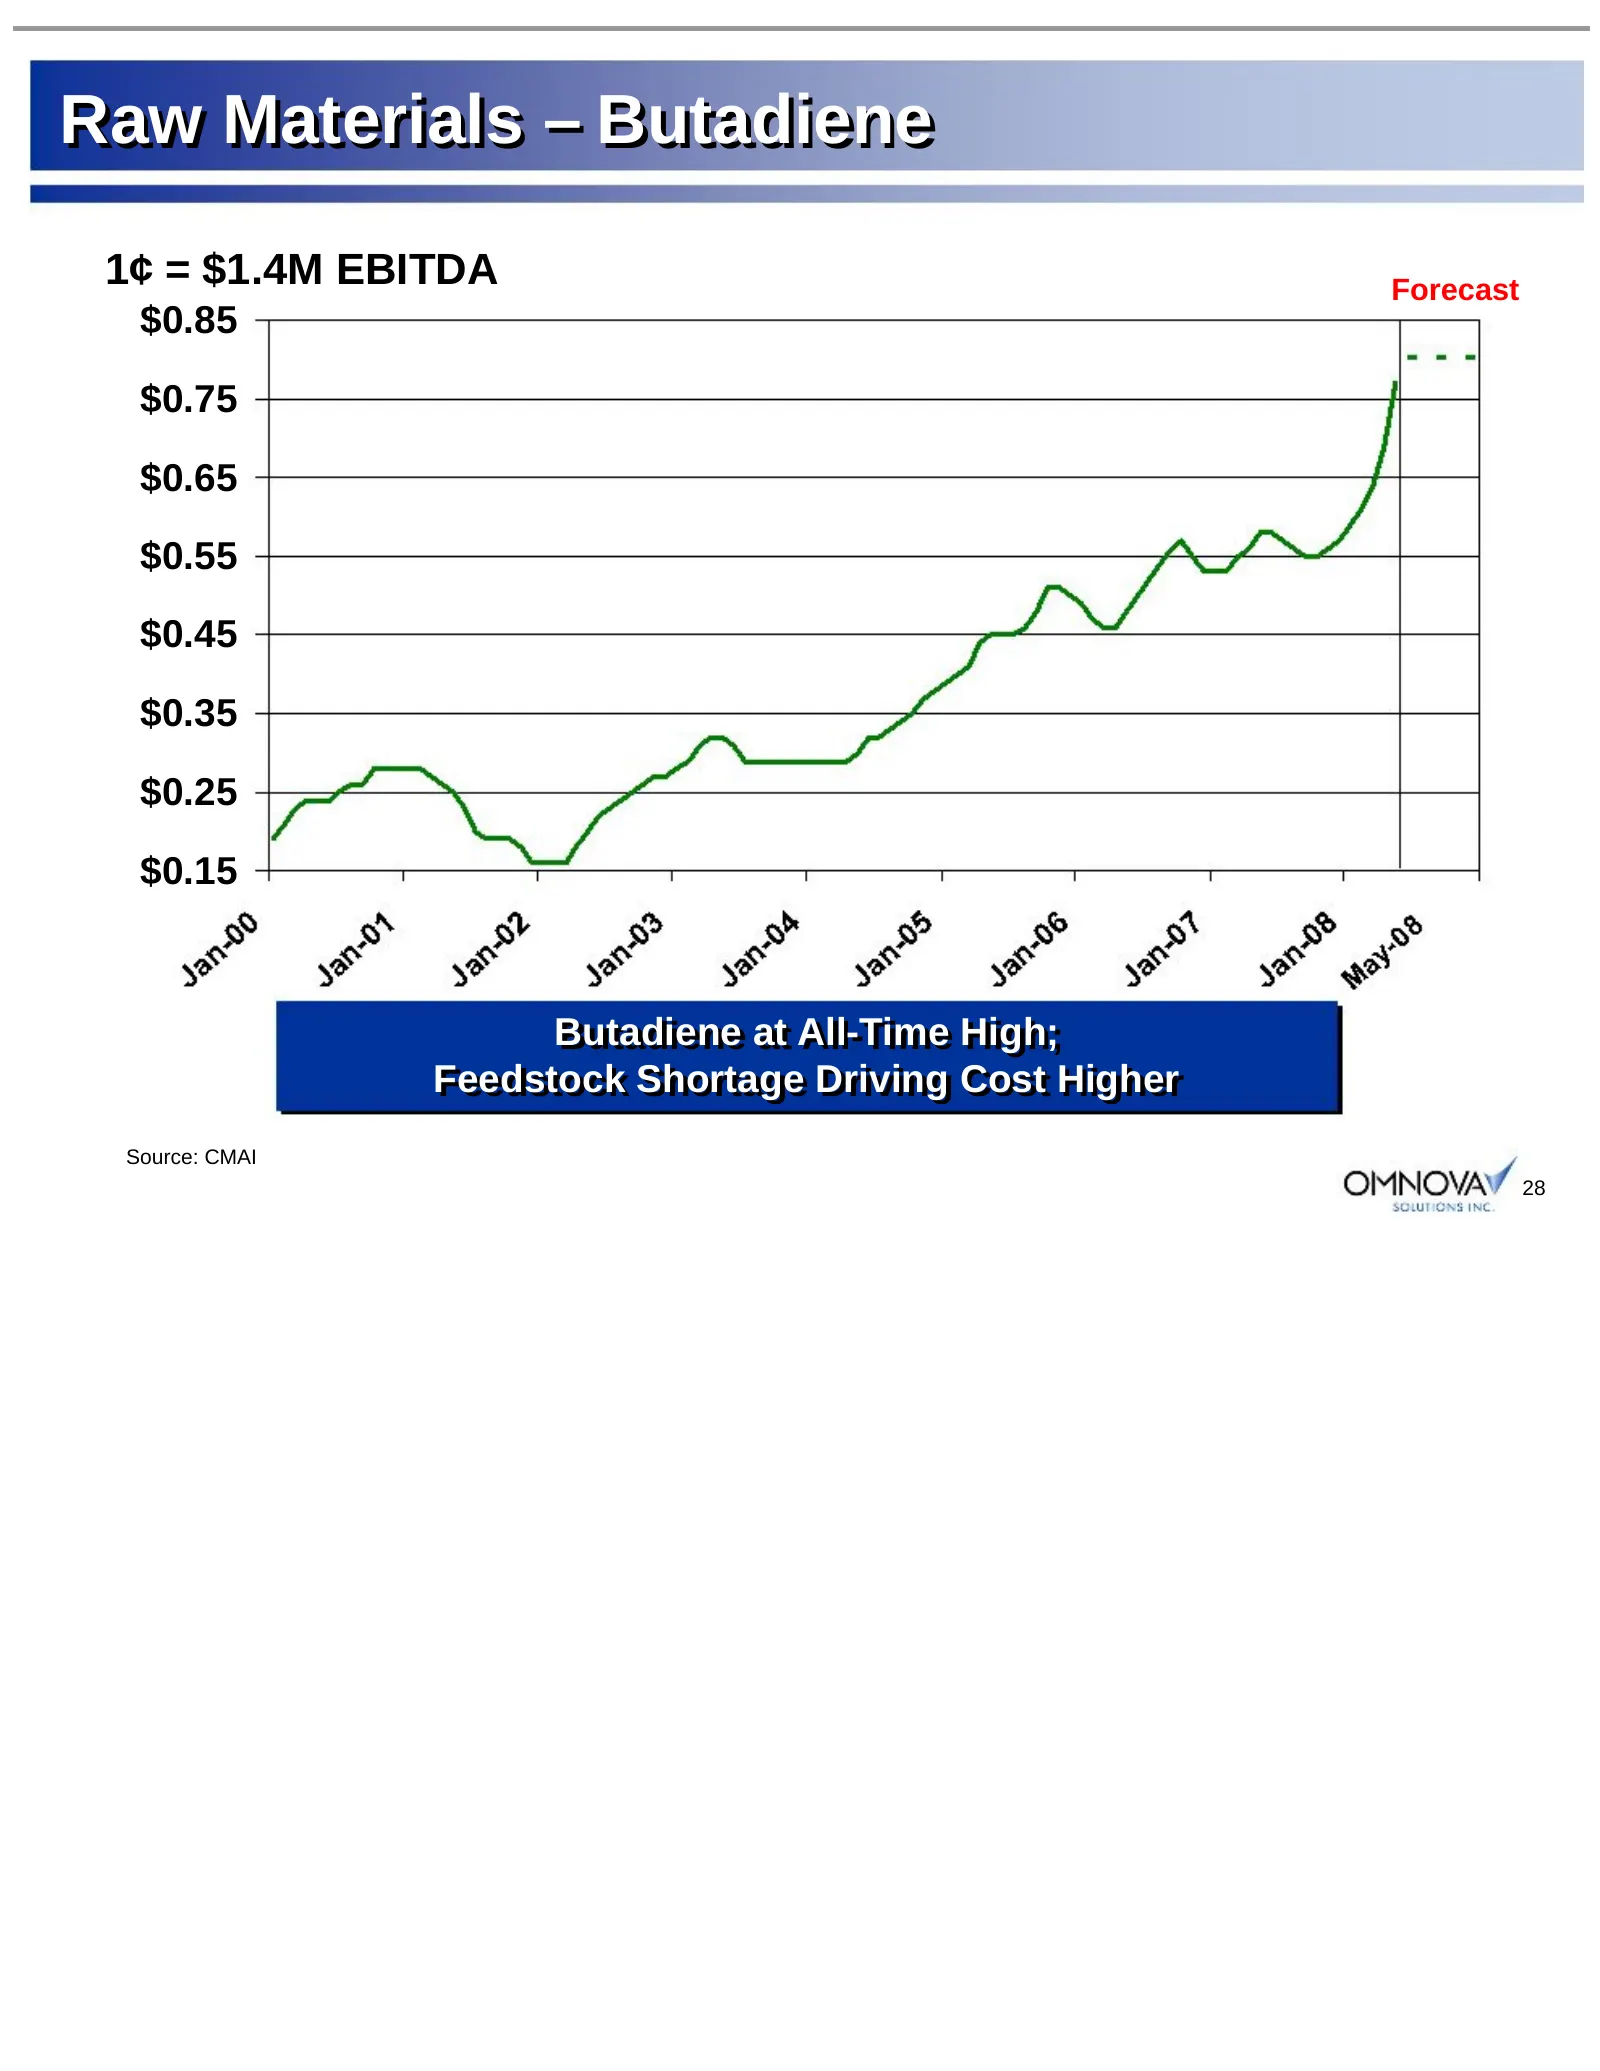
Raw Materials – Butadiene 1¢ = $1.4M EBITDA Forecast $0.85 $0.75 $0.65 $0.55 $0.45 $0.35 $0.25 $0.15 Butadiene Butadiene at at All-Time All-Time High; High; Feedstock Feedstock Shortage Shortage Driving Driving Cost Cost Higher Higher Source: CMAI 28
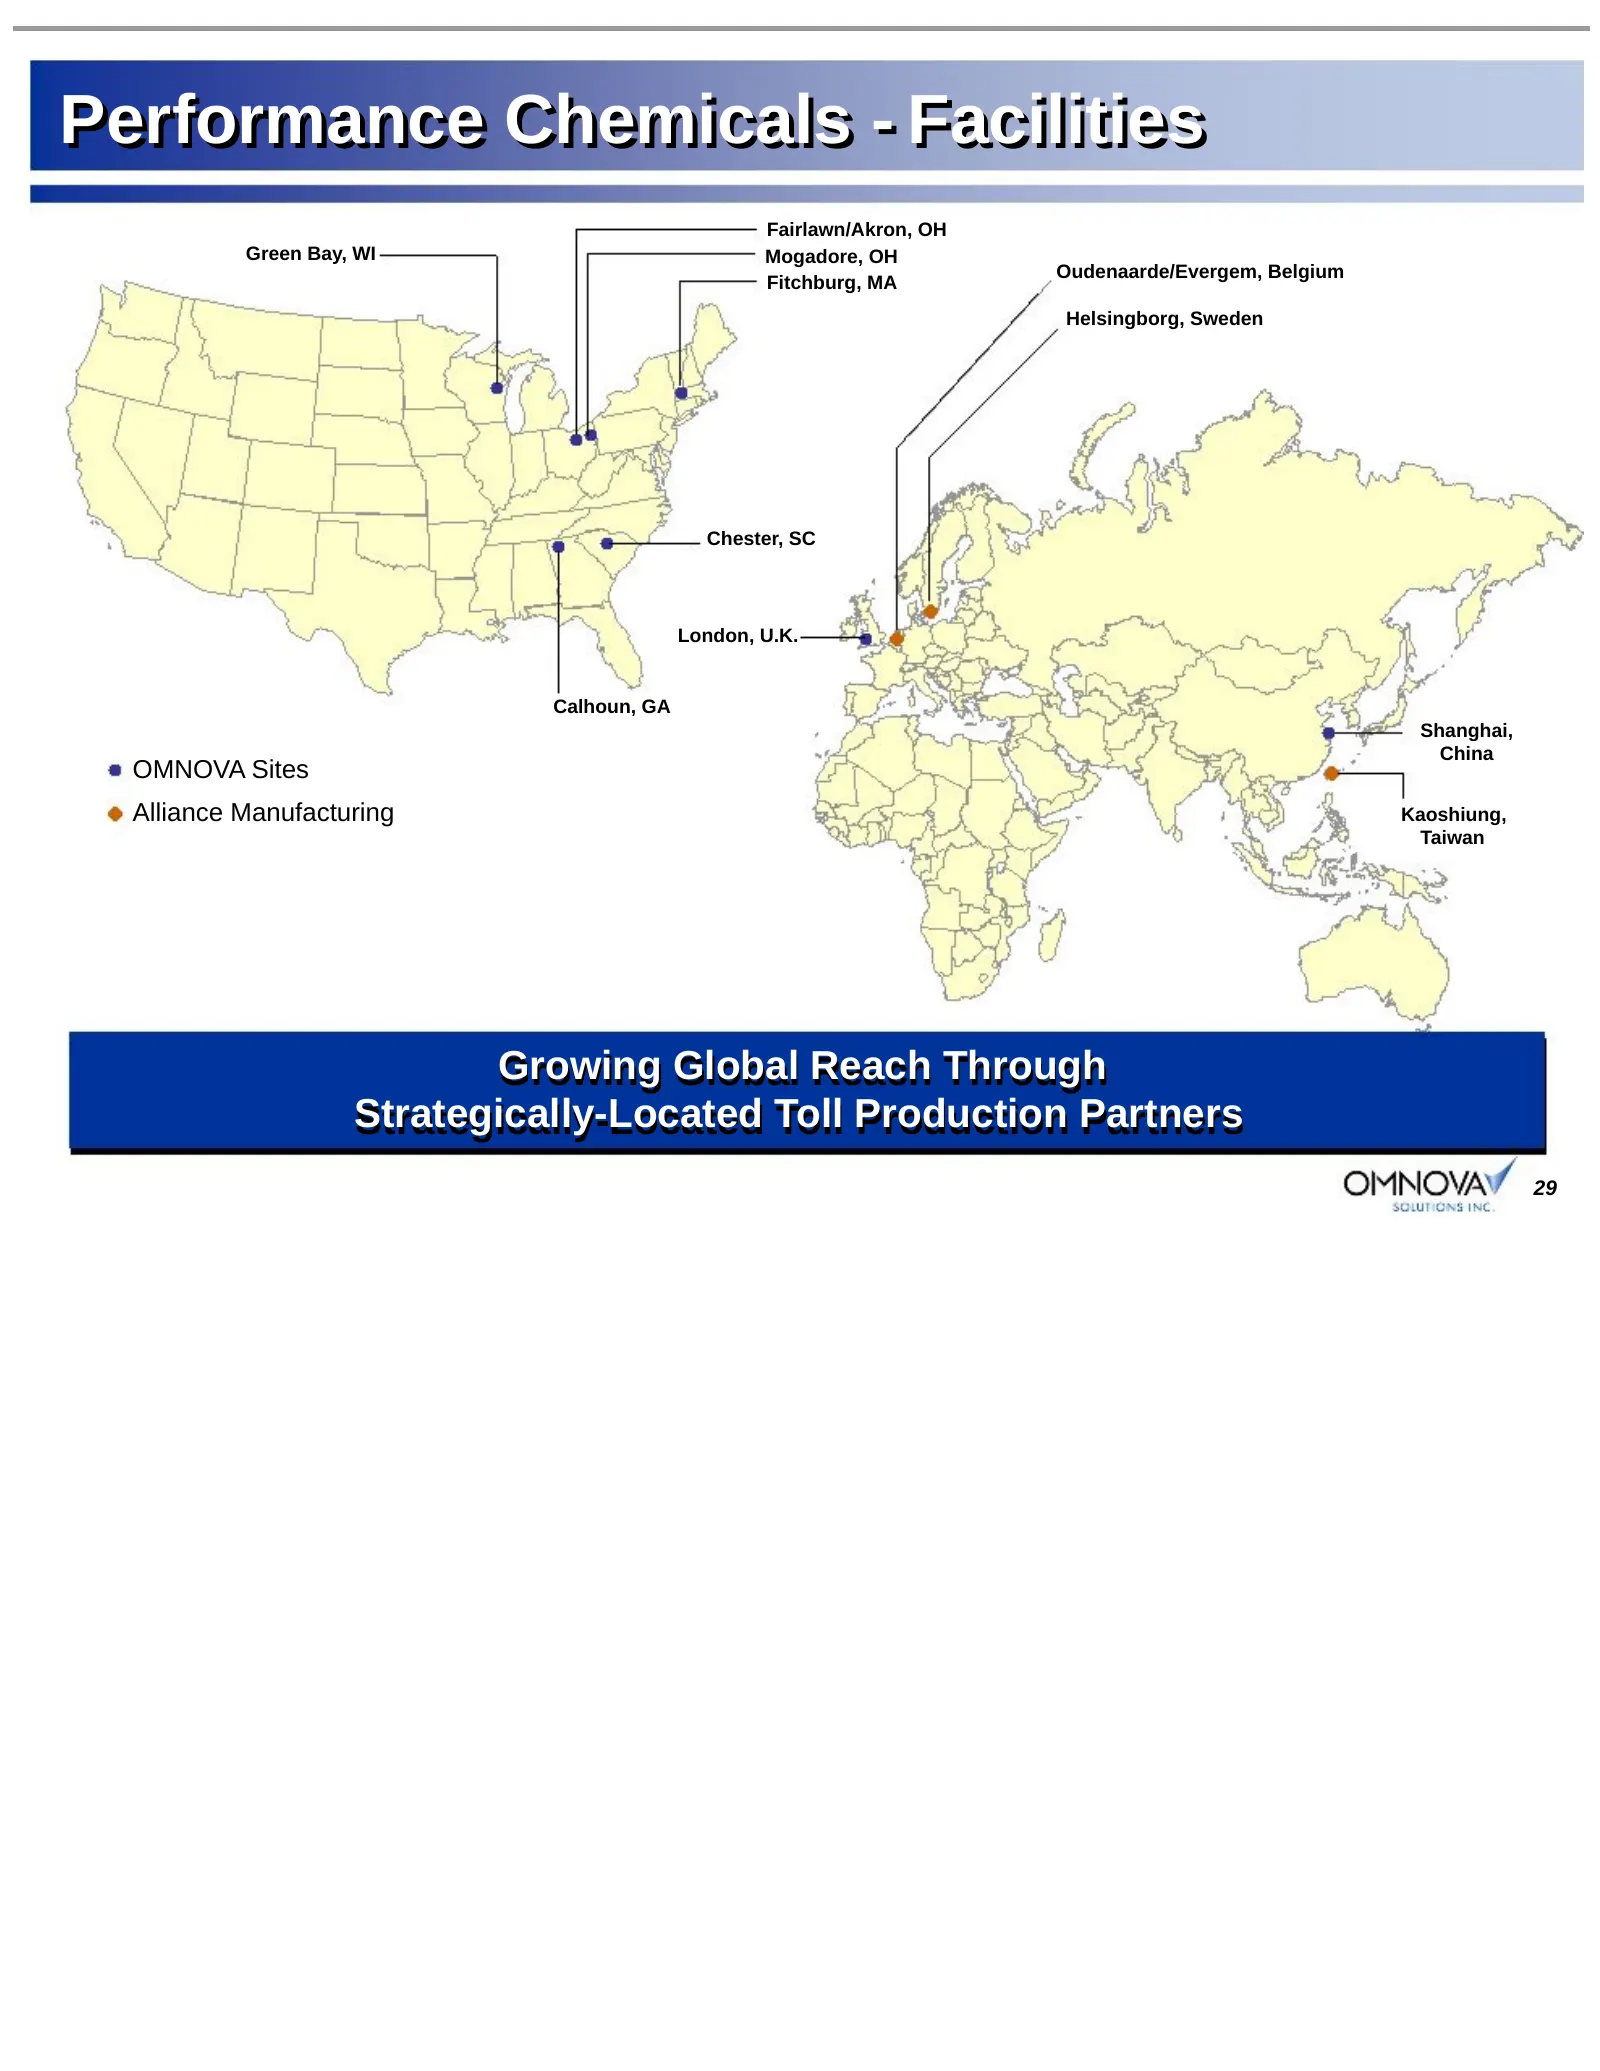
Slide 29: Performance Chemicals - Facilities
Performance Chemicals - Facilities Fairlawn/Akron, OH Green Bay, WI Mogadore, OH Oudenaarde/Evergem, Belgium Fitchburg, MA Helsingborg, Sweden Chester, SC London, U.K. Calhoun, GA Shanghai, China OMNOVA Sites Alliance Manufacturing Kaoshiung, Taiwan Growing Global Reach Through Strategically-Located
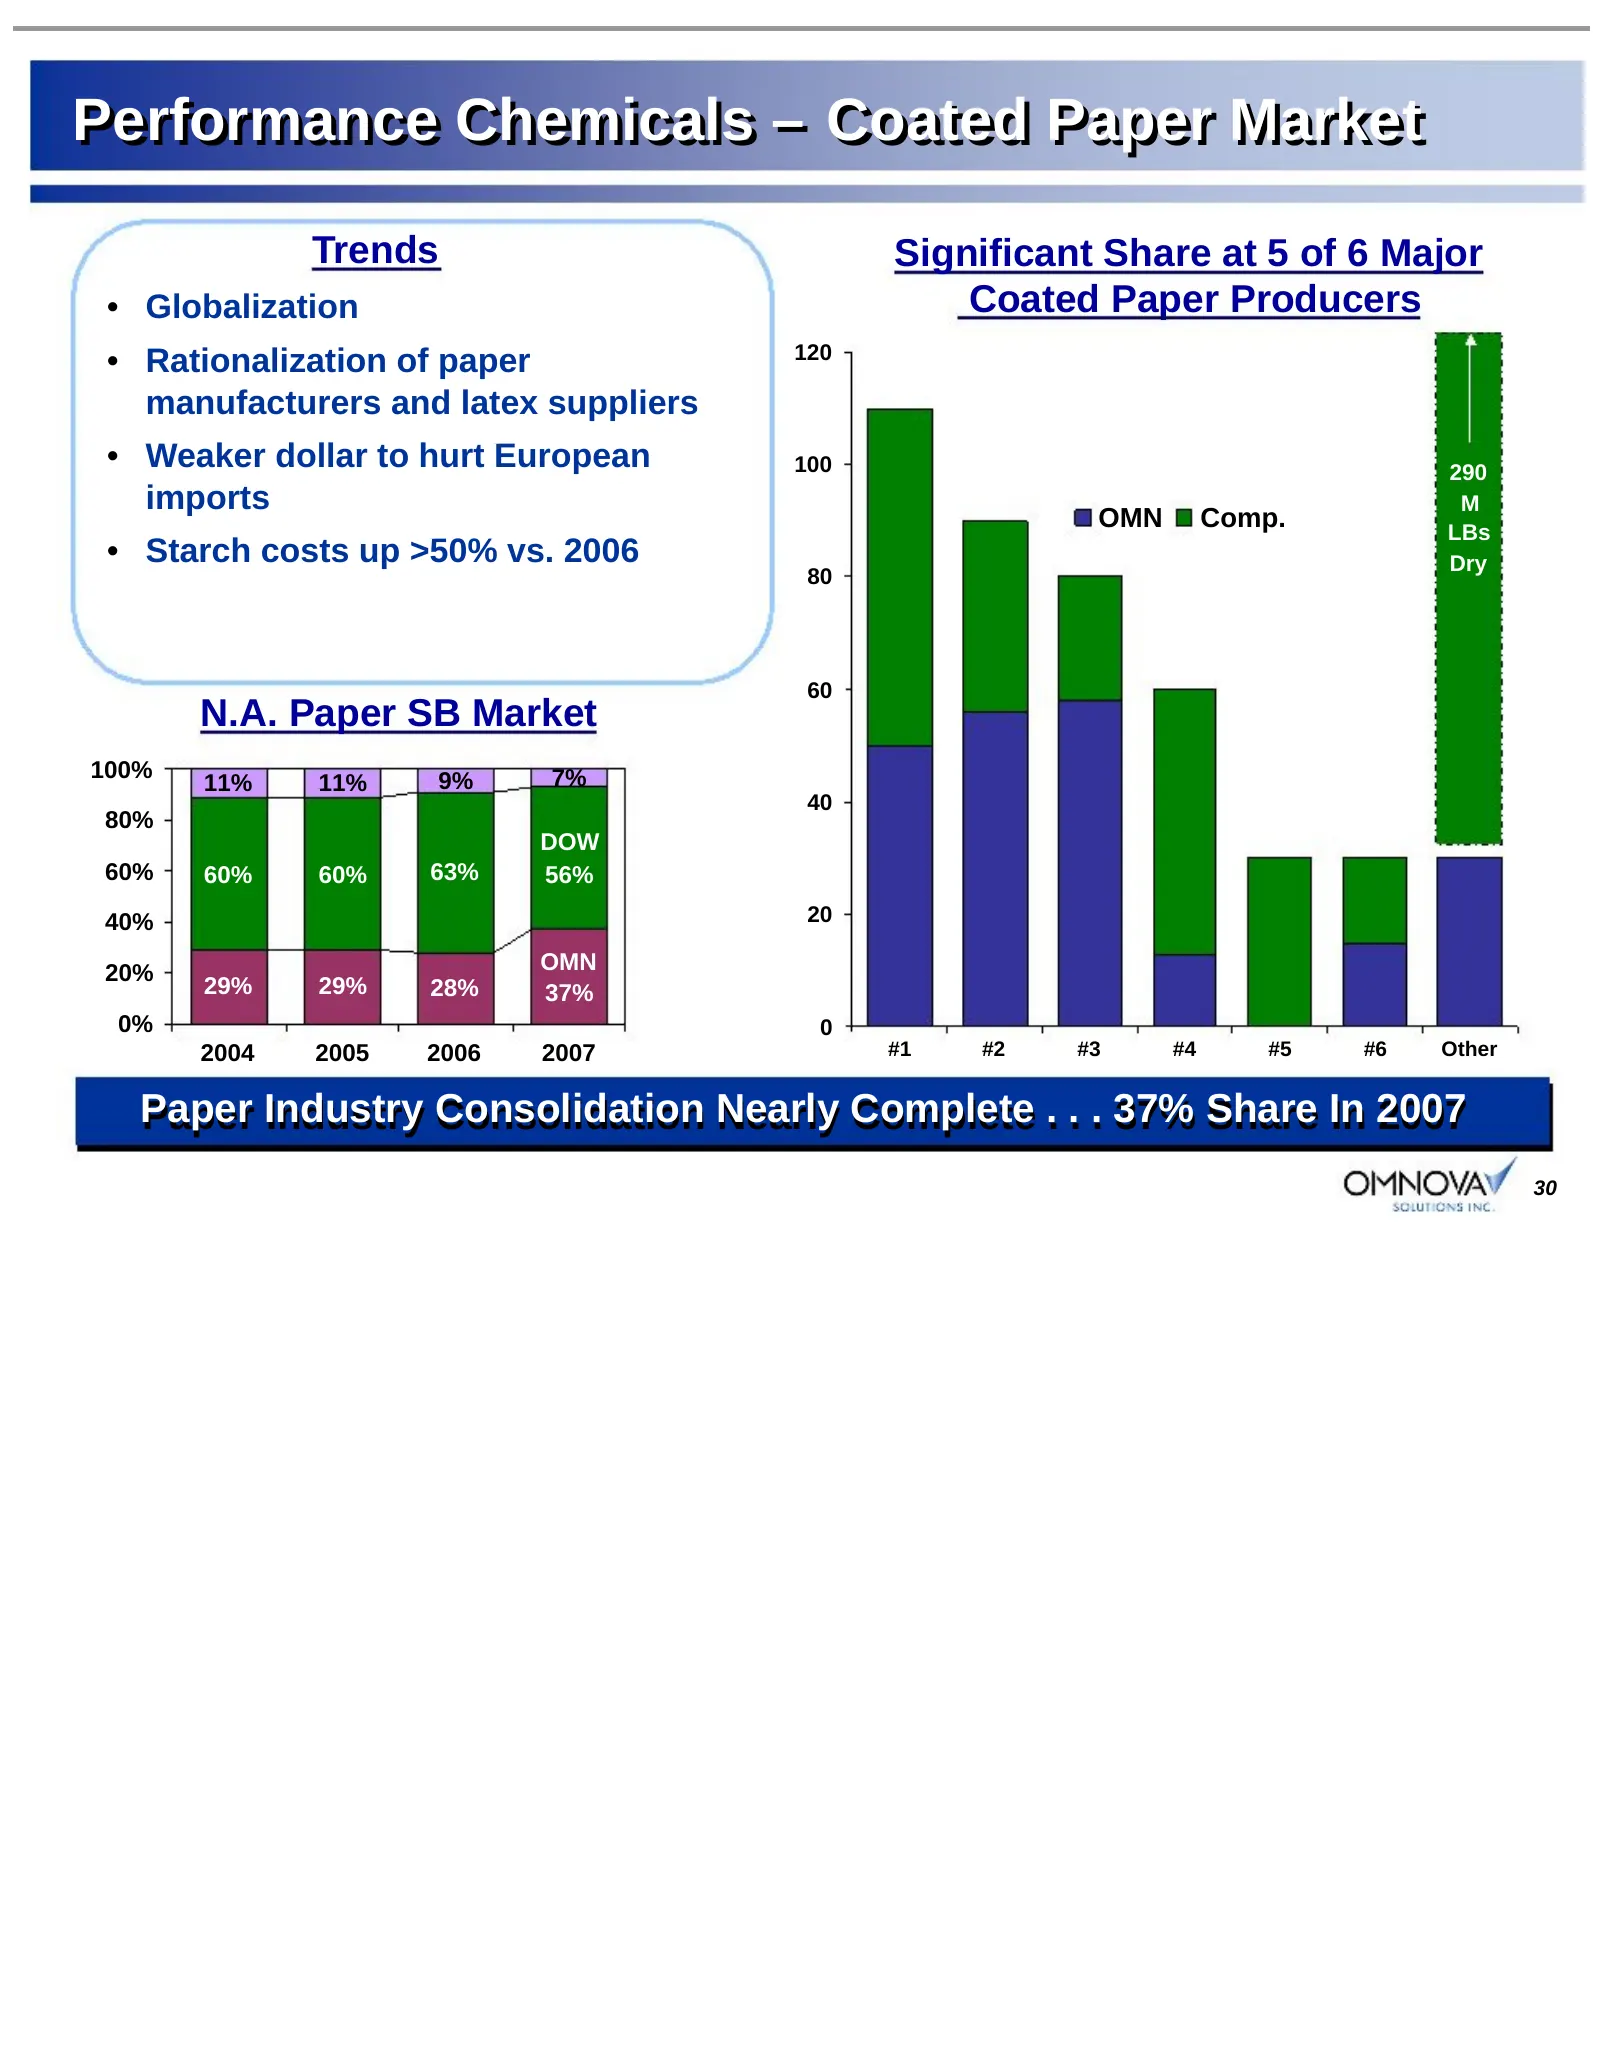
Slide 30: Performance Chemicals – Coated Paper Market
Performance Chemicals – Coated Paper Market Trends Significant Share at 5 of 6 Major • Globalization Coated Paper Producers • Rationalization of paper 120 manufacturers and latex suppliers • Weaker dollar to hurt European 100 290 imports M OMN Comp. LBs • Starch costs up >50% vs. 2006 Dry 80 60 N.A.
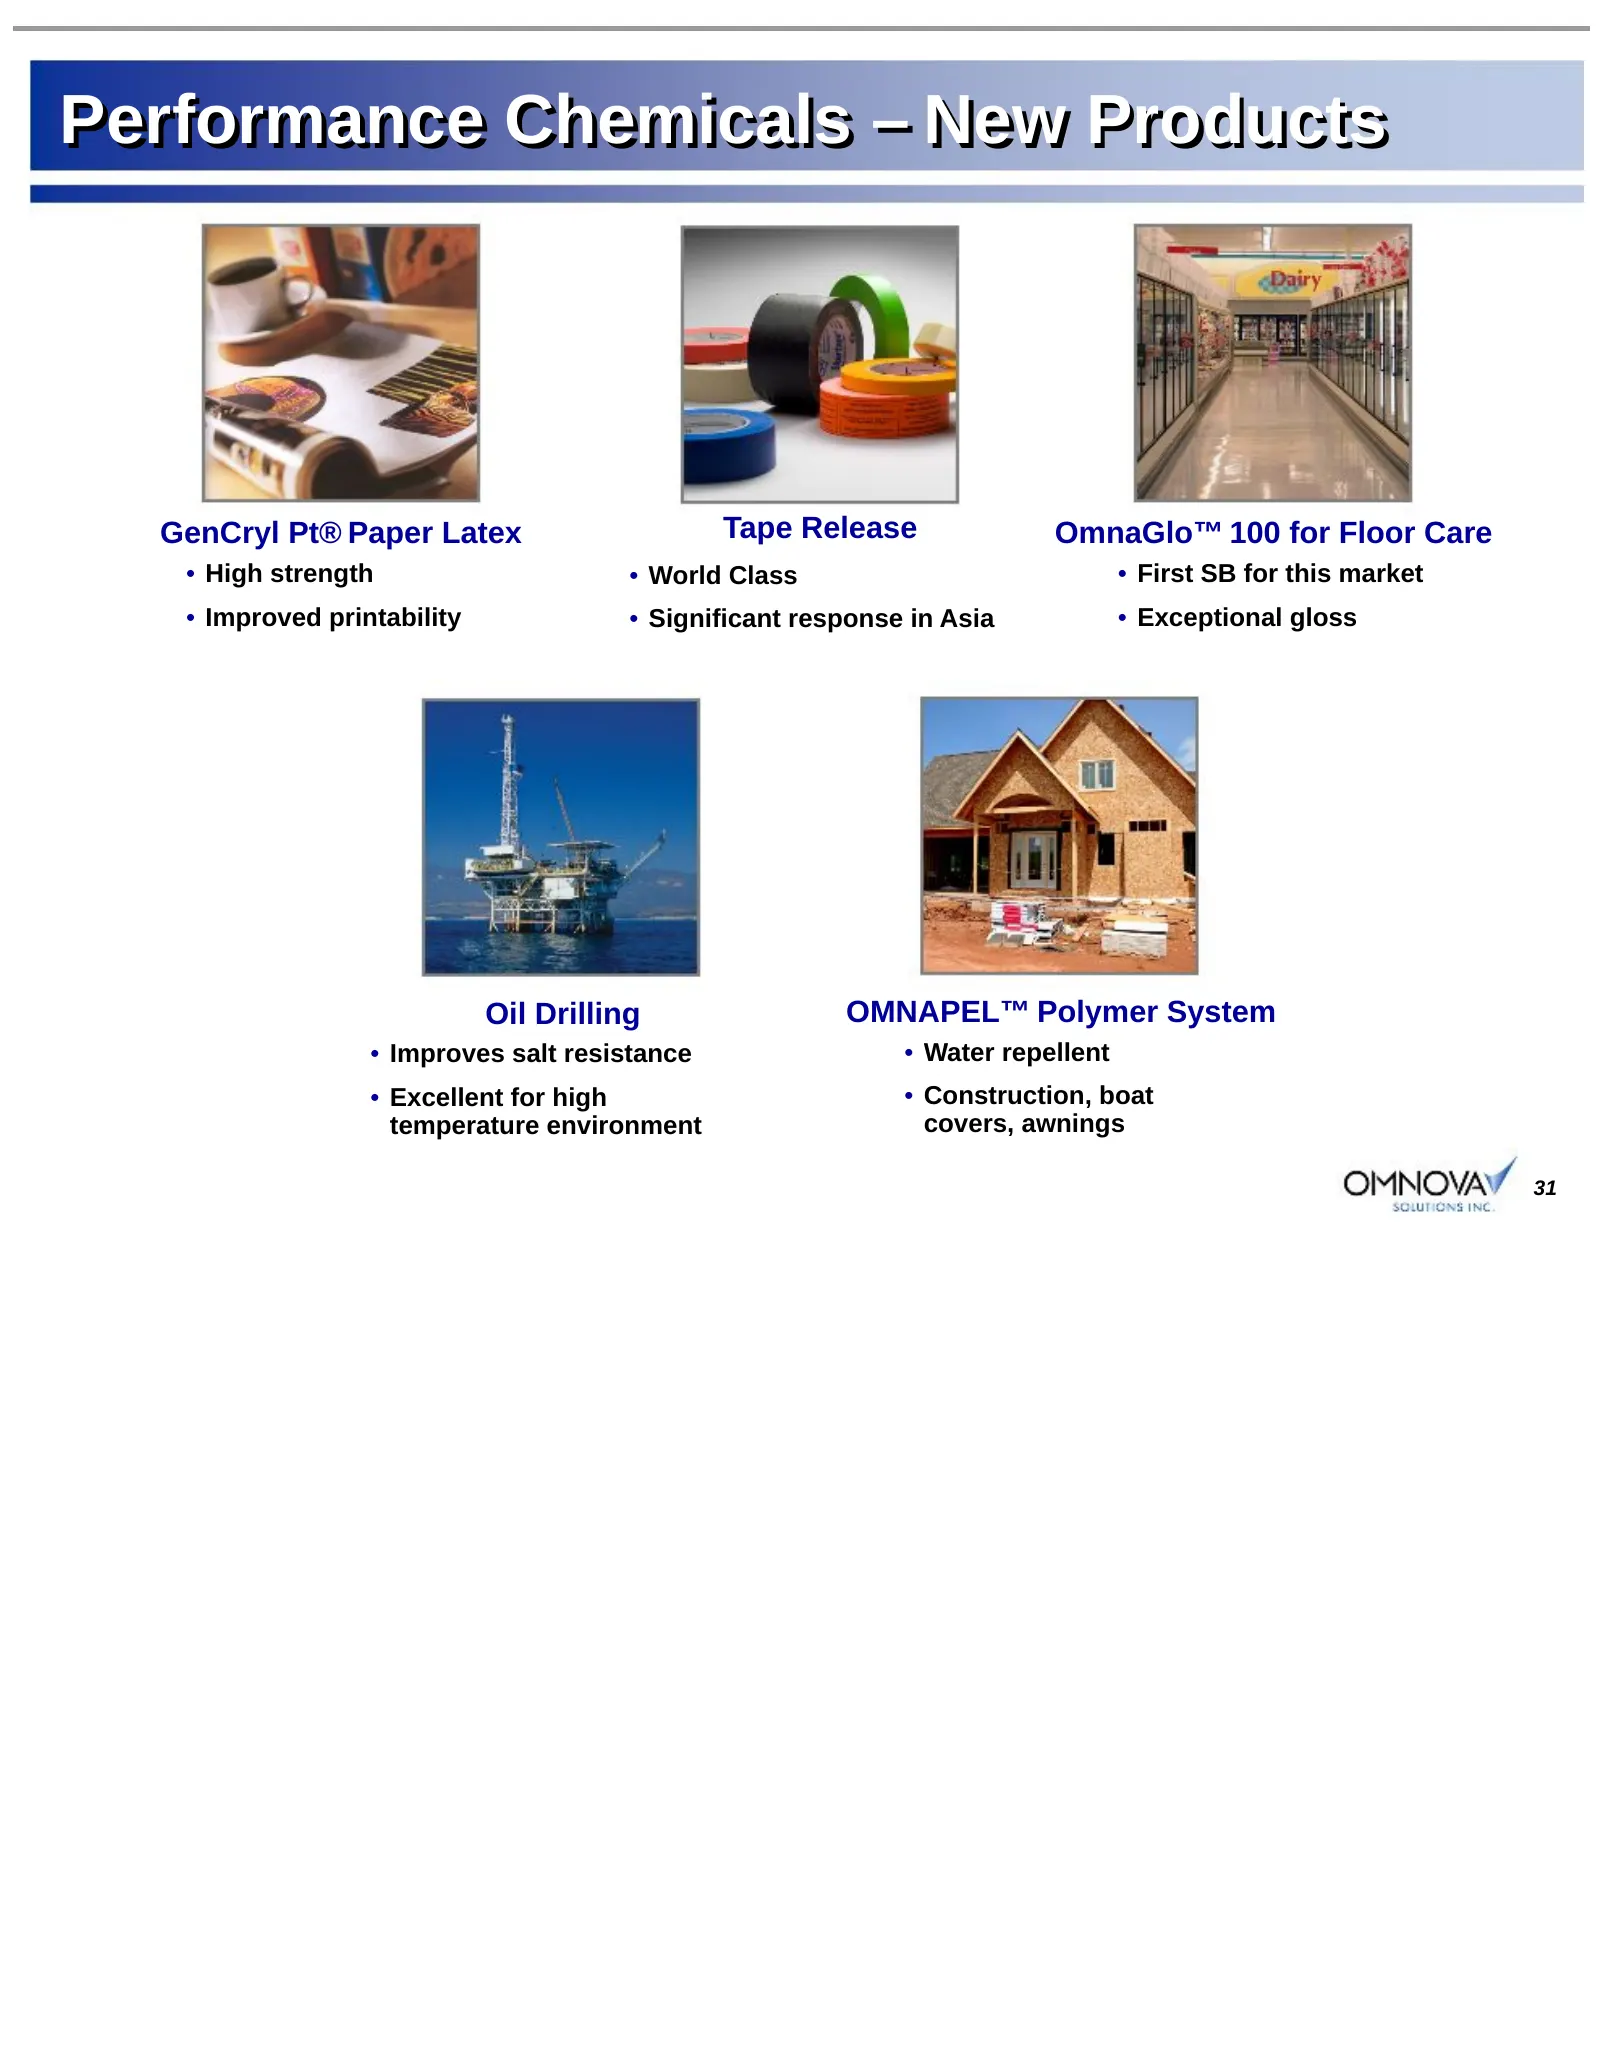
Slide 31: Performance Chemicals – New Products
Performance Chemicals – New Products GenCryl Pt® Paper Latex Tape Release OmnaGlo™ 100 for Floor Care • High strength • World Class • First SB for this market • Improved printability • Significant response in Asia • Exceptional gloss Oil Drilling OMNAPEL™ Polymer System • Improves salt resistance •
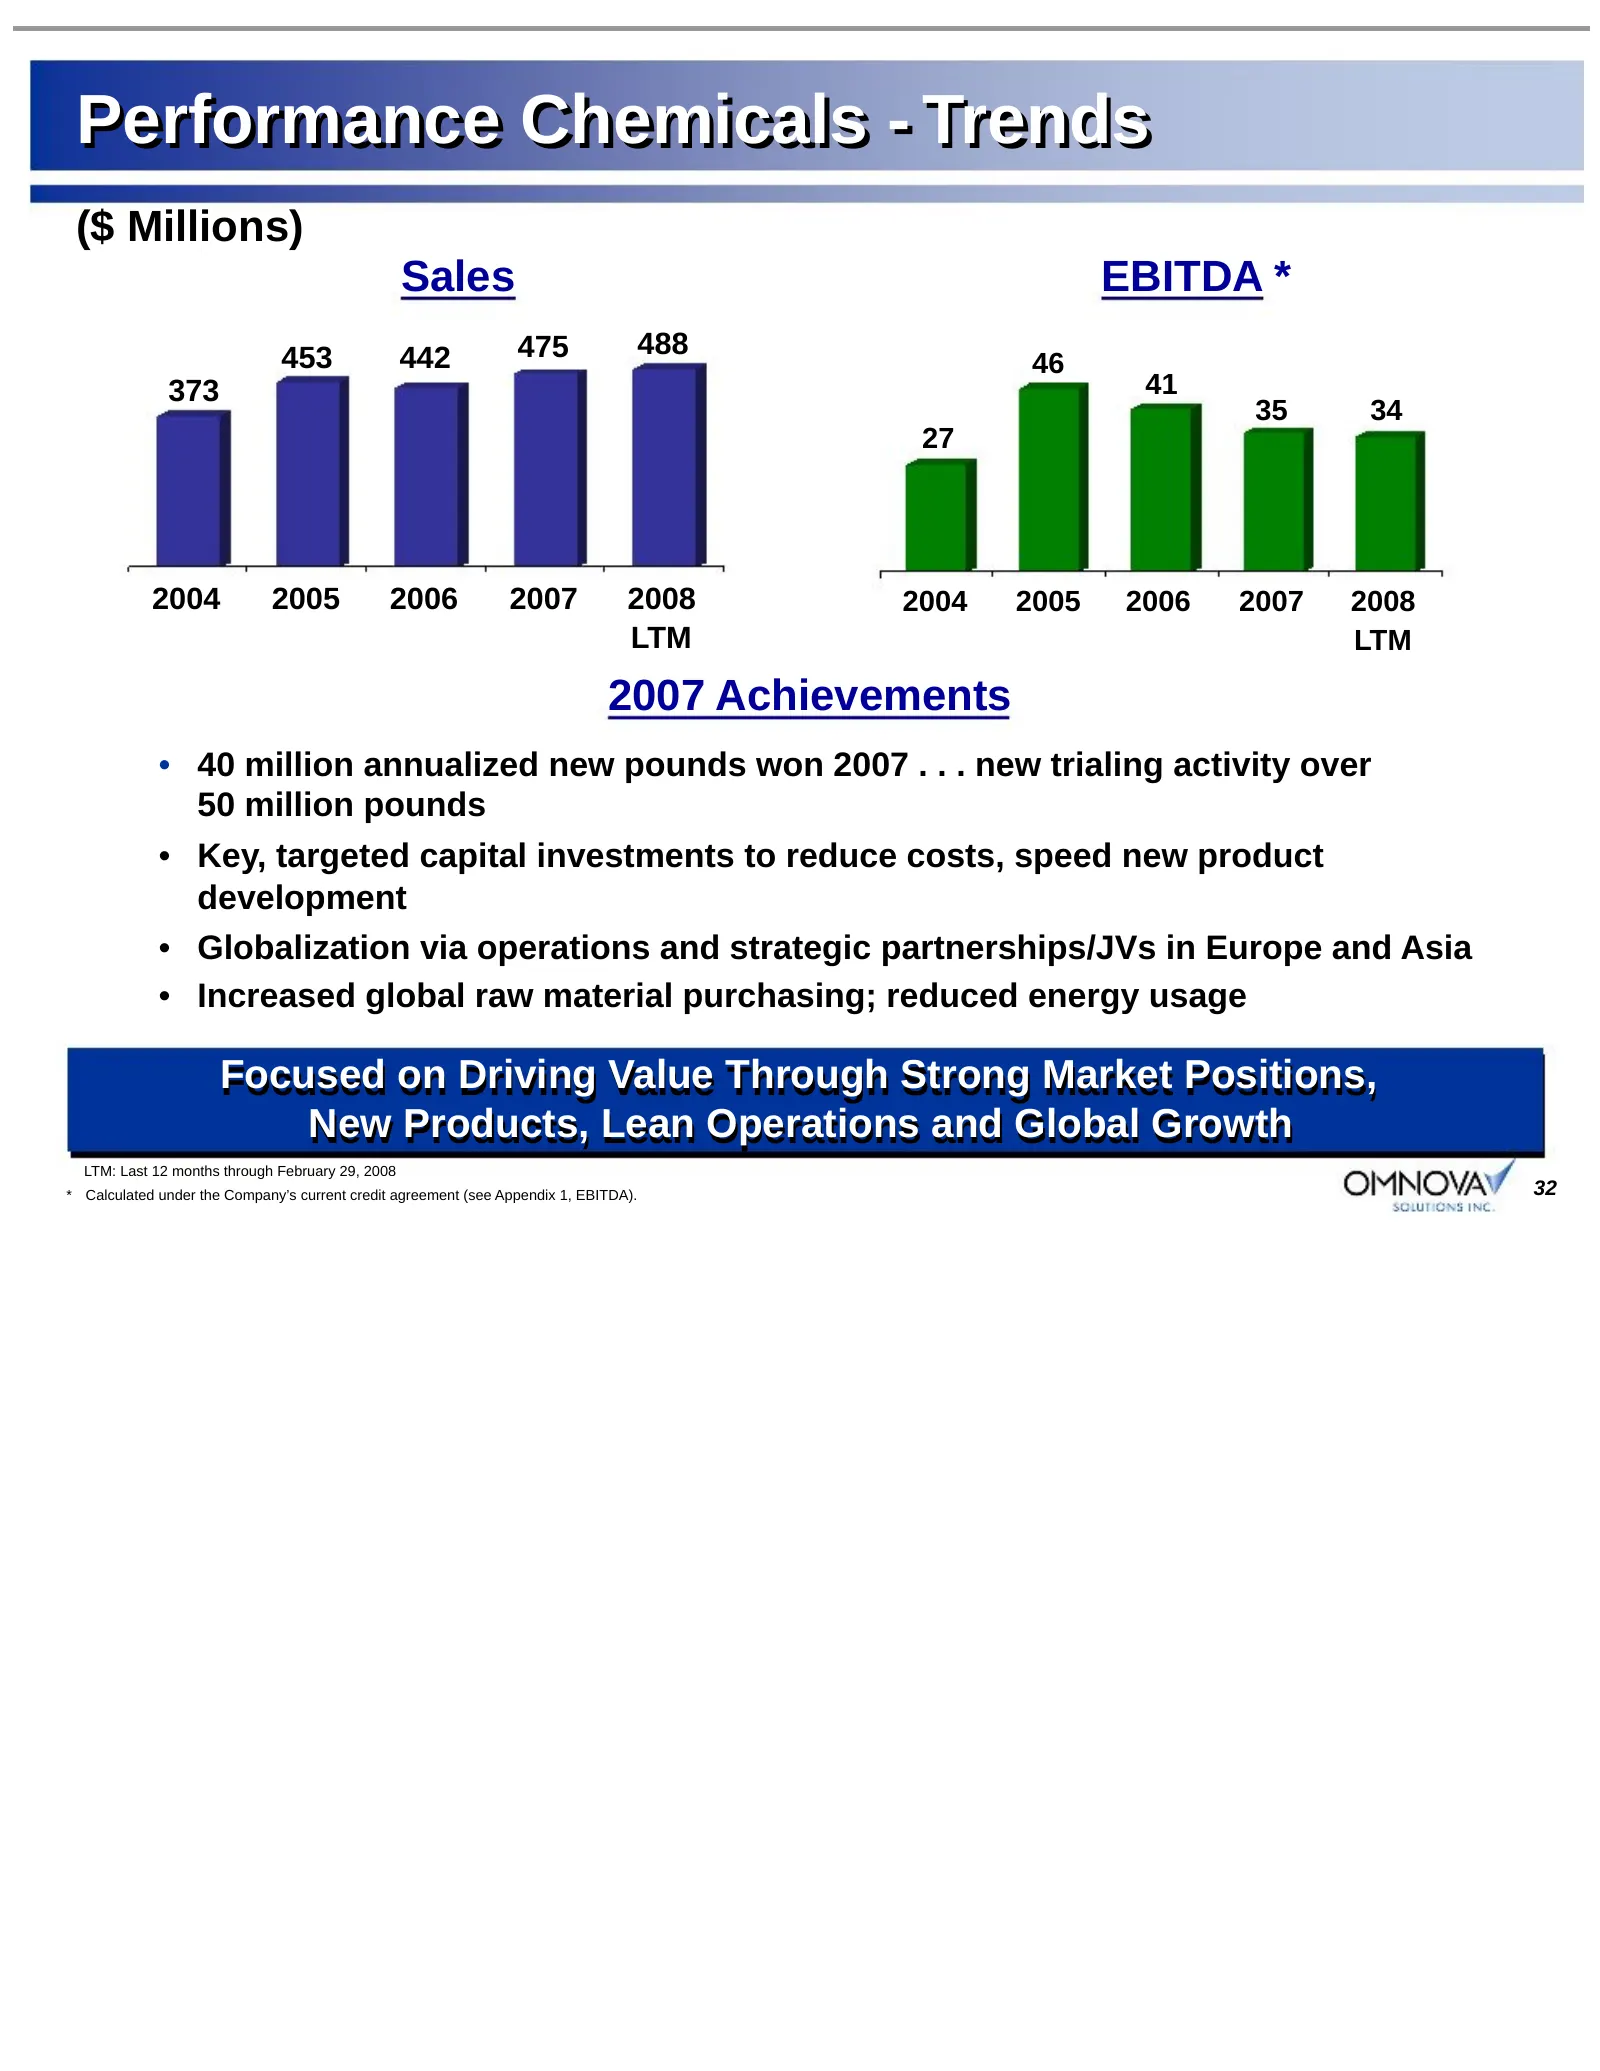
Slide 32: Performance Chemicals - Trends
Performance Chemicals - Trends ($ Millions) Sales EBITDA * 453 442 475 488 46 373 41 35 34 27 2004 2005 2006 2007 2008 2004 2005 2006 2007 2008 LTM LTM 2007 Achievements • 40 million annualized new pounds won 2007 . . . new trialing activity over 50 million pounds • Key, targeted capital investments
Slide 33: OMNOVA’s Sustainability Focus
OMNOVA’s Sustainability Focus • Continuous improvement towards sustainability with focus on: – Conservation/selection of raw materials – Reduced energy and water use – Improved air quality: emissions and indoor – Reduced waste and landfill use – Facilitation of reuse/recycling – Extension of product
Slide 34: Why Invest In OMNOVA?
Why Invest In OMNOVA? • Leading market positions • Diverse products, customers and end markets • Pursuing aggressive pricing initiatives necessary to offset inflation • Much lower cost base…significant operating leverage – Latex capacity rationalization – Refinancing to reduce interest cost by $9 mi
Slide 35: Financial Highlights
FINANCIAL HIGHLIGHTS OMNOVAY. 38
Slide 36: Streamlined Operations - Cost Management
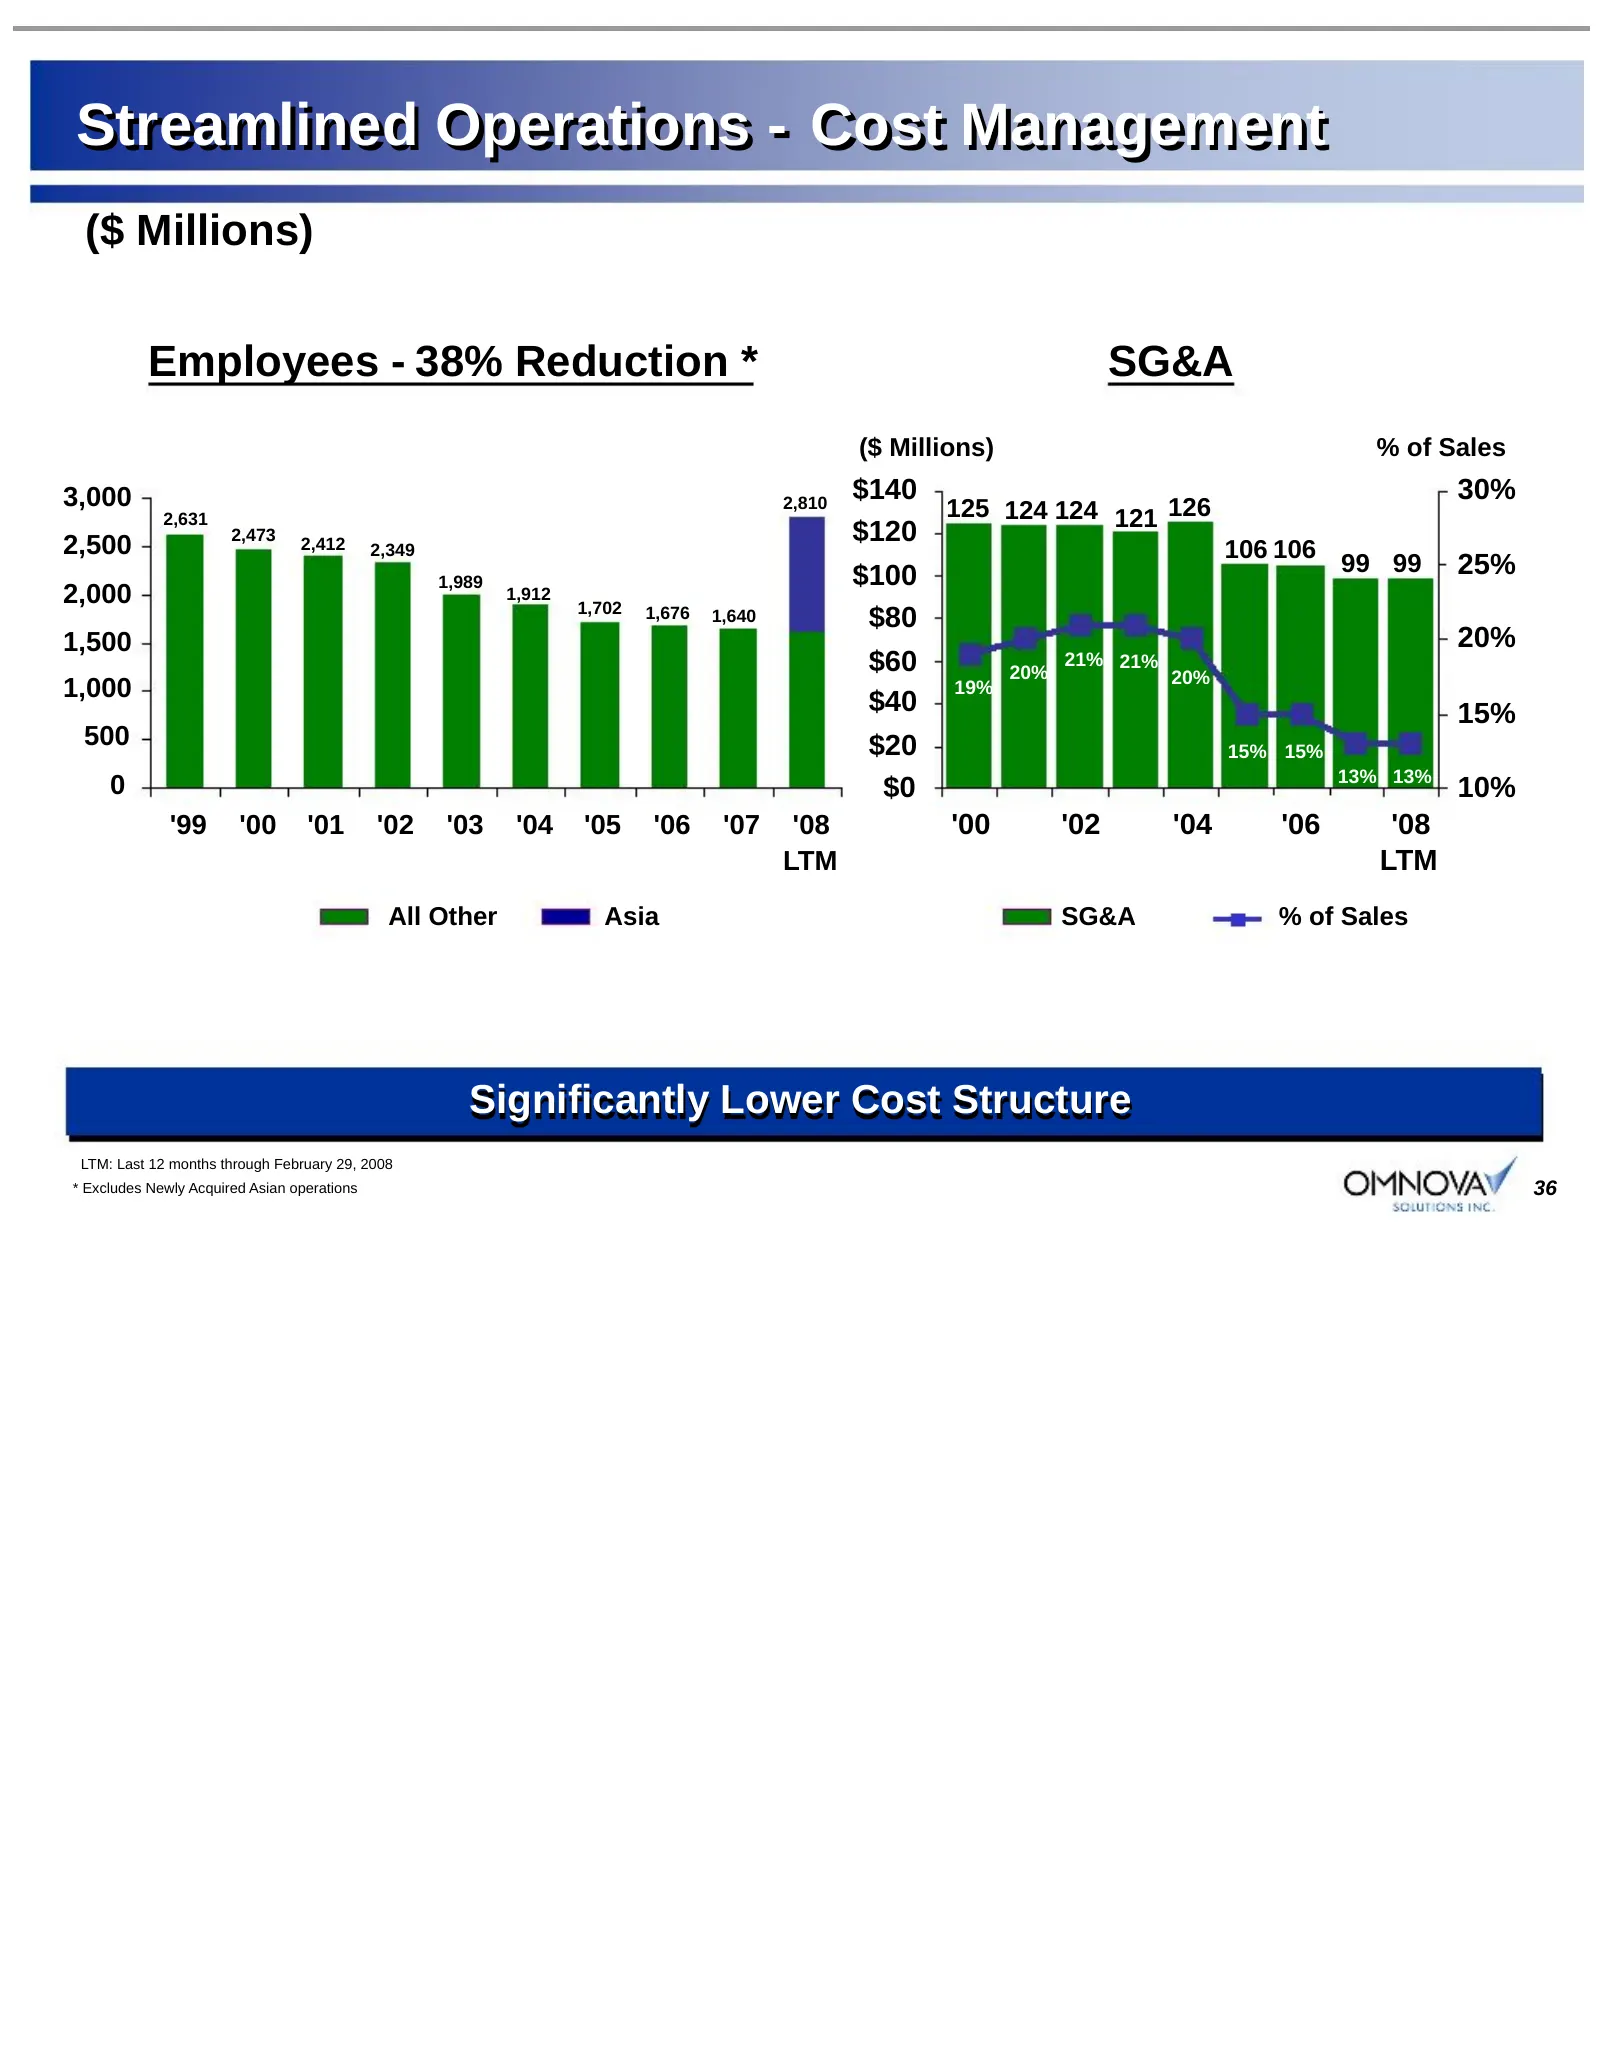
Streamlined Operations - Cost Management ($ Millions) Employees - 38% Reduction * SG&A ($ Millions) % of Sales 3,000 $140 30% 2,631 2,810 125 124 124 121 126 2,500 2,473 2,412 $120 2,349 106 106 99 99 25% 1,989 $100 2,000 1,912 1,702 1,676 1,640 $80 1,500 20% $60 20% 21% 21% 20% 1,000 19% $40 15% 50
Slide 37: Streamlined Operations
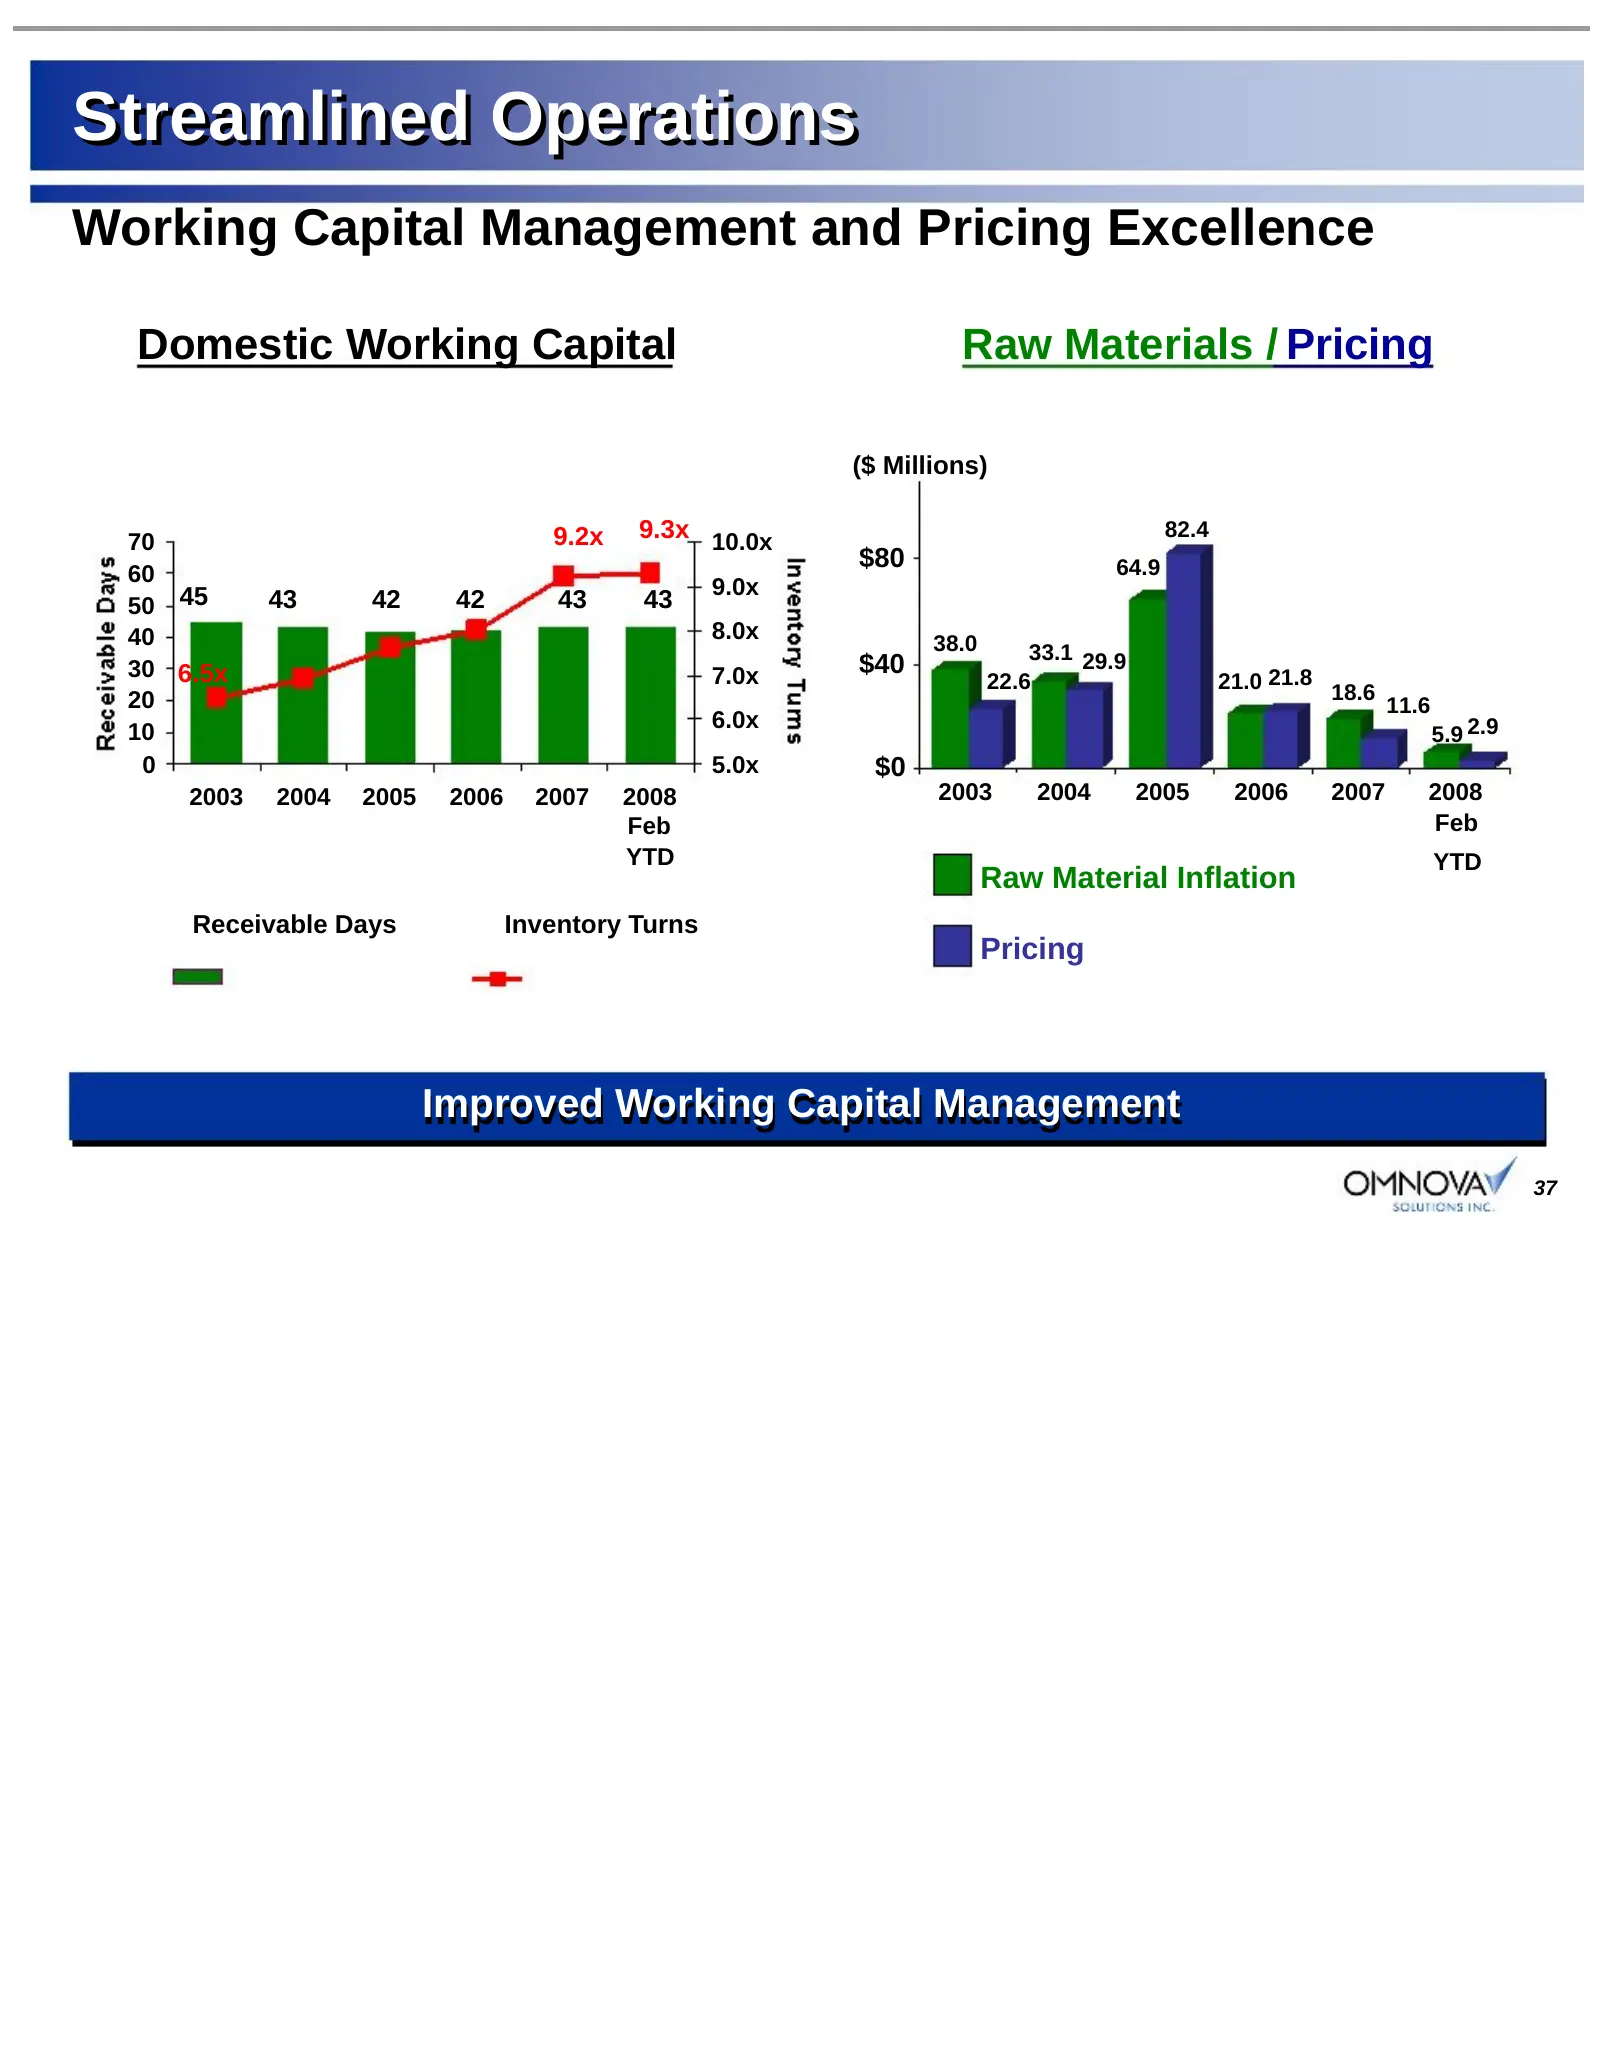
Streamlined Operations Working Capital Management and Pricing Excellence Domestic Working Capital Raw Materials / Pricing ($ Millions) 70 9.2x 9.3x 10.0x 82.4 $80 64.9 60 9.0x 50 45 43 42 42 43 43 40 8.0x 38.0 33.1 29.9 30 6.5x 7.0x $40 22.6 21.0 21.8 18.6 20 11.6 6.0x 10 5.9 2.9 0 5.0x $0 2003 2004
Slide 38: Streamlined Operations – Pension Management
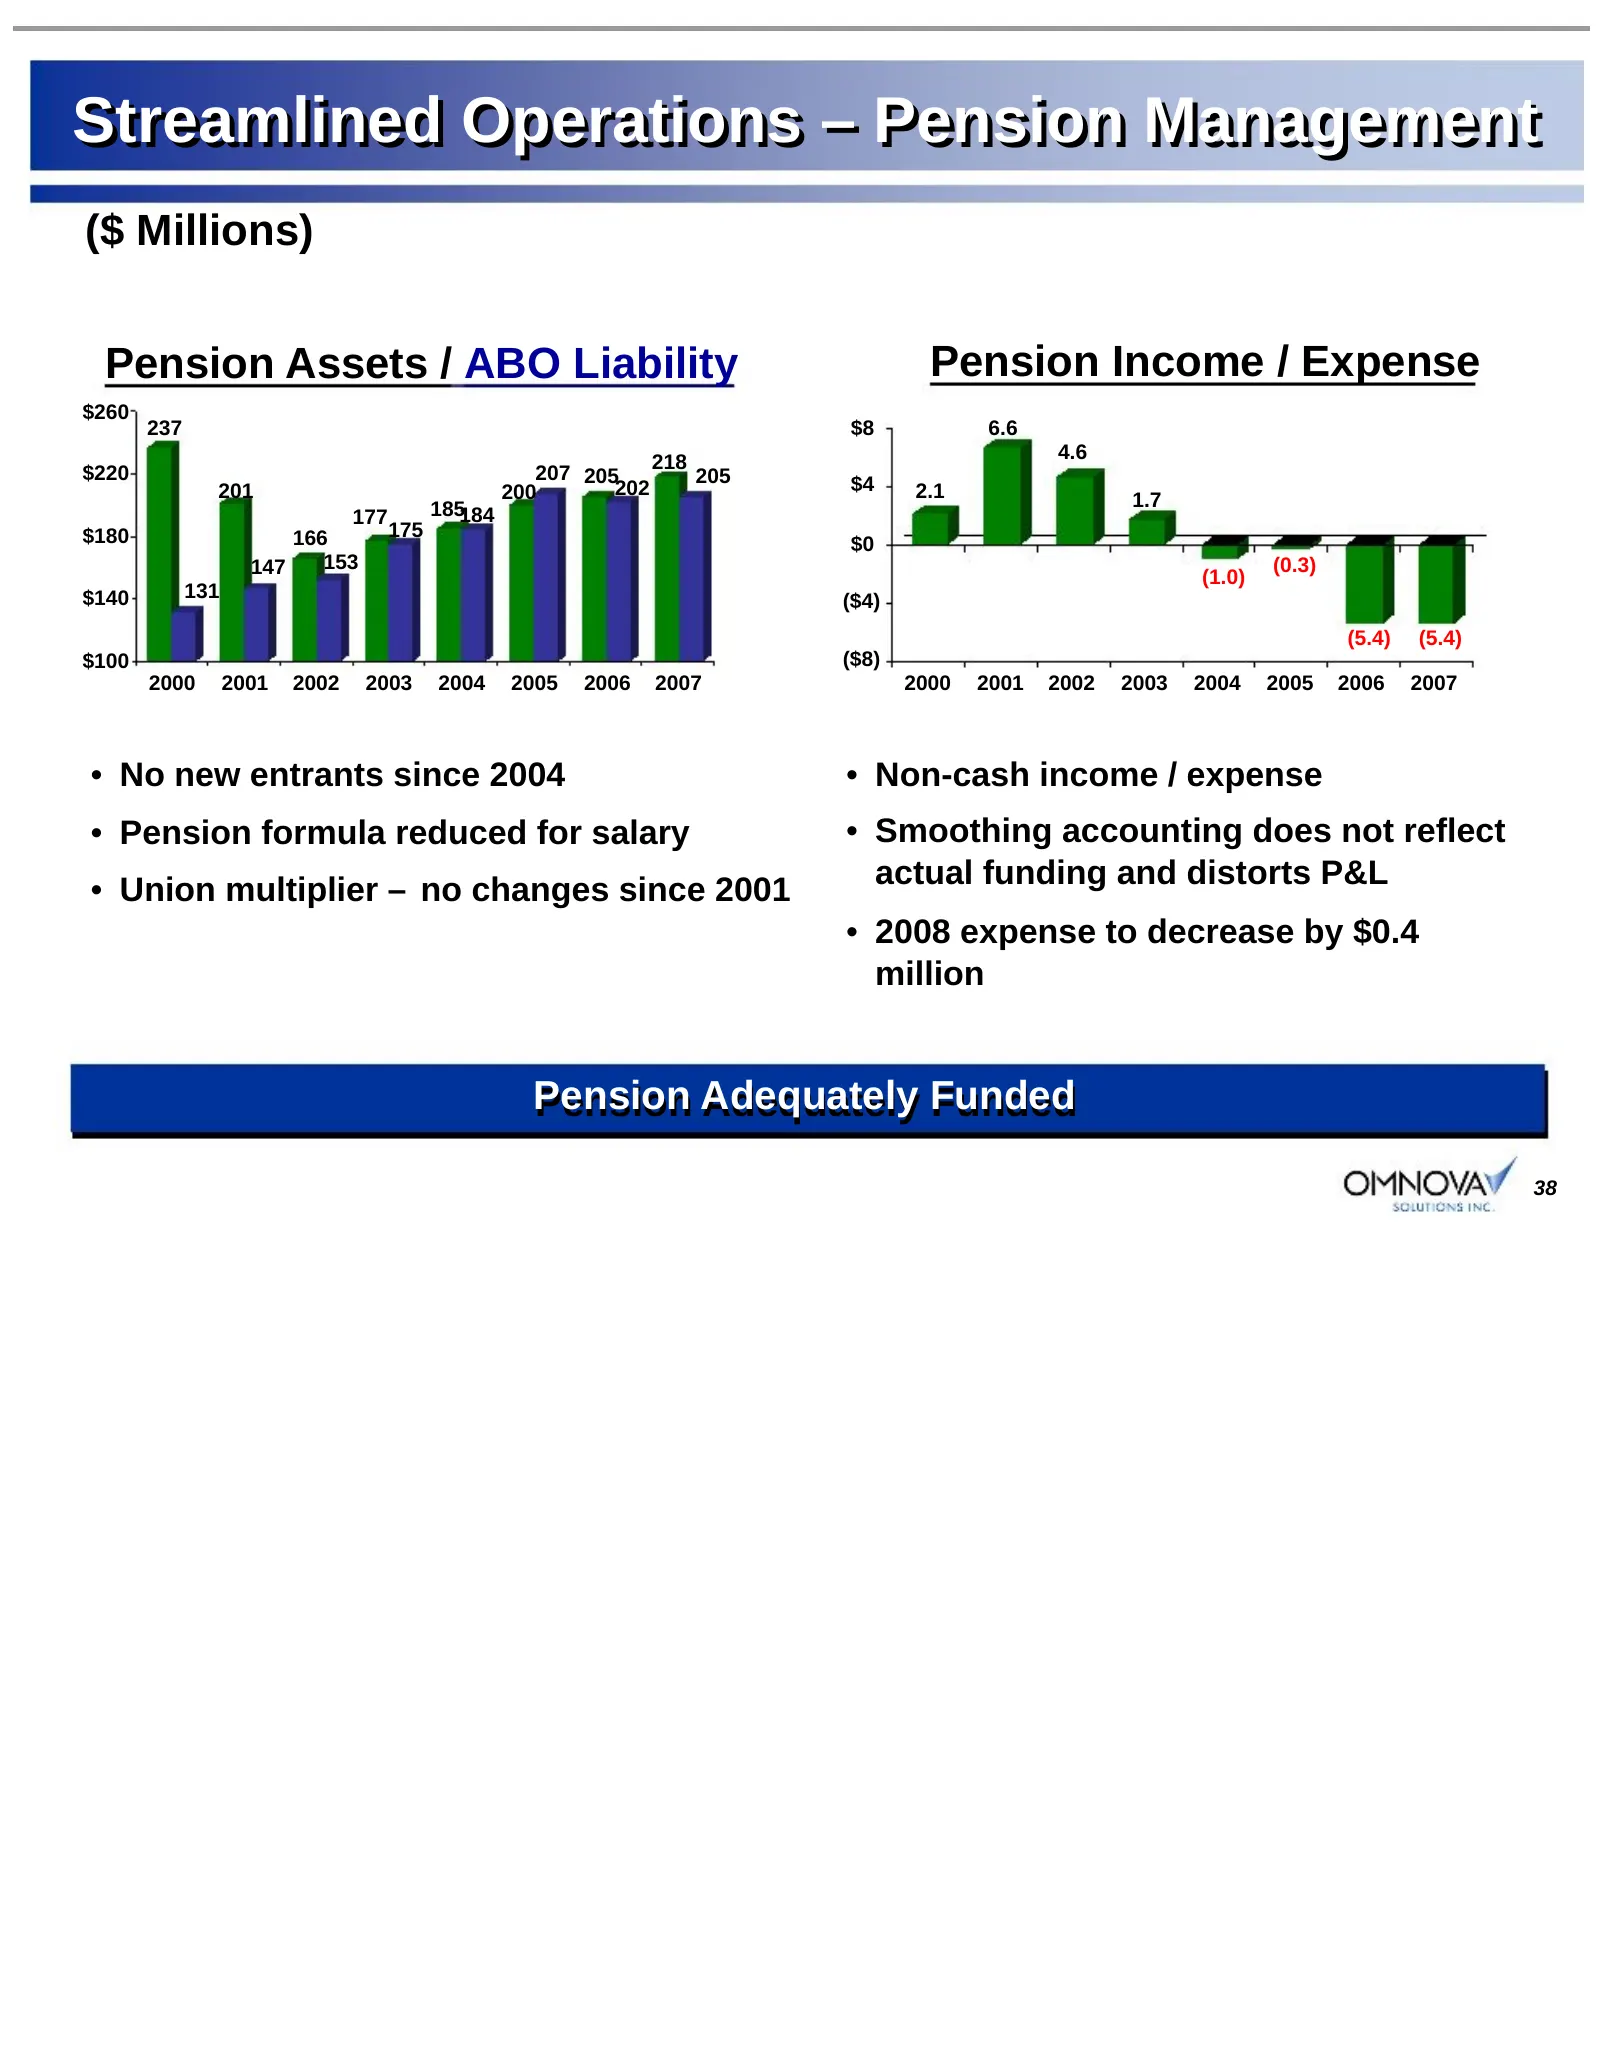
Streamlined Operations – Pension Management ($ Millions) Pension Assets / ABO Liability Pension Income / Expense $260 237 $8 6.6 218 4.6 $220 207 205 205 201 200 202 $4 2.1 185184 1.7 177 $180 166 175 $0 147 153 (0.3) (1.0) $140 131 ($4) (5.4) (5.4) $100 ($8) 2000 2001 2002 2003 2004 2005 2006 2007
Slide 39: OMNOVA Solutions Inc.
OMNOVAWY SOLUTIONS INC.
Slide 40: Appendix
Appendix 40
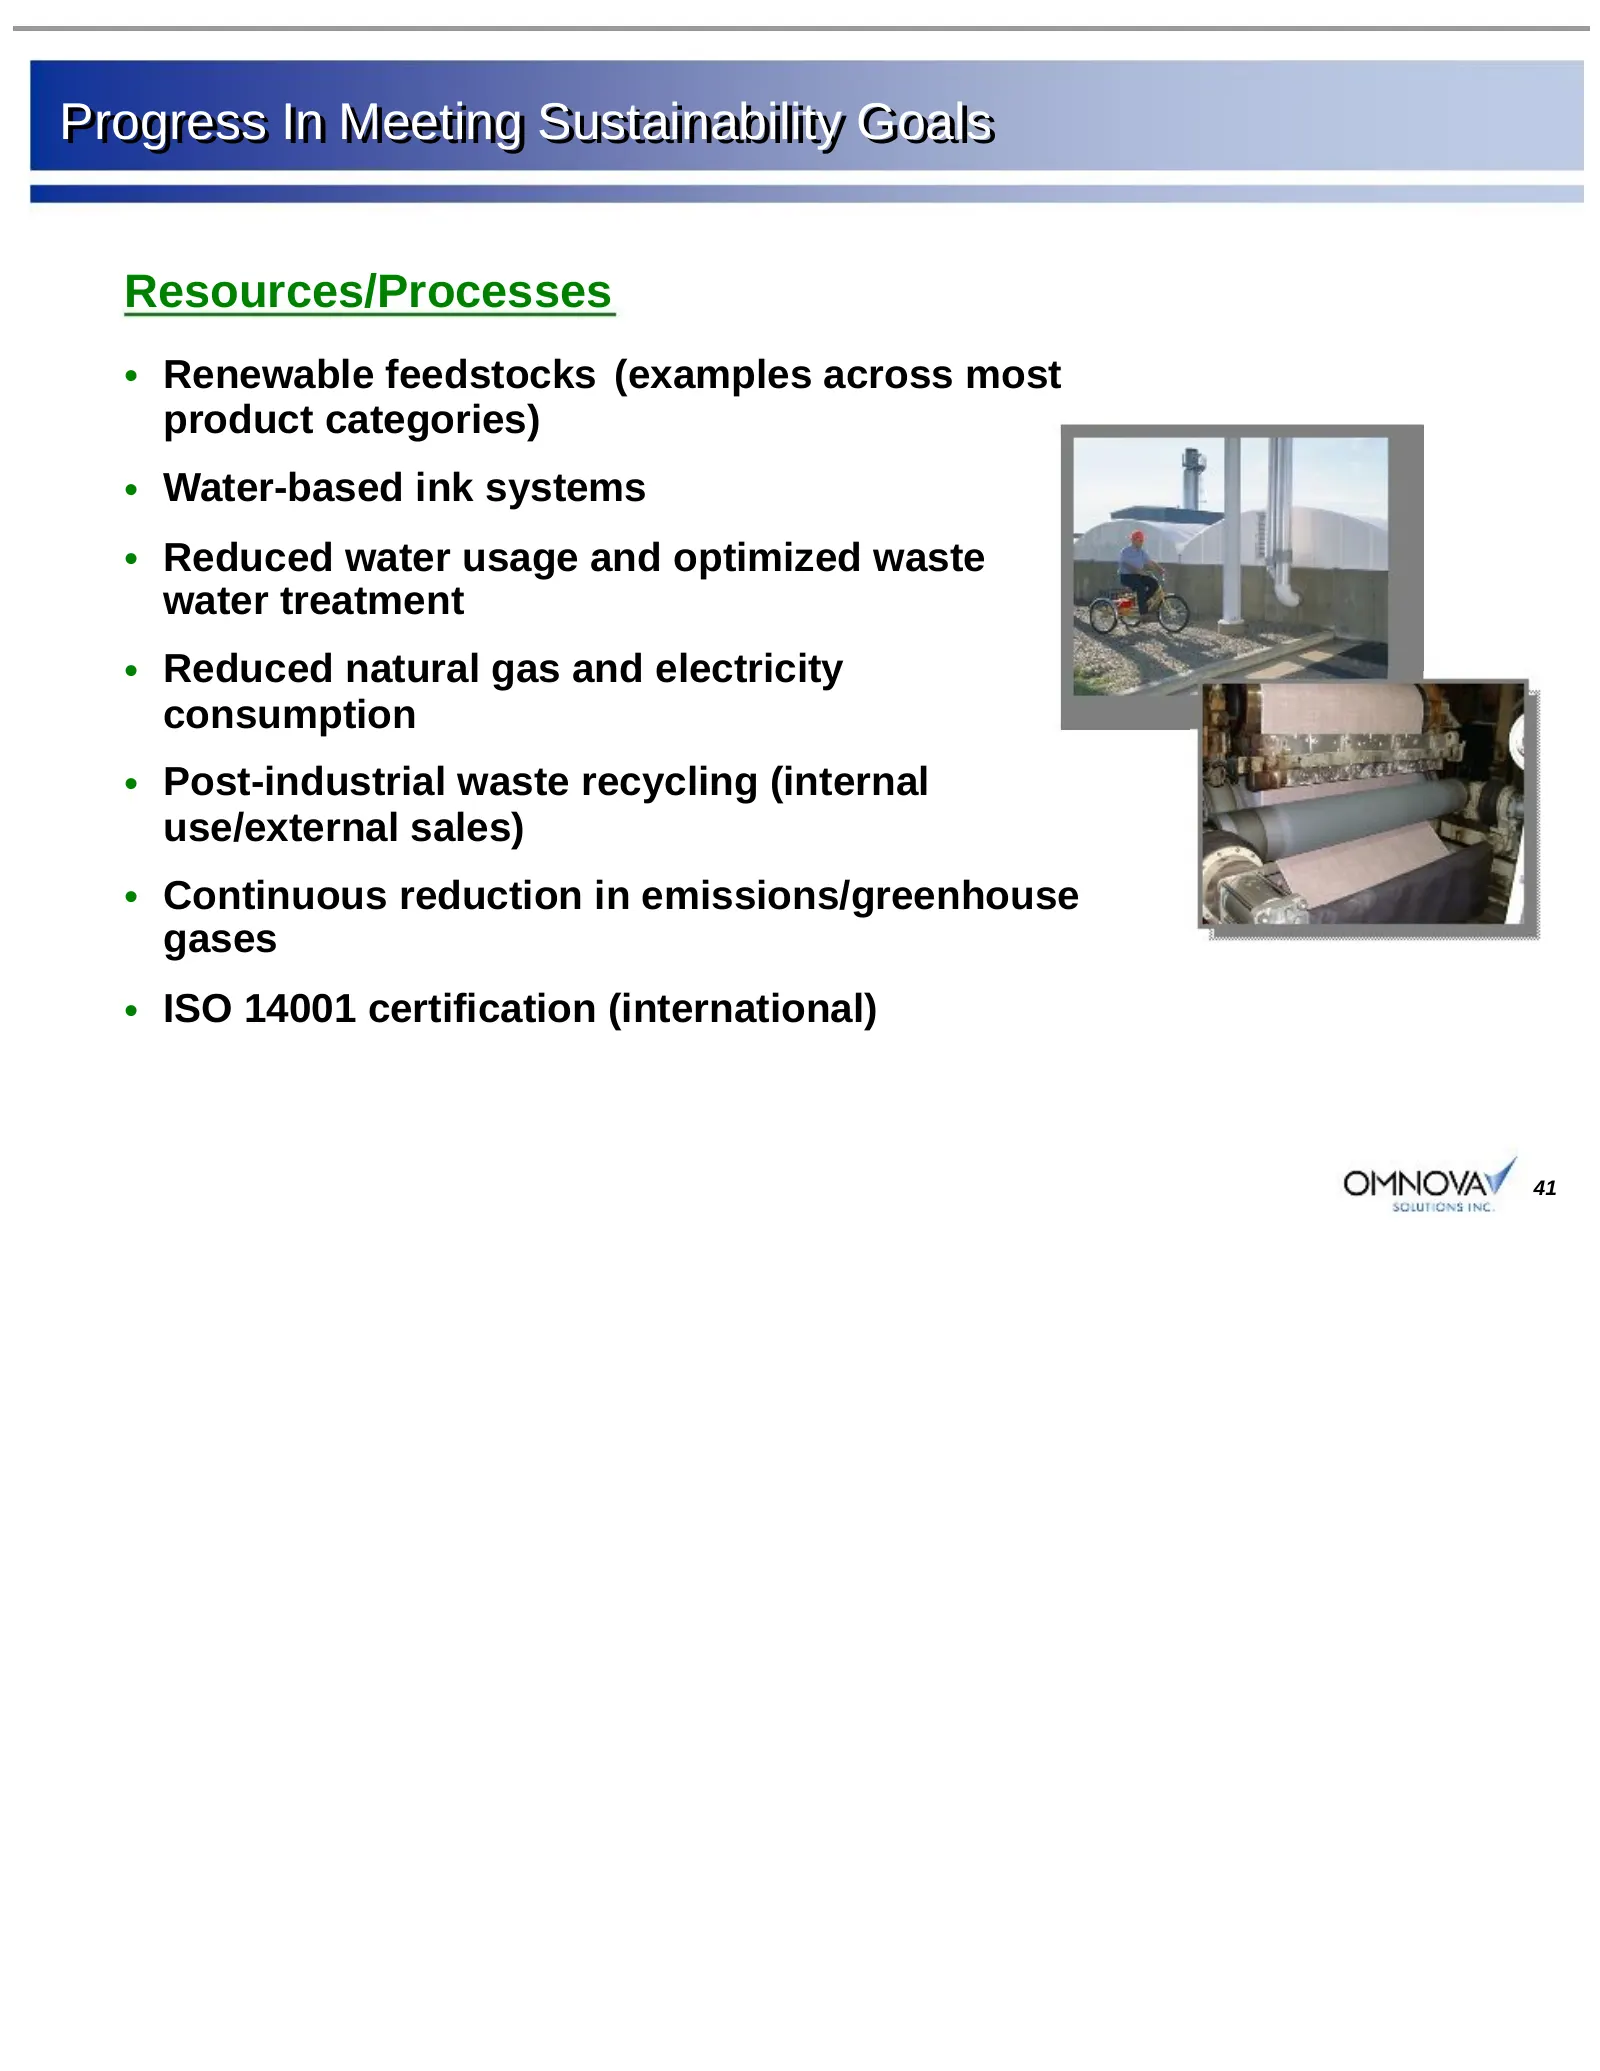
Slide 41: Progress In Meeting Sustainability Goals Resources/Processes
Progress In Meeting Sustainability Goals Resources/Processes • Renewable feedstocks (examples across most product categories) • Water-based ink systems • Reduced water usage and optimized waste water treatment • Reduced natural gas and electricity consumption • Post-industrial waste recycling (inter
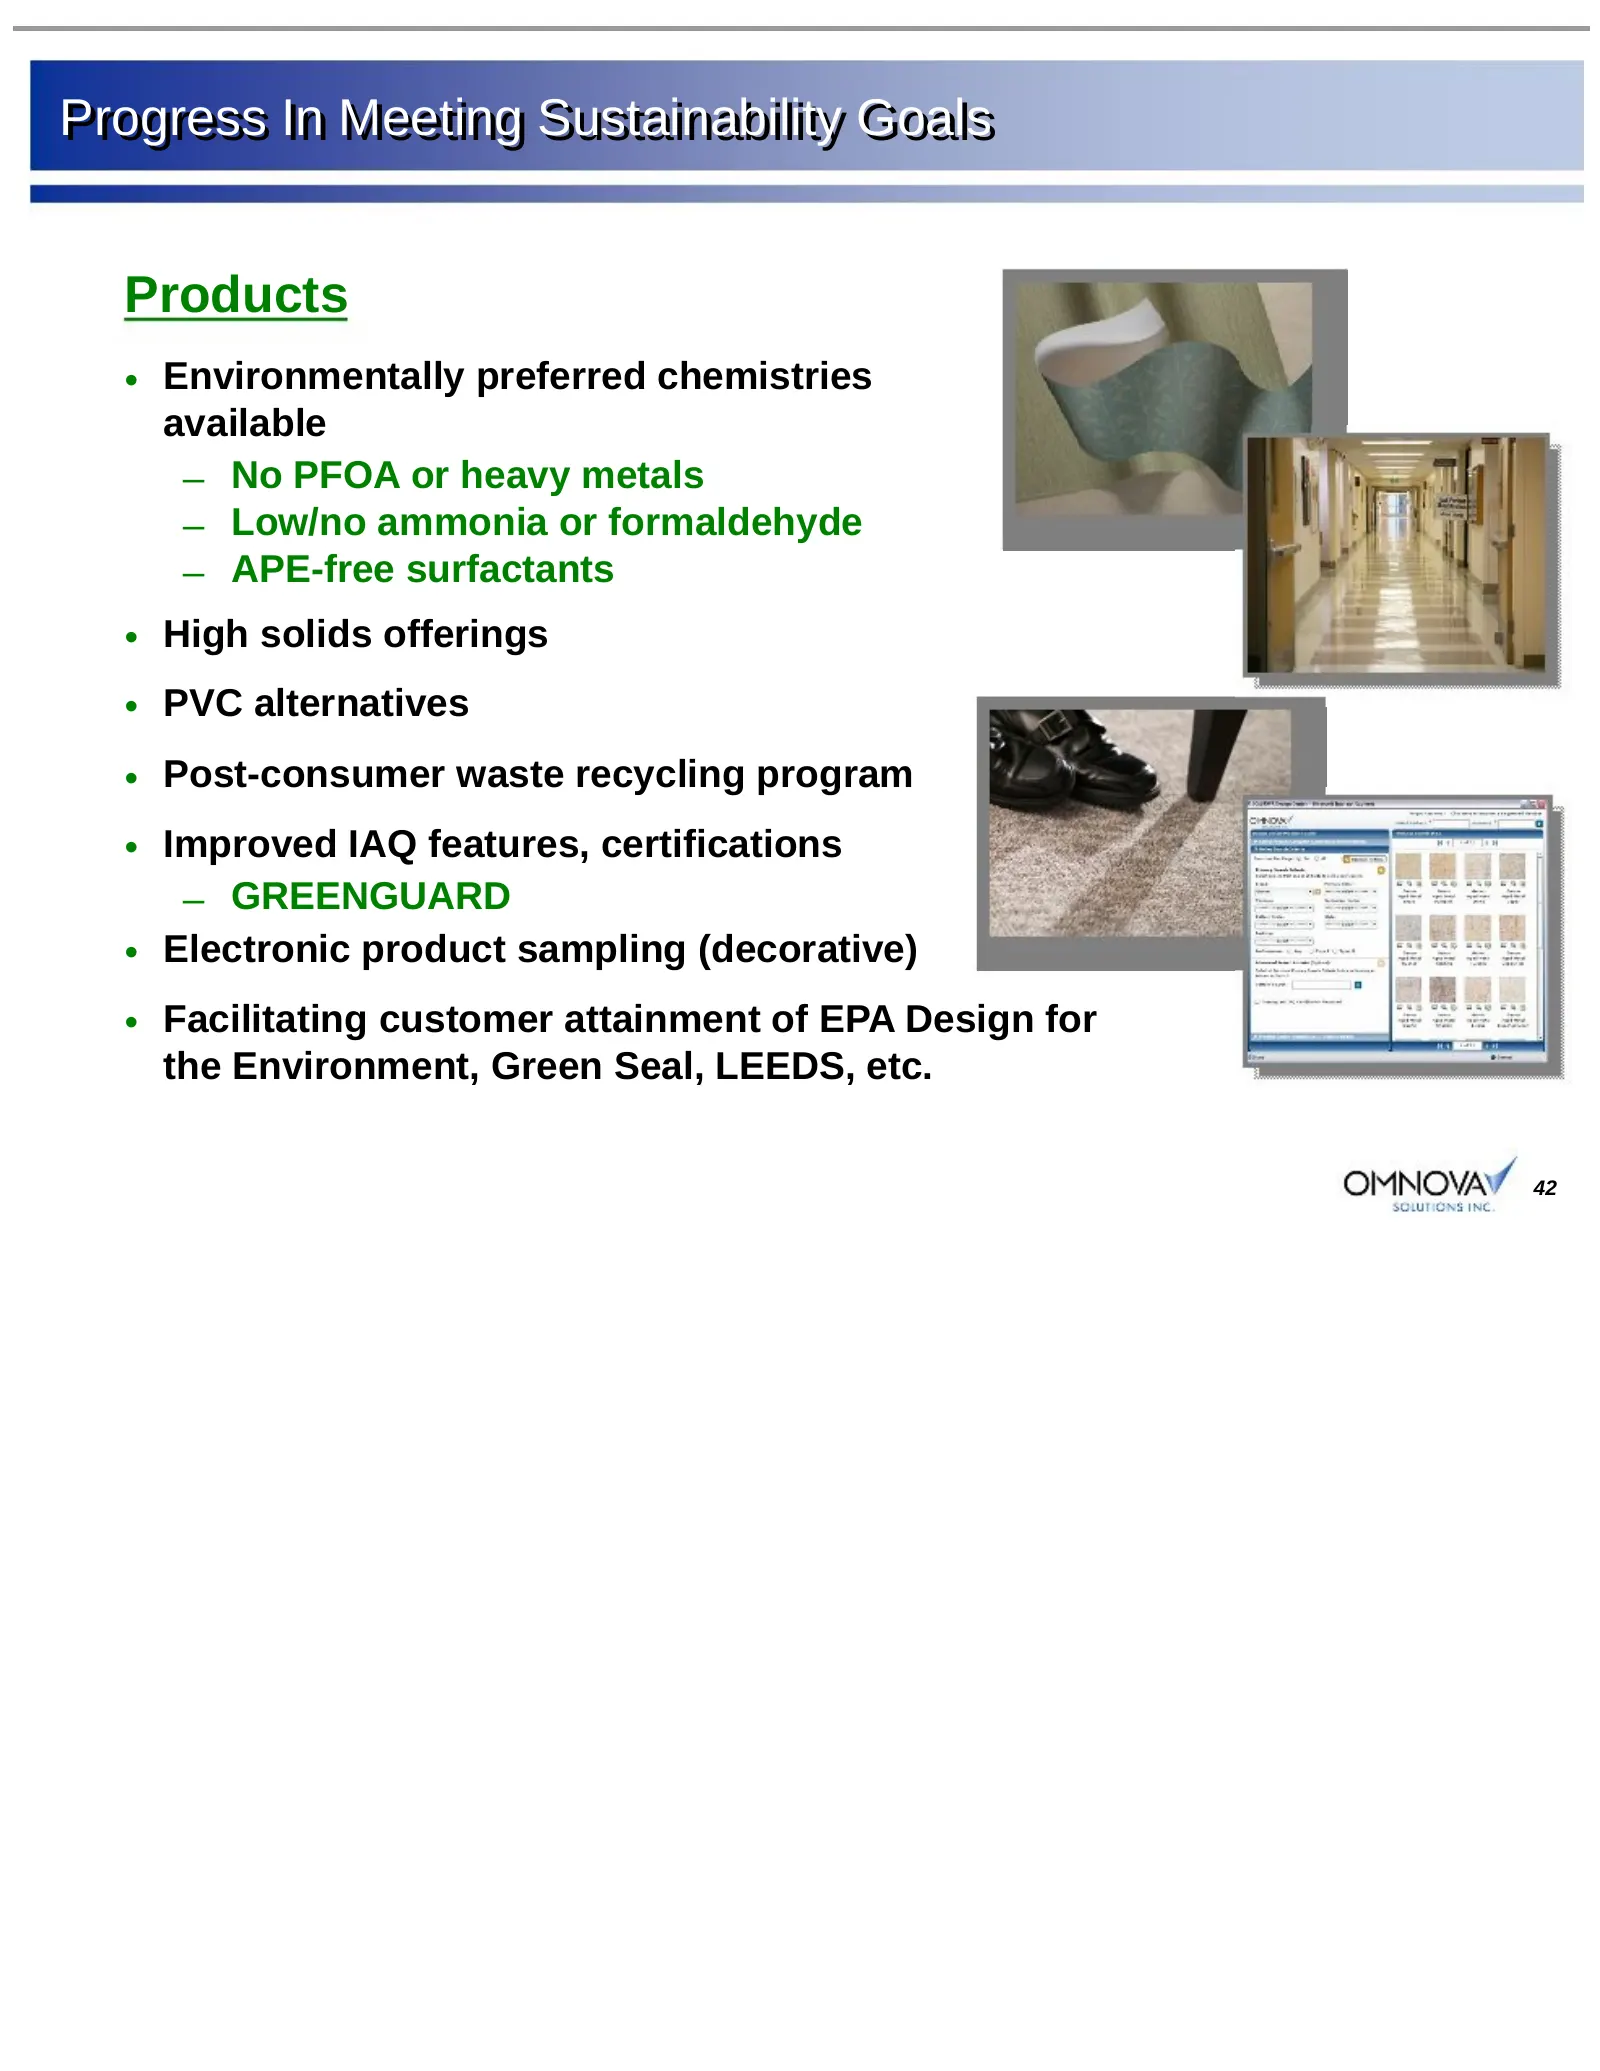
Slide 42: Progress In Meeting Sustainability Goals Products
Progress In Meeting Sustainability Goals Products • Environmentally preferred chemistries available – No PFOA or heavy metals – Low/no ammonia or formaldehyde – APE-free surfactants • High solids offerings • PVC alternatives • Post-consumer waste recycling program • Improved IAQ features, certificat
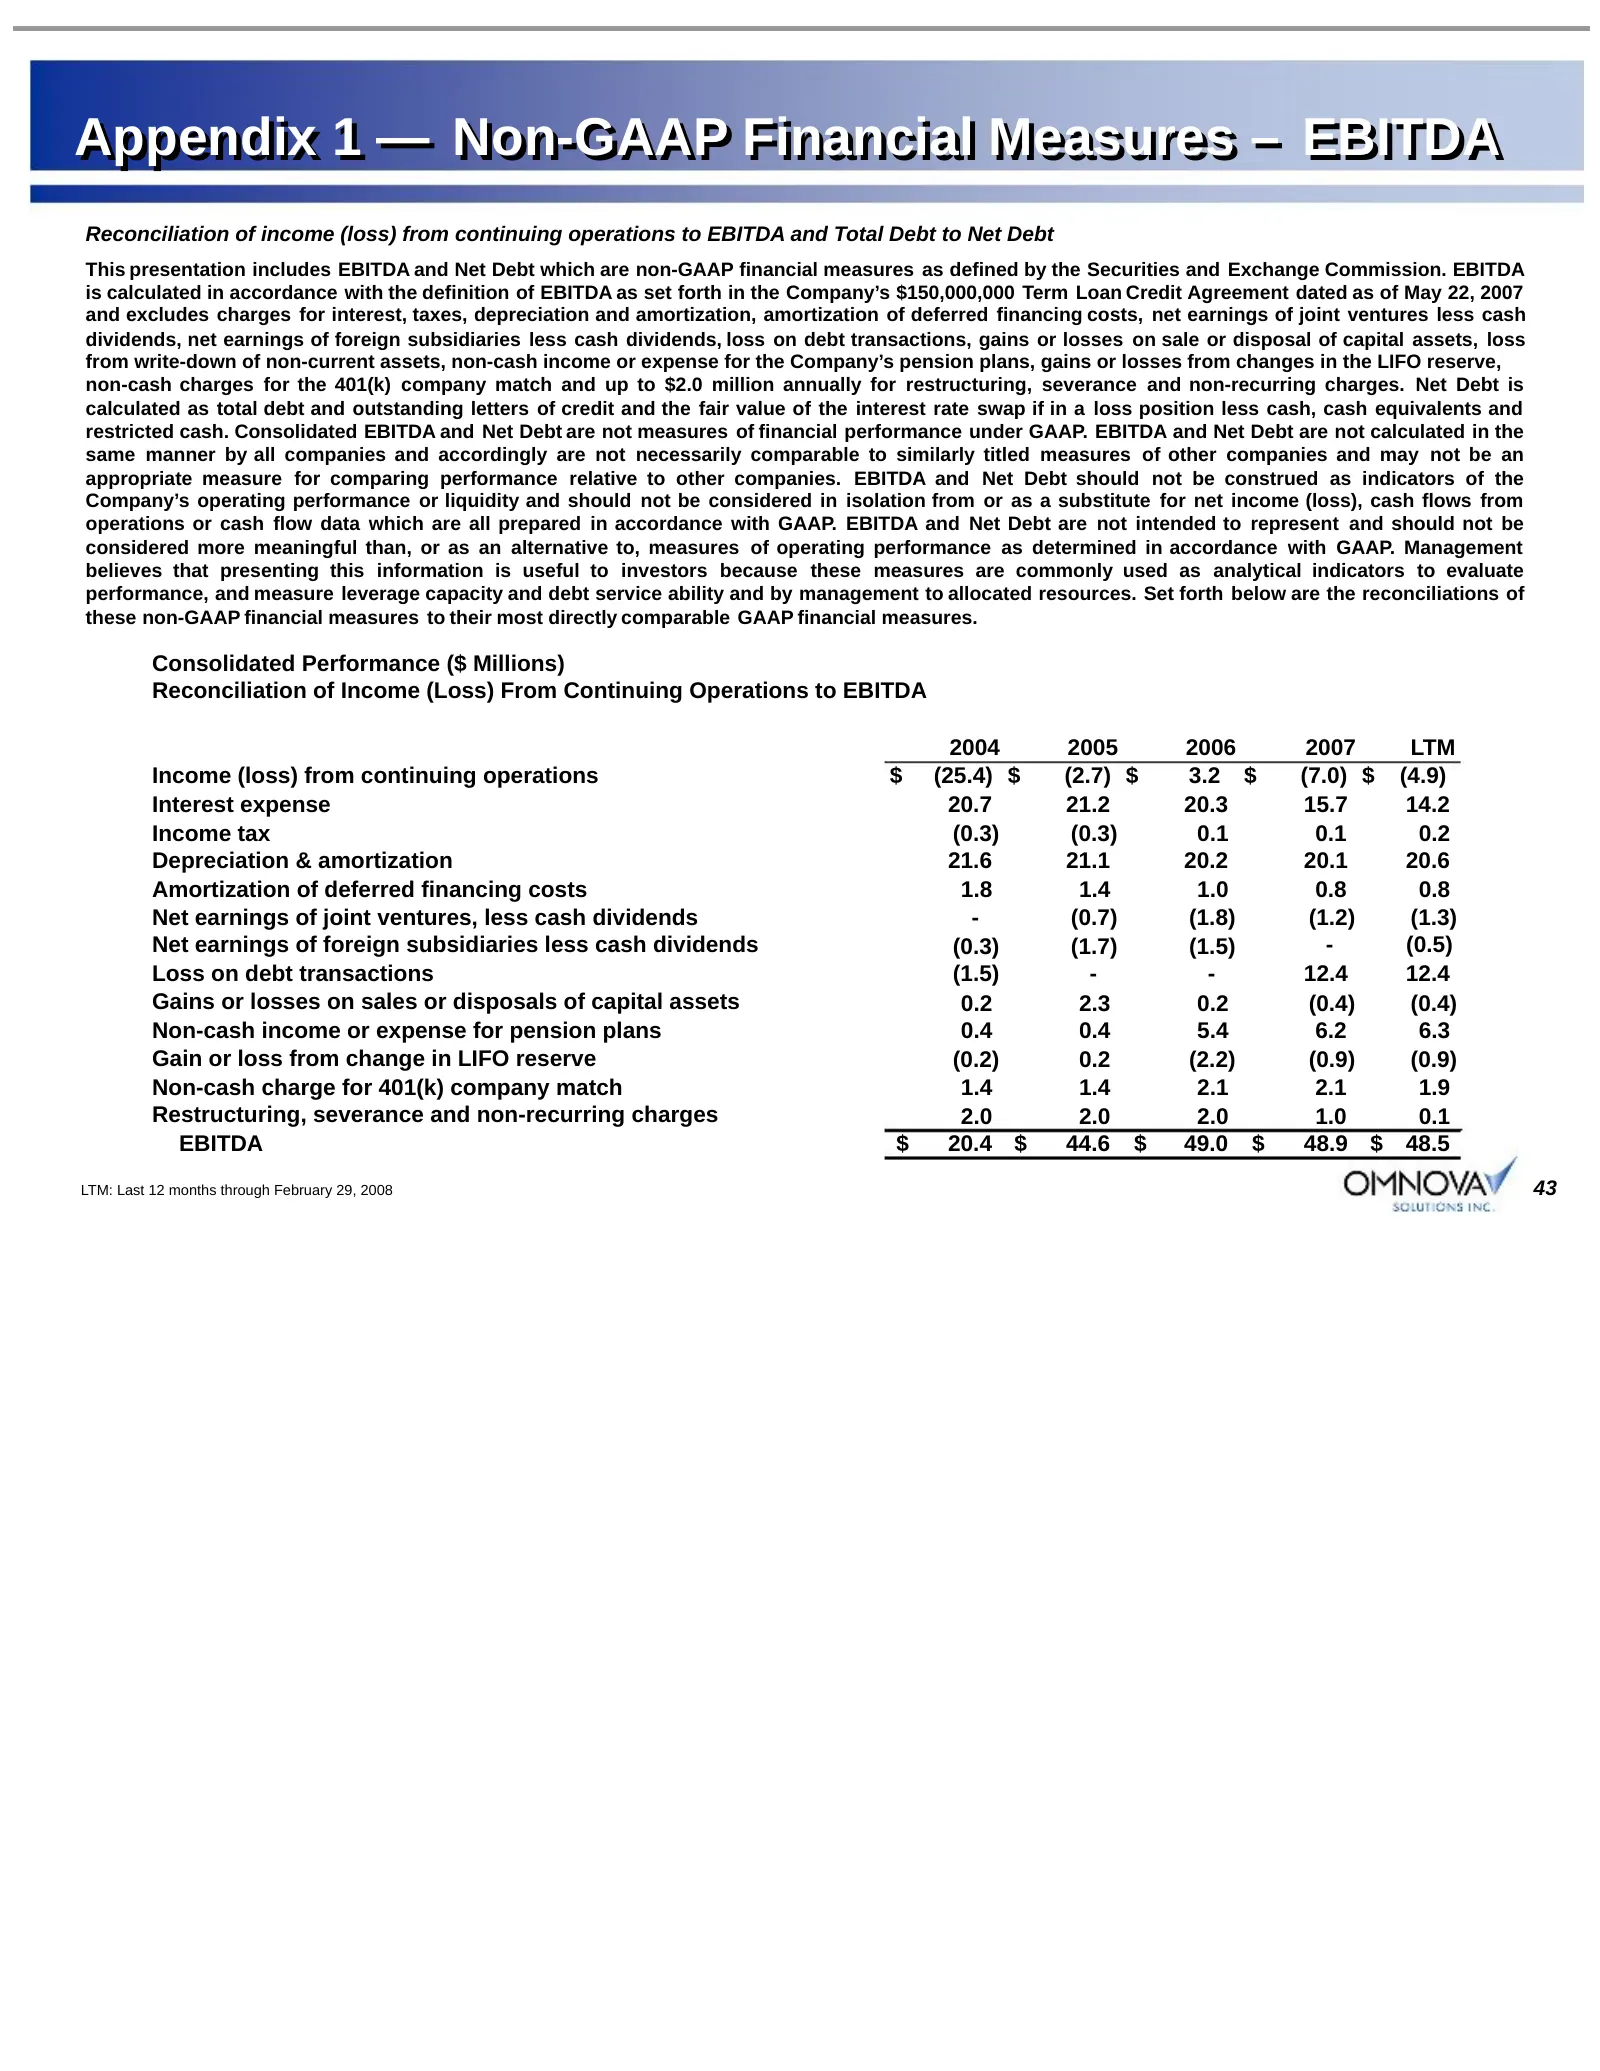
Slide 43: Appendix 1 — Non-GAAP Financial Measures – EBITDA
Appendix 1 — Non-GAAP Financial Measures – EBITDA Reconciliation of income (loss) from continuing operations to EBITDA and Total Debt to Net Debt This presentation includes EBITDA and Net Debt which are non-GAAP financial measures as defined by the Securities and Exchange Commission. EBITDA is calcu
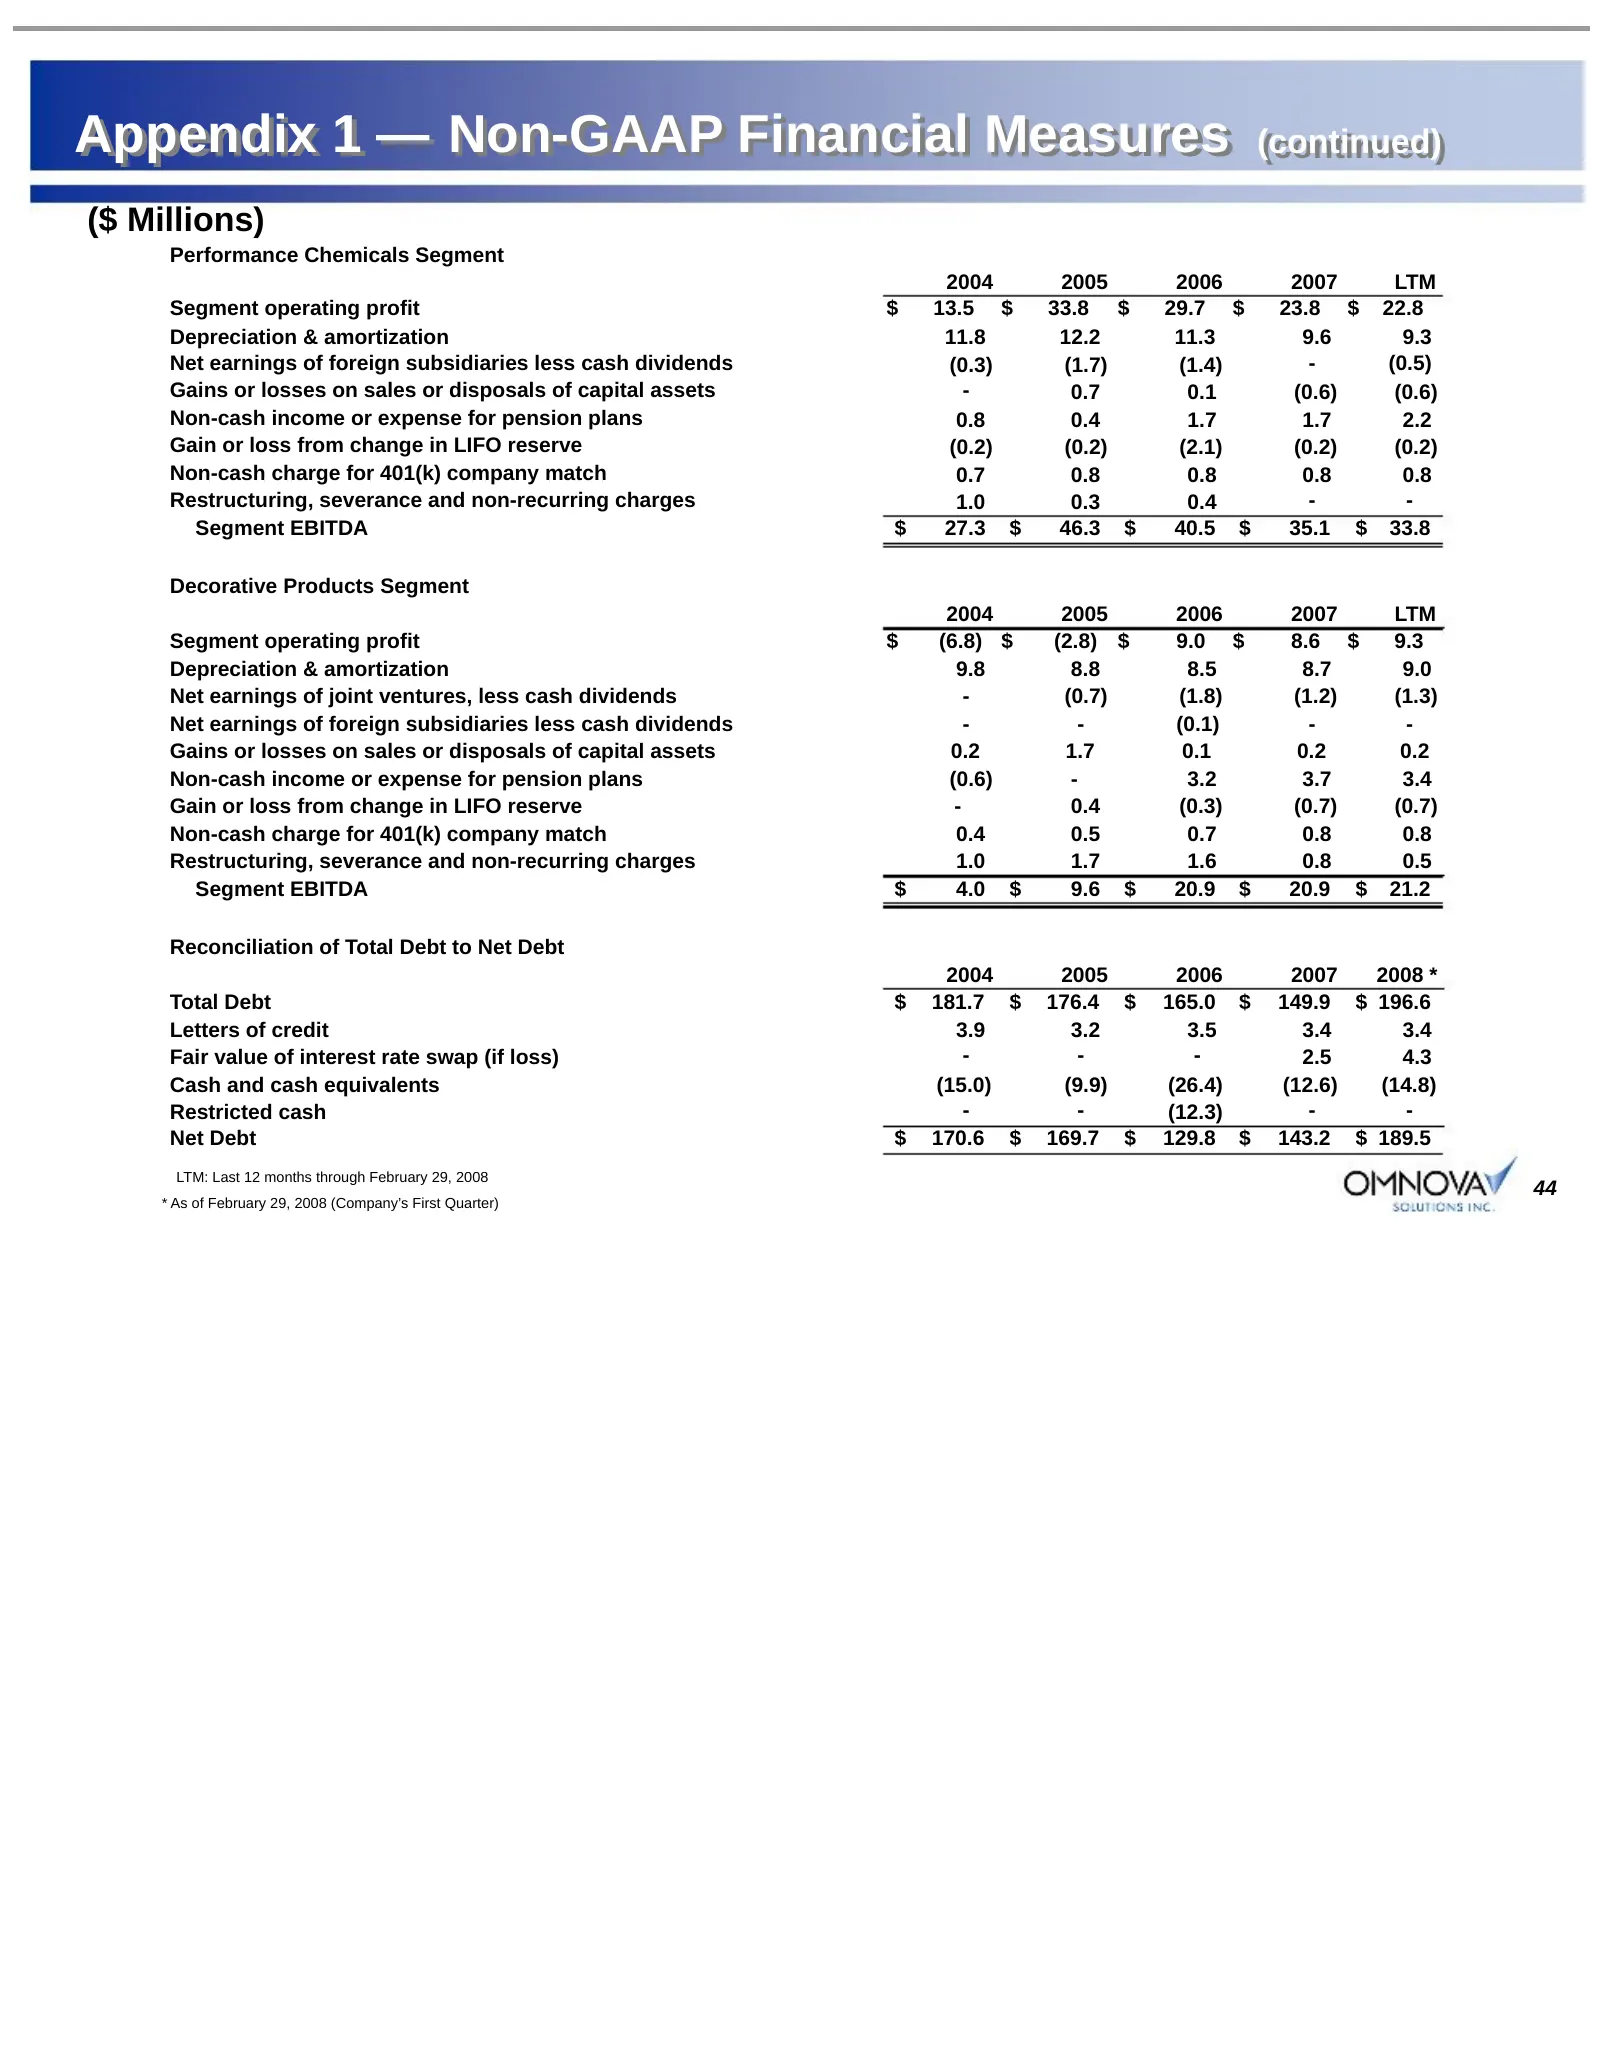
Slide 44: Appendix 1 — Non-GAAP Financial Measures (continued)
Appendix 1 — Non-GAAP Financial Measures (continued) (continued) ($ Millions) Performance Chemicals Segment 2004 2005 2006 2007 LTM Segment operating profit $ 13.5 $ 33.8 $ 29.7 $ 23.8 $ 22.8 Depreciation & amortization 11.8 12.2 11.3 9.6 9.3 Net earnings of foreign subsidiaries less cash dividends
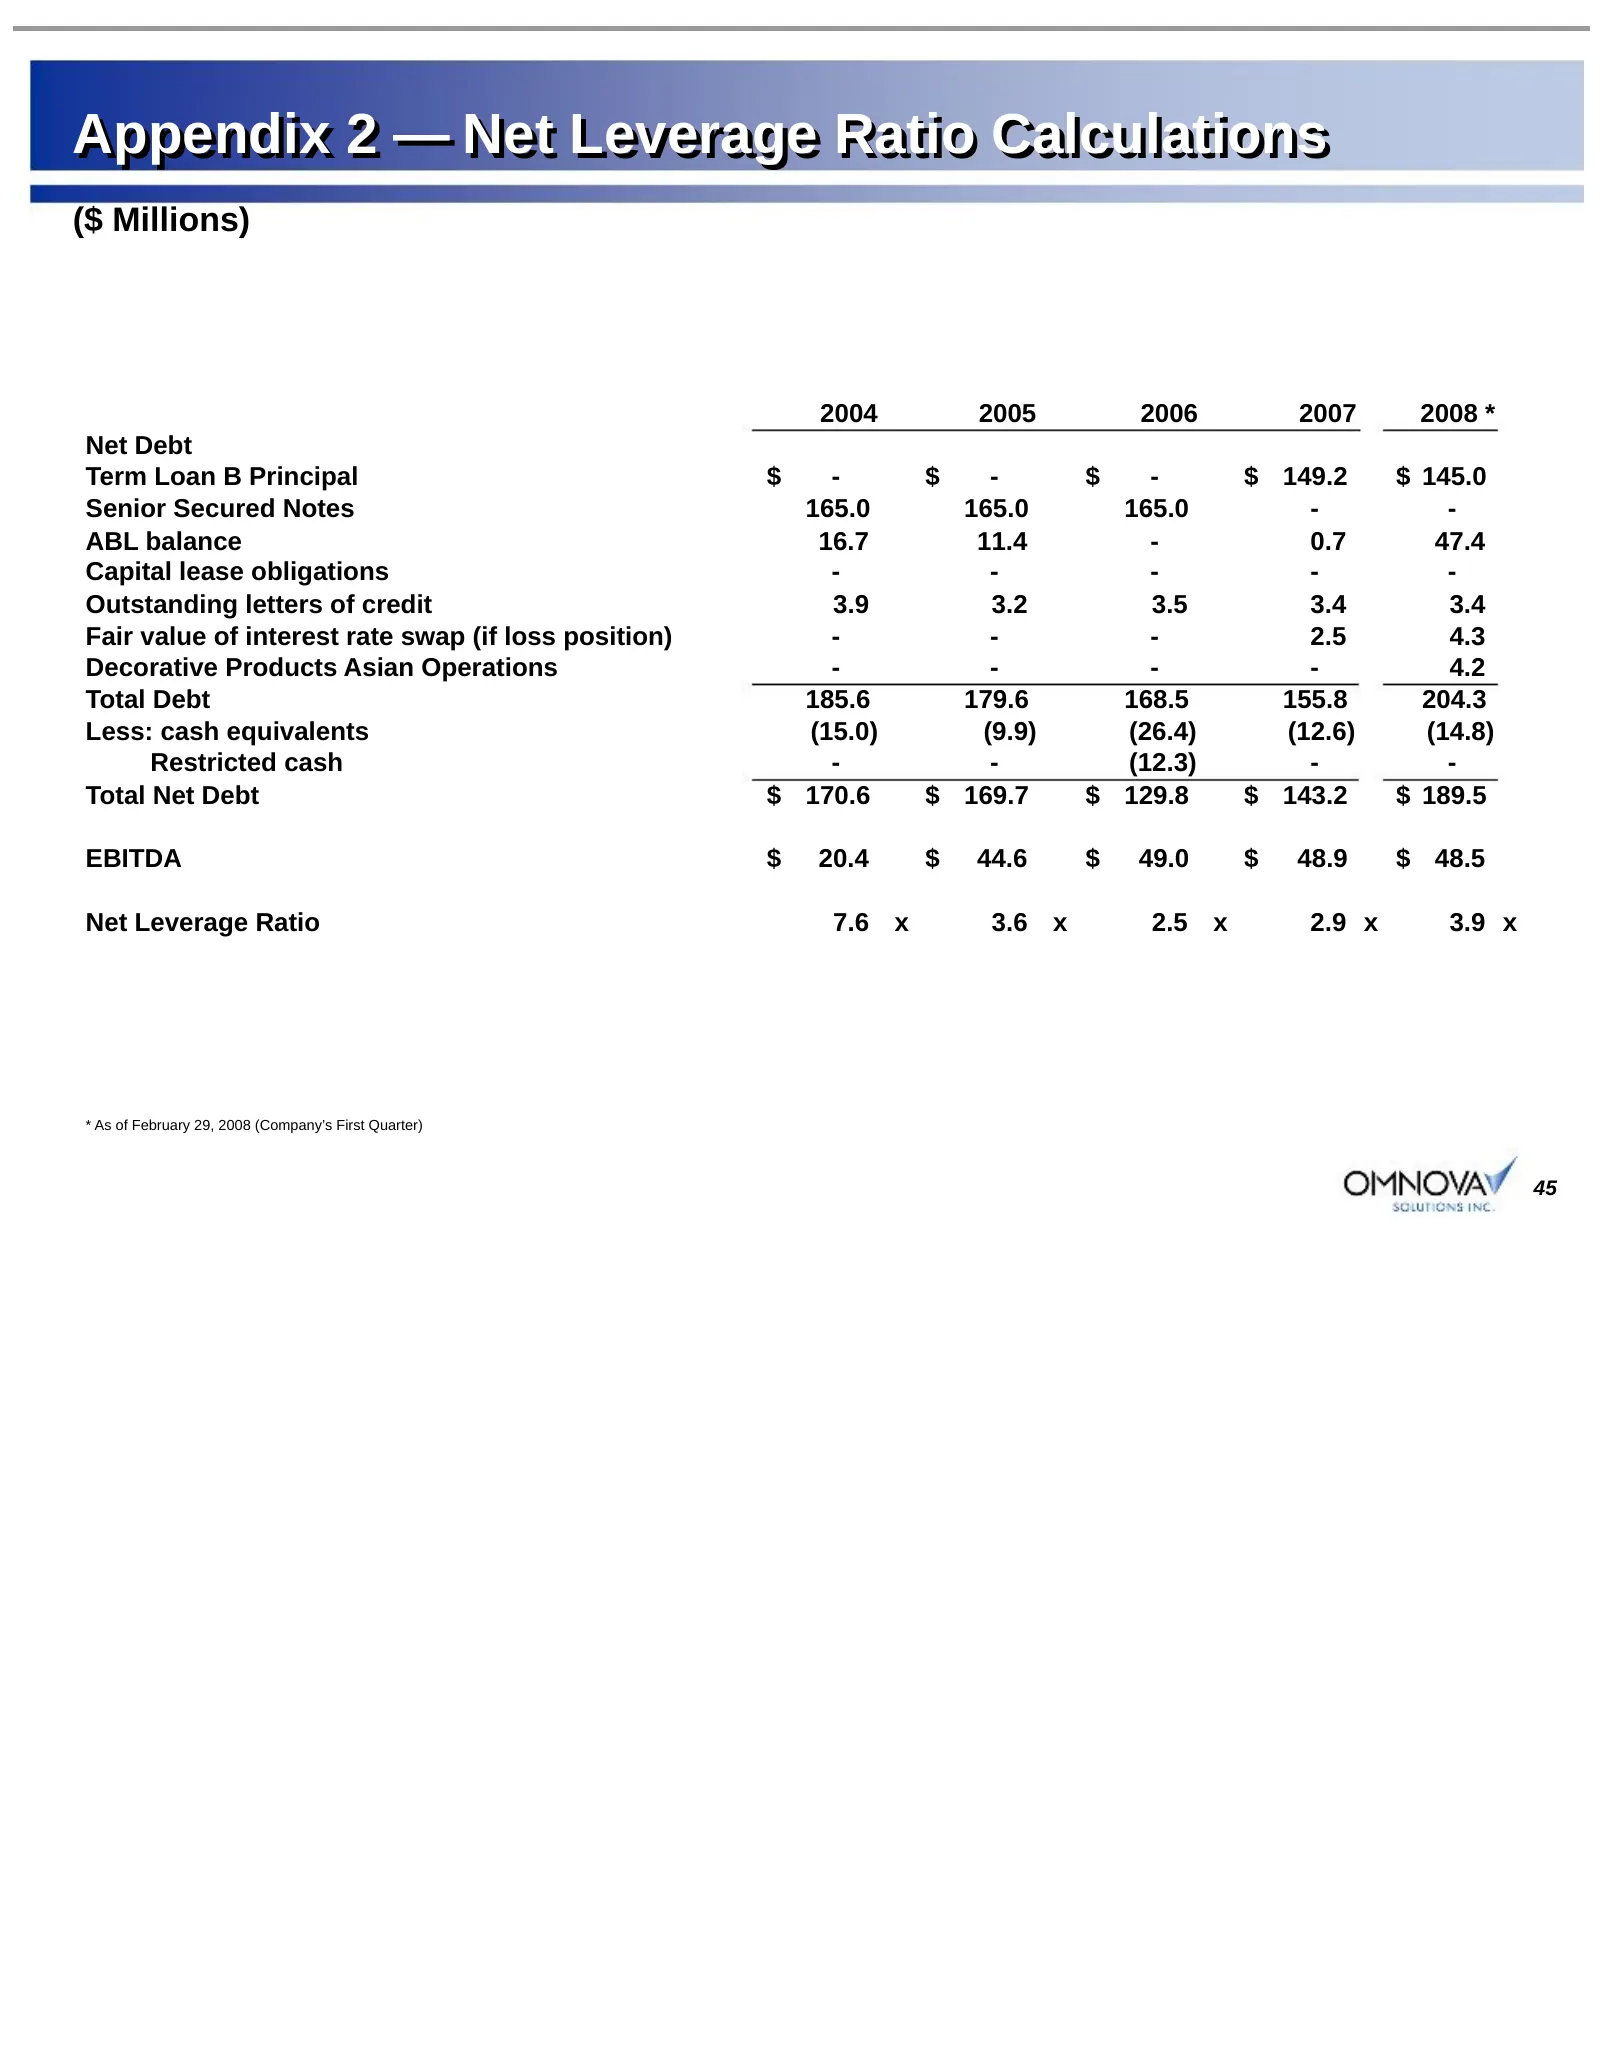
Slide 45: Appendix 2 — Net Leverage Ratio Calculations
Appendix 2 — Net Leverage Ratio Calculations ($ Millions) 2004 2005 2006 2007 2008 * Net Debt Term Loan B Principal $ - $ - $ - $ 149.2 $ 145.0 Senior Secured Notes 165.0 165.0 165.0 - - ABL balance 16.7 11.4 - 0.7 47.4 Capital lease obligations - - - - - Outstanding letters of credit 3.9 3.2 3.5 3.
Source: SEC EDGAR · 8-K filed May 15, 2008
More decks from OMNOVA Solutions Inc
 Merger or Acquisition (July 2019)24 slides · Jul 3, 2019
 Q1 2019 Earnings Presentation32 slides · Mar 27, 2019
 Investor Presentation (February 2019)34 slides · Feb 22, 2019
 Q3 2018 Earnings Presentation32 slides · Sep 26, 2018
 Investor Presentation (July 2018)32 slides · Jul 20, 2018
 Investor Presentation (April 2018)32 slides · Apr 11, 2018